
Here are the latest real estate market statistics from Macdonald Realty on the Greater Vancouver listings and sales in November 2022. Find all the infographics by visiting the Facebook Album.
While typically a quiet month of market activity based on seasonal patterns, November home sale and listing totals lagged below the region’s long-term averages.
The Real Estate Board of Greater Vancouver (REBGV) reports that residential home sales in the region totalled 1,614 in November 2022, a 52.9 per cent decrease from the 3,428 sales recorded in November 2021, and a 15.2 per cent decrease from the 1,903 homes sold in October 2022.
Last month’s sales were 36.9 per cent below the 10-year November sales average.
“With the most recent core inflation metrics showing a stubborn reluctance to respond significantly to the furious pace of rate increases, the Bank of Canada may choose to act more forcefully to bring inflation back toward target levels.” Andrew Lis, REBGV’s director, economics and data analytics said. “While it’s always difficult to predict what the bank will do with certainty, this persistent inflationary backdrop sets up the December 7* rate announcement to be yet another increase, making holiday-season home purchases something many people may end up foregoing this year.”
There were 3,055 detached, attached and apartment properties newly listed for sale on the Multiple Listing Service® (MLS®) in Metro Vancouver in November 2022. This represents a 22.9 per cent decrease compared to the 3,964 homes listed in November 2021 and a 24.2 per cent decrease compared to October 2022 when sellers listed 4,033 homes.
The total number of homes currently listed for sale on the MLS® system in Metro Vancouver is 9,179, a 28.5 per cent increase compared to November 2021 (7,144) and a 6.8 per cent decrease compared to October 2022 (9,852).
*Areas covered by the Real Estate Board of Greater Vancouver include Burnaby, Coquitlam, Maple Ridge, New Westminster, North Vancouver, Pitt Meadows, Port Coquitlam, Port Moody, Richmond, South Delta, Squamish, Sunshine Coast, Vancouver, West Vancouver, and Whistler. Check out the infographics of Squamish, Sunshine Coast and Whistler, HERE.
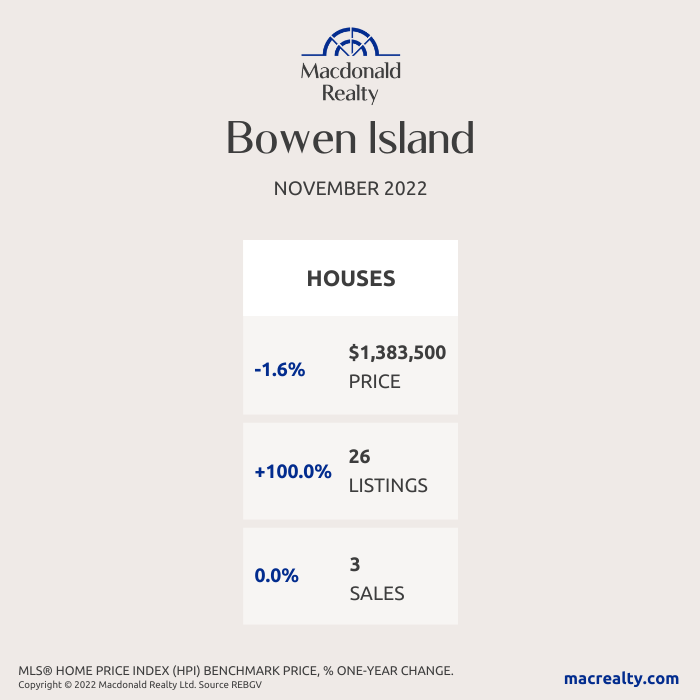
Bowen Island
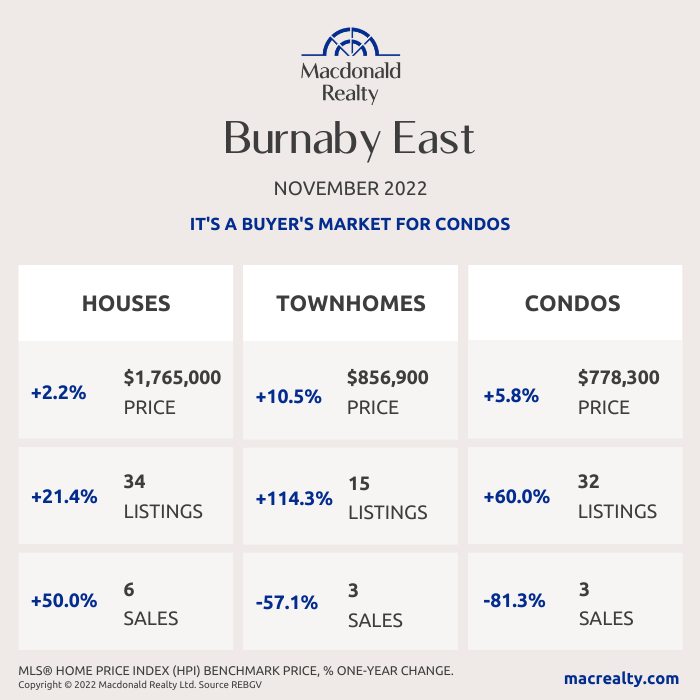
Burnaby East
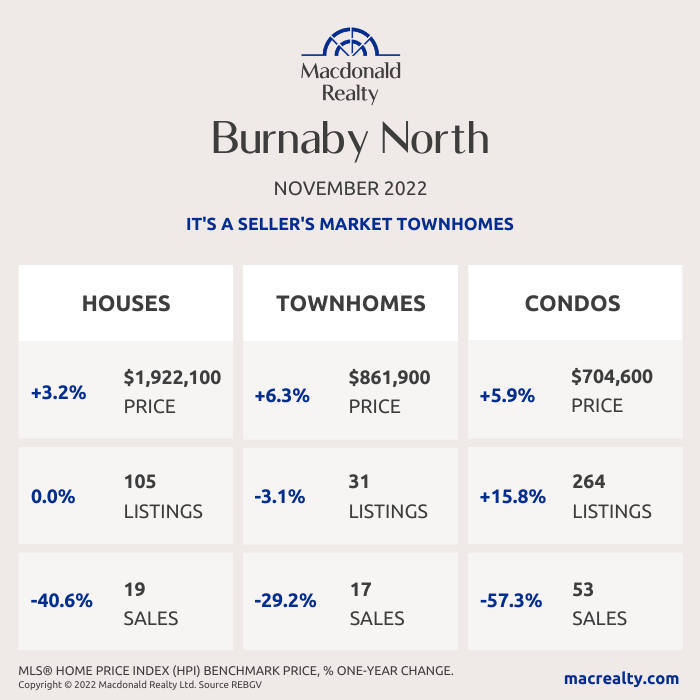
Burnaby North
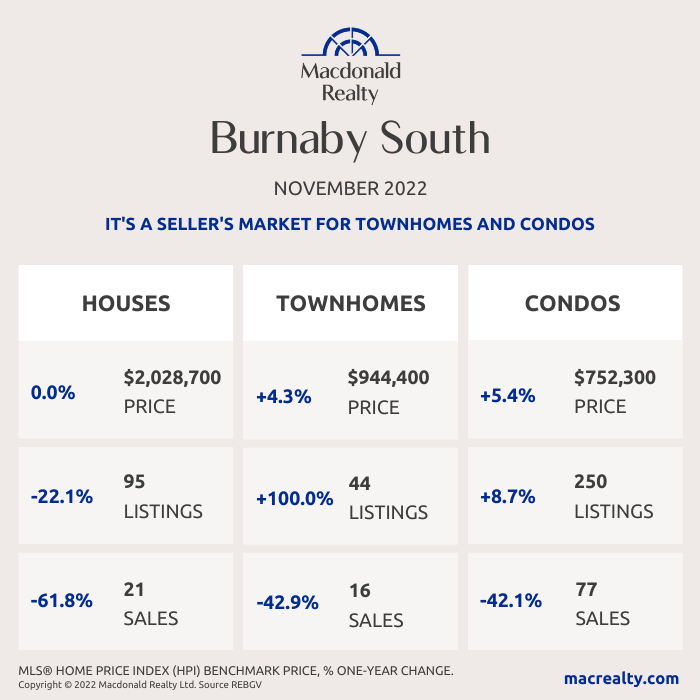
Burnaby South
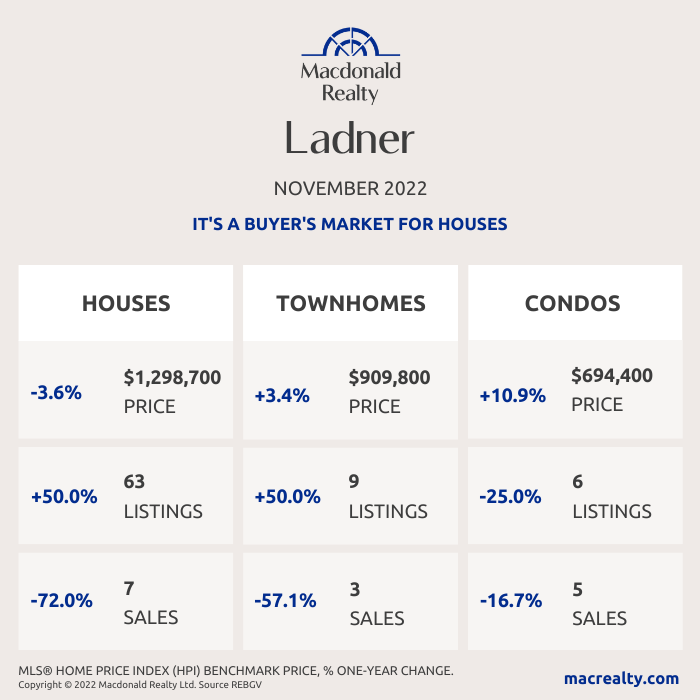
Ladner
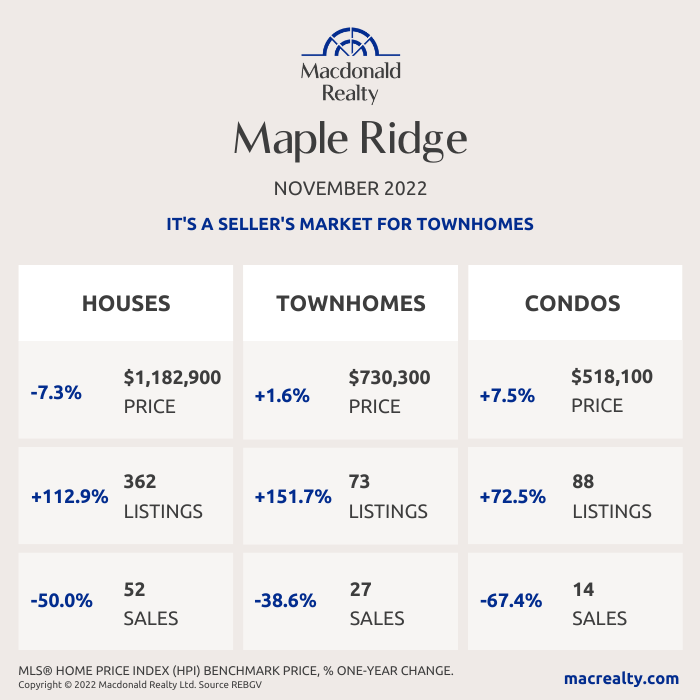
Maple Ridge
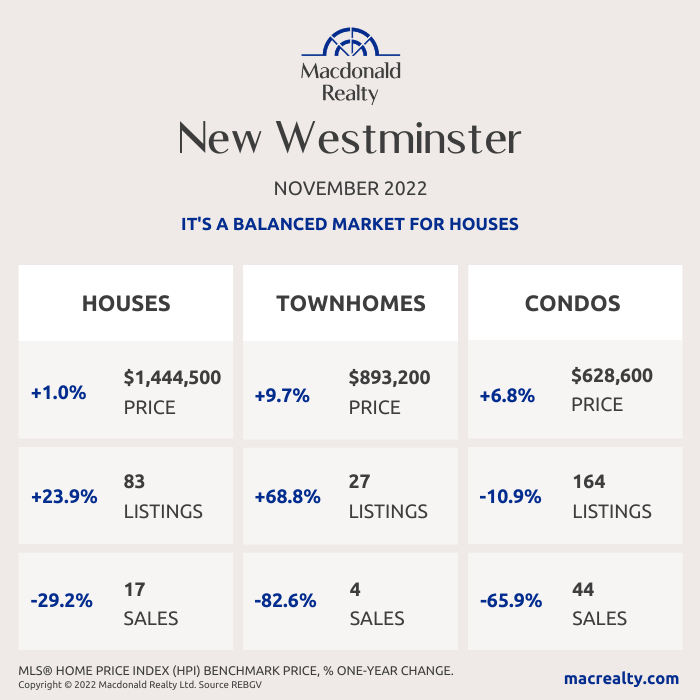
New Westminster
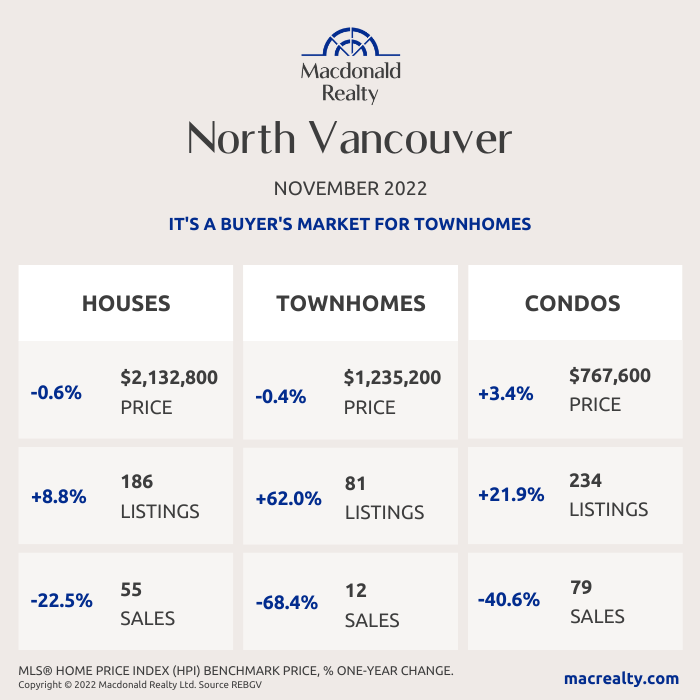
North Vancouver
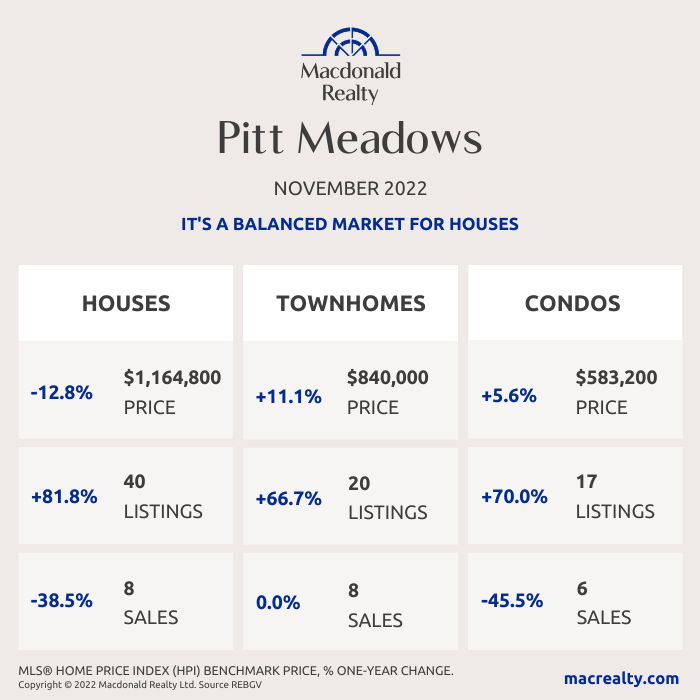
Pitt Meadows
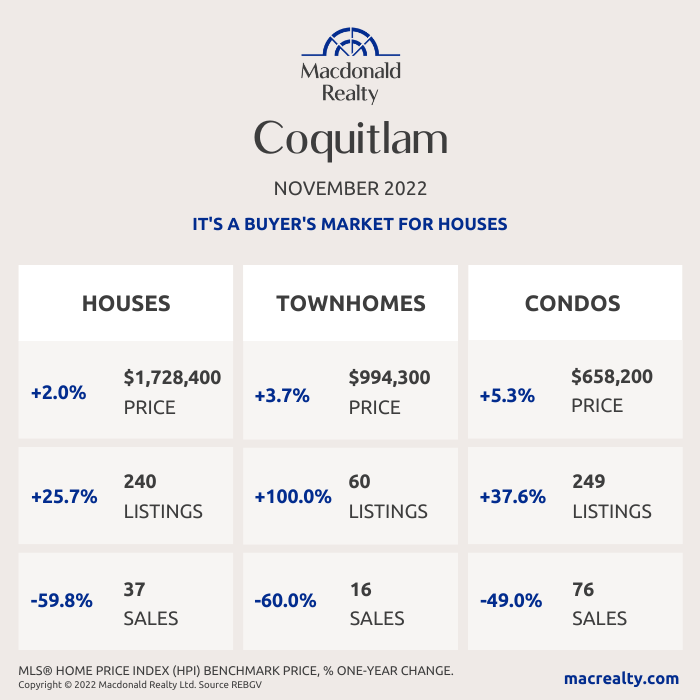
Coquitlam
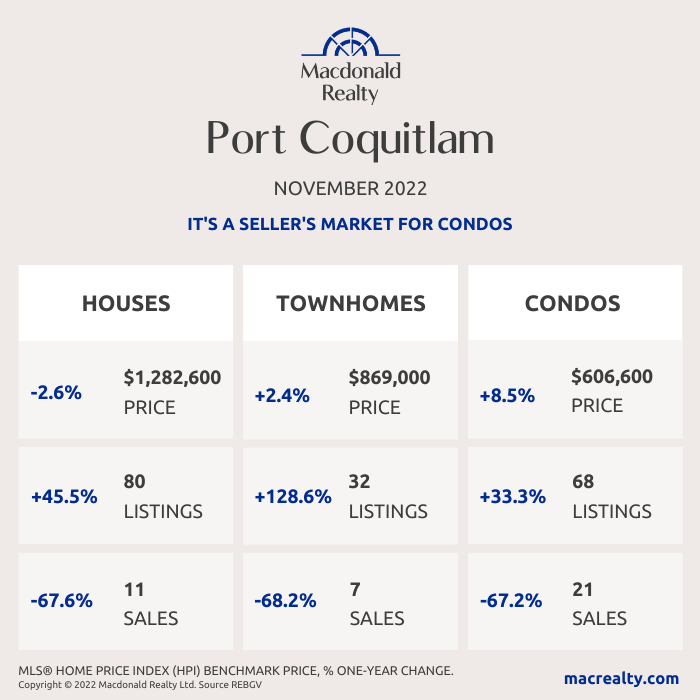
Port Coquitlam
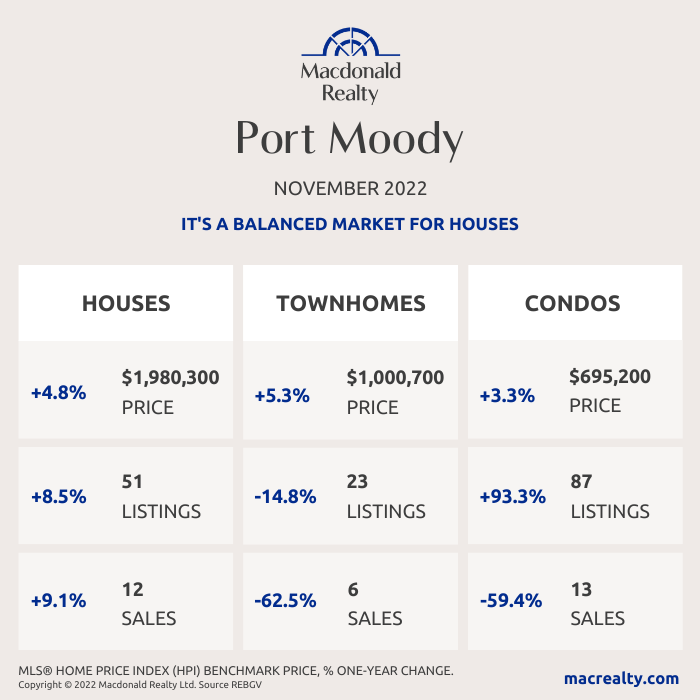
Port Moody
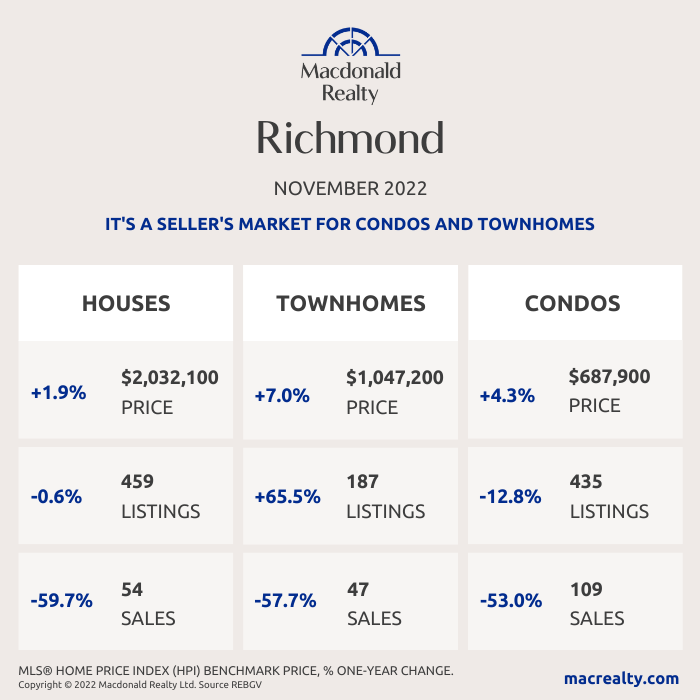
Richmond
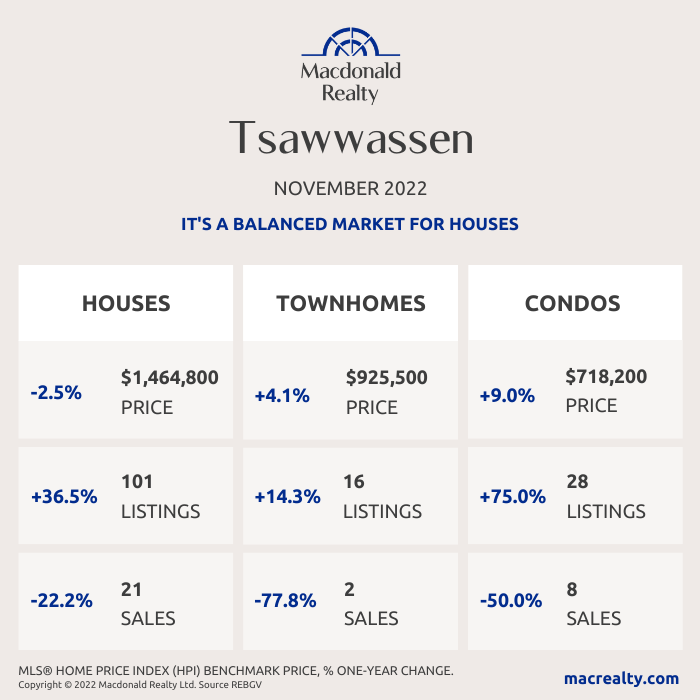
Tsawwassen
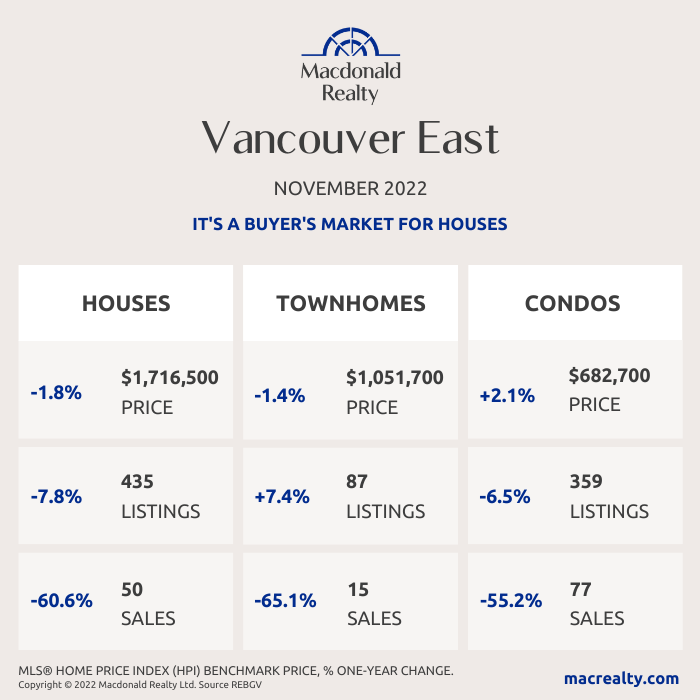
Vancouver East
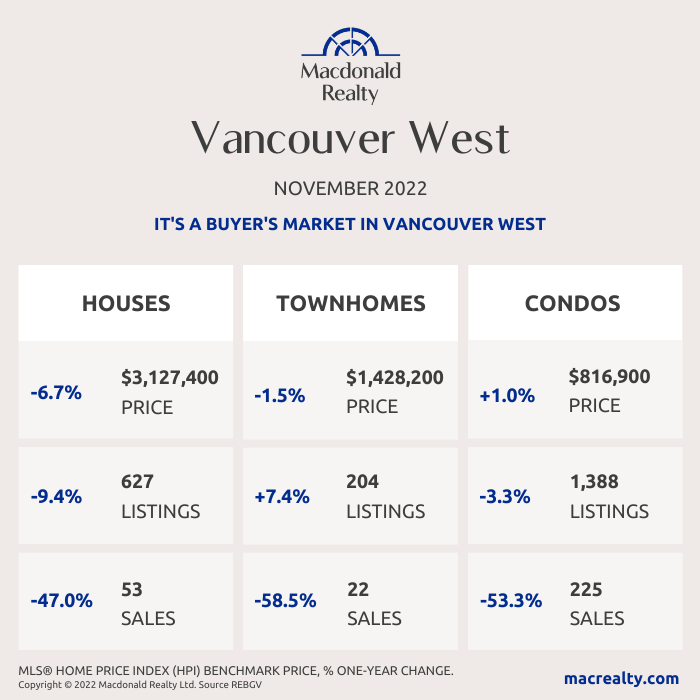
Vancouver West
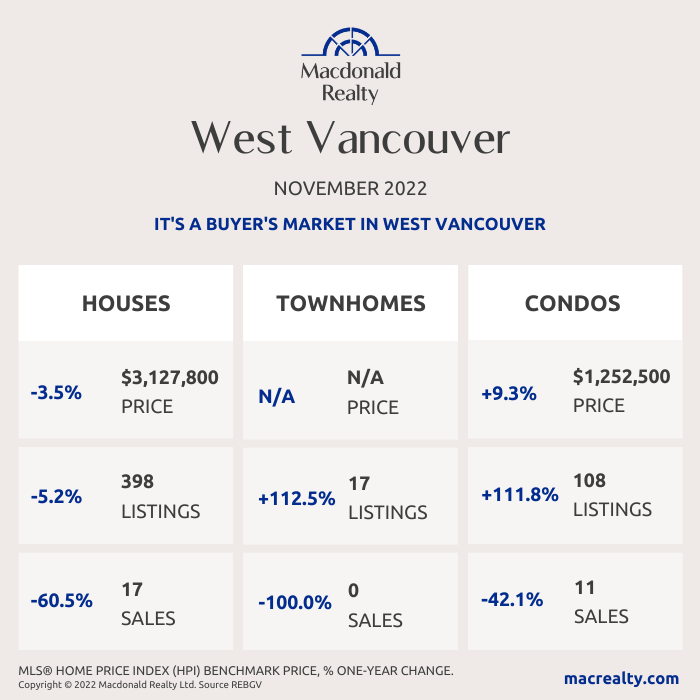
West Vancouver
Looking for more information about the real estate market in specific neighbourhoods in the Greater Vancouver?
Macdonald Realty has offices across the Greater Vancouver. Please email [email protected] or call 1-877-278-3888 to be matched with a REALTOR® working in your area.
MLS® Home Price Index (HPI) Benchmark Price
Average and median home prices are often misinterpreted, are affected by change in the mix of homes sold, and can swing dramatically from month to month (based on the types and prices of properties that sold in a given month). The MLS® HPI overcomes these shortcomings and uses the concept of a benchmark home, a notional home with common attributes of typical homes in a defined area. Visit www.housepriceindex.ca for more information.
This blog post is based on market data provided by the Real Estate Board of Greater Vancouver (REBGV) www.rebgv.org

