
Here are the latest real estate market statistics from Macdonald Realty on the Greater Vancouver listings and sales in June 2023. Find all the infographics by visiting the Facebook Album.
Continuing the trend that has emerged in the housing market this year, the benchmark price for all home types in Metro Vancouver increased in June as home buyer demand butted up against a limited inventory of homes for sale in the region. The Real Estate Board of Greater Vancouver (REBGV) reports that residential home sales in the region totalled 2,988 in June 2023, a 21.1 per cent increase from the 2,467 sales recorded in June 2022. This was 8.6 per cent below the 10-year seasonal average (3,269).
“The market continues to outperform expectations across all segments, but the apartment segment showed the most relative strength in June,” Andrew Lis, REBGV’s director of economics and data analytics said. “The benchmark price of apartment homes is almost cresting the peak reached in 2022, while sales of apartments are now above the region’s ten-year seasonal average. This uniquely positions the apartment segment relative to the attached and detached segments where sales remained below the ten-year seasonal averages.”
There were 5,348 detached, attached and apartment properties newly listed for sale on the Multiple Listing Service® (MLS®) in Metro Vancouver in June 2023. This represents a 1.3 per cent increase compared to the 5,278 homes listed in June 2022. This was 3.1 per cent below the 10-year seasonal average (5,518).
The total number of homes currently listed for sale on the MLS® system in Metro Vancouver is 9,990, a 7.9 per cent decrease compared to June 2022 (10,842) This was 17.4 per cent below the 10-year seasonal average (12,091).
Across all detached, attached and apartment property types, the sales-to-active listings ratio for June 2023 is 31.4 per cent. By property type, the ratio is 20.9 per cent for detached homes, 38.5 per cent for townhomes, and 39.4 per cent for apartments.
Analysis of the historical data suggests downward pressure on home prices occurs when the ratio dips below 12 per cent for a sustained period, while home prices often experience upward pressure when it surpasses 20 per cent over several months.
“Despite elevated borrowing costs, there continues to be too little resale inventory available relative to the pool of buyers in Metro Vancouver. This is the fundamental reason we continue to see prices increase month over month across all segments,” Lis said. “With the benchmark price for apartments now standing at $767,000, we repeat our call to the provincial government to adjust the $525,000 threshold exempting first-time home buyers from the Property Transfer Tax to better reflect the price of entry-level homes in our region. This is a simple policy adjustment that could help more first-time buyers afford a home right now.”
The MLS® Home Price Index composite benchmark price for all residential properties in Metro Vancouver is currently $1,203,000. This represents a 2.4 per cent decrease over June 2022 and a 1.3 per cent increase compared to May 2023.
*Areas covered by the Real Estate Board of Greater Vancouver include Burnaby, Coquitlam, Maple Ridge, New Westminster, North Vancouver, Pitt Meadows, Port Coquitlam, Port Moody, Richmond, South Delta, Squamish, Sunshine Coast, Vancouver, West Vancouver, and Whistler. Check out the infographics of Squamish, Sunshine Coast and Whistler, HERE.
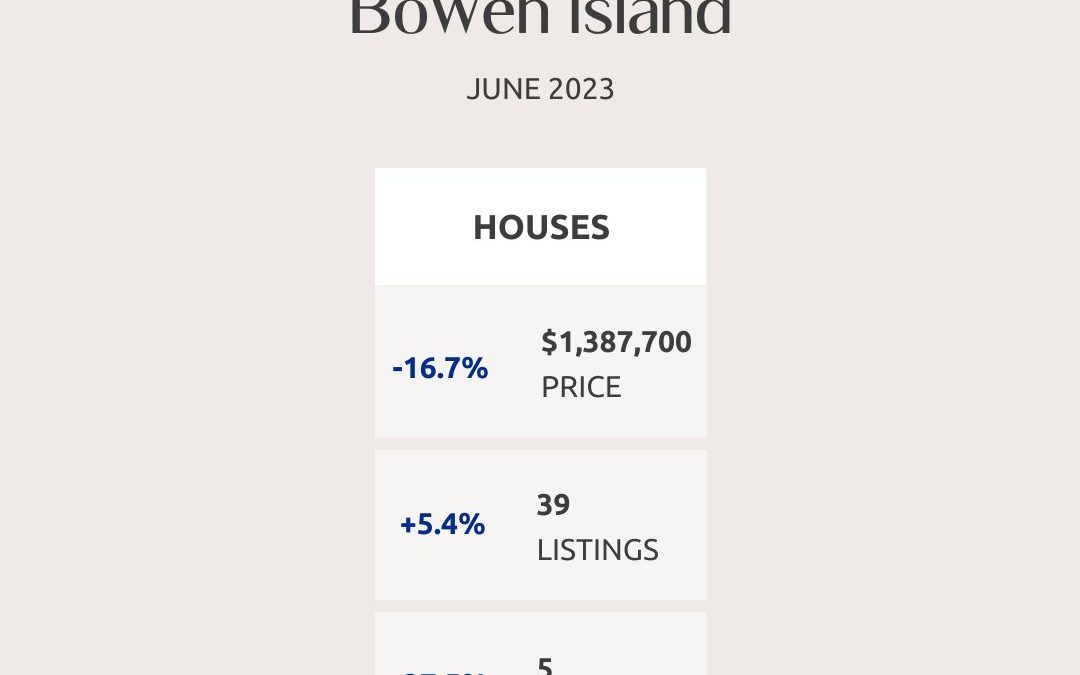
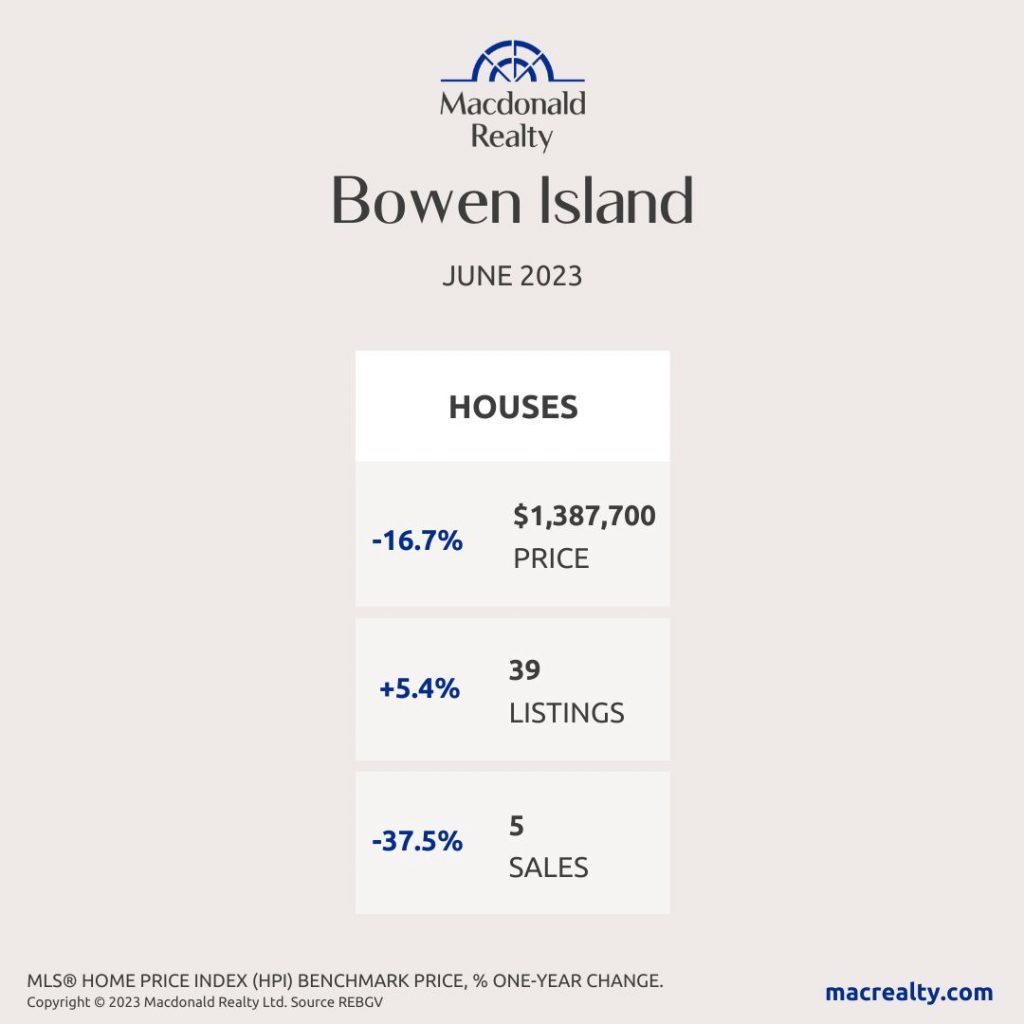
Bowen Island
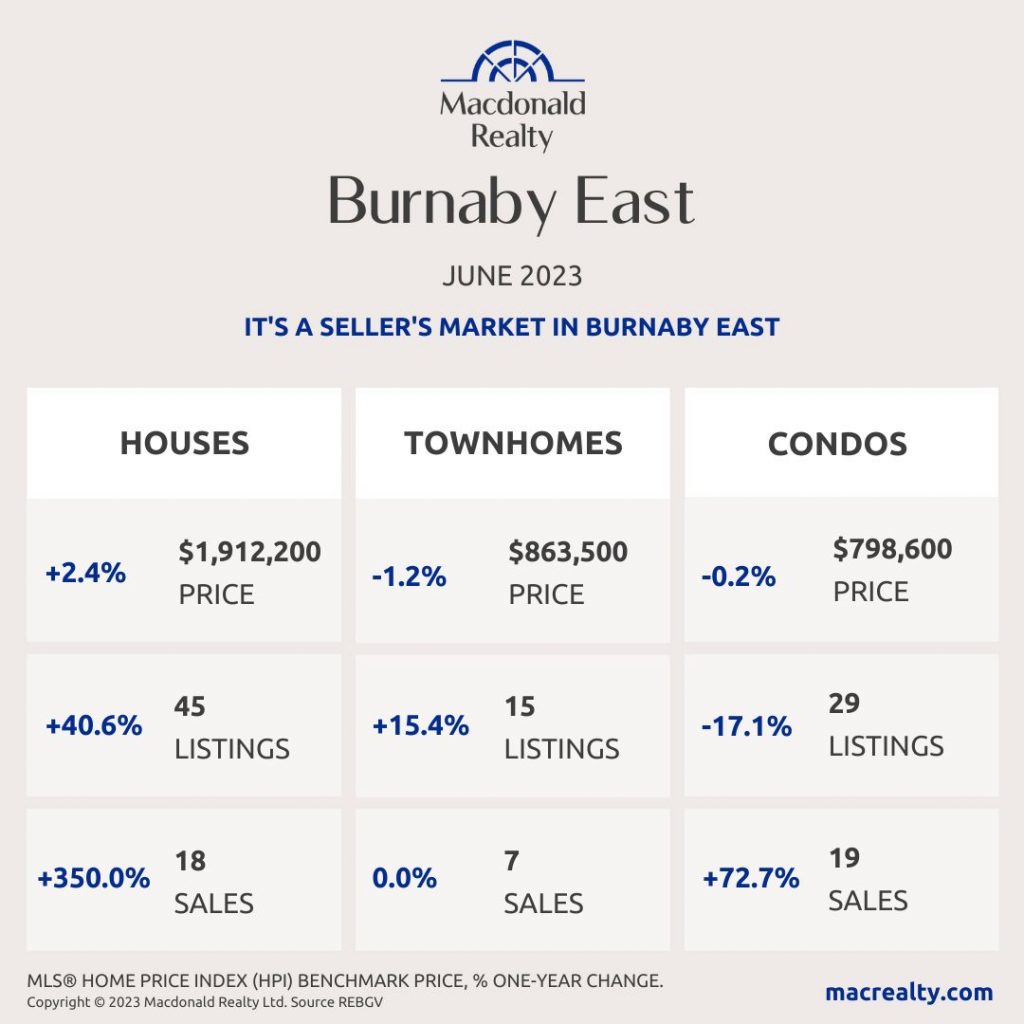
Burnaby East
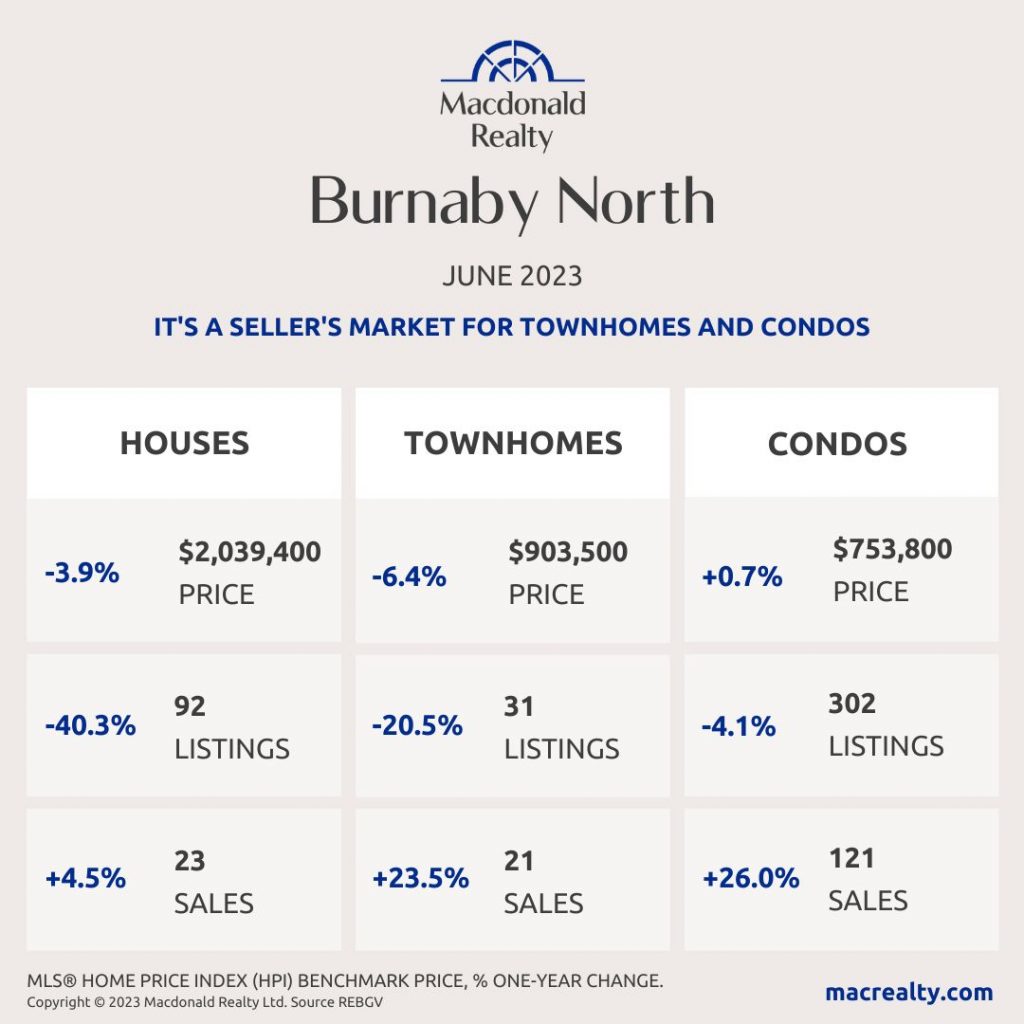
Burnaby North
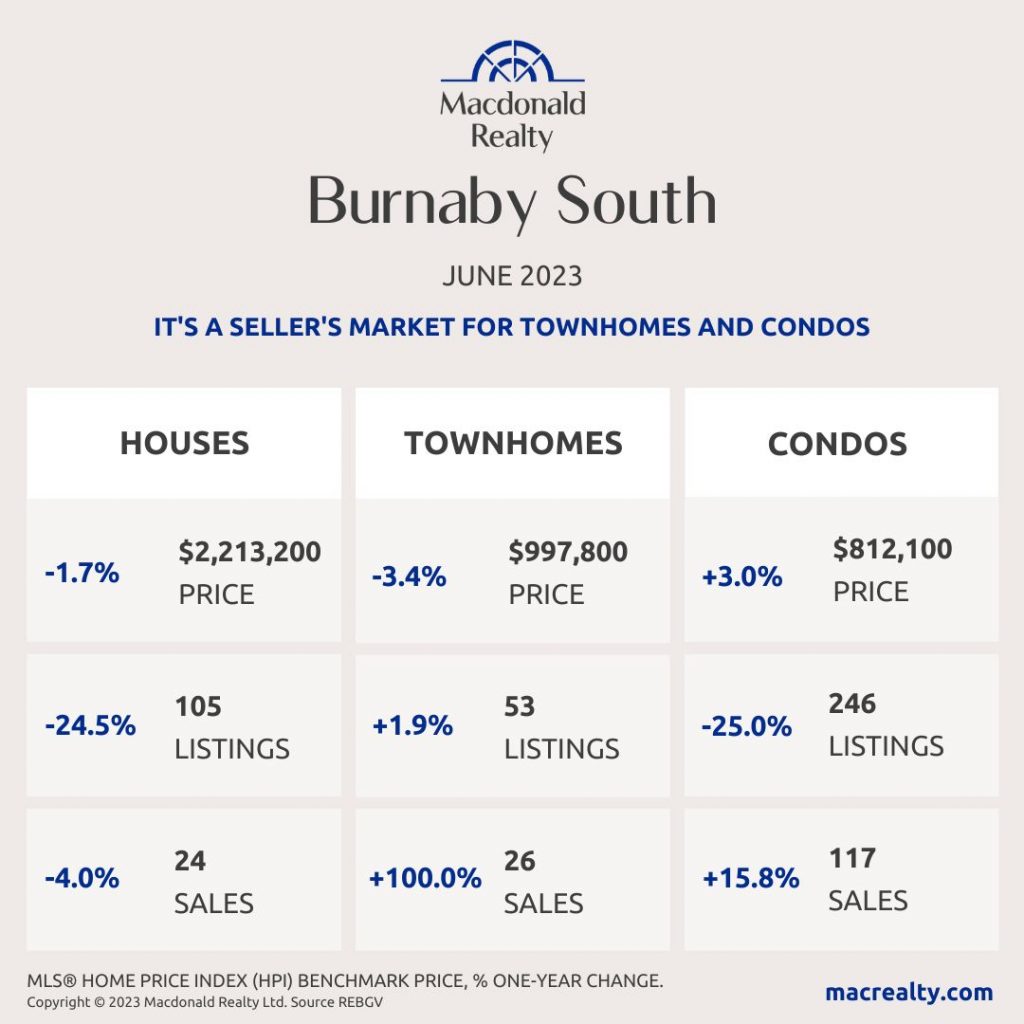
Burnaby South
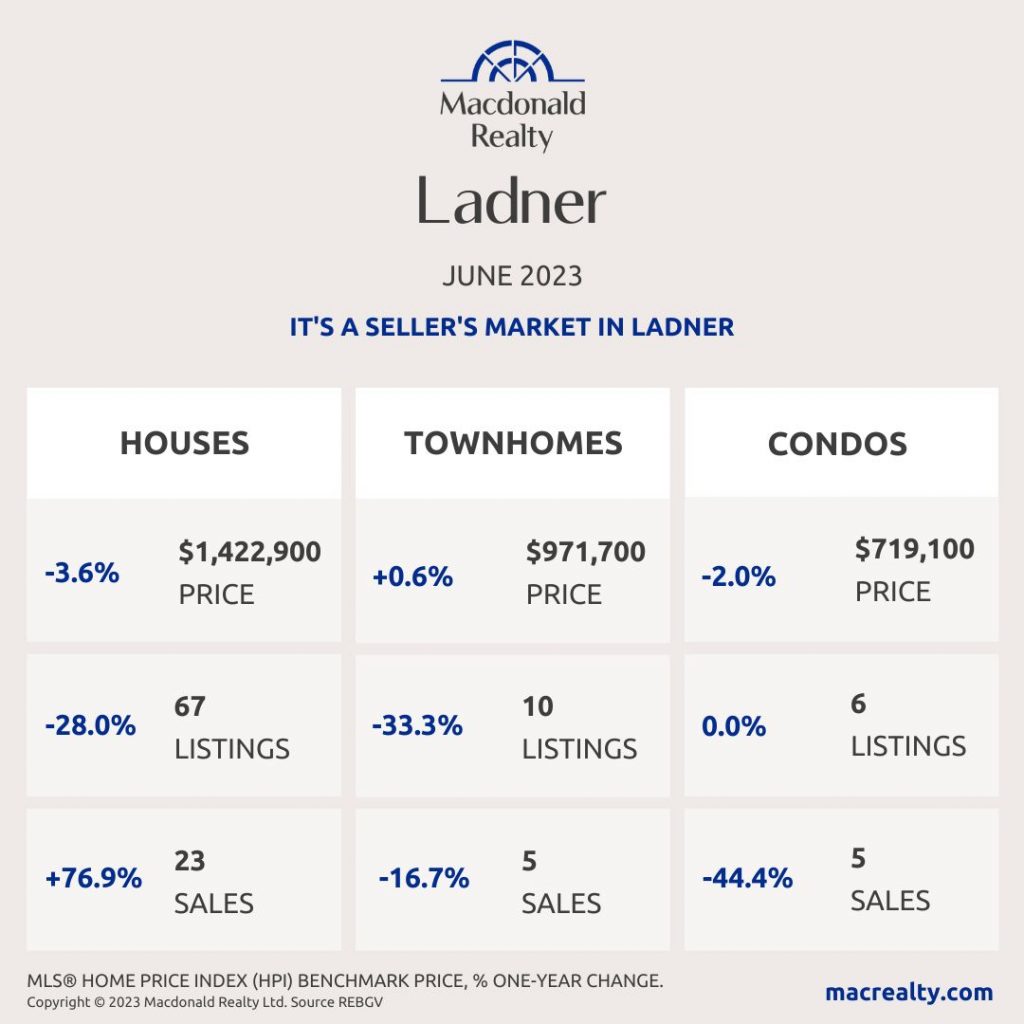
Ladner
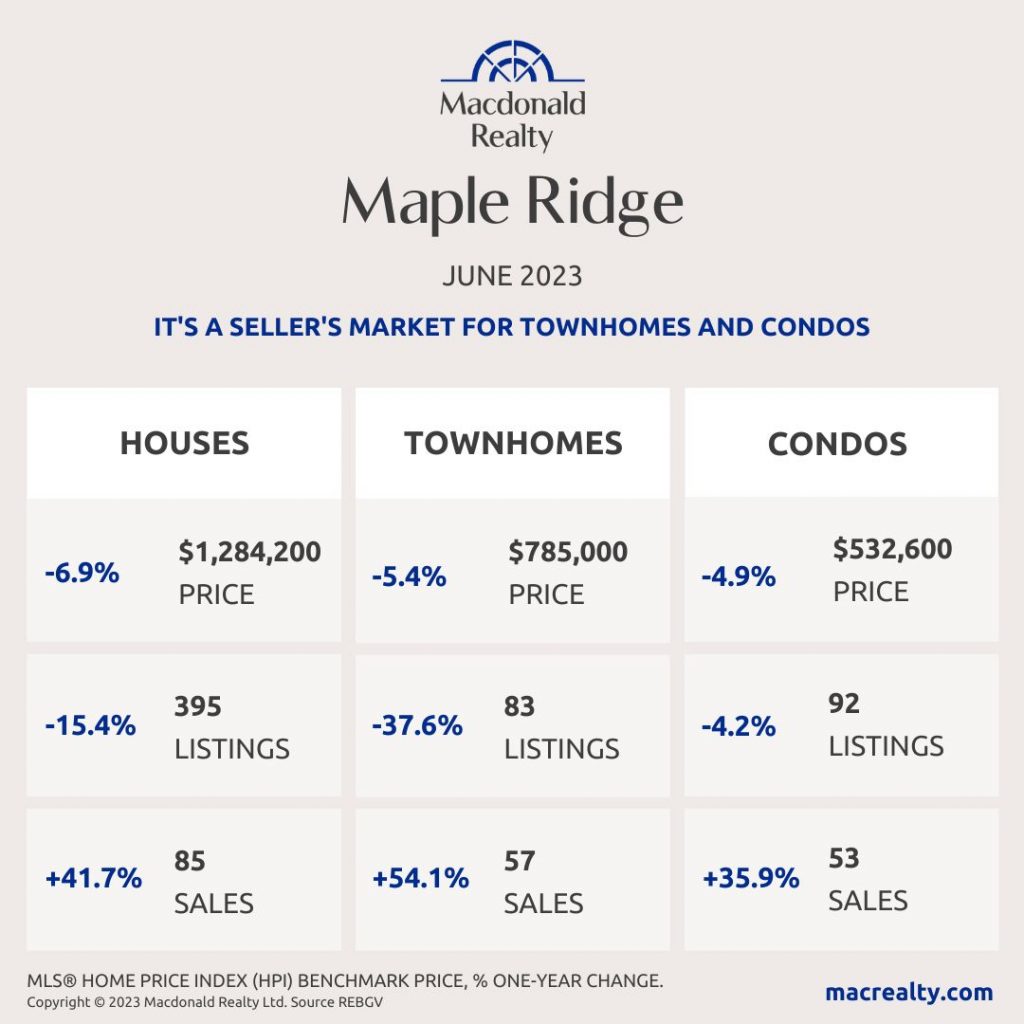
Maple Ridge
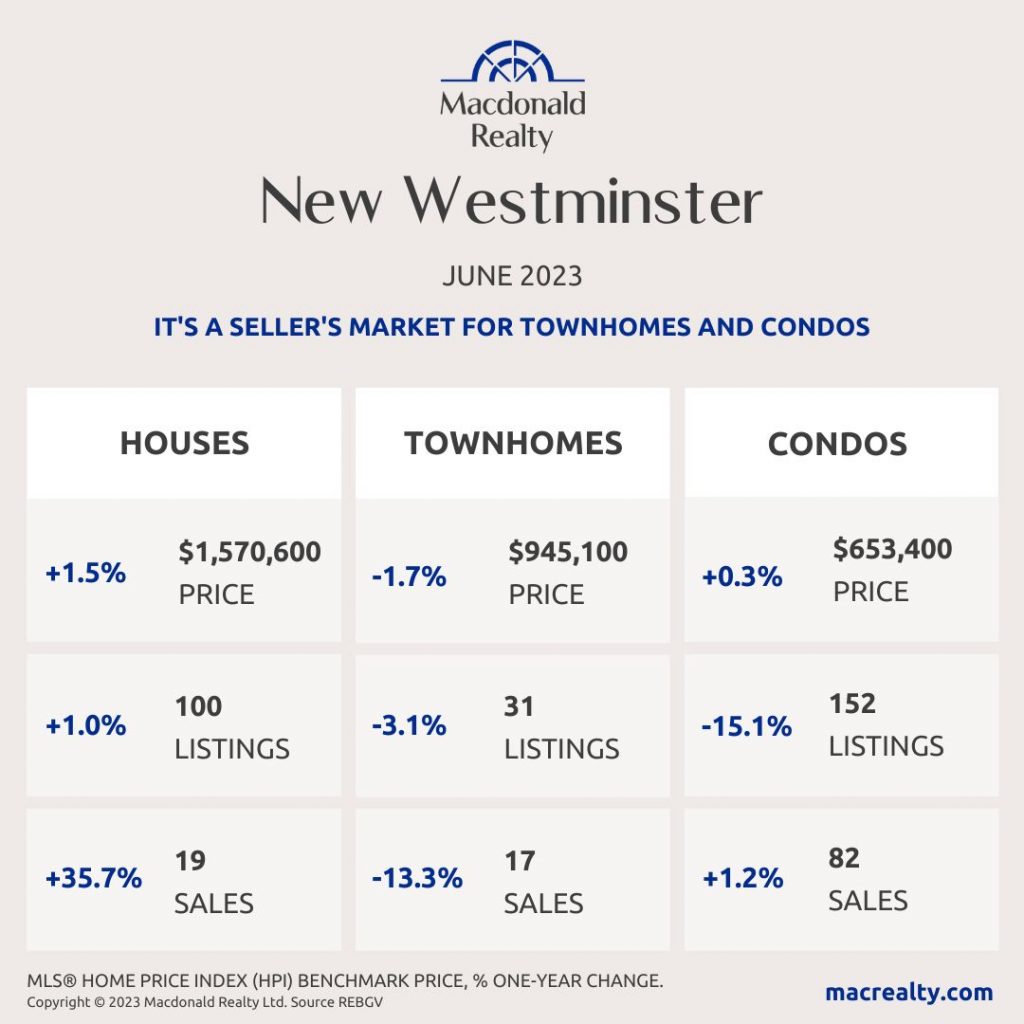
New Westminster
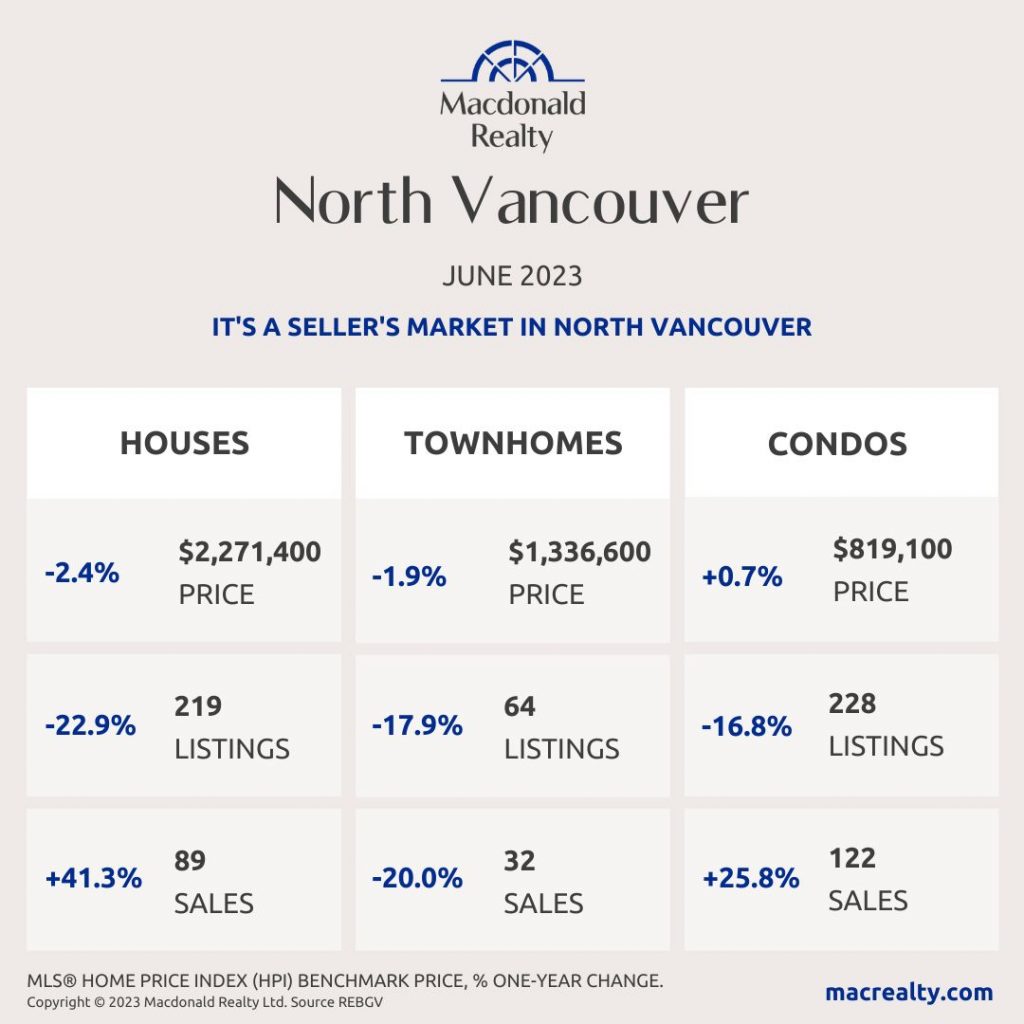
North Vancouver
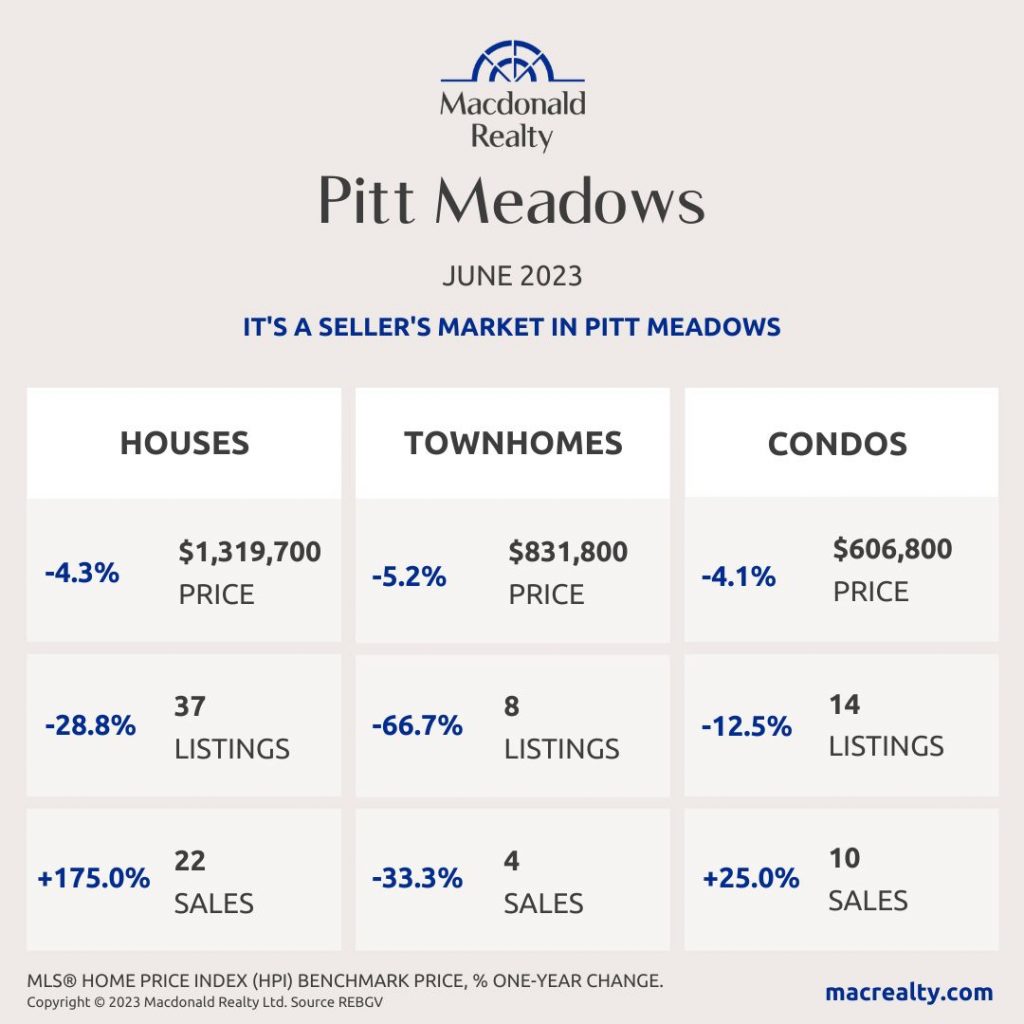
Pitt Meadows
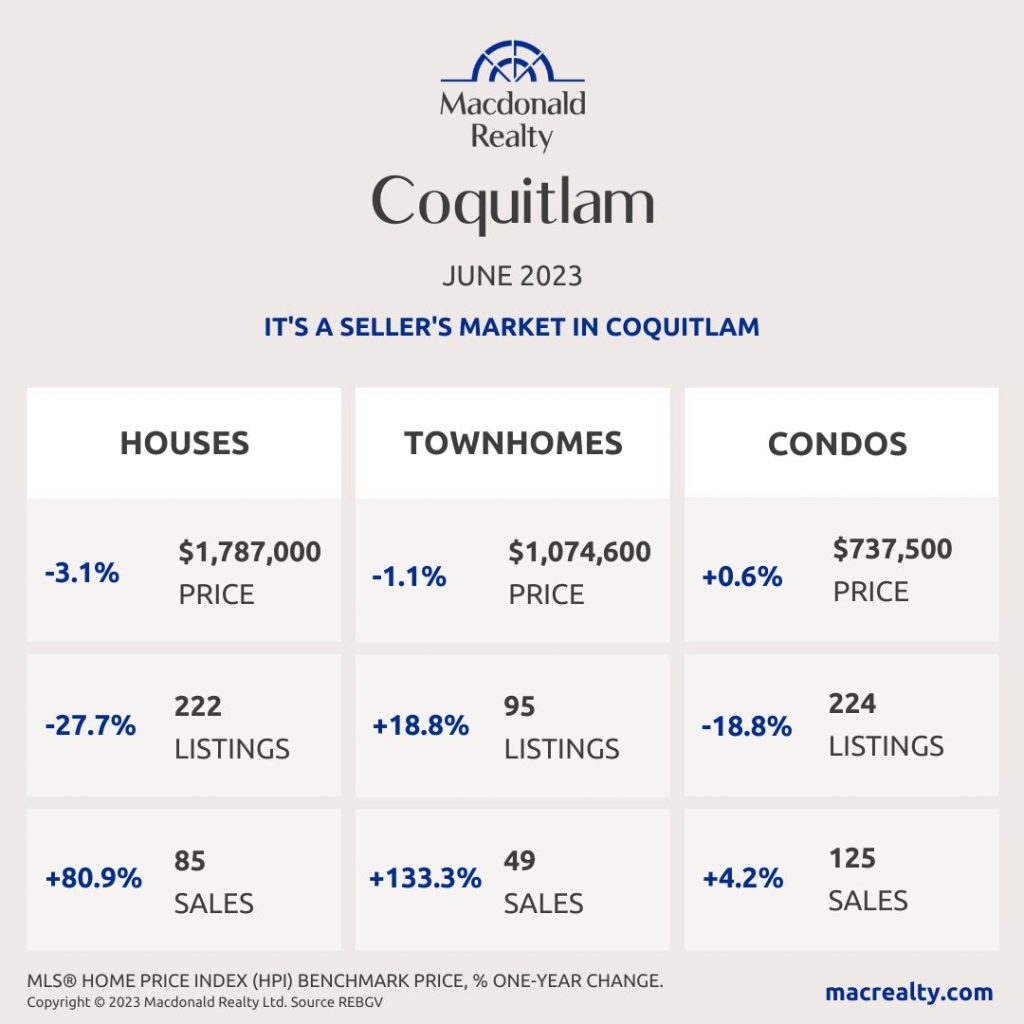
Coquitlam
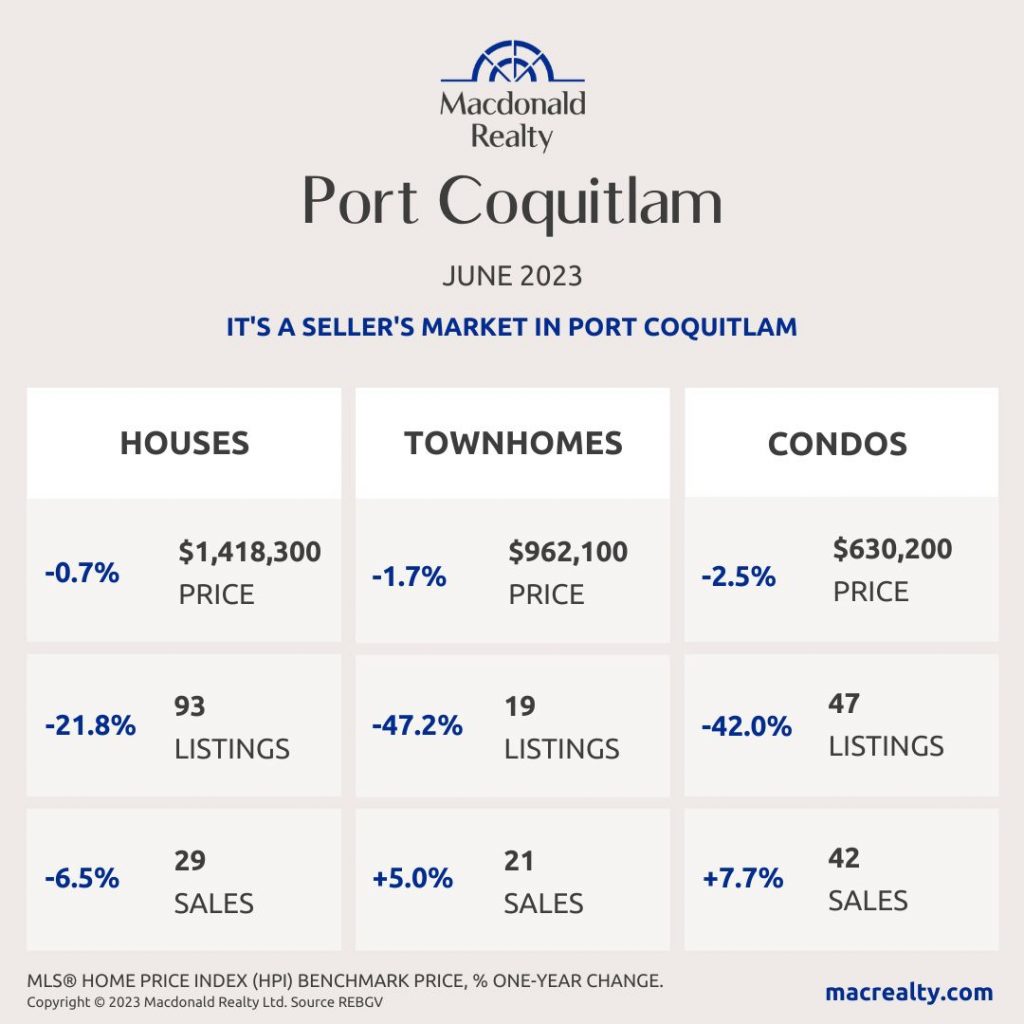
Port Coquitlam
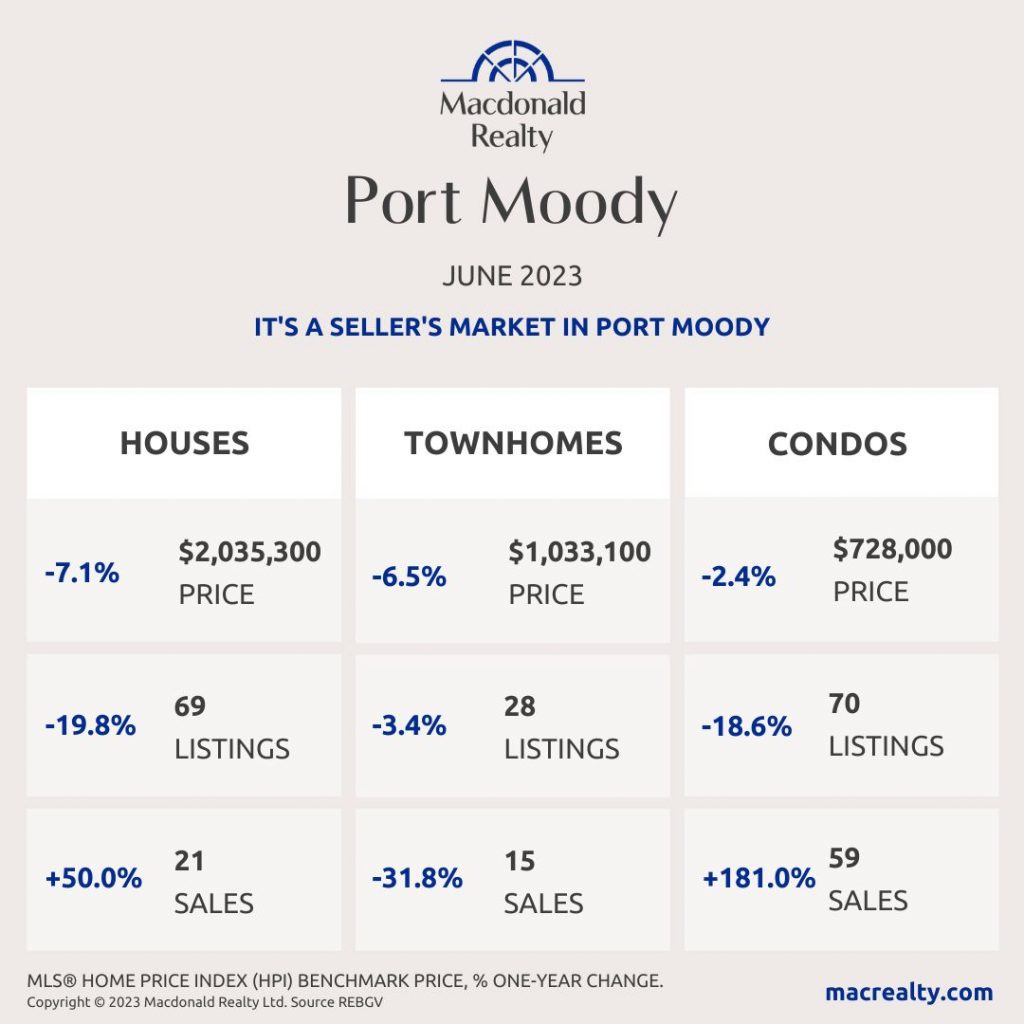
Port Moody
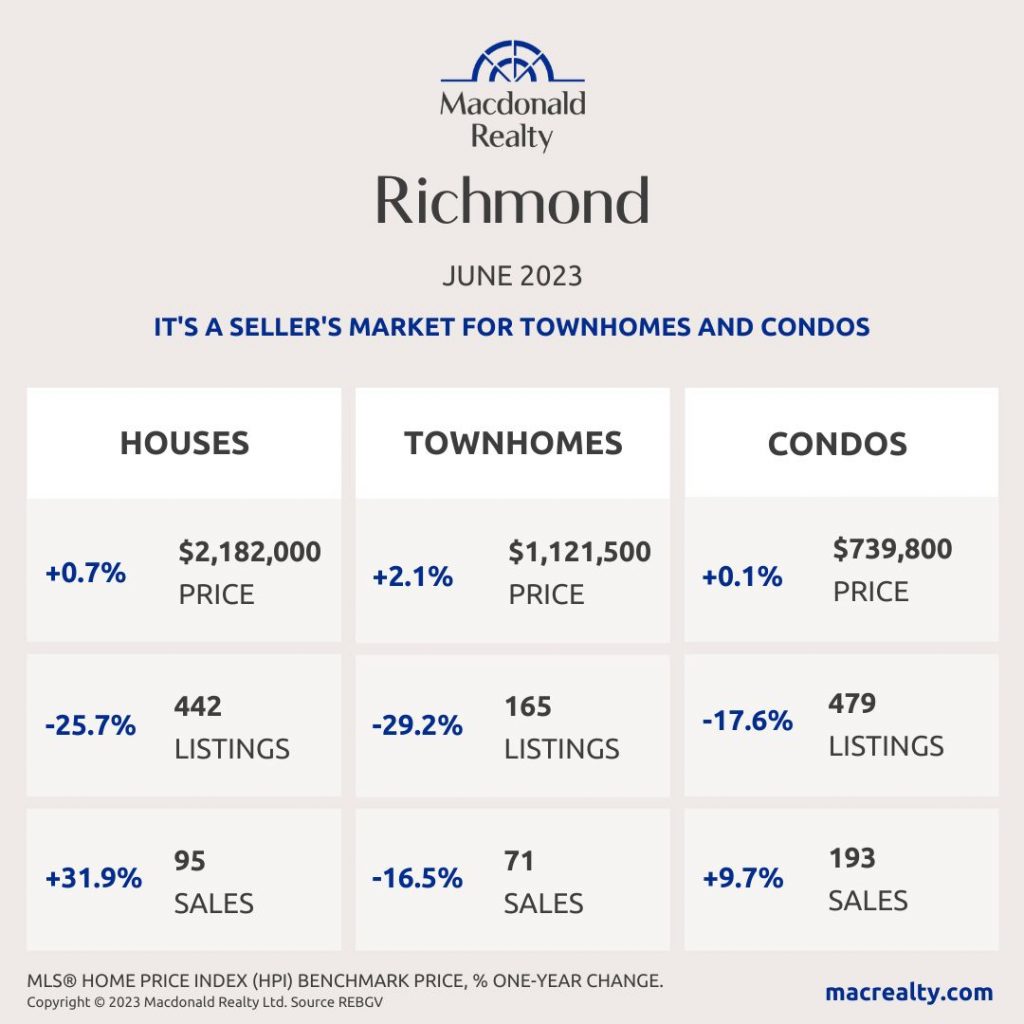
Richmond
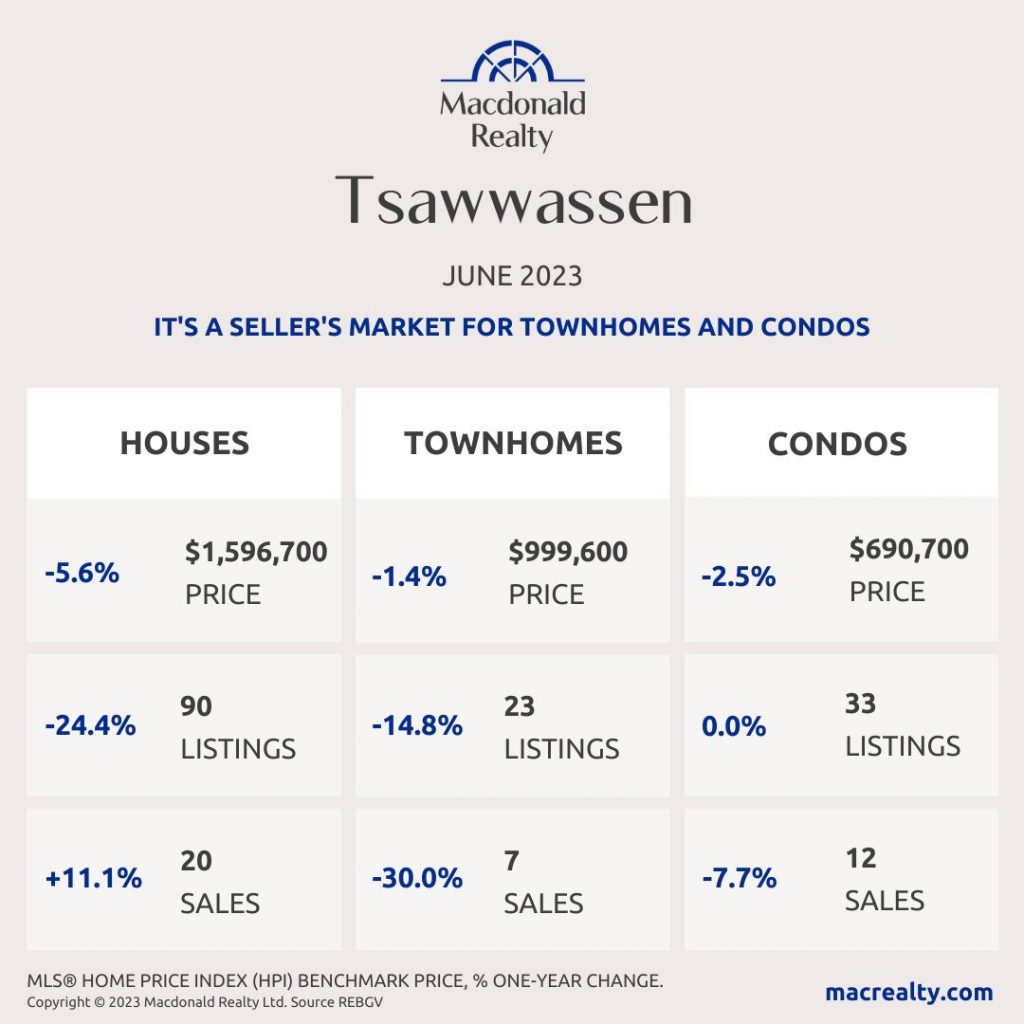
Tsawwassen
Vancouver East

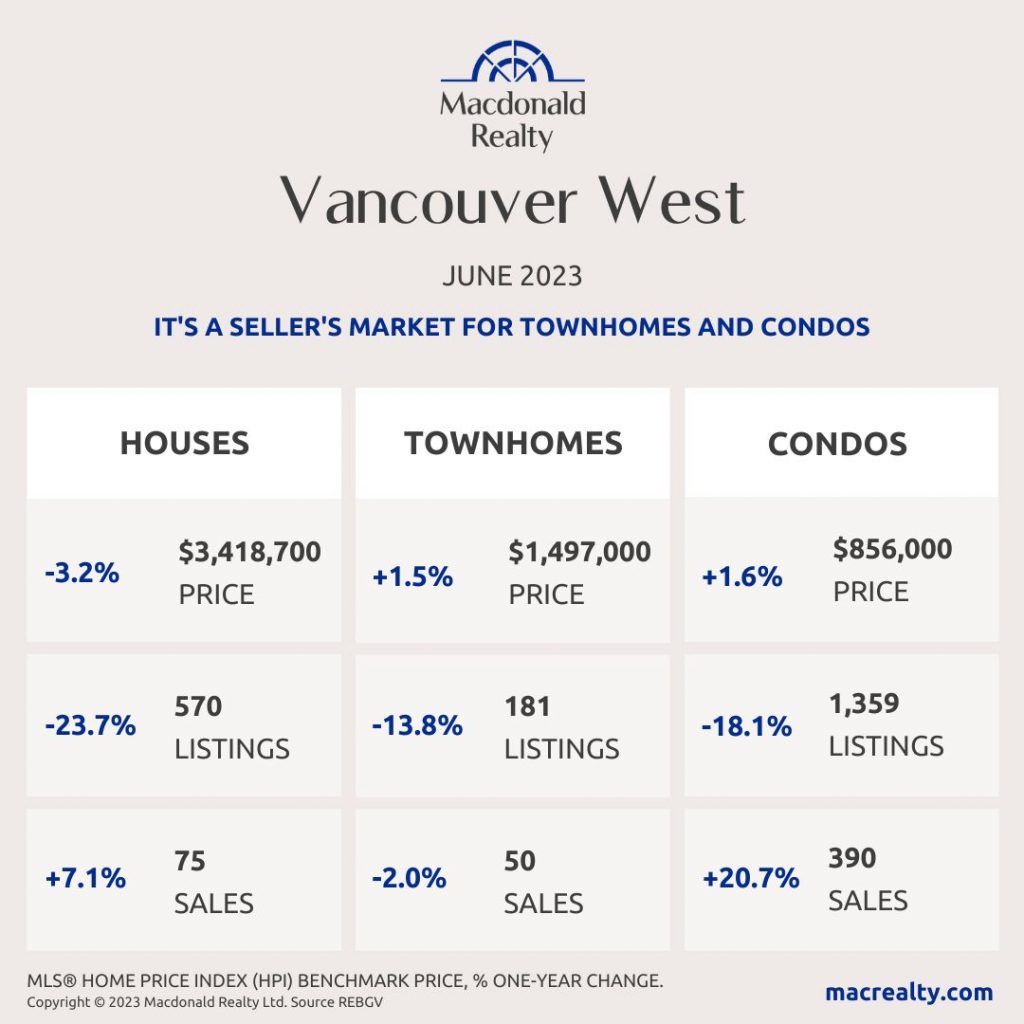
Vancouver West
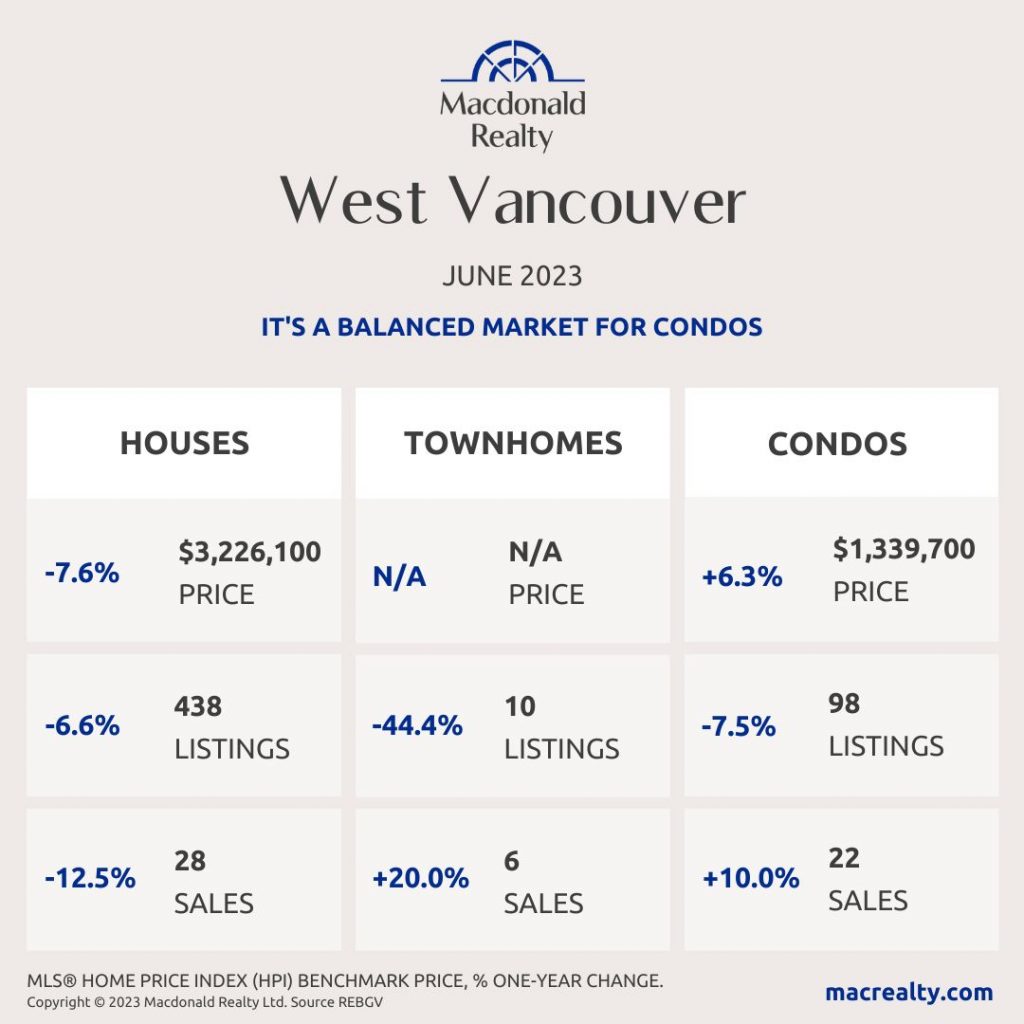
West Vancouver
Looking for more information about the real estate market in specific neighbourhoods in the Greater Vancouver?
Macdonald Realty has offices across the Greater Vancouver. Please email [email protected] or call 1-877-278-3888 to be matched with a REALTOR® working in your area.
MLS® Home Price Index (HPI) Benchmark Price
Average and median home prices are often misinterpreted, are affected by change in the mix of homes sold, and can swing dramatically from month to month (based on the types and prices of properties that sold in a given month). The MLS® HPI overcomes these shortcomings and uses the concept of a benchmark home, a notional home with common attributes of typical homes in a defined area. Visit www.housepriceindex.ca for more information.
This blog post is based on market data provided by the Real Estate Board of Greater Vancouver (REBGV) www.rebgv.org

