by Macrealty Marketing Team | Dec 4, 2018 | Market Updates
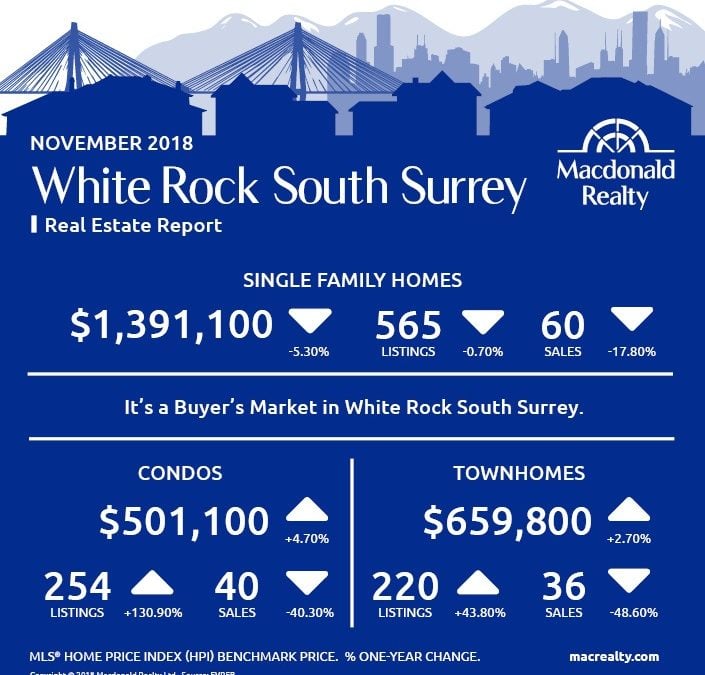
Here are the latest real estate market statistics from Macdonald Realty on North Delta, Surrey, White Rock, Langley, and Fraser Valley listings and sales in November 2018.
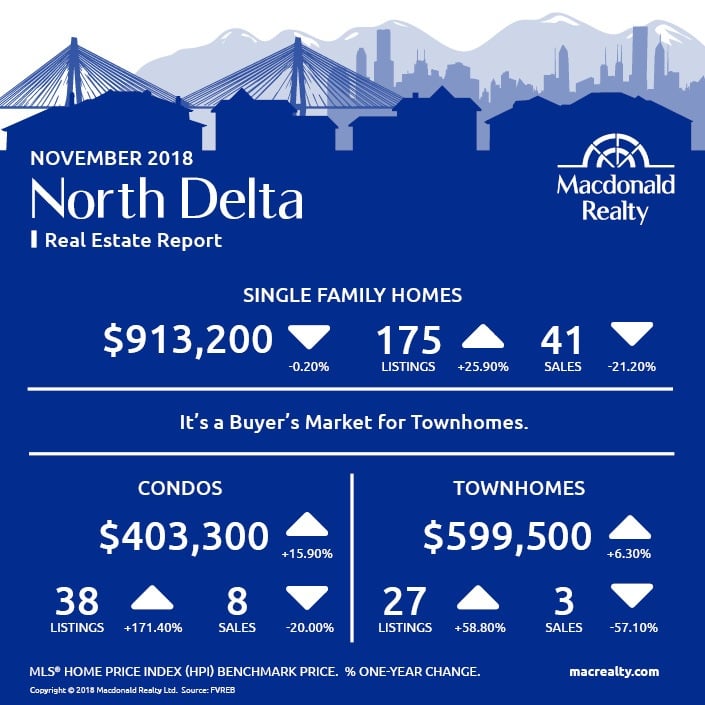
North Delta
In the North Delta market, the benchmark sale price was $913,200 for detached homes. At the end of the month, there were 175 active listings and 41 sales.
The condo market had 8 sales and 38 active listings. The benchmark sale price was $403,300.
Townhomes featured 3 sales, 27 active listings and a $599,500 benchmark sale price.
It’s a buyer’s market for townhomes.
(more…)
by Macrealty Marketing Team | Dec 4, 2018 | Market Updates
Here are the latest real estate market statistics from Macdonald Realty on Greater Victoria, Parksville/Qualicum, and Nanaimo listings and sales in November 2018.
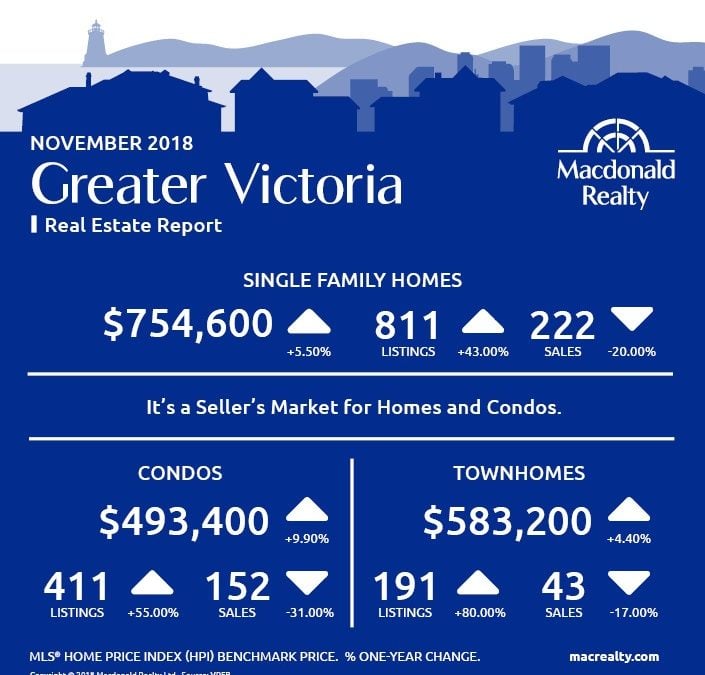
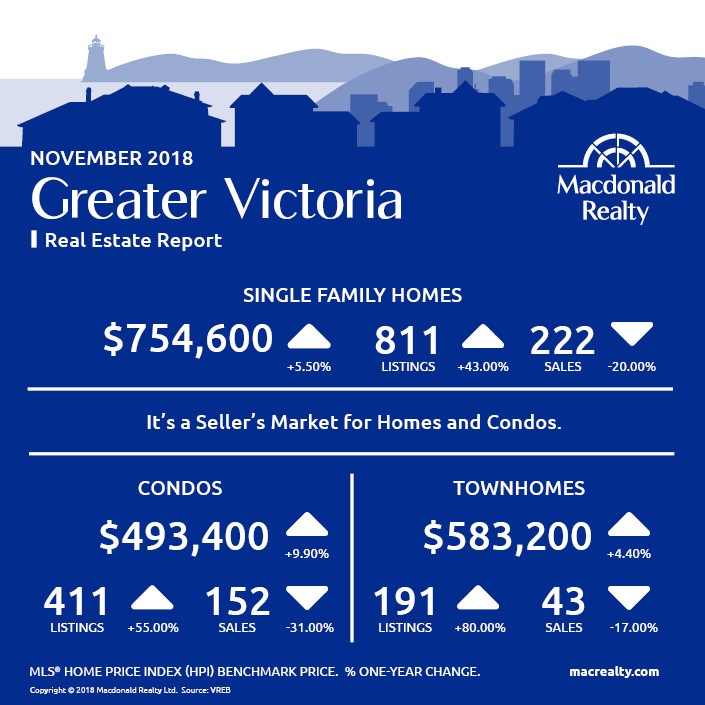
Greater Victoria
In November 2018, there were 222 sales of single family homes and 811 active listings in Greater Victoria. The benchmark sale price was $754,600 with an average days on market of 45. The hottest market for sales was Langford with 47 sales. There were also 15 sales and 127 active listings at the end of the month for waterfront homes.
In comparison, the Condo market had 152 sales and 411 active listings at the end of the month. The benchmark sale price was $493,400 with an average days on market of 35. The hottest market for sales was Victoria, 53 sales.
Townhome sales were 43, active listings were 191 and the benchmark sale price was $583,200. The average days on market were 40, and the hottest market was Saanich East with 12 sales.
It’s a seller’s market for homes and condos.
(more…)
by Macrealty Marketing Team | Nov 8, 2018 | Market Updates
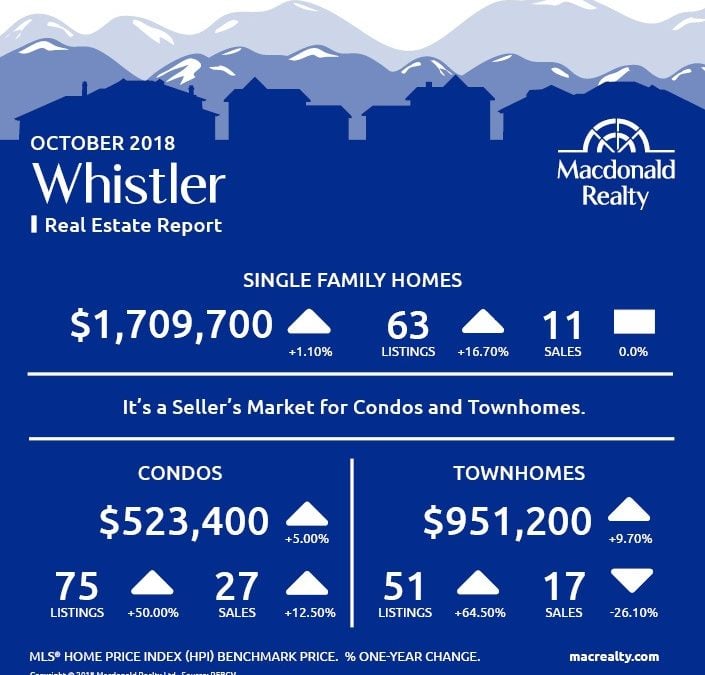
Here are the latest real estate market statistics from Macdonald Realty on Squamish, Whistler, and Sunshine Coast listings and sales in October 2018.
Squamish
In October 2018, there were 15 sales of detached homes and 131 active listings in Squamish. The benchmark sale price was $968,500 with an average days on market of 61.
The condo market had 6 sales and 58 active listings at the end of the month. The benchmark sale price was $487,500 with an average days on market of 88.
Townhome sales were 11 sales, active listings were 57. The benchmark sale price was $724,900 and the average days on market were 55.
It’s a buyer’s market for homes and condos.

(more…)
by Macrealty Marketing Team | Nov 8, 2018 | Market Updates
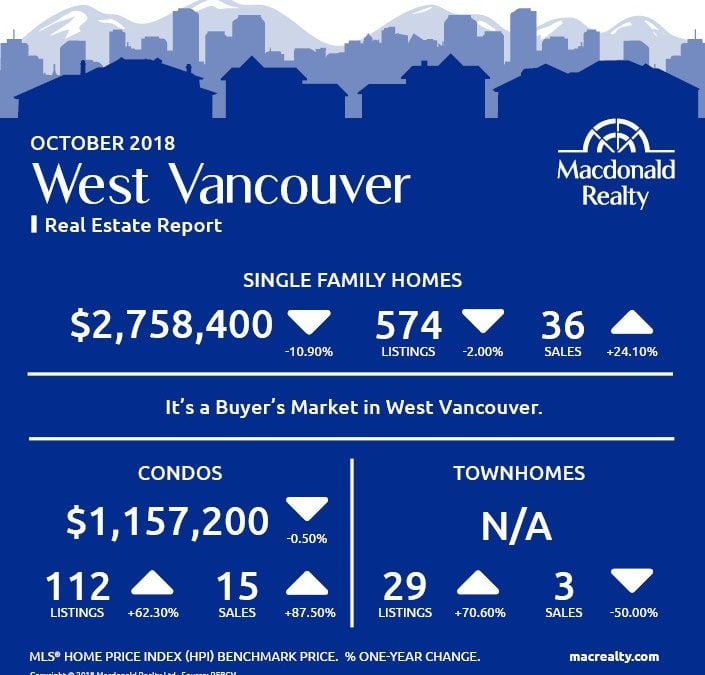
Here are the latest real estate market statistics from Macdonald Realty on the Greater Vancouver listings and sales in October 2018.
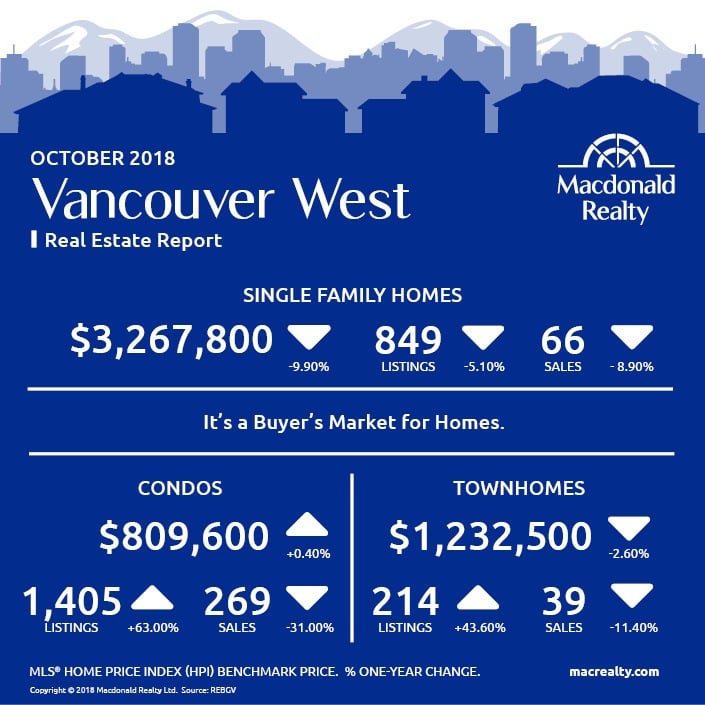
Vancouver-West
In the Vancouver Westside, there were 66 sales of detached homes and 849 active listings at the end of the month. The benchmark sale price was $3,267,800, with average days on market of 61. The hottest markets for sales was Dunbar with 13 sales.
In comparison, the condo market had 269 sales, 1,405 active listings and a benchmark sale price of $809,600 with an average of 27 days on market. The hottest market for sales was Downtown VW, 56 sales.
Townhome sales were 39, active listings were 214. The benchmark sale price was $1,232,500 with an average days on market of 24. Fairview VW with 13 sales was the hottest market of the month.
It’s a buyer’s market for homes.
(more…)
by Macrealty Marketing Team | Nov 5, 2018 | Market Updates
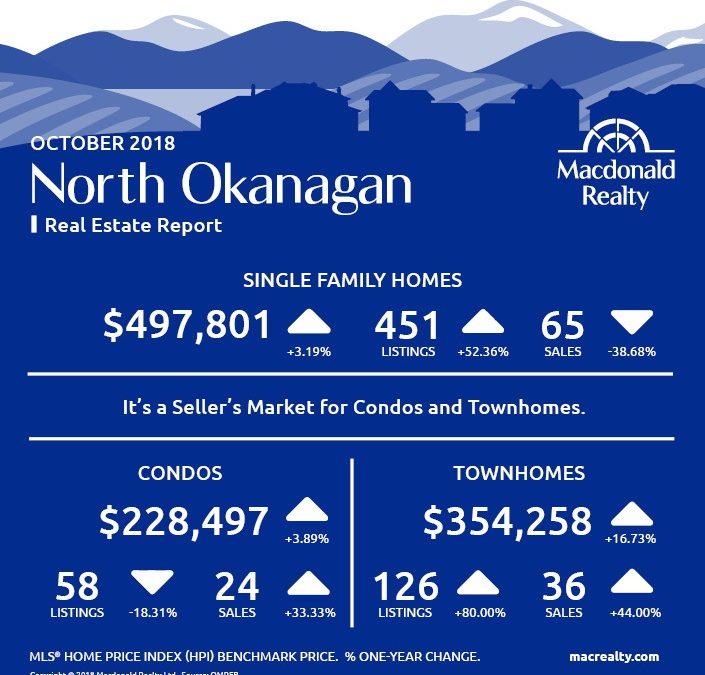
Here are the latest real estate market statistics from Macdonald Realty on Okanagan listings and sales in October 2018.
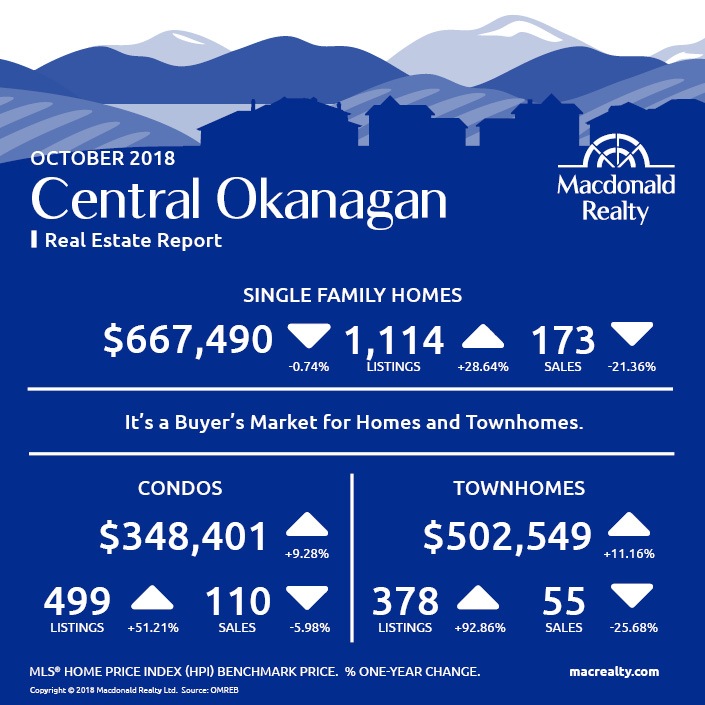
Central Okanagan: Kelowna and Lake Country
There were 173 sales, 1,114 active listings, and a $667,490 average sale price for detached homes in the Central Okanagan market, including Kelowna and Lake Country. The average days on market were 58.
The condo market featured 110 sales and 499 active listings at the end of the month. The average sale price was $348,401 with 62 average days on market.
Townhome sales were 55, active listings were 378, average sale price was $502,549, and the average days on market were 54.
It’s a buyer’s market for homes & townhomes.
(more…)
by Macrealty Marketing Team | Nov 5, 2018 | Market Updates
Here are the latest real estate market statistics from Macdonald Realty on North Delta, Surrey, White Rock, Langley, and Fraser Valley listings and sales in October 2018.
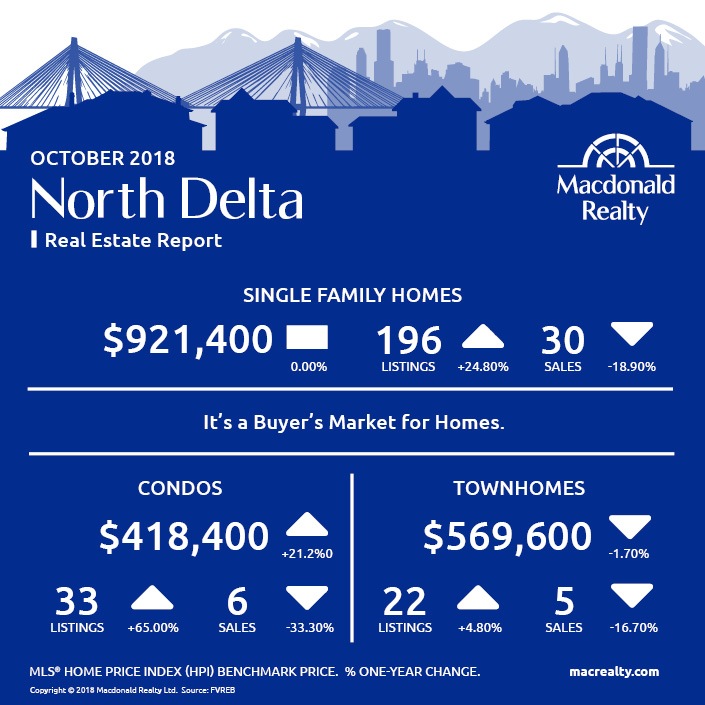
North Delta
In the North Delta market, the benchmark sale price was $921,400 for detached homes. At the end of the month, there were 196 active listings and 30 sales.
The condo market had 6 sales and 33 active listings. The benchmark sale price was $418,400.
Townhomes featured 5 sales, 22 active listings and a $569,600 benchmark sale price.
It’s a buyer’s market for homes.

(more…)

