by Macrealty Marketing Team | Jun 6, 2023 | Market Updates
According to the Fraser Valley Real Estate Board, momentum continues to build in the Fraser Valley real estate market.
The Fraser Valley real estate market saw an injection of supply in May as new listings surged by more than 40 per cent over April.
At 3,533, new listings were just below May 2022 levels (3,631) but slightly higher (2.7 per cent) than the ten-yearaverage for the region. A welcome trend towards alleviating housing supply issues.
““Typically we would see an influx of inventory earlier in the spring sales cycle,” said Narinder Bains, Chair of theFraser Valley Real Estate Board. “The series of interest rate hikes during the latter half of 2022 had many sellers and buyers in a holding pattern for most of the year. What we’re seeing now is a recovery and adjustment to the new financing landscape.””
Active listings grew to 5,558, a 20 per cent increase over April, the highest month-over-month jump in more than a year.
The strong supply trend was met with healthy demand. In May, the Board processed 1,711 sales on its Multiple Listing Service®, a 10.1 per cent increase over last month and a 25.8 per cent jump over May of last year.
Prices continued to edge upward across all categories as buyer confidence grew, with the composite Benchmark price topping the one-million mark at $1.01 million, a level not seen since September 2022.
““It’s encouraging to see more typically cyclical activity this spring,” said FVREB CEO, Baldev Gill. “Inventory has been trending upwards since December 2022, providing more choice, which in turn will hopefully spur on even more listings. That said, with inflation tracking at elevated levels the potential for further rate hikes is very real. Buyers and sellers would be well-advised to work with real estate professionals to factor this into their decisions.”
Find all the infographics related to the May Market Statistics by visiting the Facebook Album.
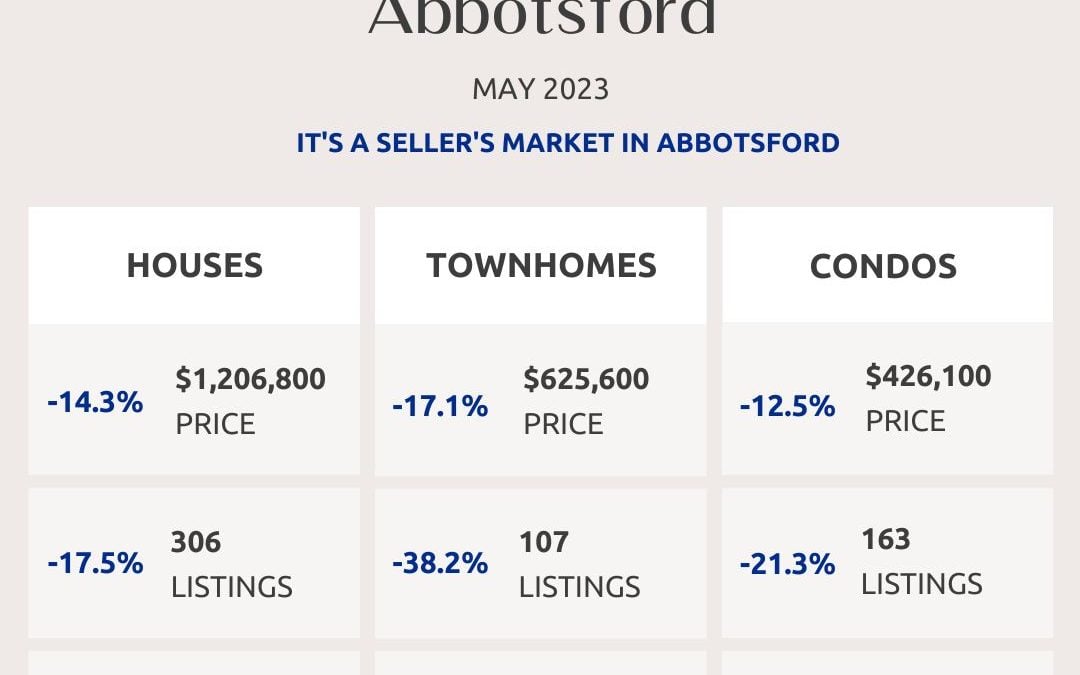
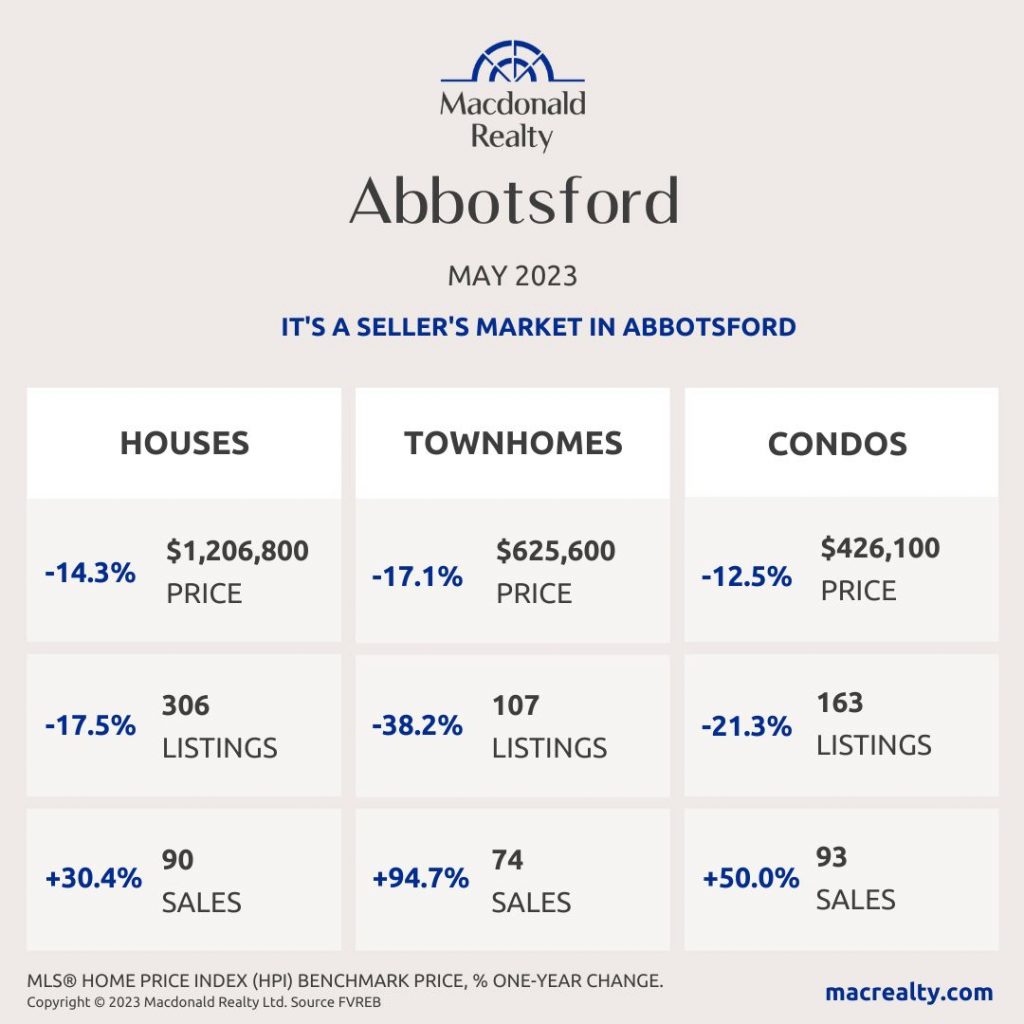
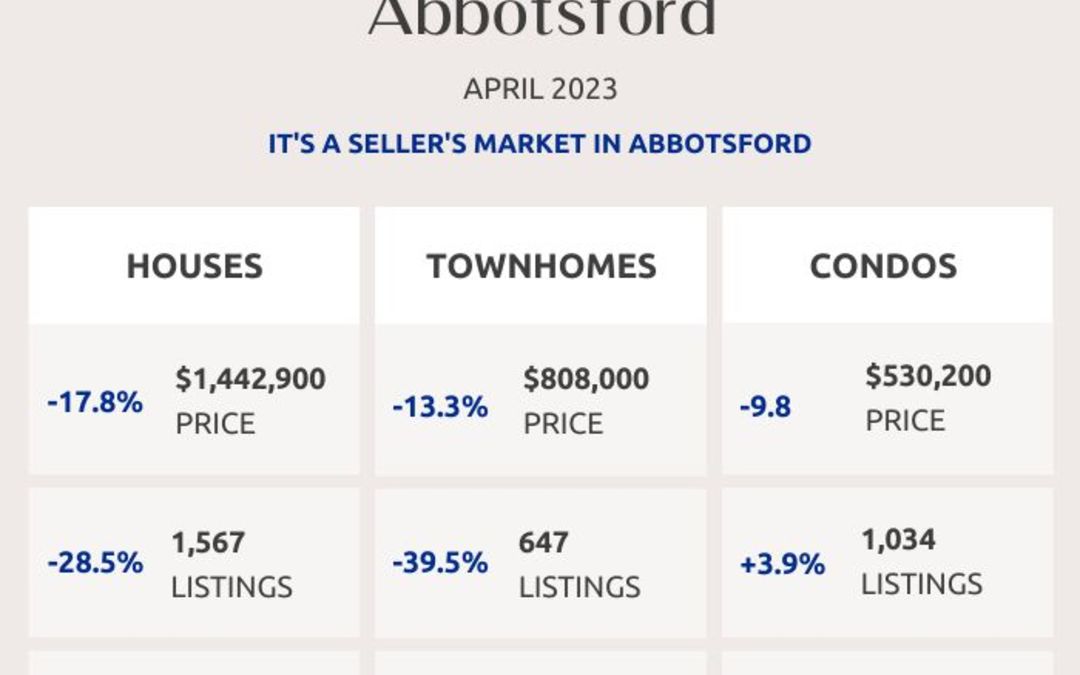
Abbotsford
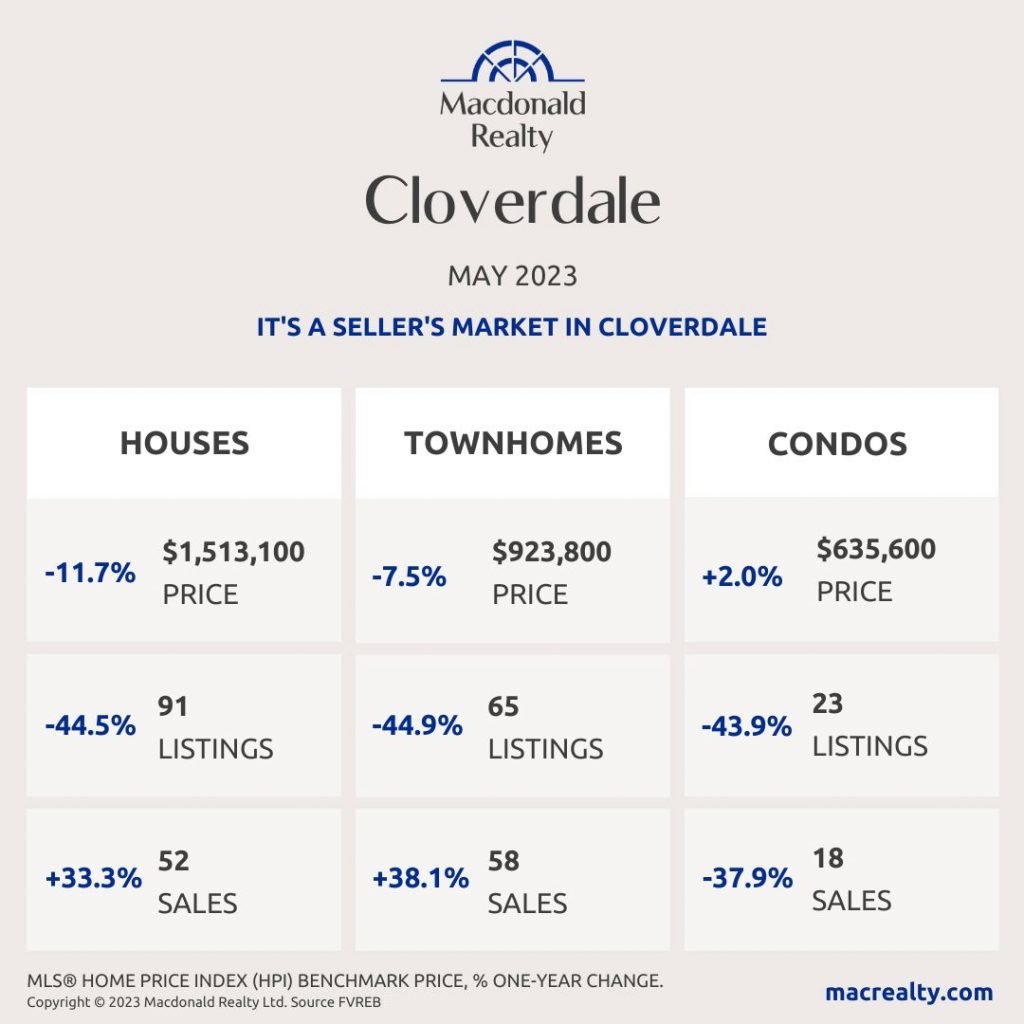
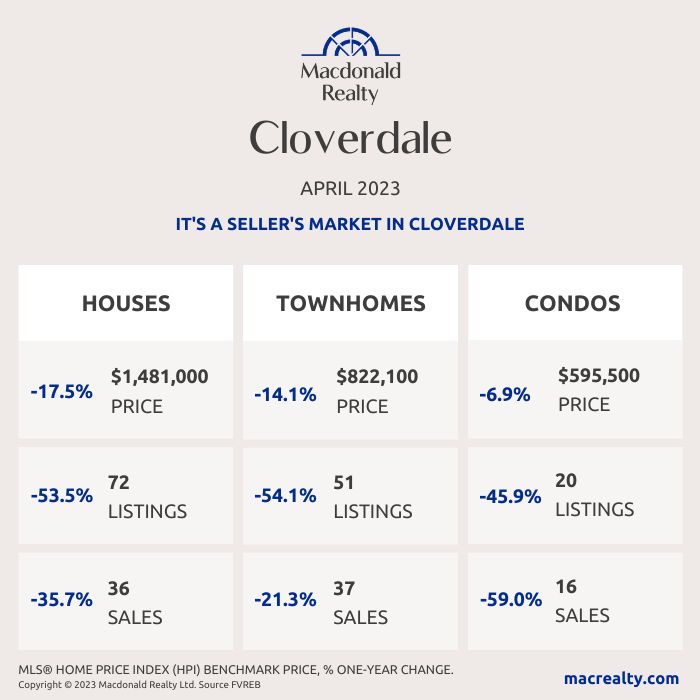
Cloverdale
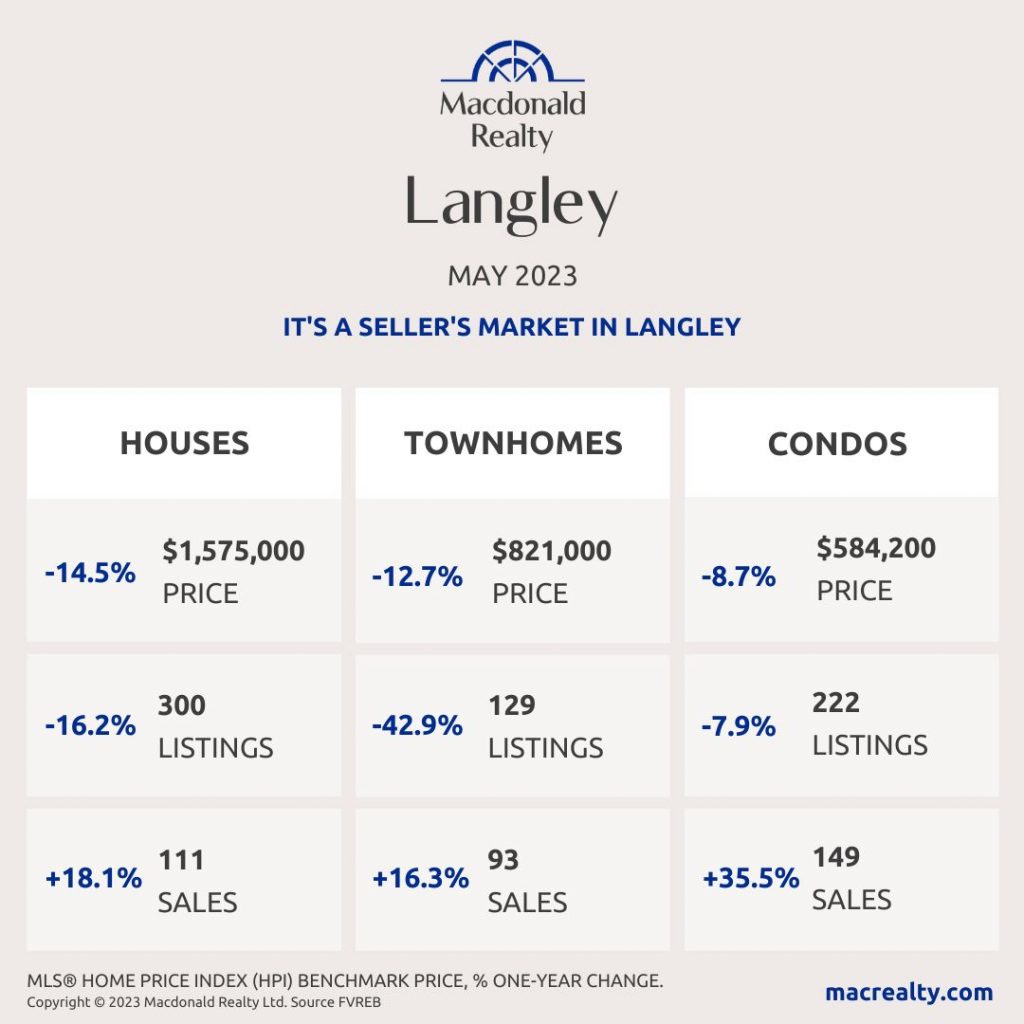
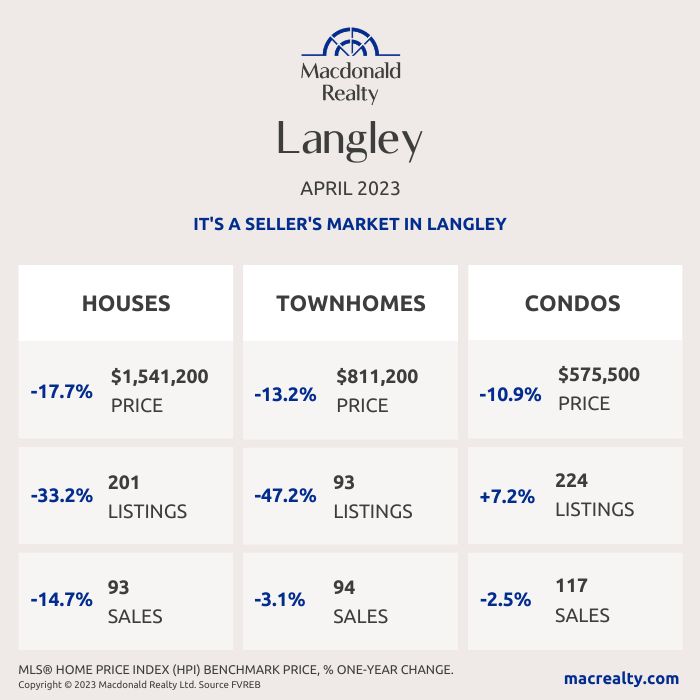
Langley
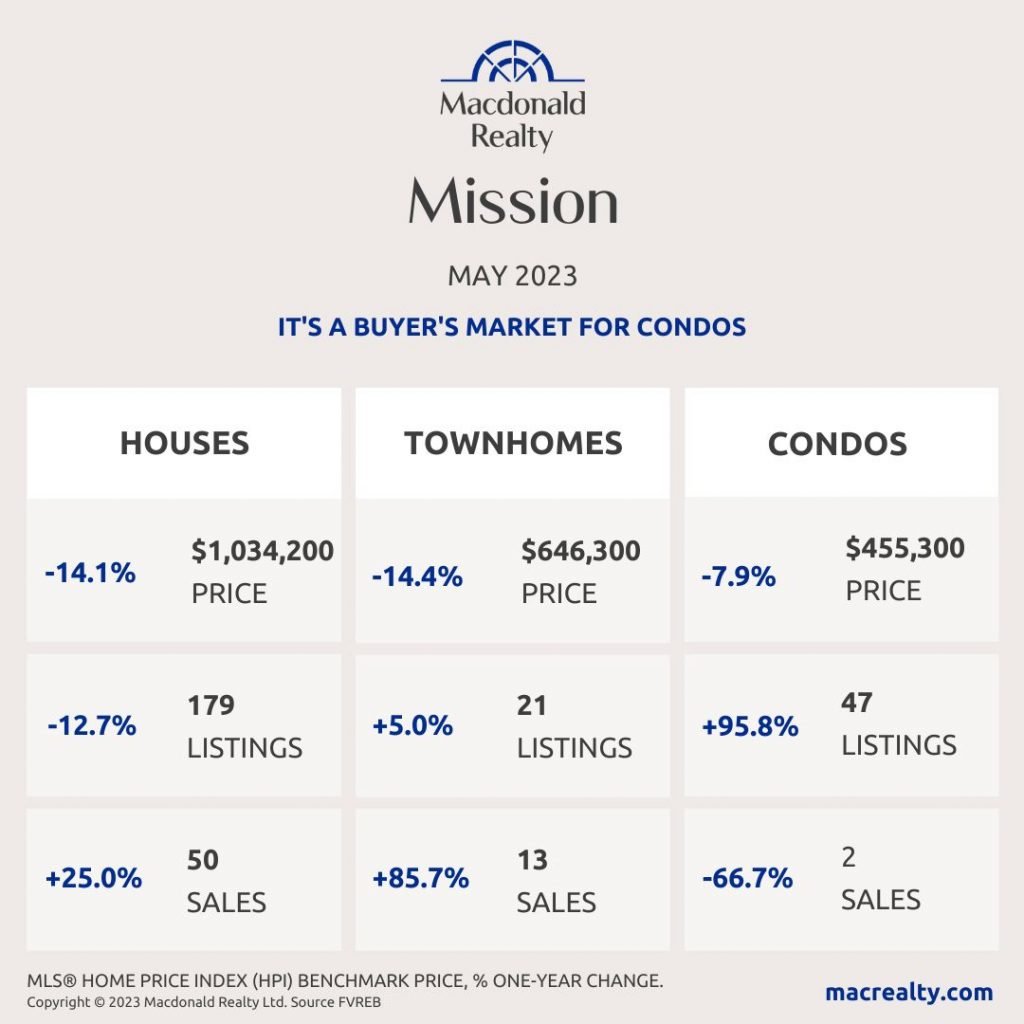
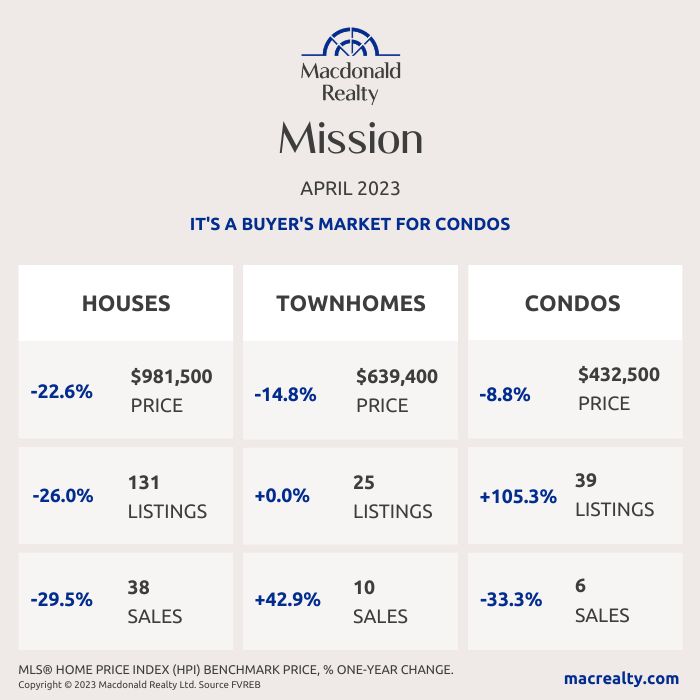
Mission
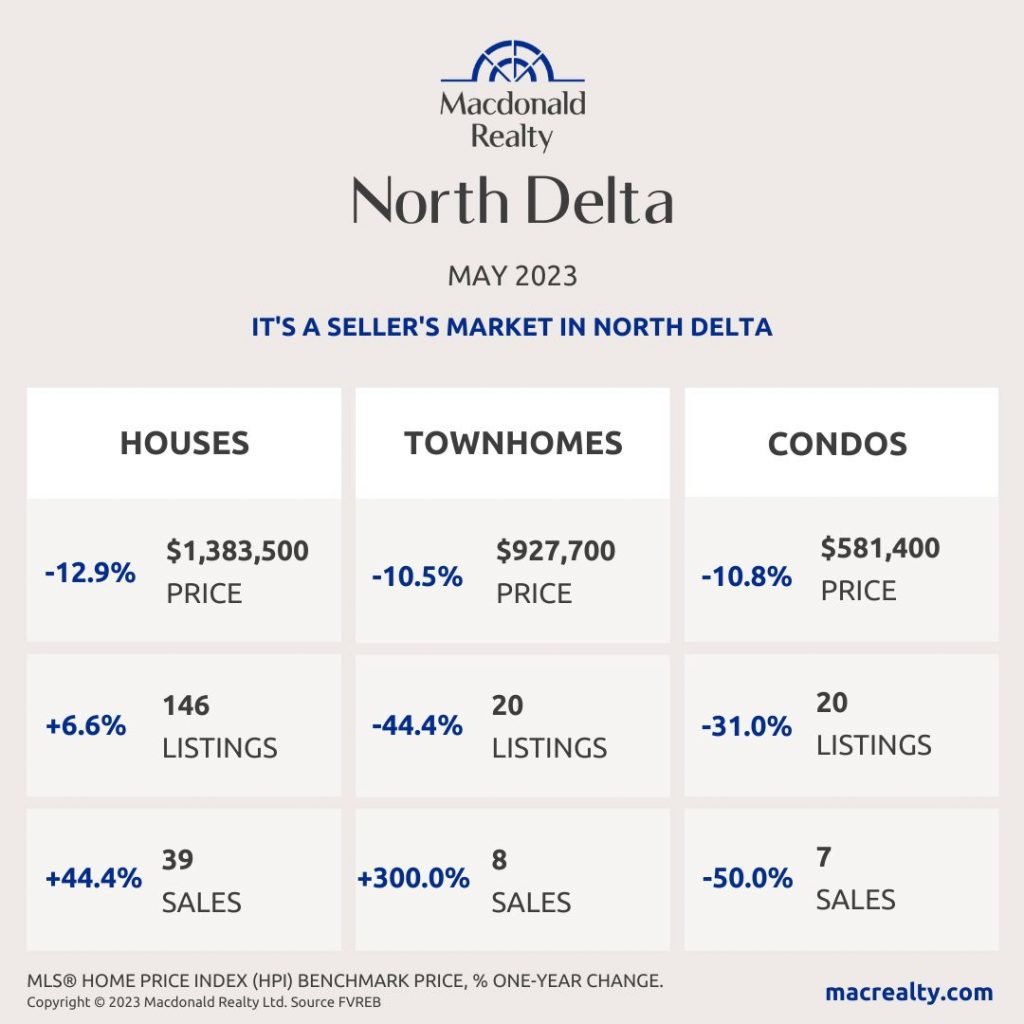
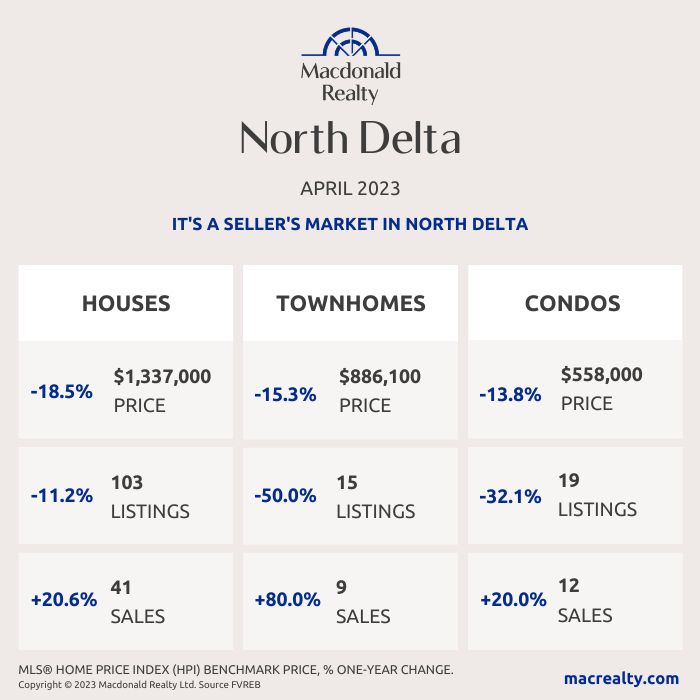
North Delta
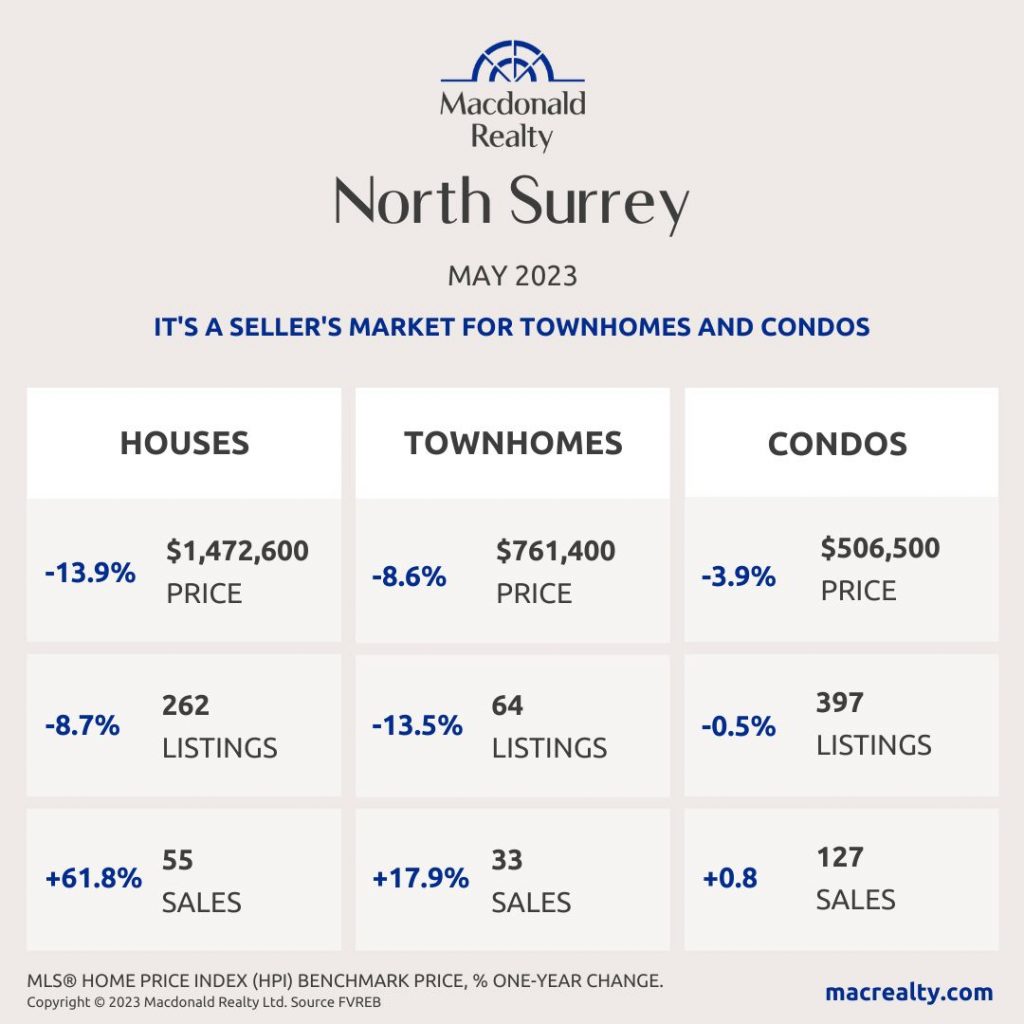
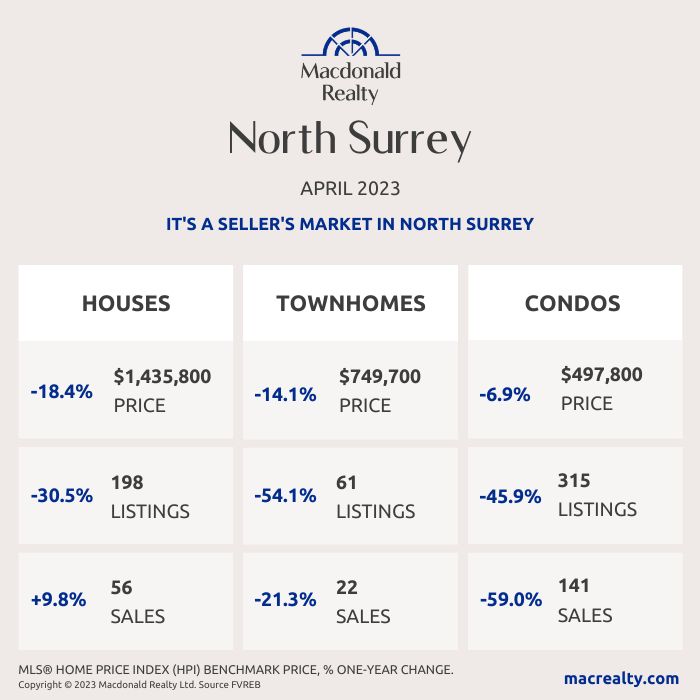
North Surrey
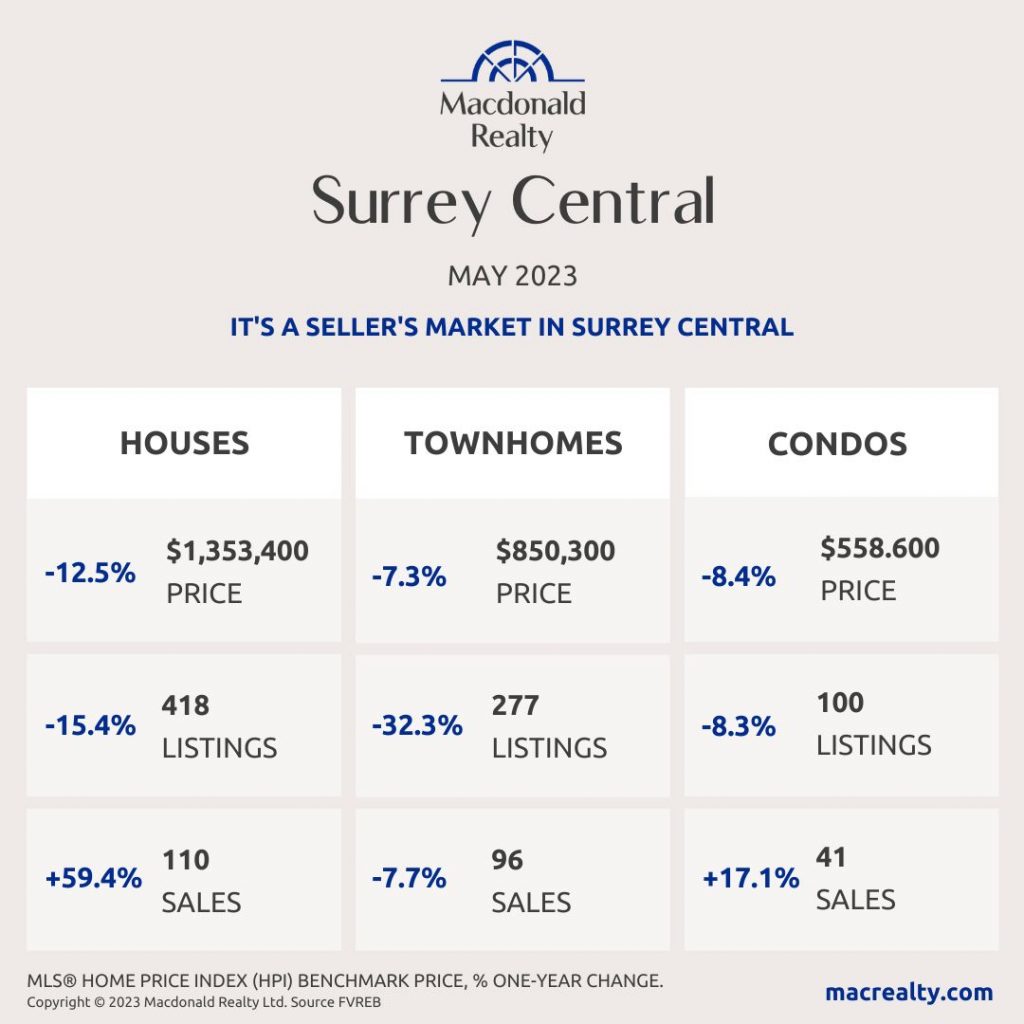
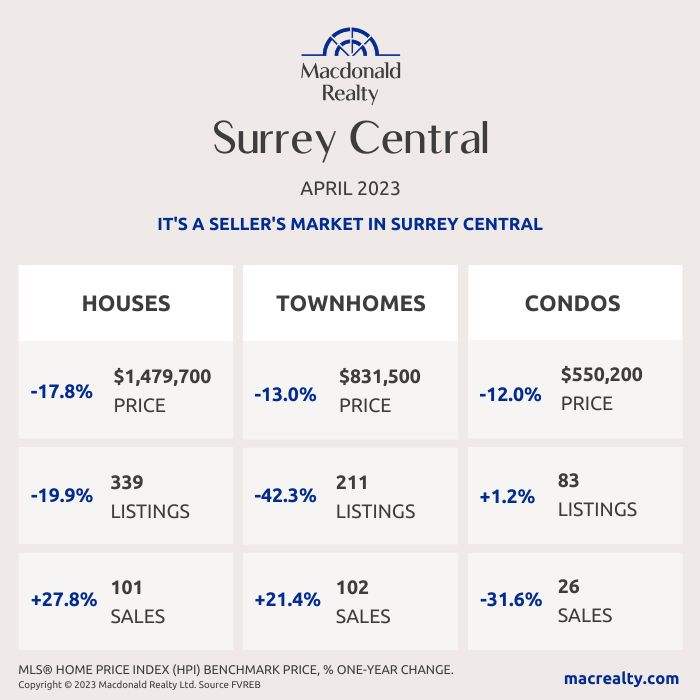
Surrey Central
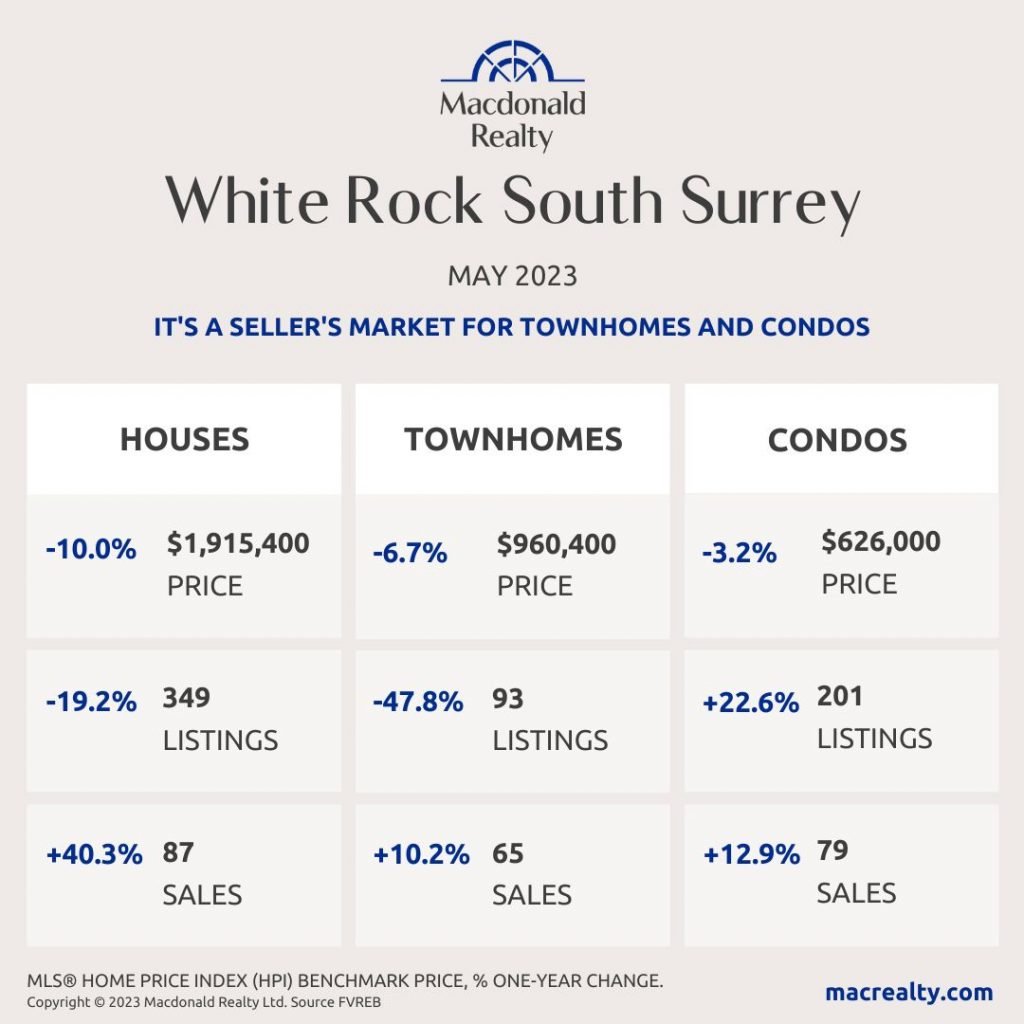
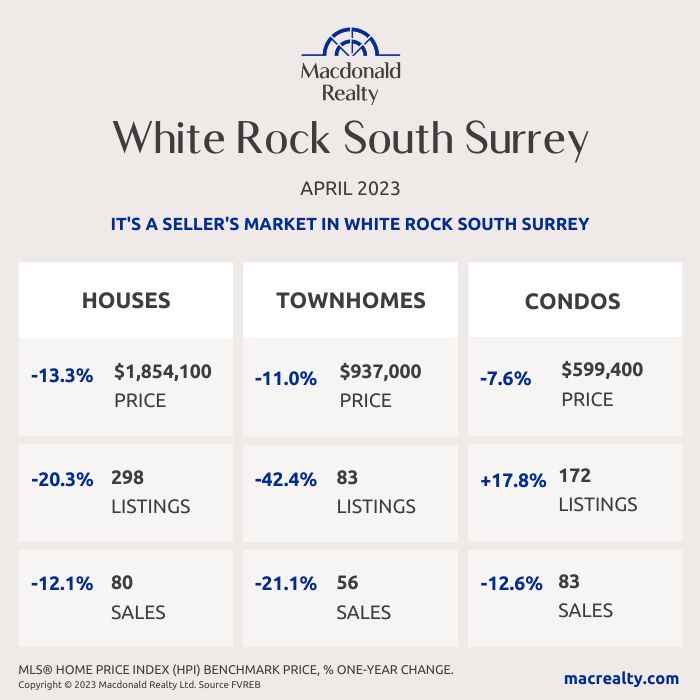
White Rock / South Surrey
Looking for more information about the real estate market in specific neighbourhoods in Surrey, Langley and Fraser Valley?
Macdonald Realty has offices in North Delta, White Rock/South Surrey, and Langley. Please email [email protected] or call 1-877-278-3888 to be matched with a REALTOR® working in your area.
MLS® Home Price Index (HPI) Benchmark Price
Average and median home prices are often misinterpreted, are affected by change in the mix of homes sold, and can swing dramatically from month to month (based on the types and prices of properties that sold in a given month). The MLS® HPI overcomes these shortcomings and uses the concept of a benchmark home, a notional home with common attributes of typical homes in a defined area. Visit www.housepriceindex.ca for more information.
This blog post is based on market data provided by the Fraser Valley Real Estate Board (FVREB) www.fvreb.bc.ca
by Macrealty Marketing Team | Jun 6, 2023 | Market Updates
Here are the latest real estate market statistics from Macdonald Realty on the Greater Vancouver listings and sales in May 2023. Find all the infographics by visiting the Facebook Album.
While the year started slower than usual, Metro Vancouver’s1 housing market is showing signs of heating up as summer arrives, with prices increasing for the sixth consecutive month. The Real Estate Board of Greater Vancouver (REBGV) reports that residential home sales in the region totalled 3,4112 in May 2023, which is a 15.7 per cent increase from the 2,947 sales recorded in May 2022, and a 1.4 per cent decline from the 10-year seasonal average (3,458).
““Back in January, few people would have predicted prices to be up as much as they are – ourselves included,” Andrew Lis, REBGV’s director of economics and data analytics said. “Our forecast projected prices to be up modestly in 2023 by about two per cent at year-end. Instead, Metro Vancouver home prices are already up about six per cent or more across all home types at the midway point of the year.
There were 5,661 detached, attached and apartment properties newly listed for sale on the Multiple Listing Service® (MLS®) in Metro Vancouver in May 2023. This represents an 11.5 per cent decrease compared to the 6,397 homes listed in May 2022, and was 4.3 per cent below the 10-year seasonal average (5,917). The total number of homes currently listed for sale on the MLS® system in Metro Vancouver is 9,293, a 10.5 per cent decrease compared to May 2022 (10,382), and 20.6 per cent below the 10-year seasonal average (11,705).
Across all detached, attached and apartment property types, the sales-to-active listings ratio for May 2023 is 38.4 per cent. By property type, the ratio is 28.5 per cent for detached homes, 45 per cent for townhomes, and 45.5 per cent for apartments. Analysis of the historical data suggests downward pressure on home prices occurs when the ratio dips below 12 per cent for a sustained period, while home prices often experience upward pressure when it surpasses 20 per cent over several months.
“You don’t have to squint to see the reason prices continue to increase. The fundamental issue remains that there are more buyers relative to the number of willing sellers in the market. This is keeping the amount of resale homes available in short supply,” Lis said. “And in a surprising twist, MLS® sales in May snapped back closer to historical averages than we’ve seen in the recent past, despite mortgage rates being where they are now, and new listing activity having been slower than usual this spring. If mortgage rates weren’t holding back market activity so much right now, I think our market would look a lot like the heydays of 2021/22, or even 2016/17.”
The MLS® Home Price Index composite benchmark price for all residential properties in Metro Vancouver is currently $1,188,0003. This represents a 5.6 per cent decrease over May 2022 and a 1.3 per cent increase compared to April 2023.
*Areas covered by the Real Estate Board of Greater Vancouver include Burnaby, Coquitlam, Maple Ridge, New Westminster, North Vancouver, Pitt Meadows, Port Coquitlam, Port Moody, Richmond, South Delta, Squamish, Sunshine Coast, Vancouver, West Vancouver, and Whistler. Check out the infographics of Squamish, Sunshine Coast and Whistler, HERE.
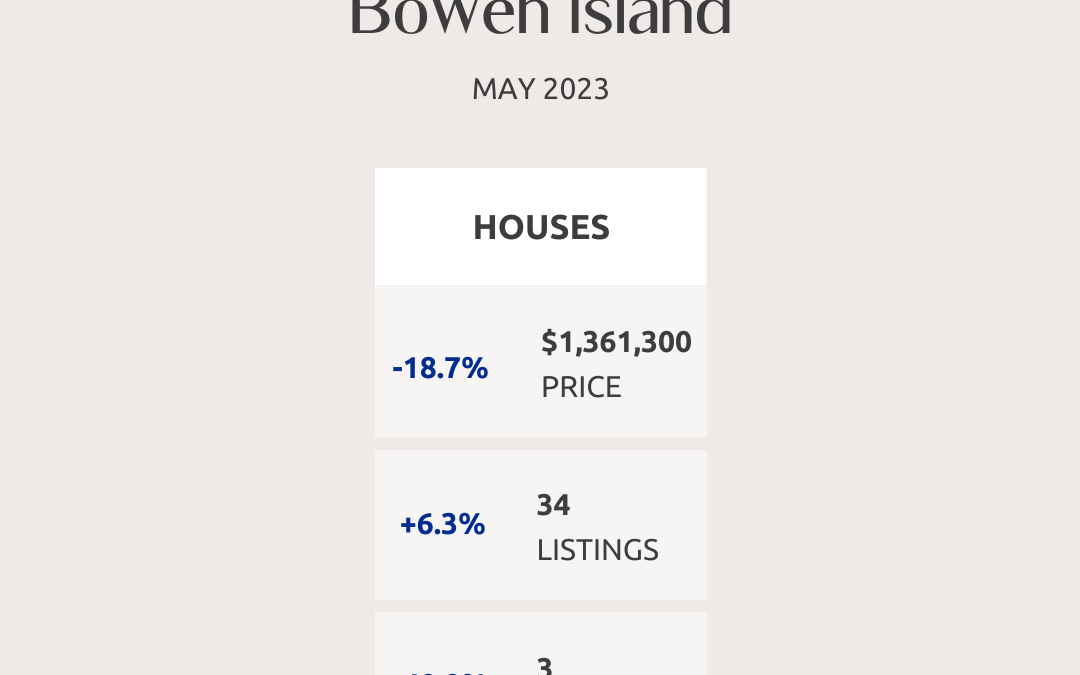
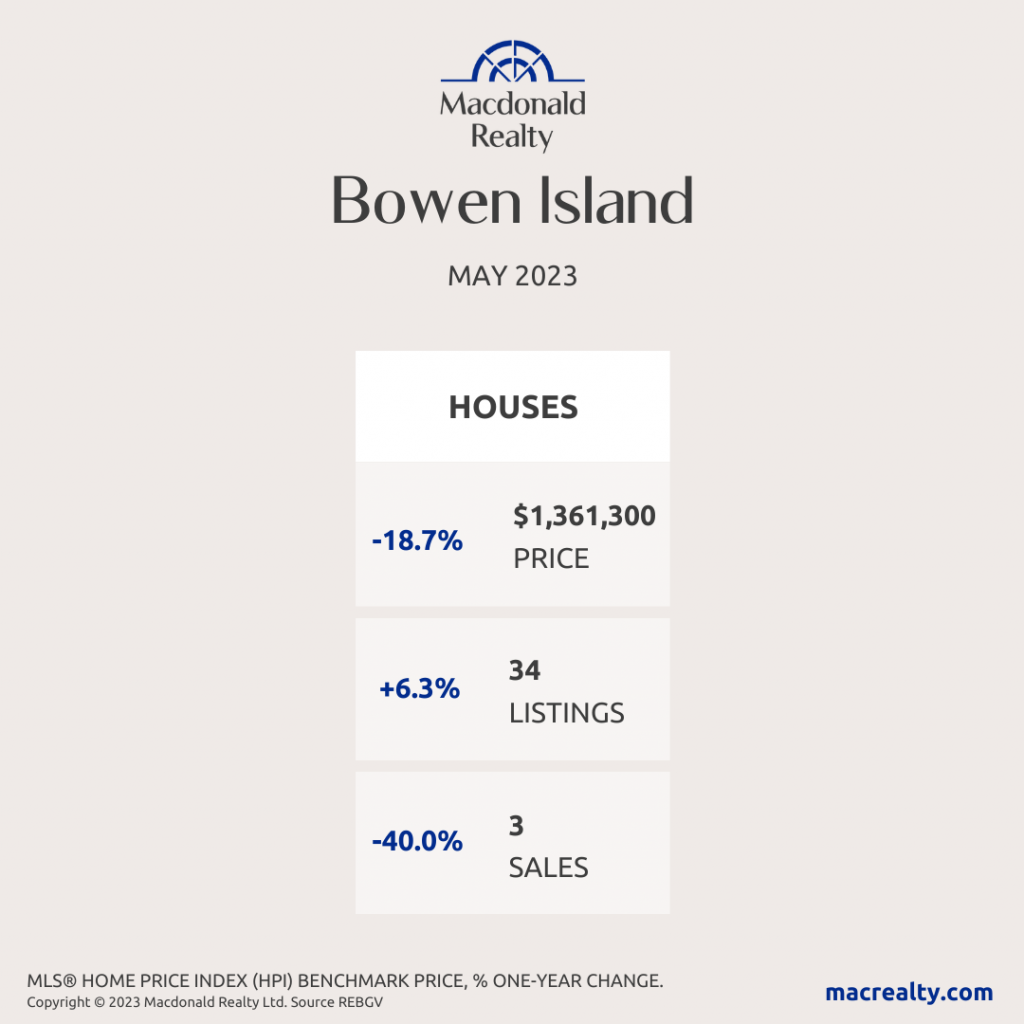
Bowen Island
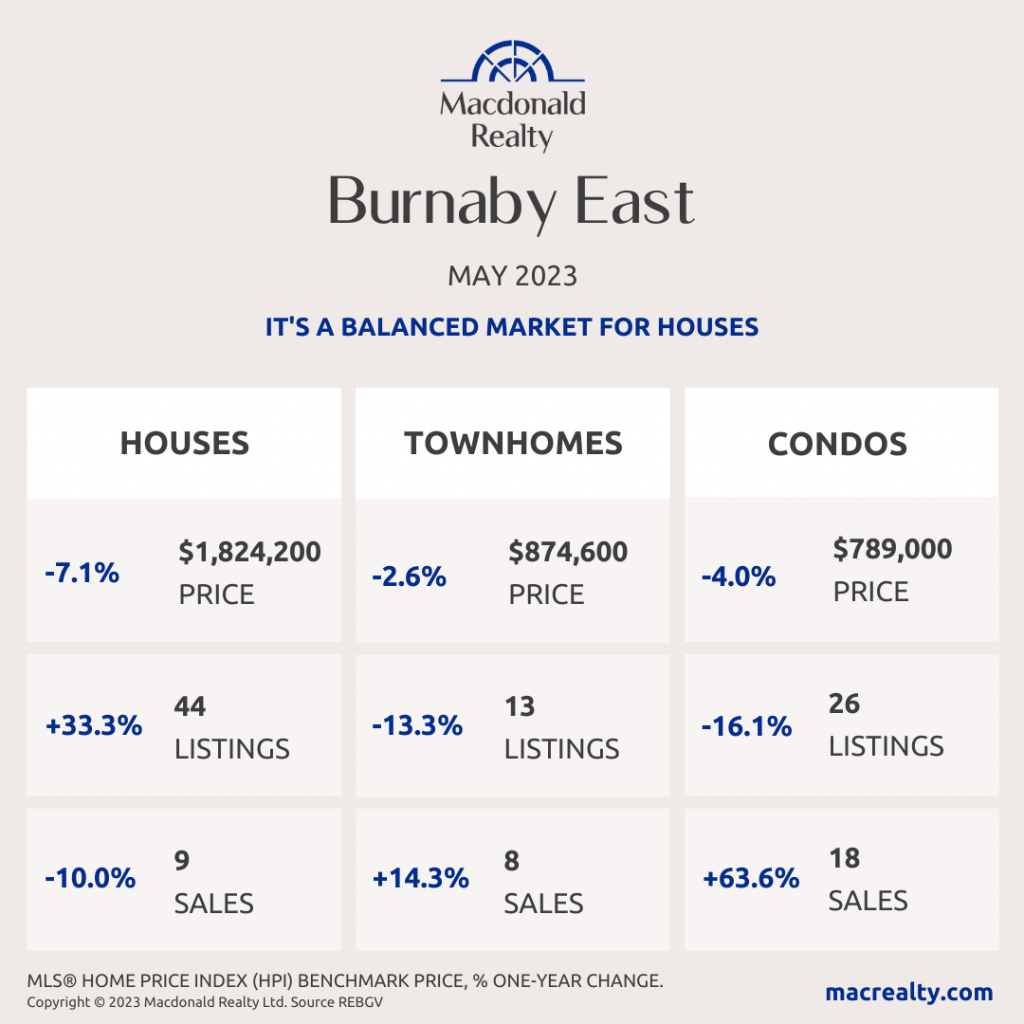
Burnaby East
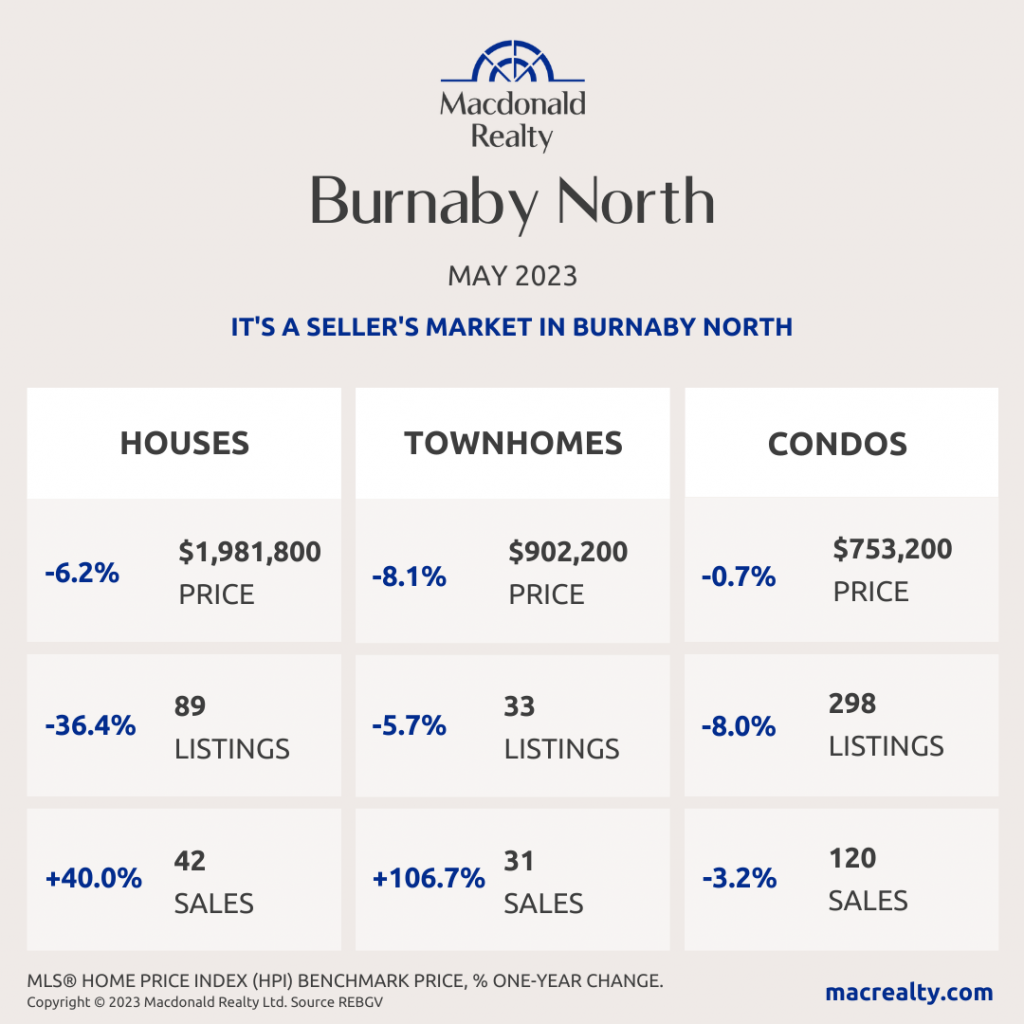
Burnaby North
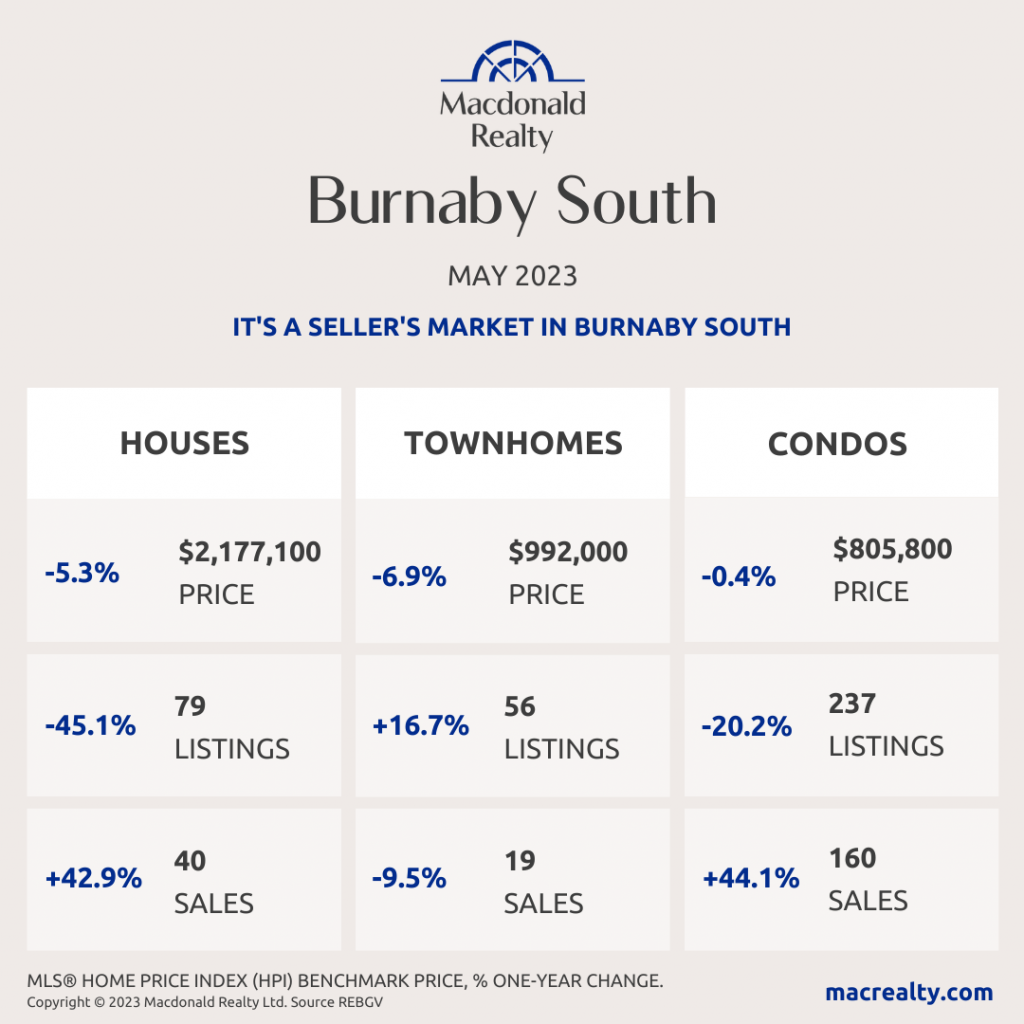
Burnaby South
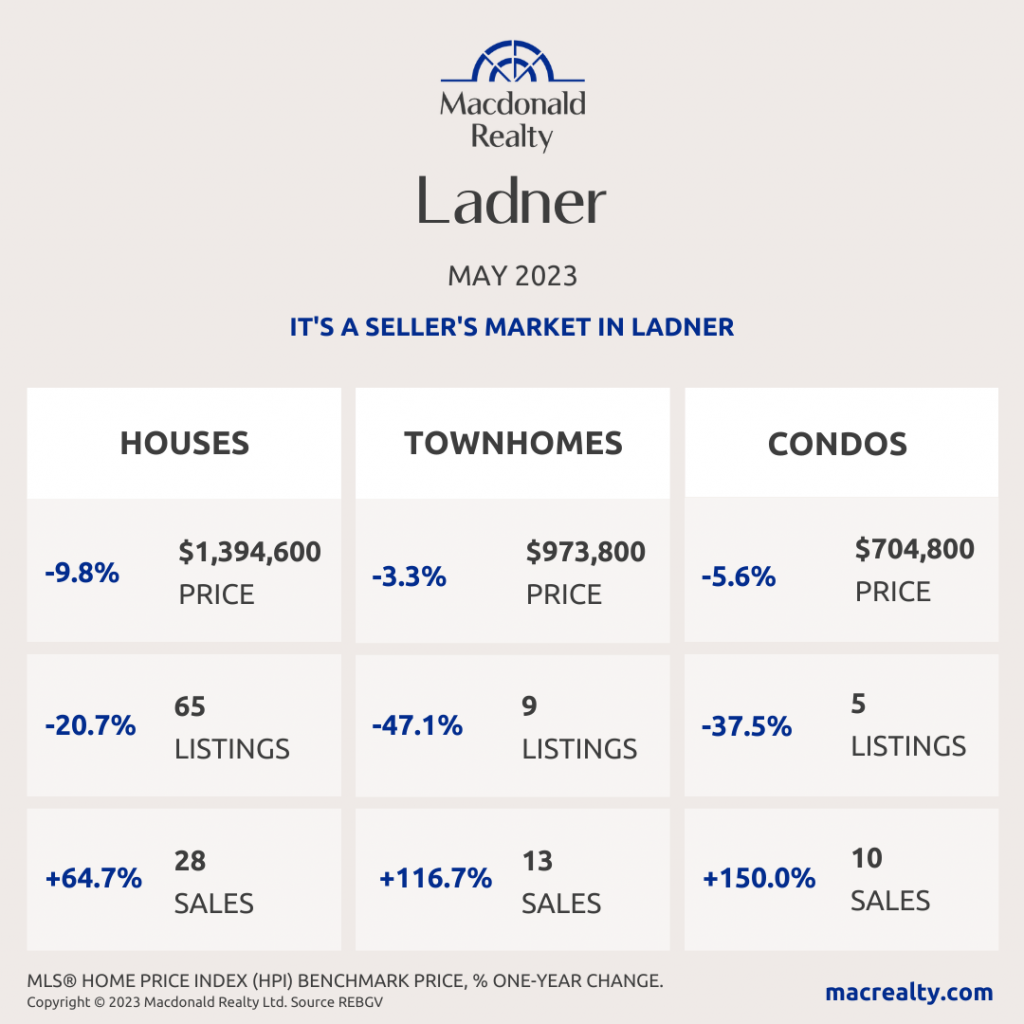
Ladner
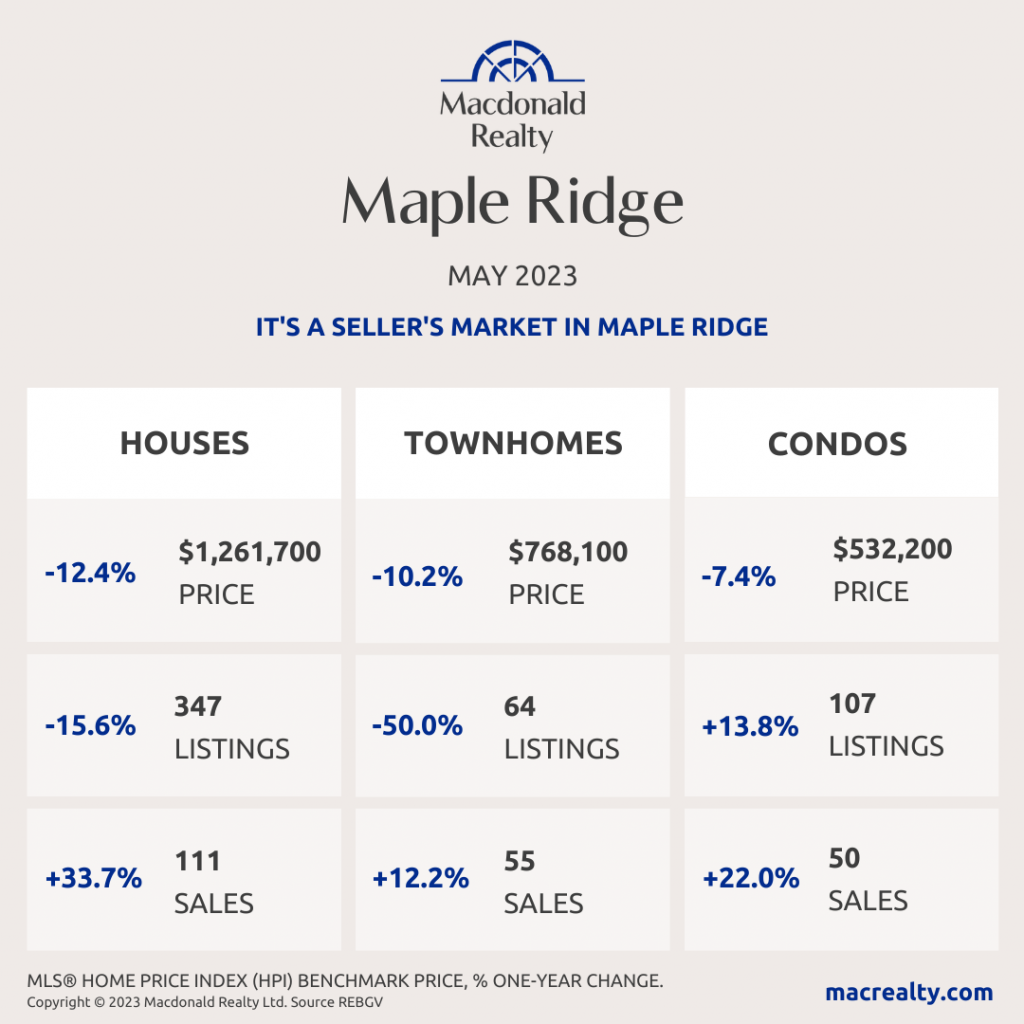
Maple Ridge
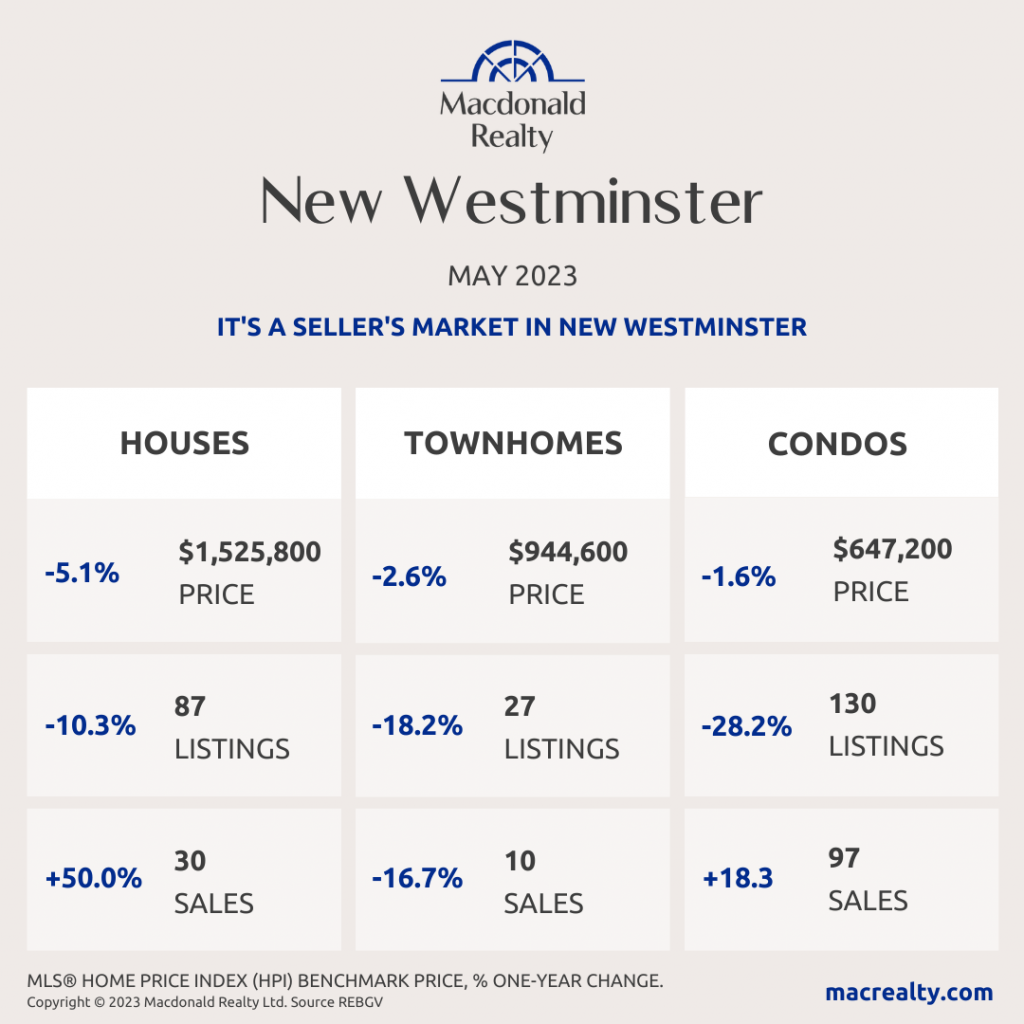
New Westminster
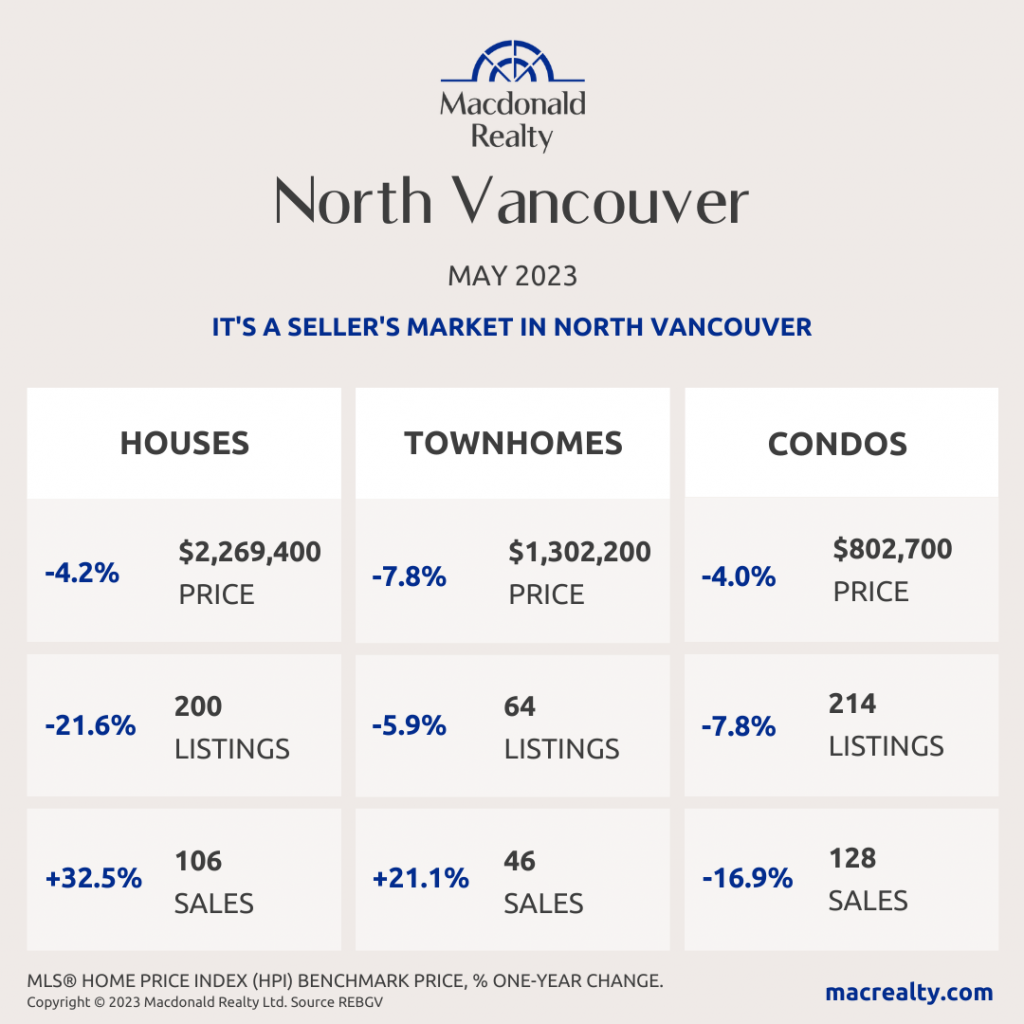
North Vancouver
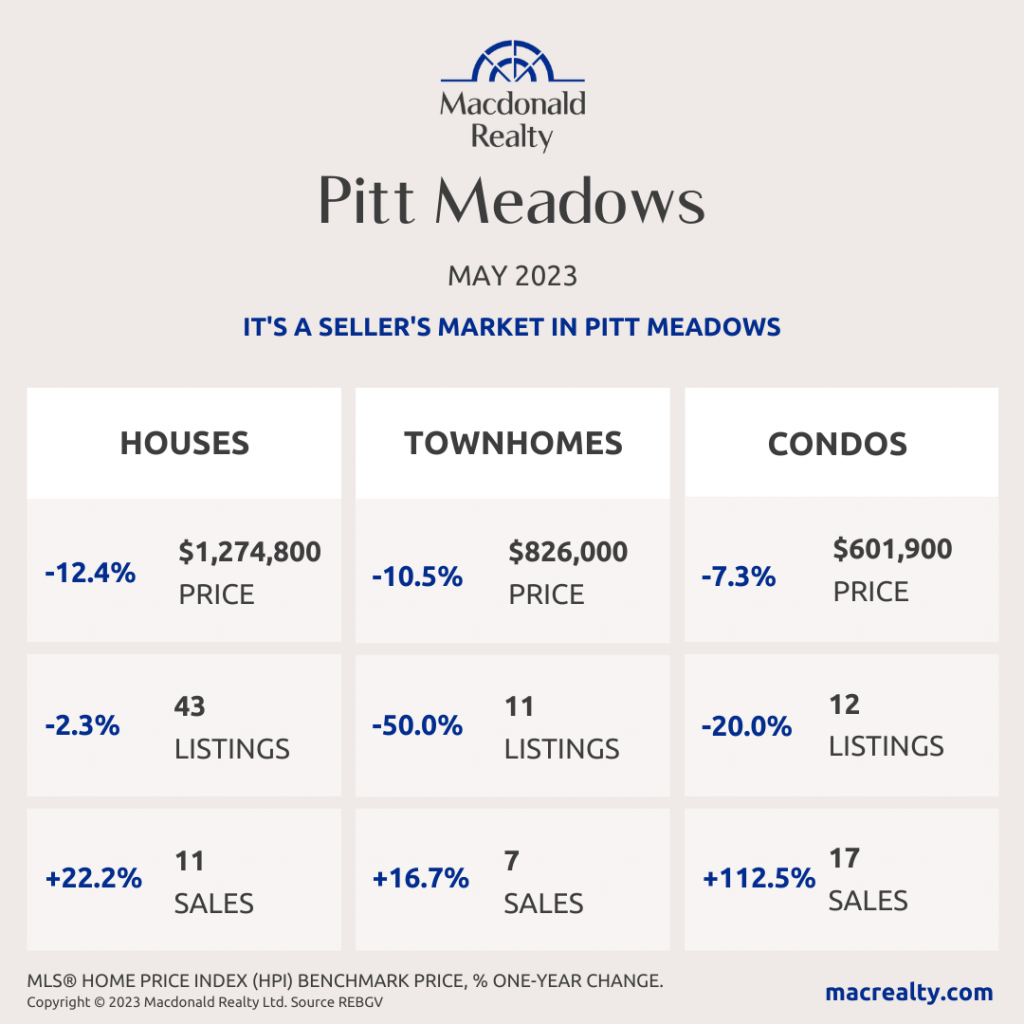
Pitt Meadows
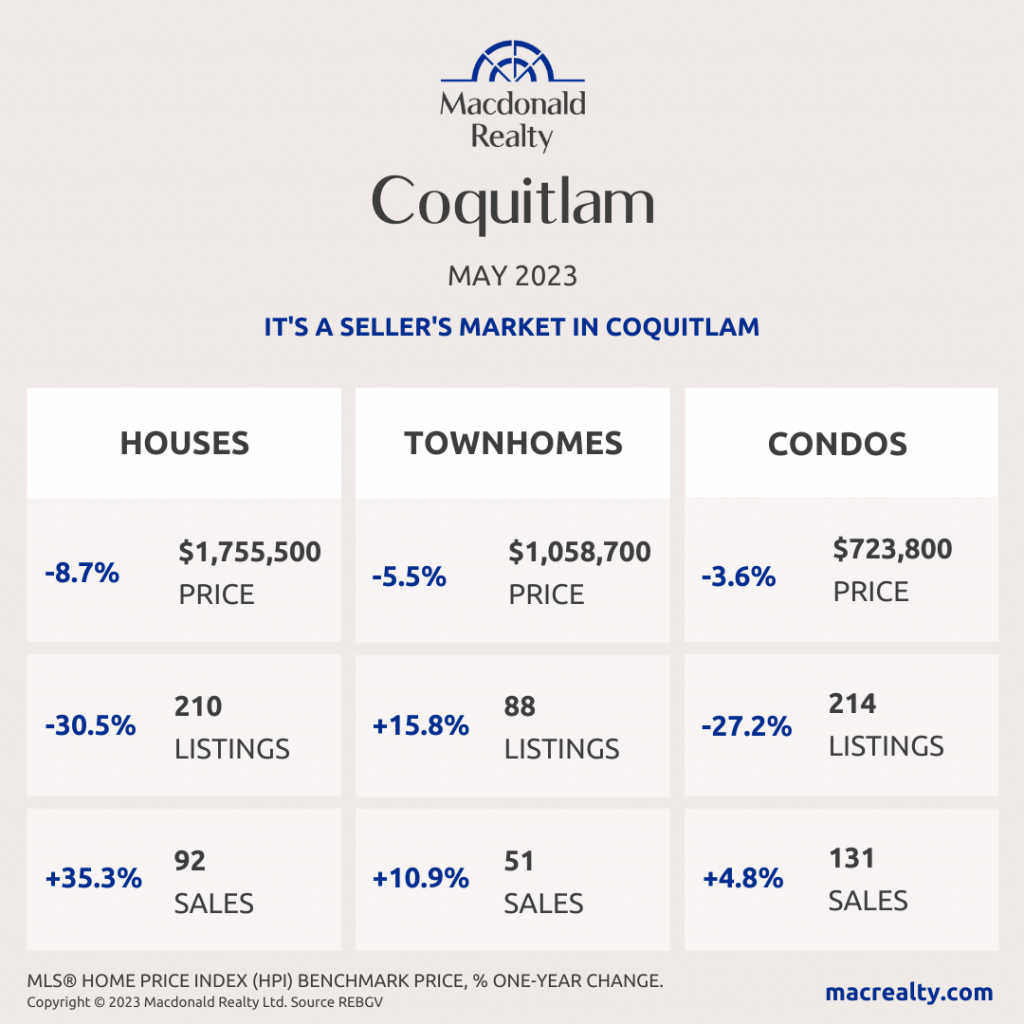
Coquitlam
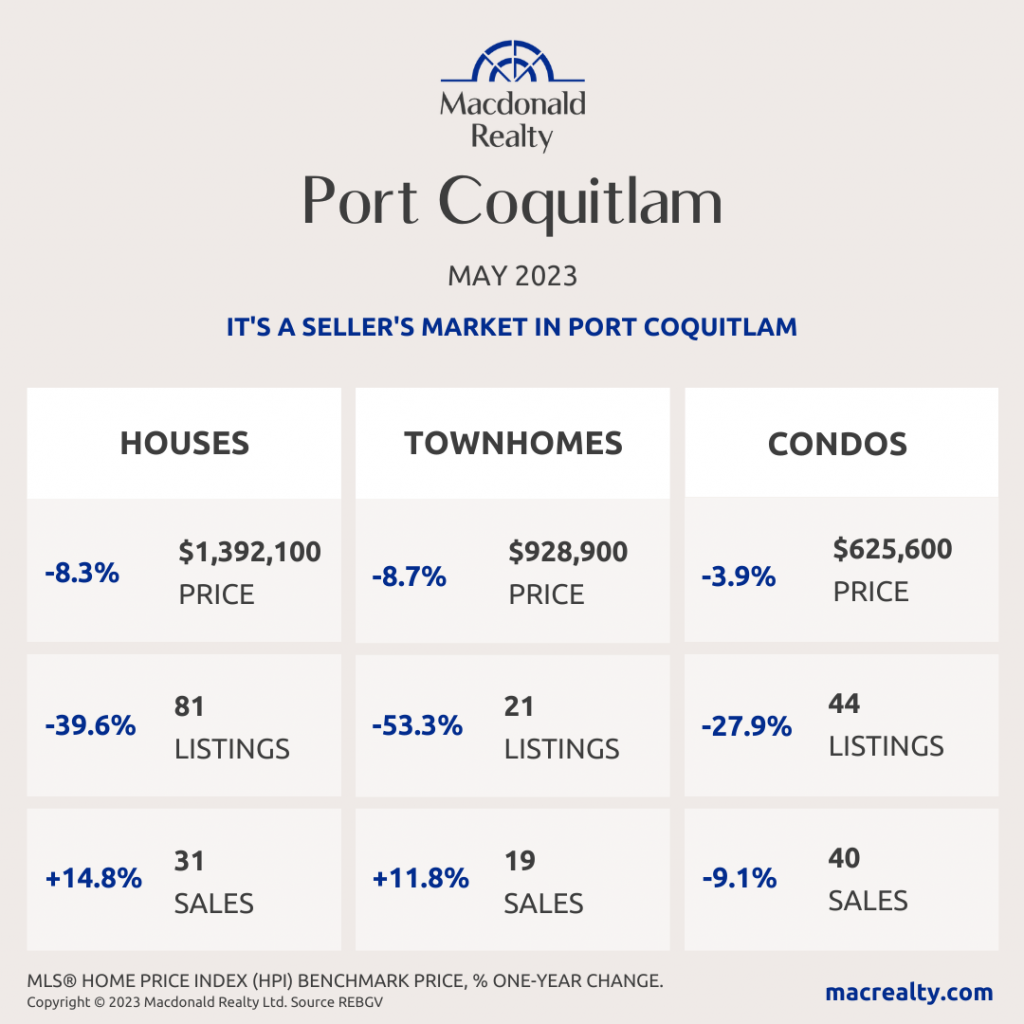
Port Coquitlam
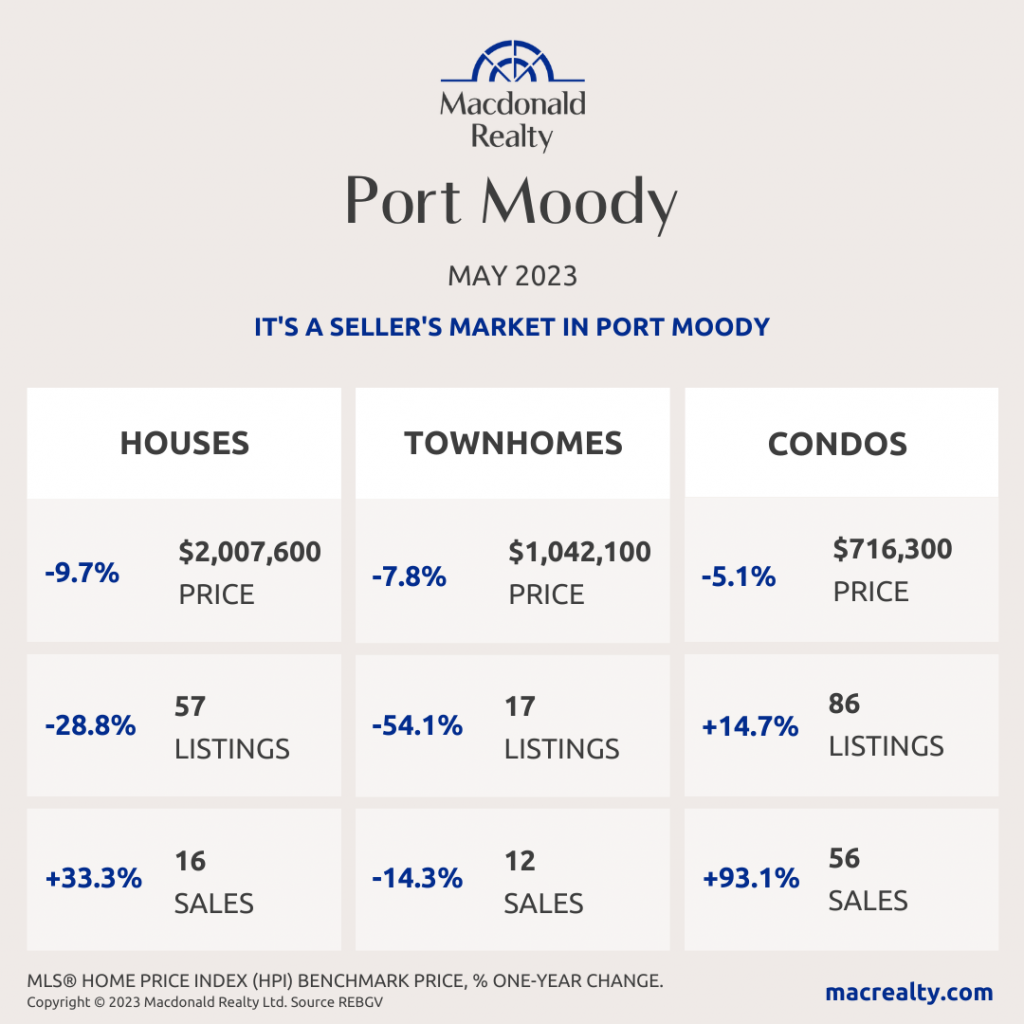
Port Moody
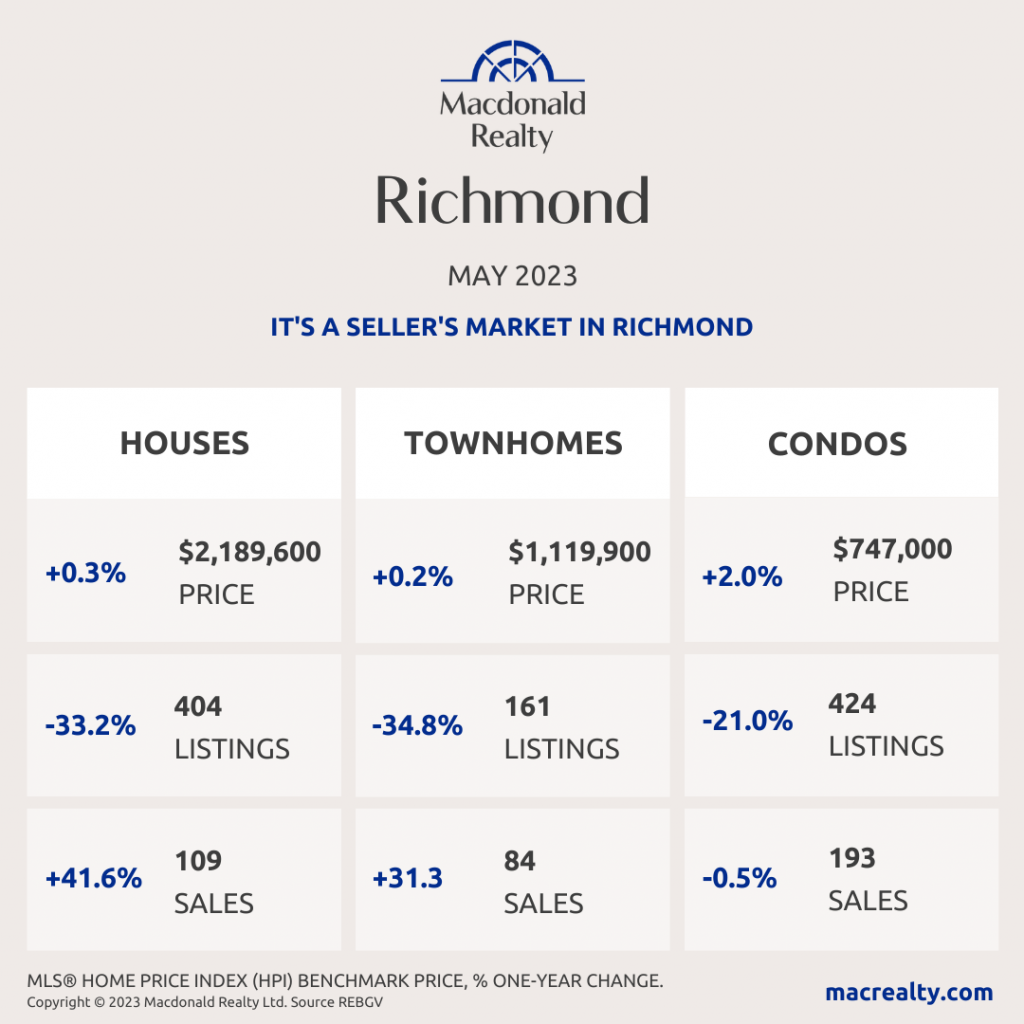
Richmond
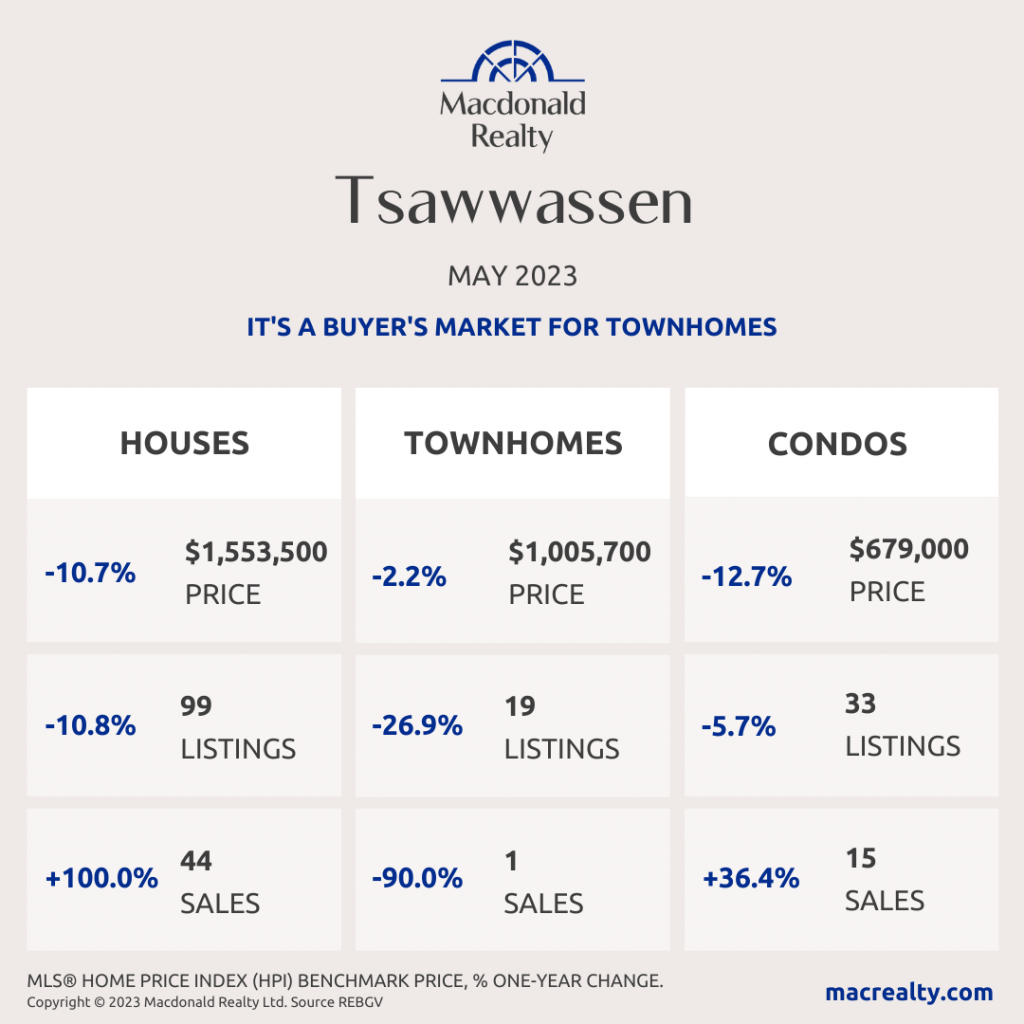
Tsawwassen
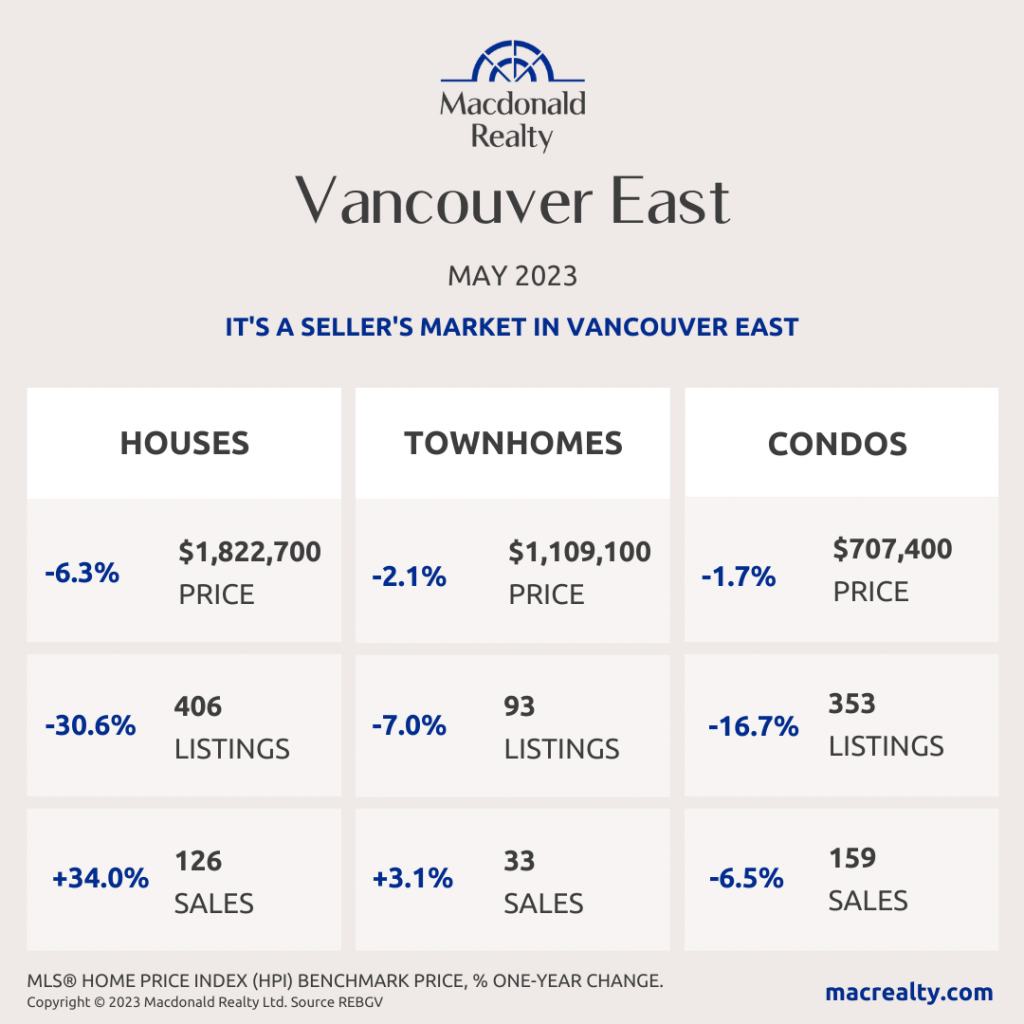
Vancouver East
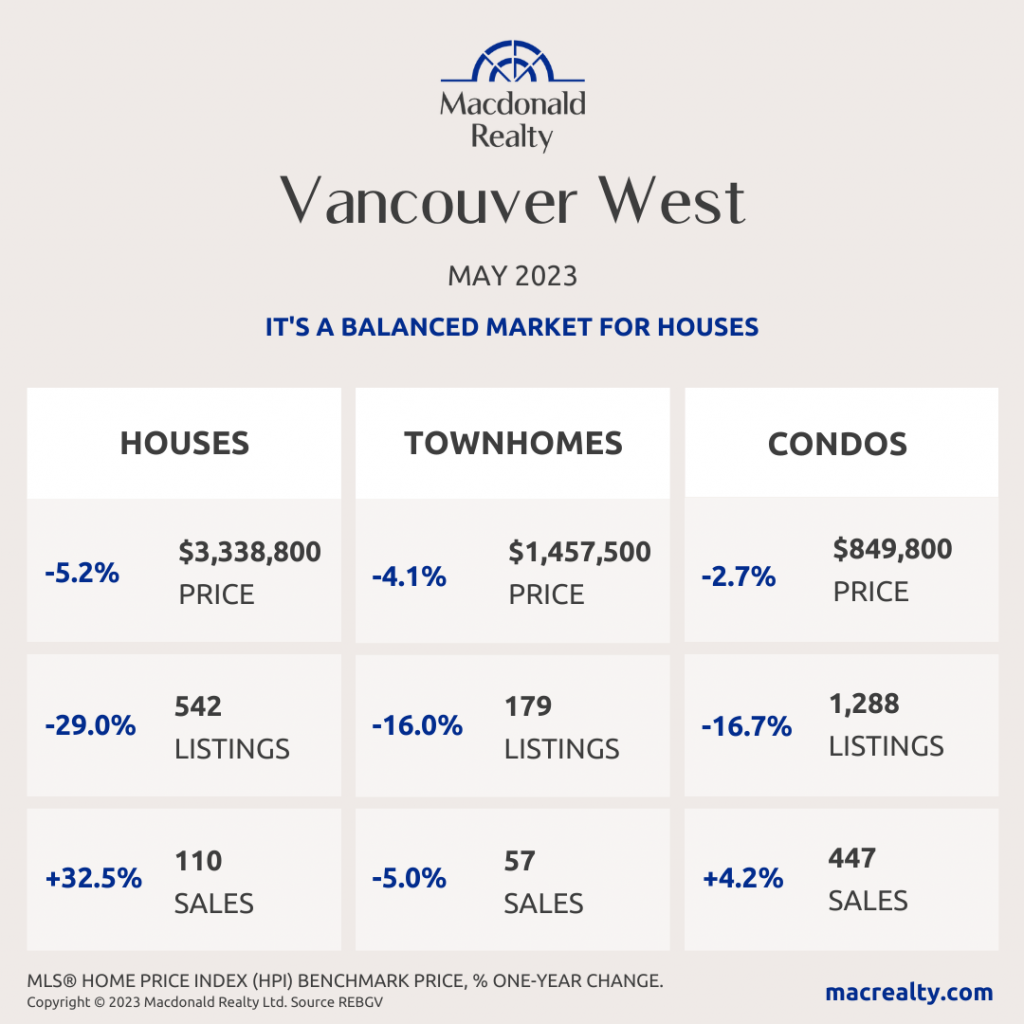
Vancouver West
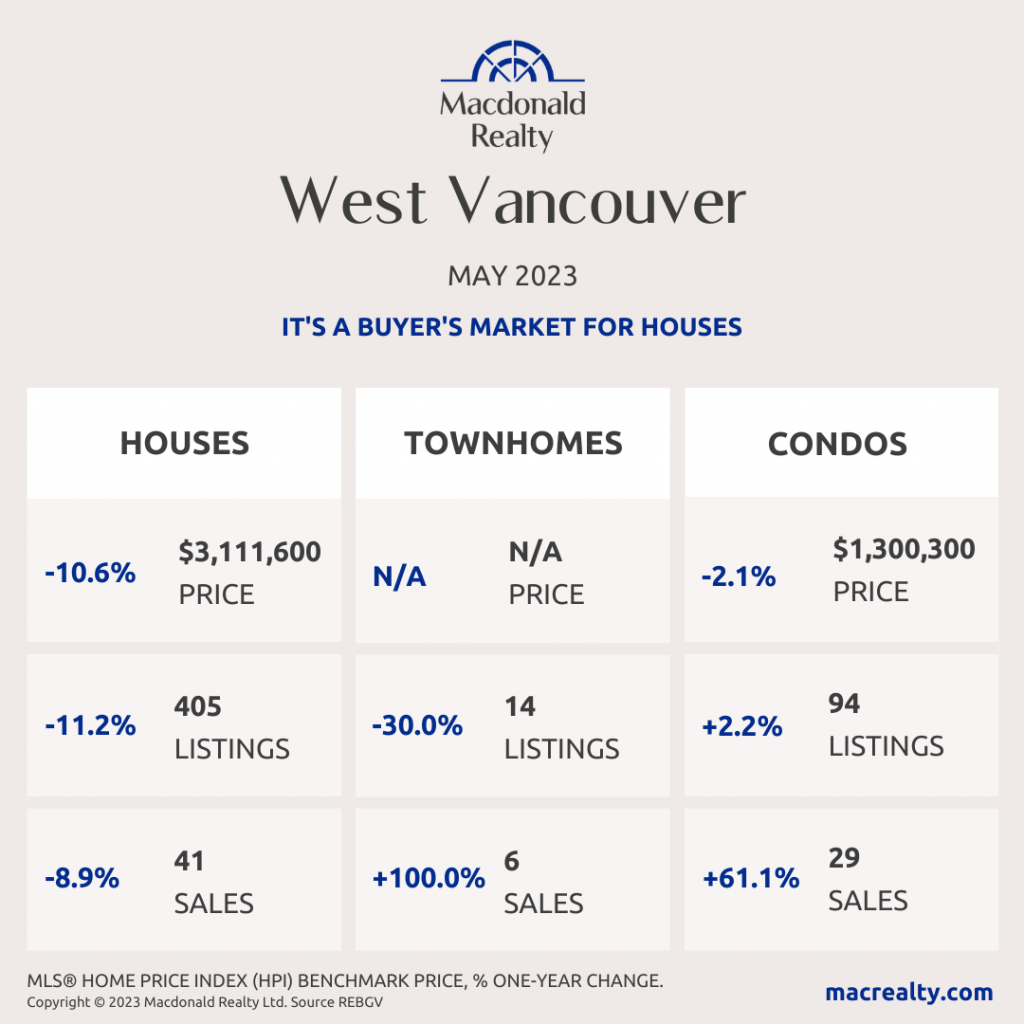
West Vancouver
Looking for more information about the real estate market in specific neighbourhoods in the Greater Vancouver?
Macdonald Realty has offices across the Greater Vancouver. Please email [email protected] or call 1-877-278-3888 to be matched with a REALTOR® working in your area.
MLS® Home Price Index (HPI) Benchmark Price
Average and median home prices are often misinterpreted, are affected by change in the mix of homes sold, and can swing dramatically from month to month (based on the types and prices of properties that sold in a given month). The MLS® HPI overcomes these shortcomings and uses the concept of a benchmark home, a notional home with common attributes of typical homes in a defined area. Visit www.housepriceindex.ca for more information.
This blog post is based on market data provided by the Real Estate Board of Greater Vancouver (REBGV) www.rebgv.org
by Macrealty Marketing Team | Jun 6, 2023 | Market Updates
Here are the latest real estate market statistics from Macdonald Realty on Squamish, Whistler, and Sunshine Coast listings and sales in May 2023.
Find all the infographics related to the May Market Statistics by visiting the Facebook Album.
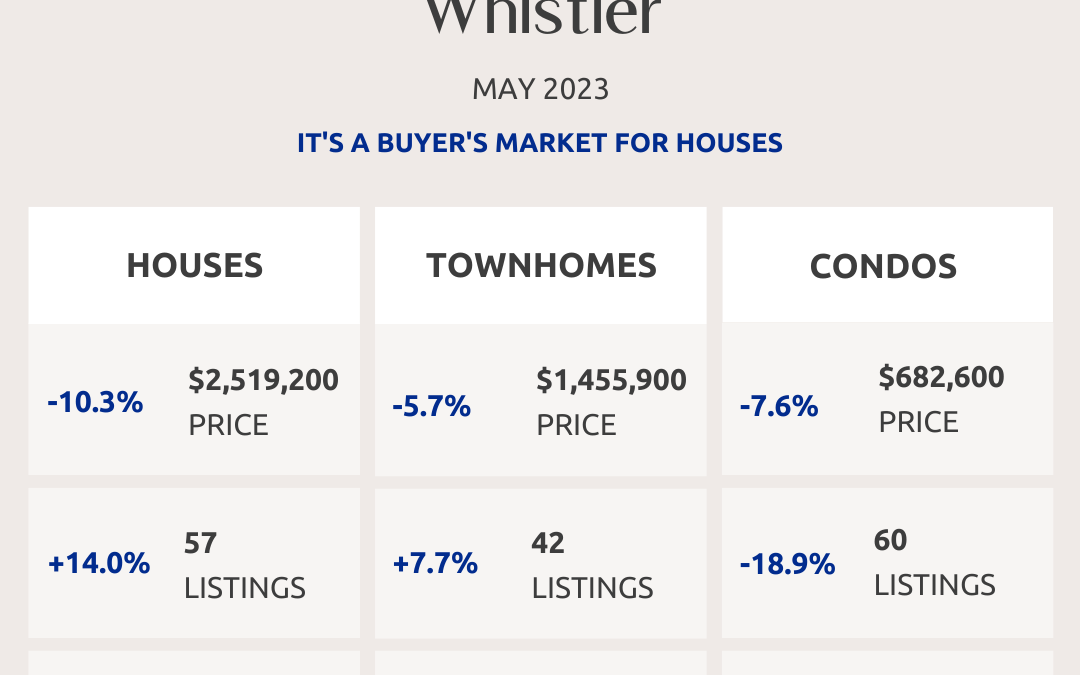
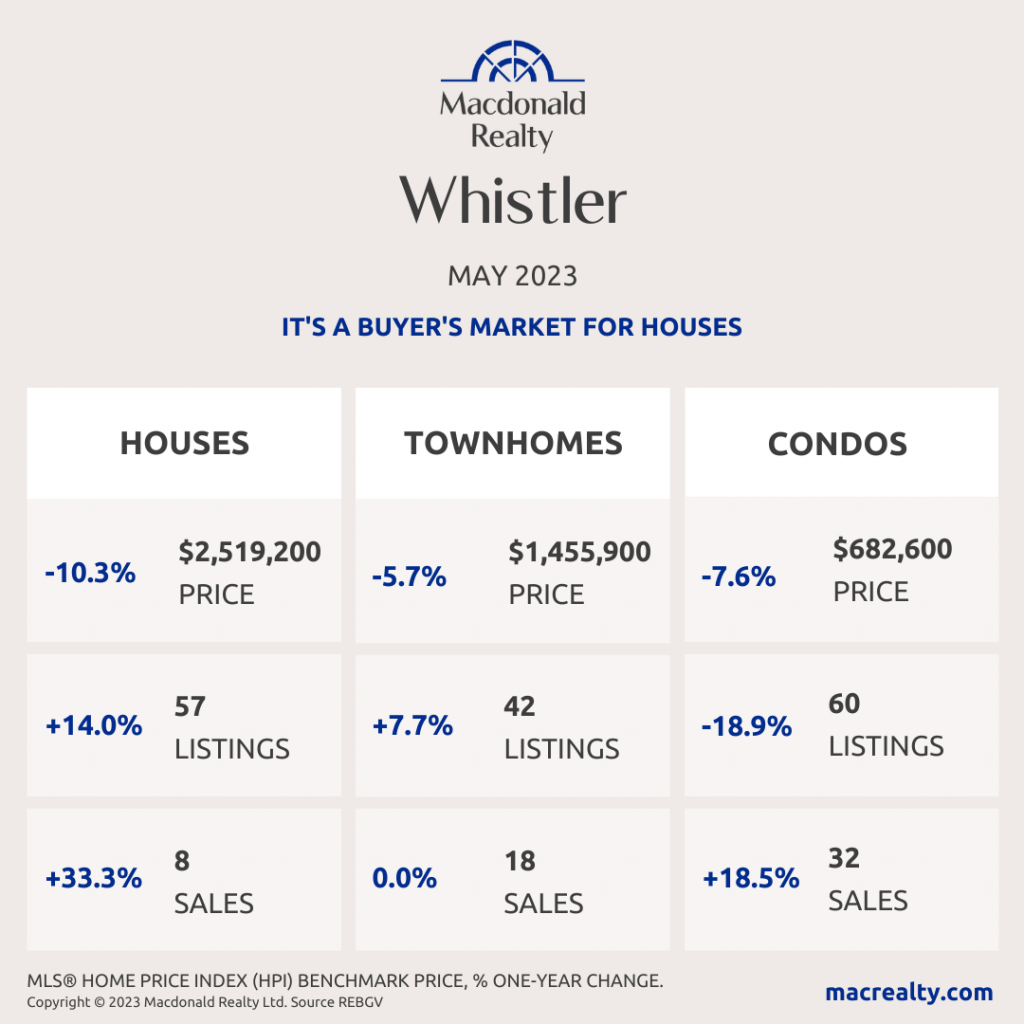
Whistler
In May 2023, there were 9 sales of detached homes and 54 active listings. The benchmark sale price was $2,519,200.
The condo market had 32 sales and 60 active listings at the end of the month. The benchmark sale price was $682,600.
The townhome market had 18 sales and the active listings were 42. The benchmark sale price was $1,455,900.
It’s a buyer’s market for houses in Whistler.
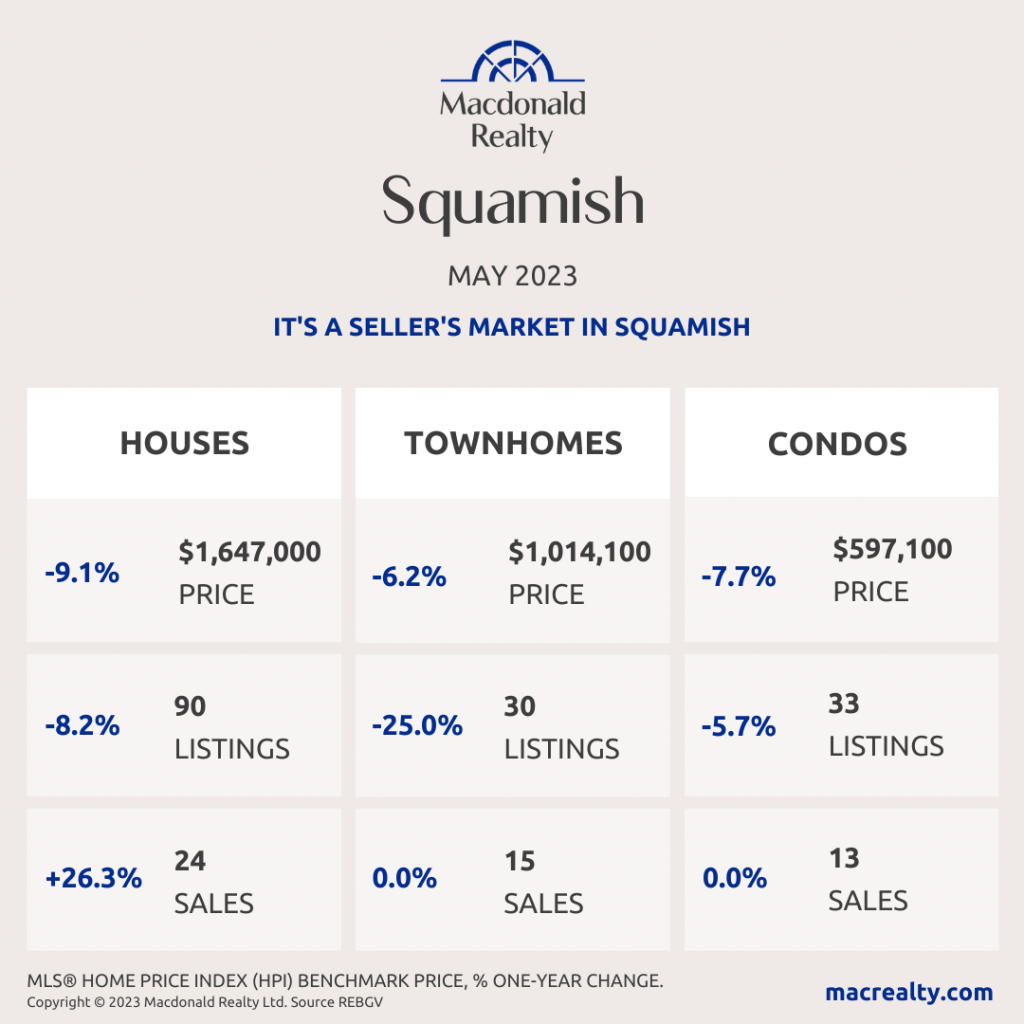
Squamish
In May 2023, there were 24 sales of detached homes and 90 active listings. The benchmark sale price was $1,647,000.
The condo market had 13 sales and 33 active listings at the end of the month. The benchmark sale price was $597,100.
The townhome market had 15 sales and the active listings were 30. The benchmark sale price was $1,014,100.
It’s a seller’s market in Squamish.
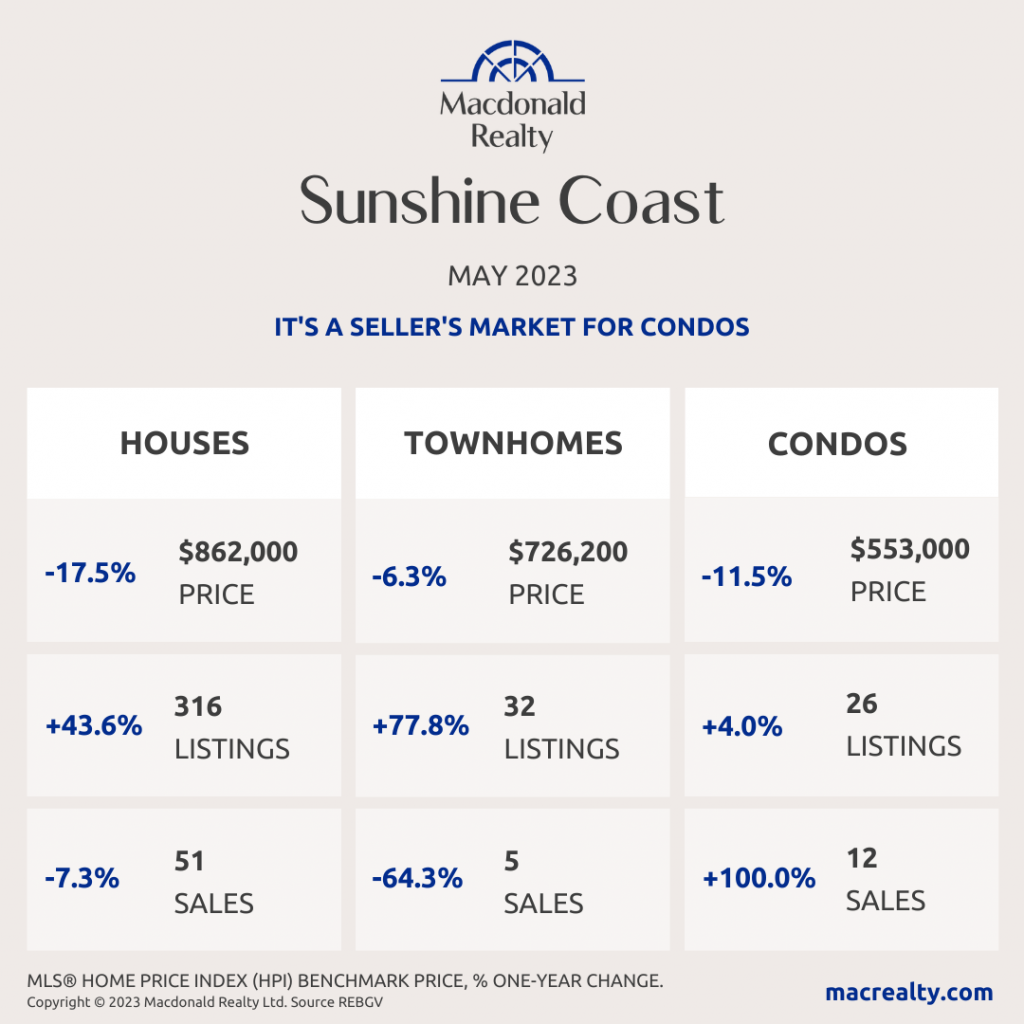
Sunshine Coast
In May 2023, there were 51 sales of detached homes and 316 active listings. The benchmark sale price was $862,000.
The condo market had 5 sales and 32 active listings at the end of the month.
The townhome market had 12 sales and, the active listings were 26.
It’s a seller’s market for condos in Sunshine Coast.
Looking for more information about the real estate market in specific neighbourhoods in Squamish, Whistler, and Sunshine Coast? Macdonald Realty has offices in Squamish, Whistler, and Sunshine Coast. Please email [email protected] or call 1-877-278-3888 to be matched with a REALTOR® working in your area.
MLS® Home Price Index (HPI) Benchmark Price
Average and median home prices are often misinterpreted, are affected by change in the mix of homes sold, and can swing dramatically from month to month (based on the types and prices of properties that sold in a given month). The MLS® HPI overcomes these shortcomings and uses the concept of a benchmark home, a notional home with common attributes of typical homes in a defined area. Visit www.housepriceindex.ca for more information.
This blog post is based on market data provided by the Real Estate Board of Greater Vancouver (REBGV) www.rebgv.org
by Macrealty Marketing Team | Jun 6, 2023 | Market Updates
June 2023 – Lower Mainland Monthly Update (REBGV & FVREB)
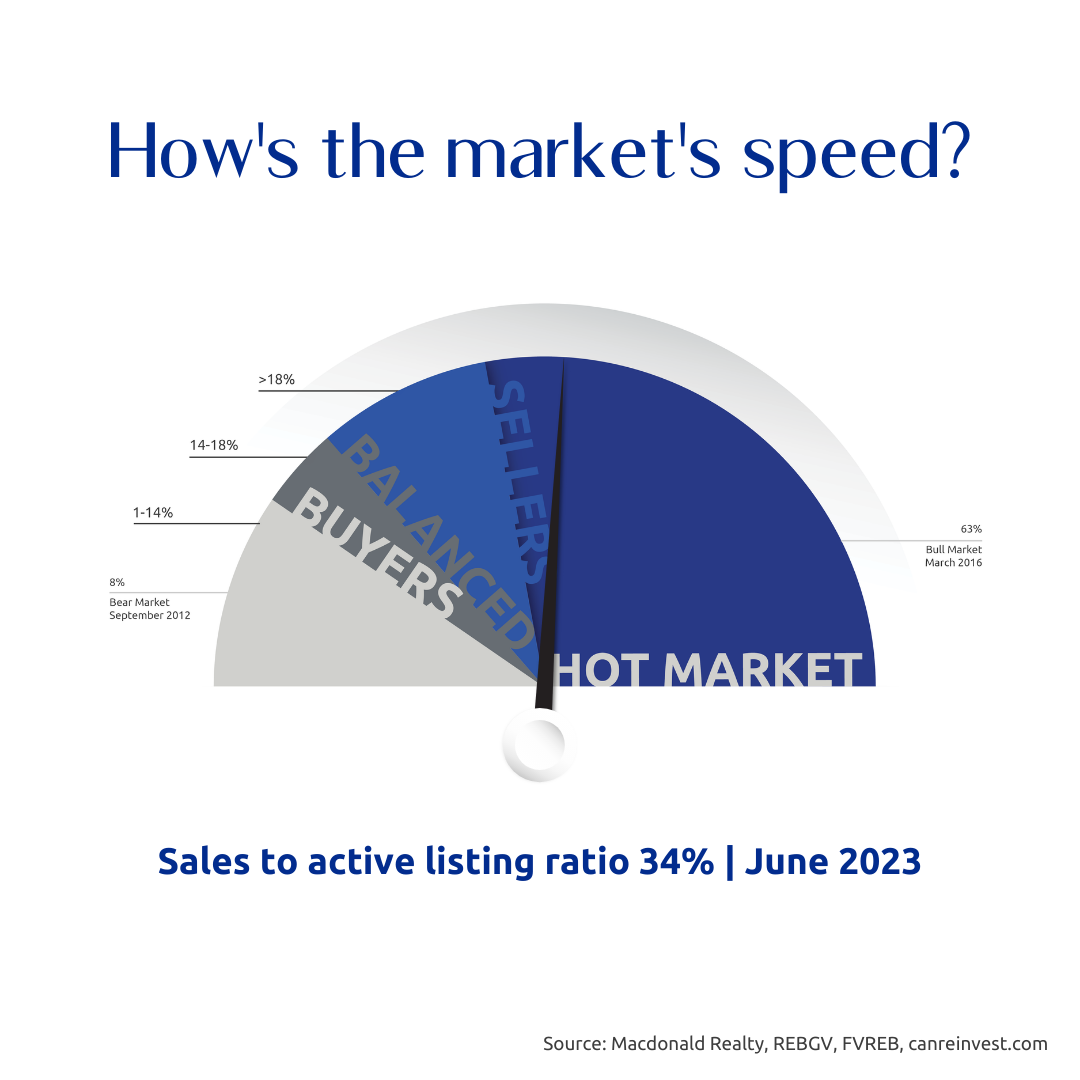
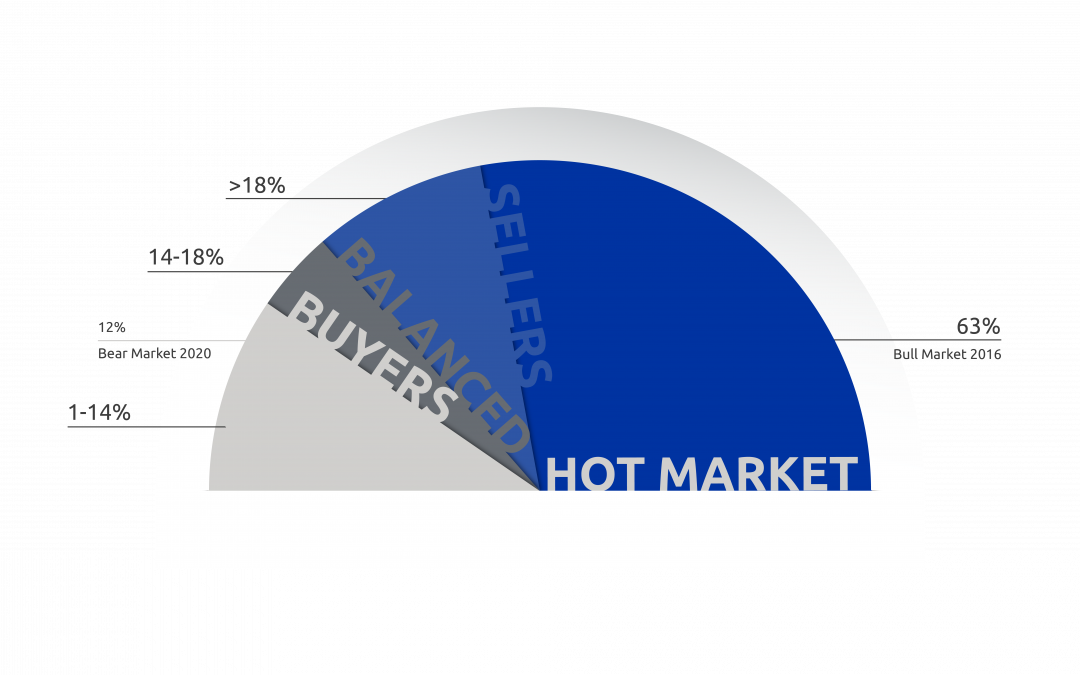
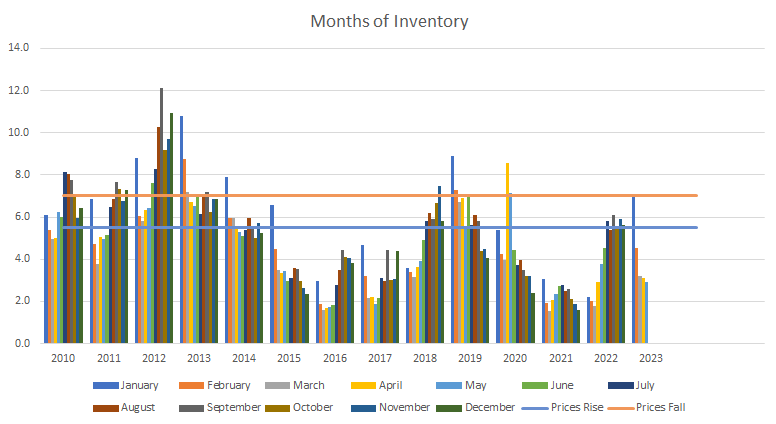
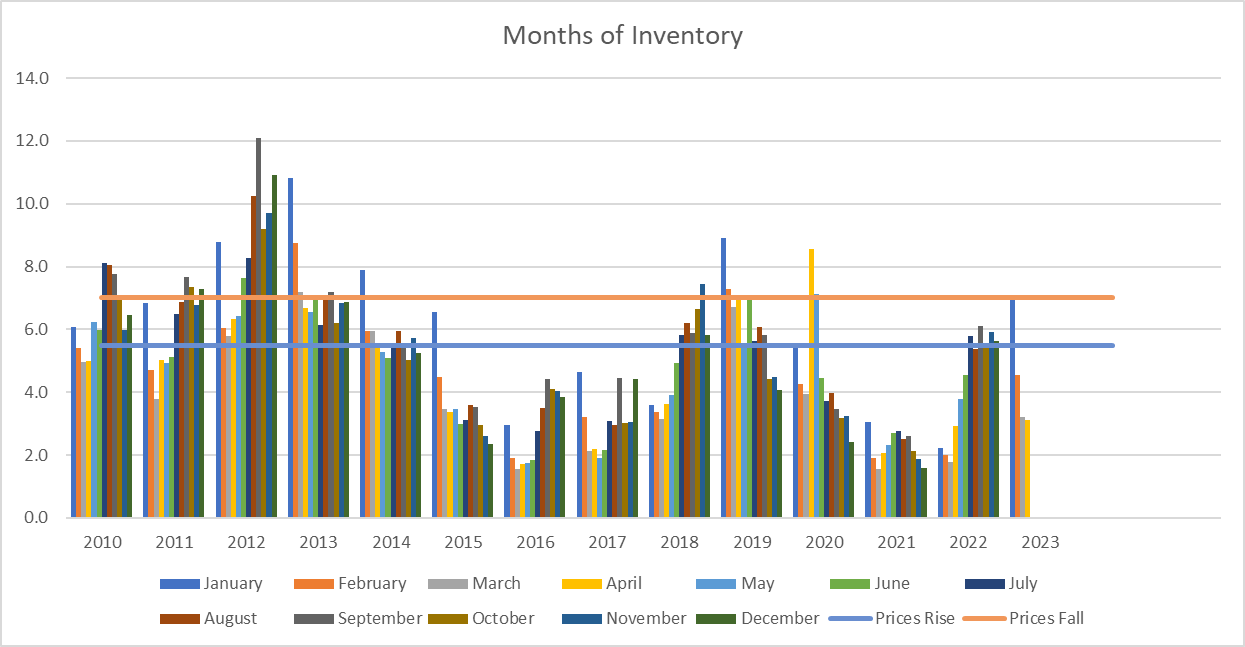
At only 2.9 Months of Inventory, Prices are expected to Rise.
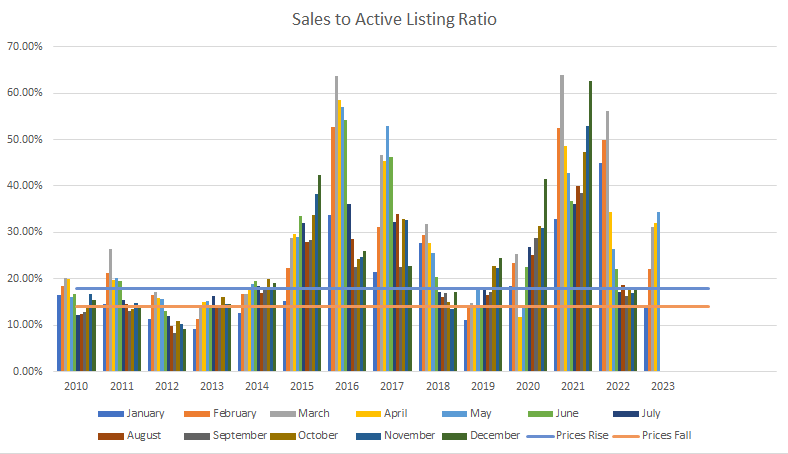
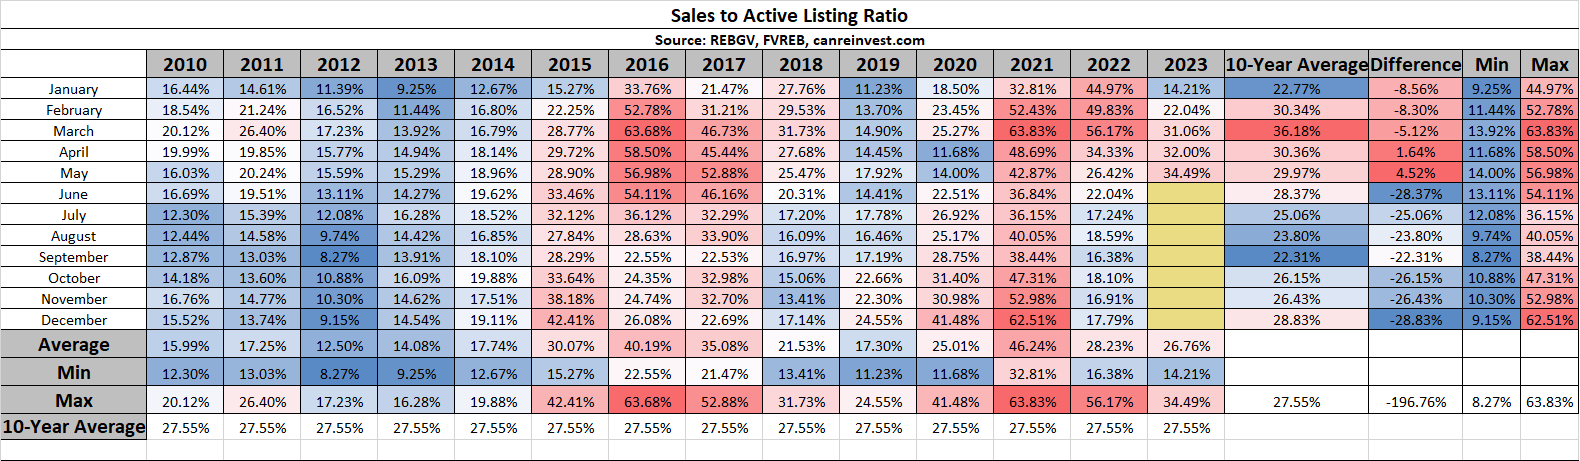
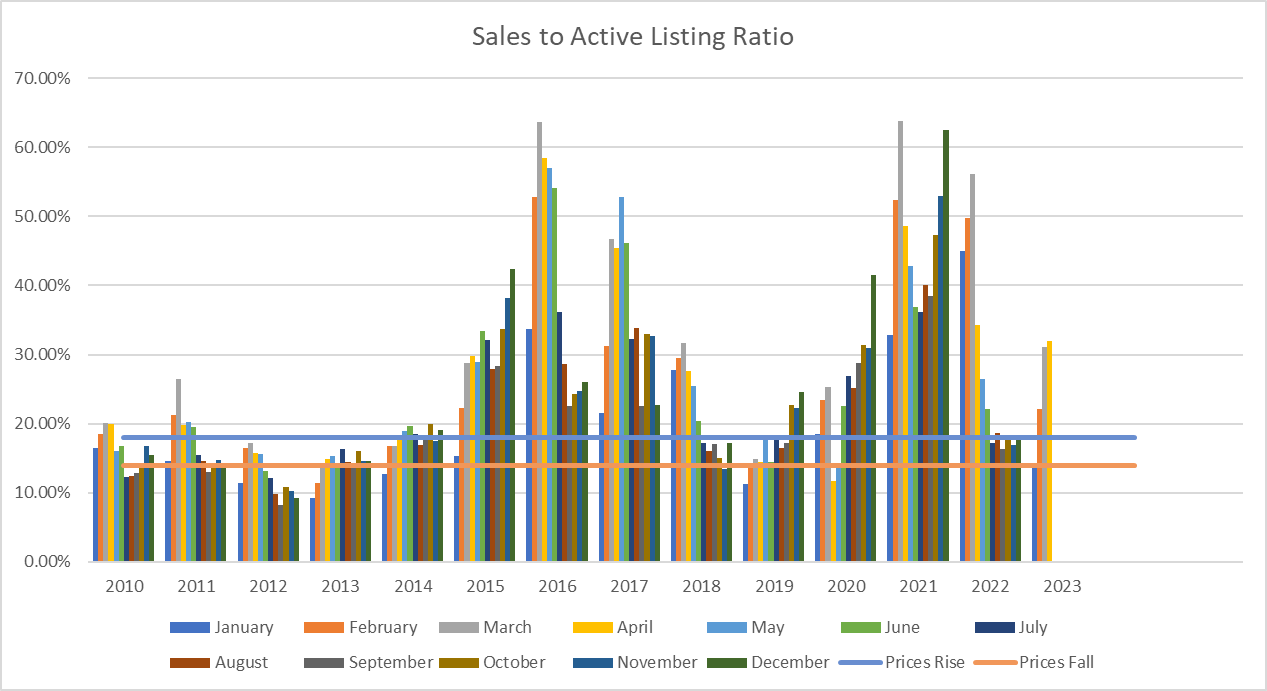
The most reliable indicator of market prices is the Sales to Active Listings Ratio (SAL). This is the ratio between the number of sales in a given month and the number of active listings at month-end.
In hotter markets in BC, a long-term analysis has shown that prices will usually act in the following ways:
- 7+ Months of Inventory (Under 14% SAL): Prices will likely DECLINE
- 5 – 7 Months of Inventory (14% – 18% SAL): Prices will likely be STABLE
- Less than 5.5 Months of Inventory (Over 18% SAL): Prices will likely RISE
Visit this link to learn more about house prices and inventory.
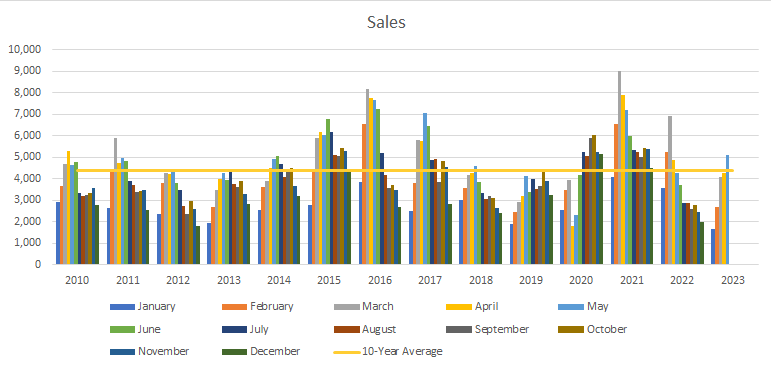
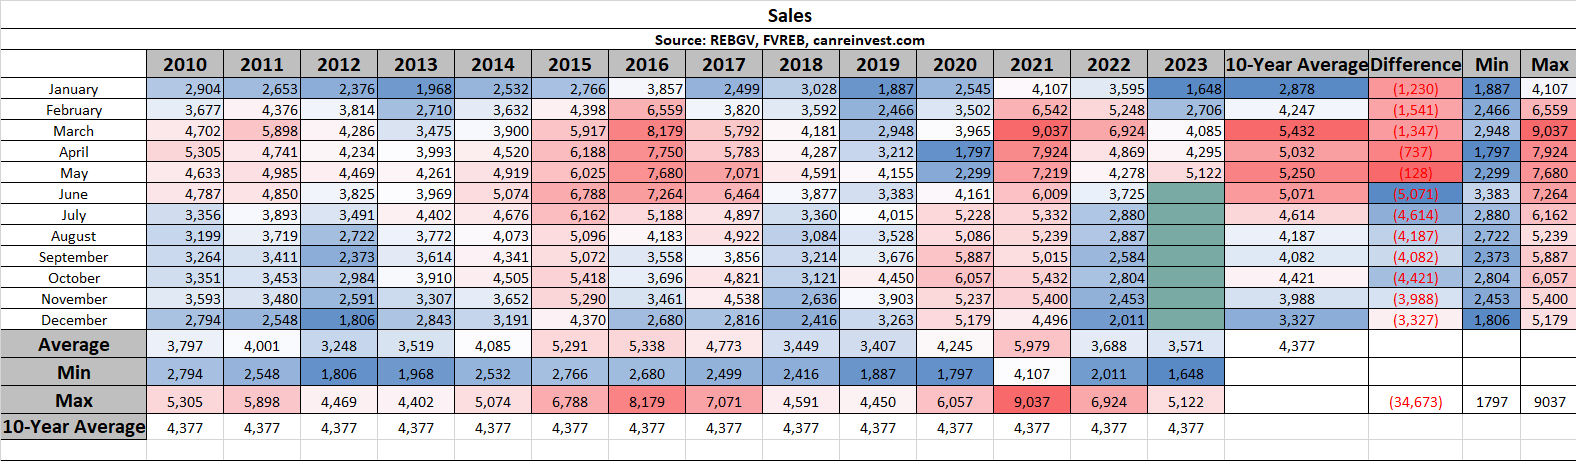
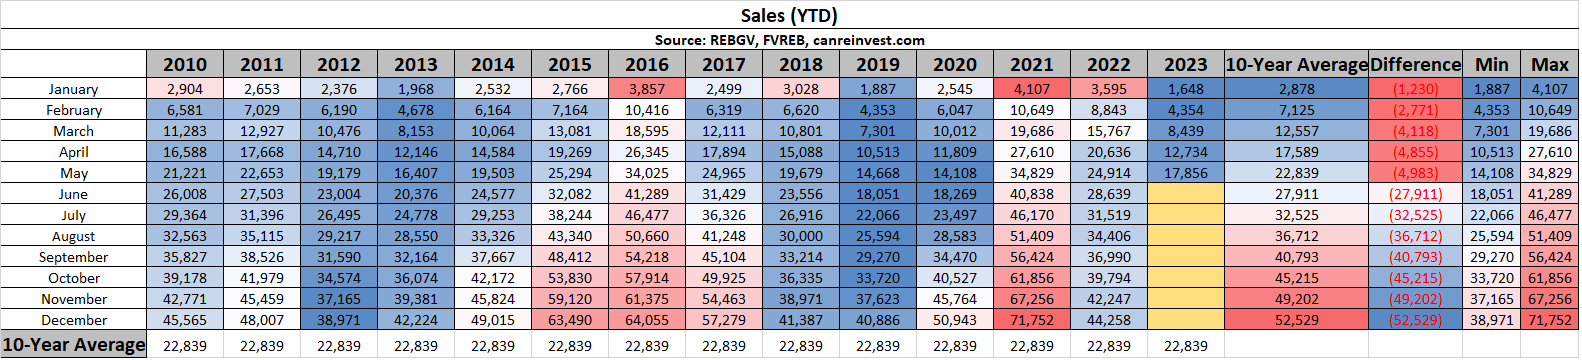
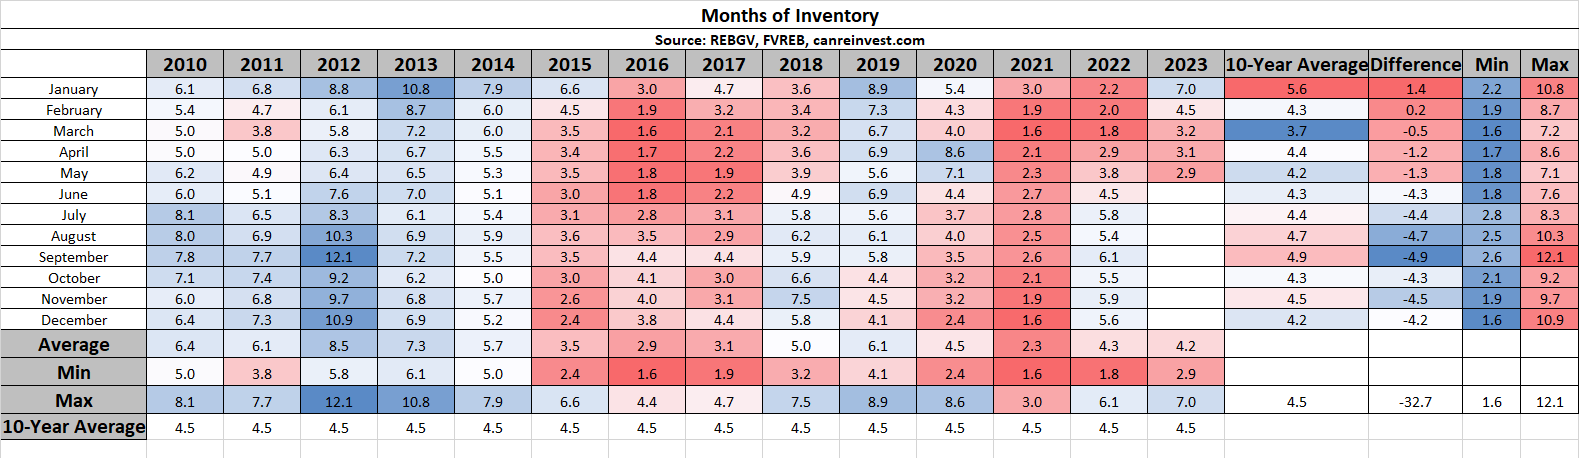
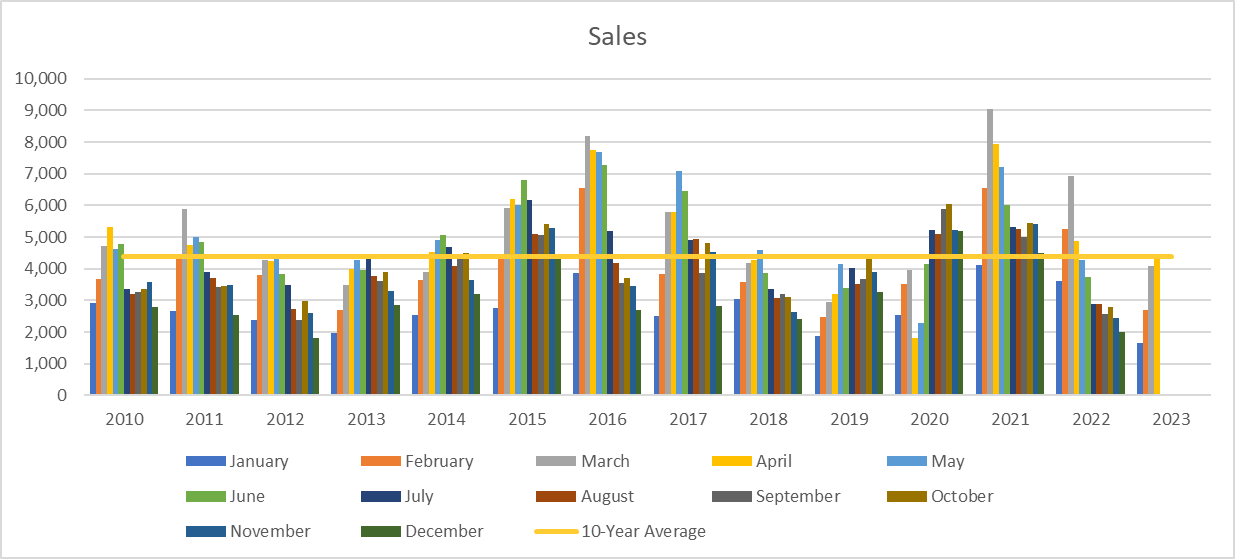
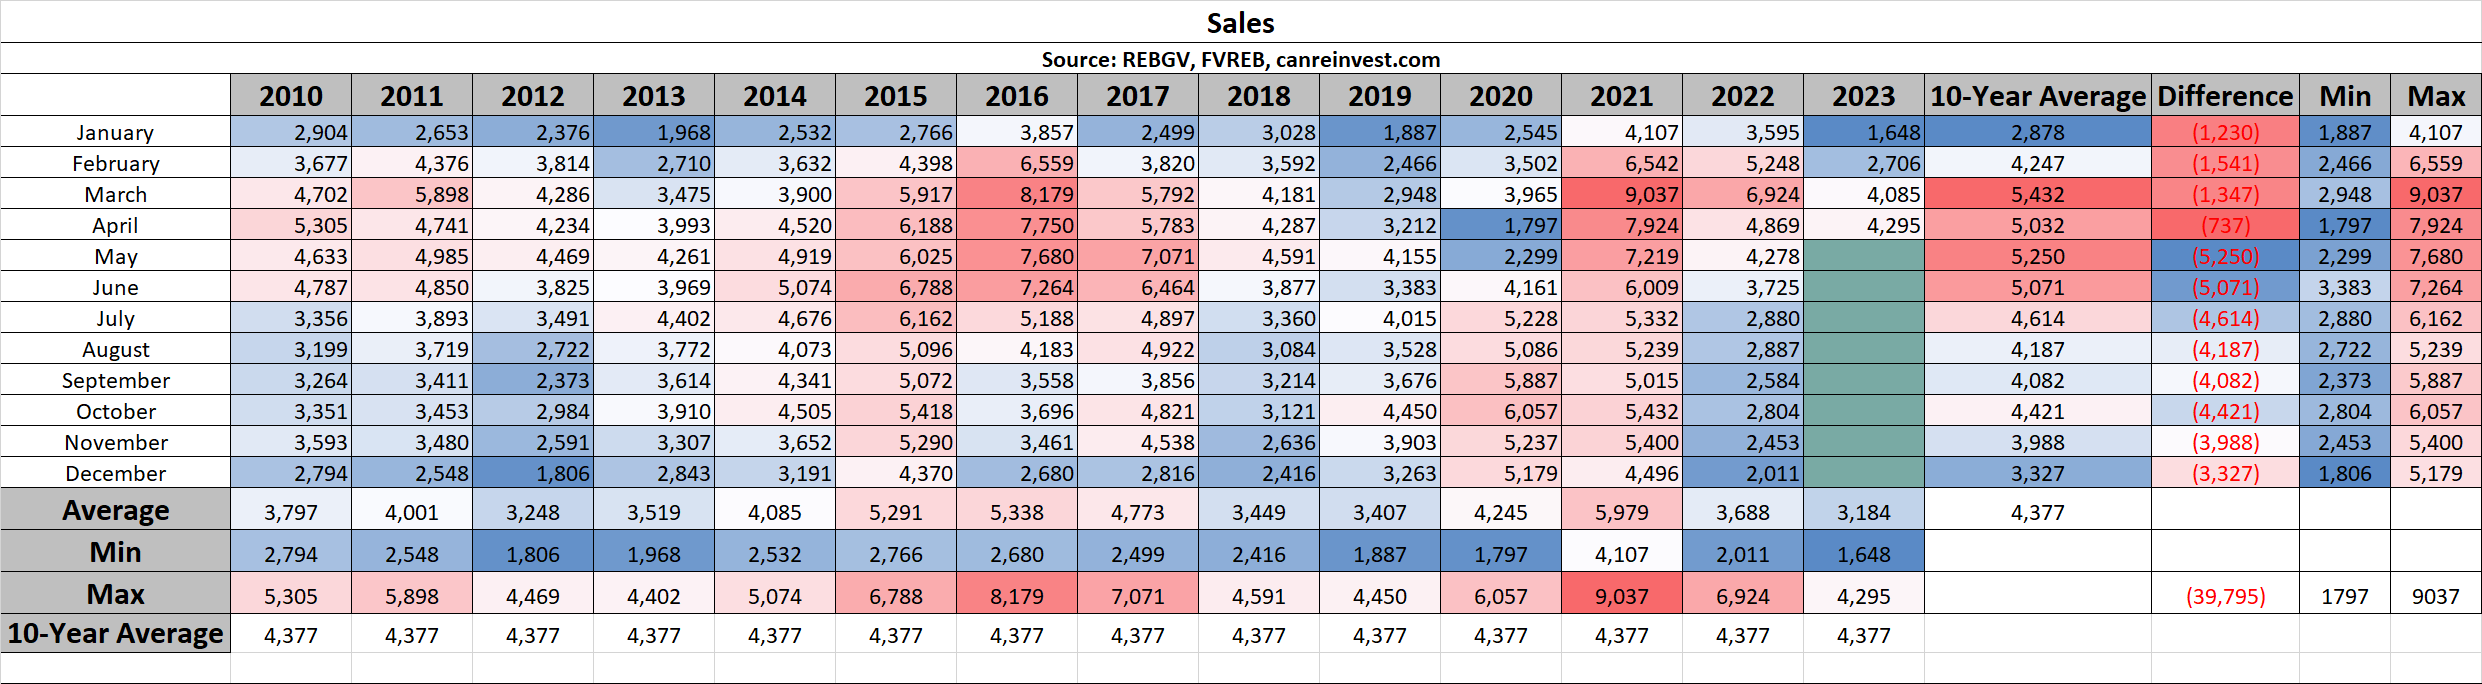
Sales
Sales in May 2023 (5,122) were 17.5% higher than May 2022 (4,278), and were close to the 10-year average (5,250).
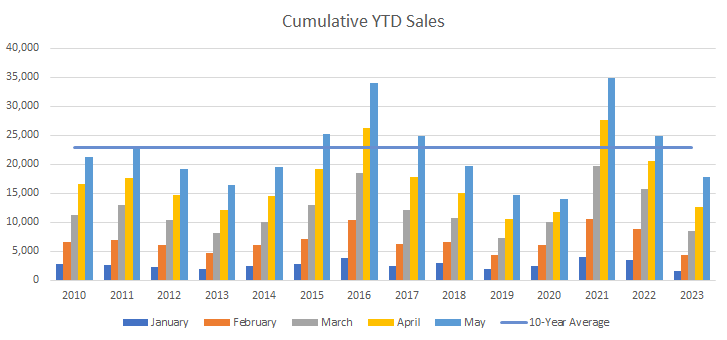
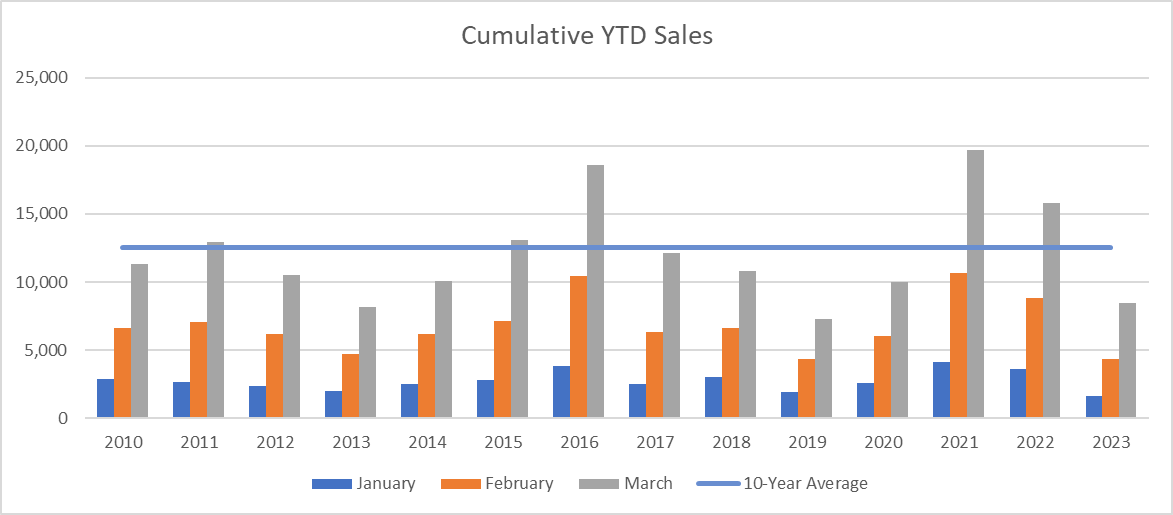
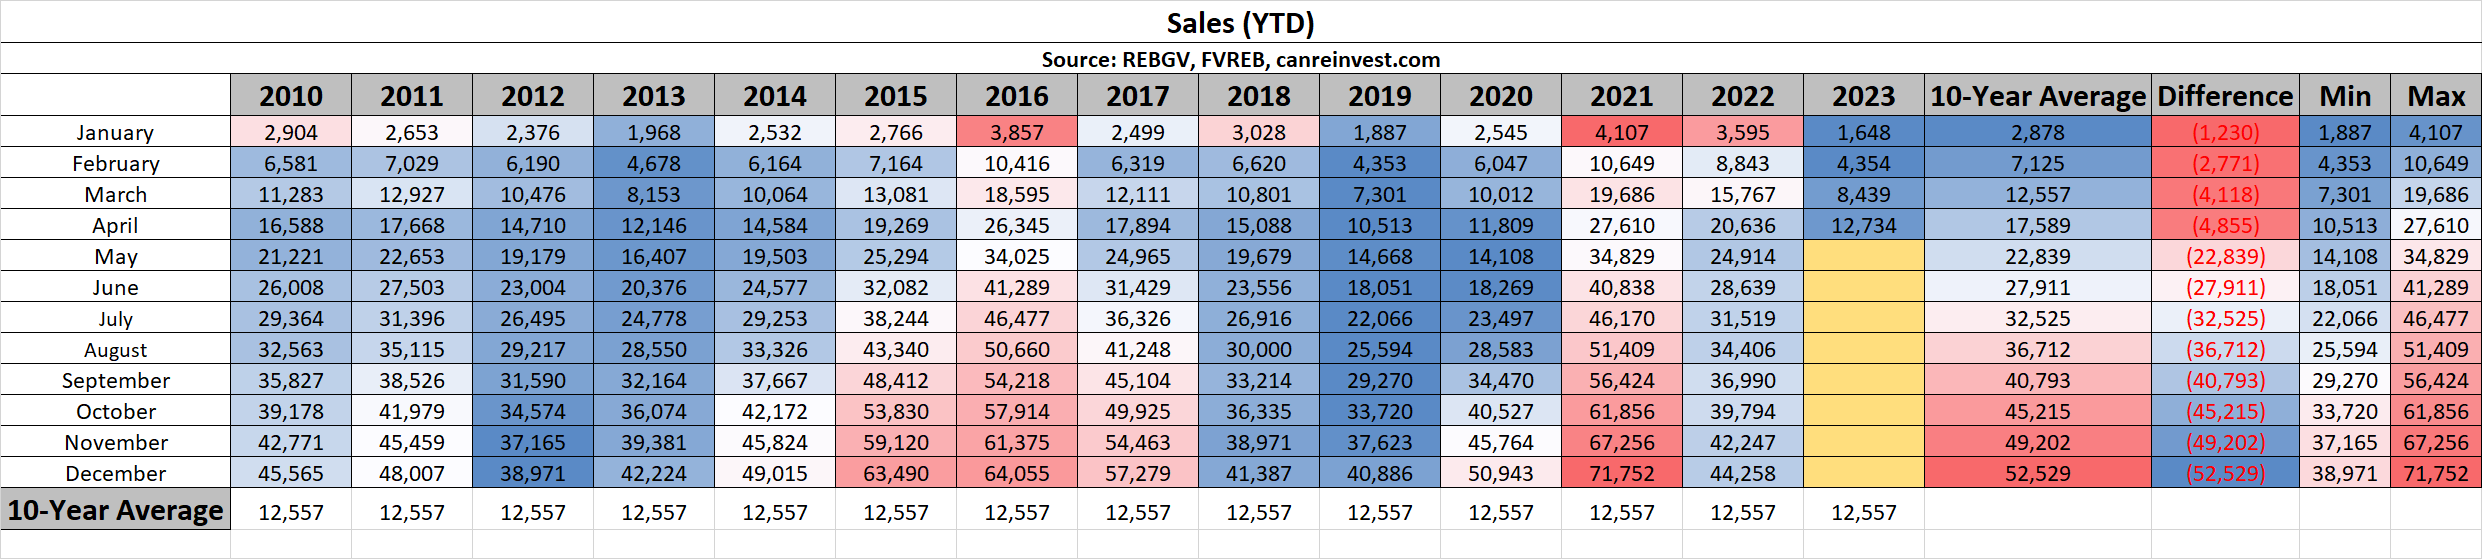
Cumulative Year-to-date Sales
2023 is off to a slower start as sales (14,851) remain below the 10-year average (19,218).
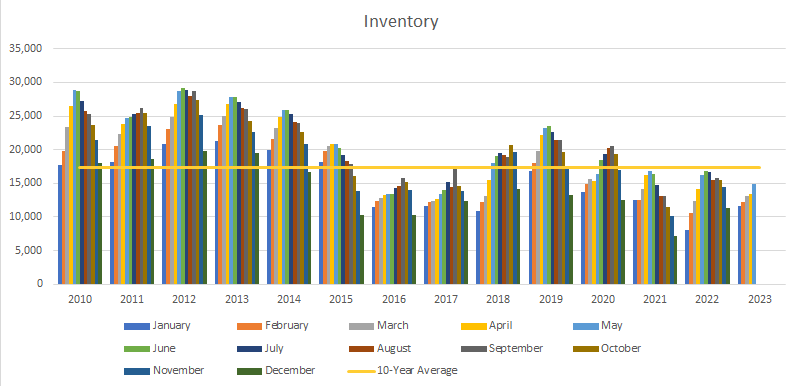
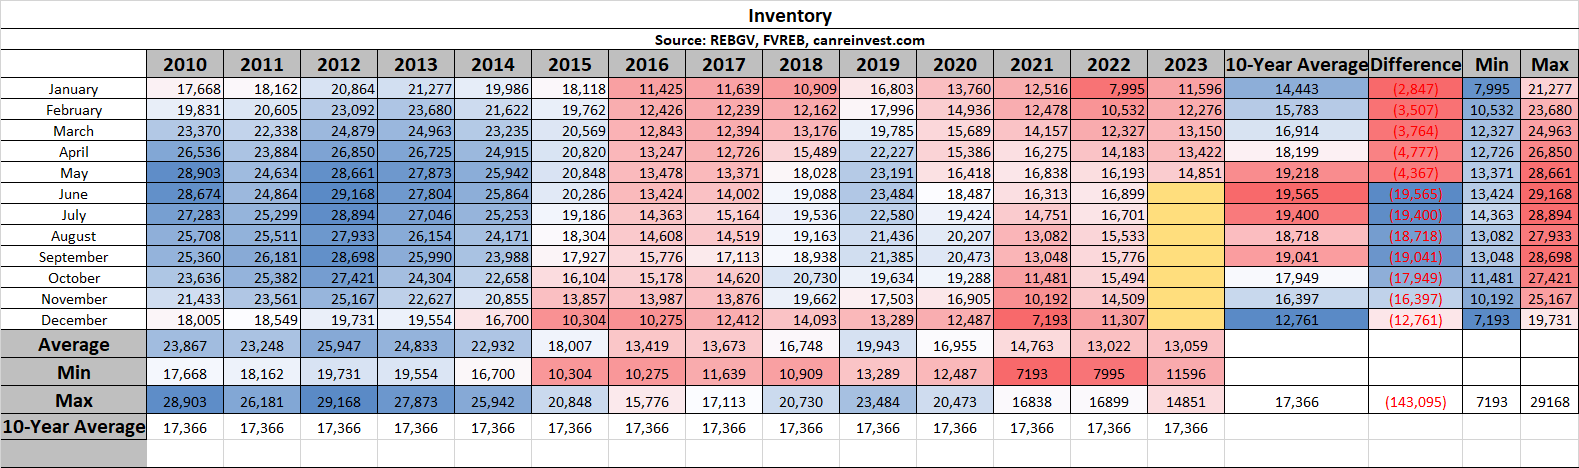
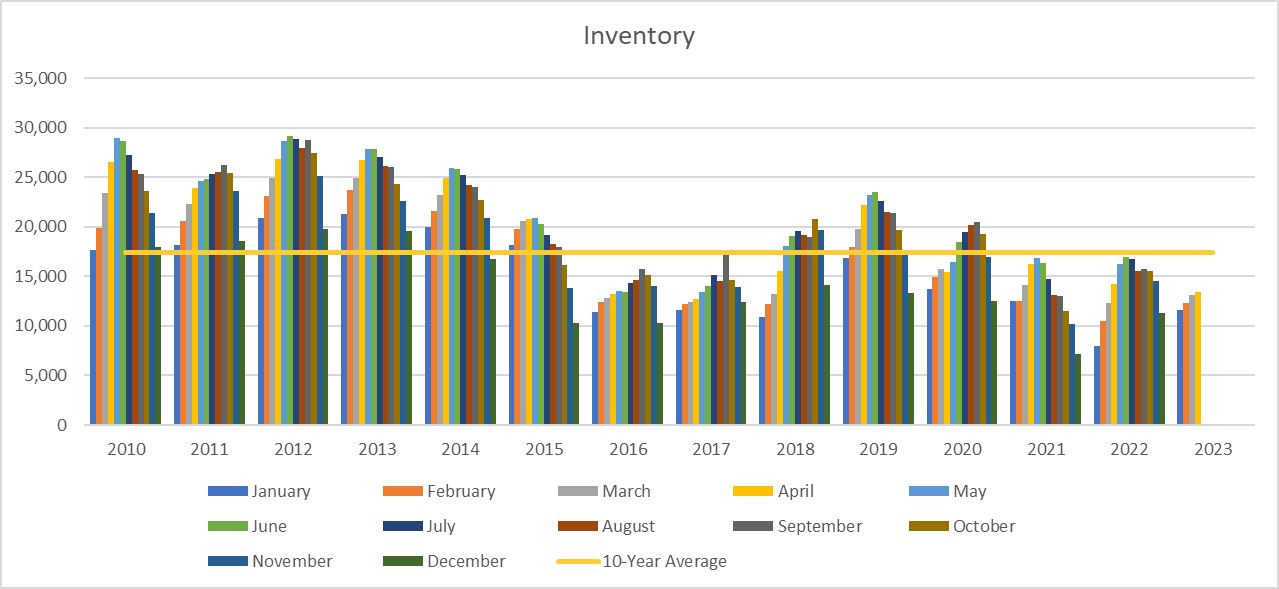
Inventory
May inventory (14,851 active listings) increased only slightly from the previous month, and are more than 20% below the 10-year average (19,218 average).
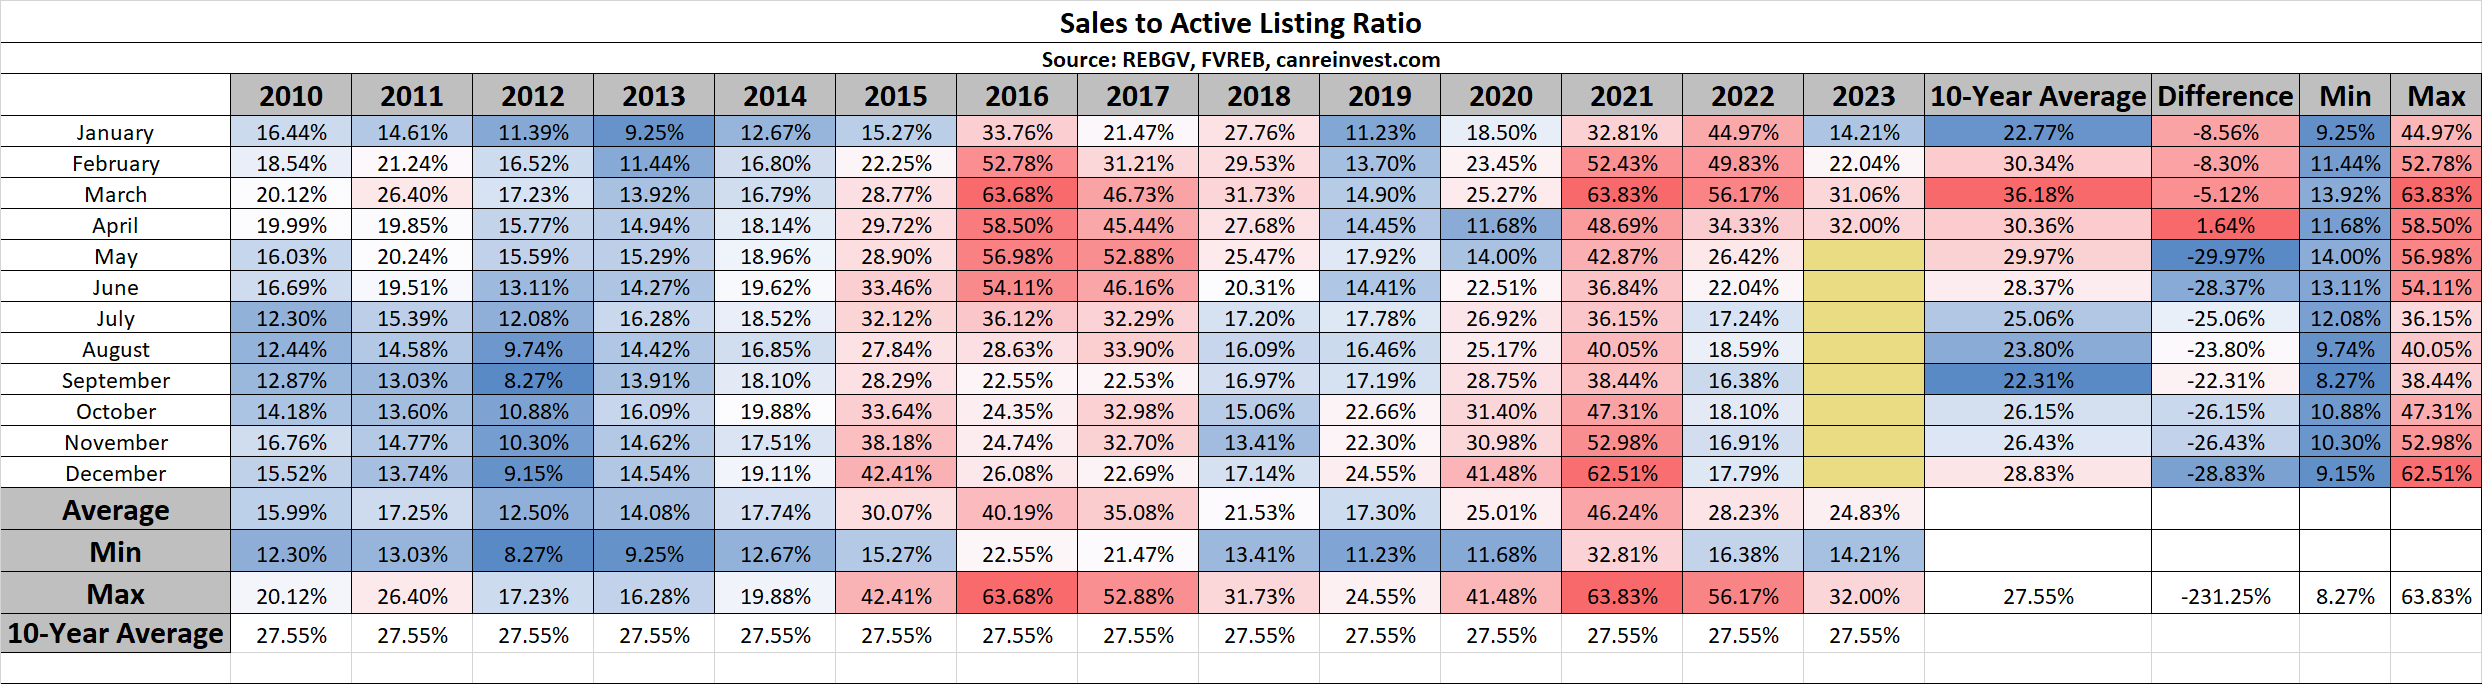
Sales to Active Listings
Higher sales and low inventory kept the Sales to Active Listing Ratio above 34%, indicating rising prices.
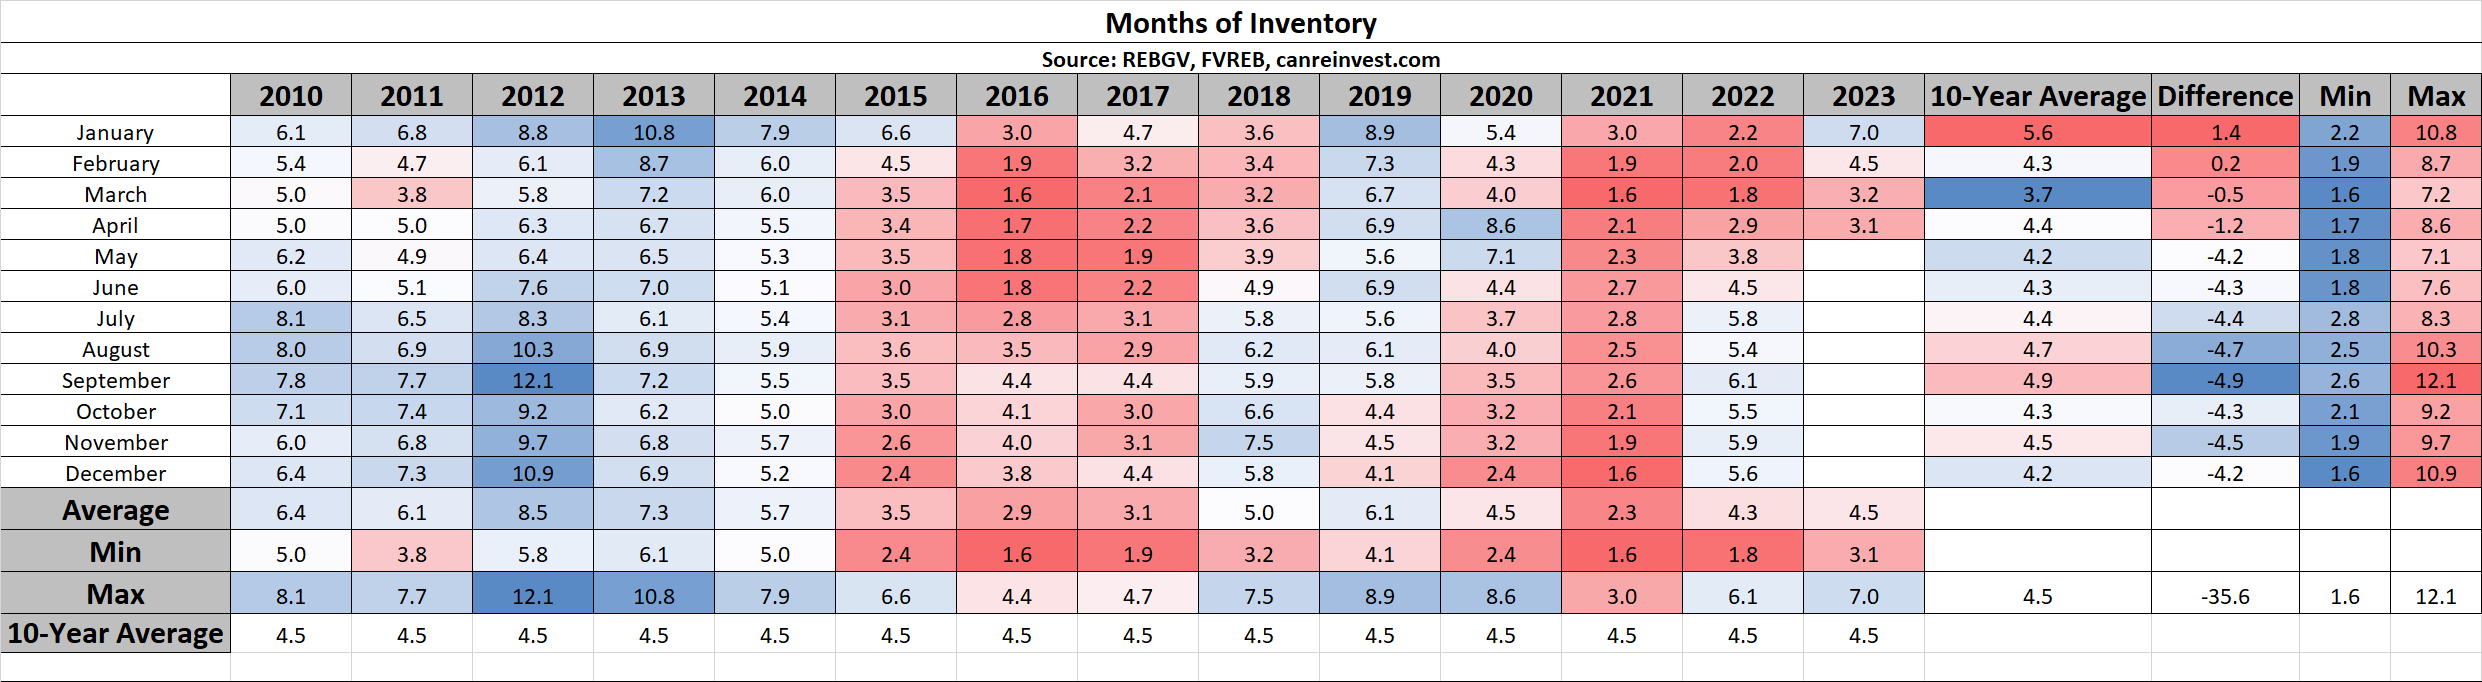
Months of Inventory
Similarly, Months of Inventory fell to 2.9 MOI, indicating a shift back to a seller’s market and rising prices.
Want to learn more about these stats or discuss your move to Macdonald Realty?
Check out careersinbcrealestate.com to connect today!
by Macrealty Marketing Team | May 8, 2023 | Market Updates
May 2023 – Lower Mainland Monthly Update (REBGV & FVREB)
Metro Vancouver & Fraser Valley sales in April remained lower.
The most reliable indicator of market prices is the Sales to Active Listings Ratio (SAL). This is the ratio between the number of sales in a given month and the number of active listings at month-end.
In hotter markets in BC, a long-term analysis has shown that prices will usually act in the following ways:
- 7+ Months of Inventory (Under 14% SAL): Prices will likely DECLINE
- 5 – 7 Months of Inventory (14% – 18% SAL): Prices will likely be STABLE
- Less than 5.5 Months of Inventory (Over 18% SAL): Prices will likely RISE
Visit this link to learn more about house prices and inventory.
Sales
Sales in April remained lower than average as a result of limited inventory.
Cumulative Year-to-date Sales
2023 is off to a slower start as sales (12,734) remain below the 10-year average (17,589).
Inventory
April inventory (13,422 active listings) increased only slightly from the previous month, and are more than 25% below the 10-year average (18,199 average).

Sales to Active Listings
Despite the low sales, even lower inventory kept the Sales to Active Listing Ratio above 32%, indicating rising prices.
Months of Inventory
Similarly, Months of Inventory fell to 3.1 MOI, indicating a shift back to a seller’s market and rising prices.
Want to learn more about these stats or discuss your move to Macdonald Realty?
Check out careersinbcrealestate.com to connect today!
by Macrealty Marketing Team | May 3, 2023 | Market Updates
According to the Fraser Valley Real Estate Board, spring sales hold steady in Fraser Valley real estate market.
Despite persistent inventory shortfalls, housing sales in the Fraser Valley remained steady in April as buyers took advantage of the continued pause in interest rate hikes.
In April, the Fraser Valley Real Estate Board (FVREB) processed 1,554 sales on its Multiple Listing Service® (MLS®), virtually unchanged compared to March and a slight decrease of 5.1 per cent compared to April 2022.
“Buyers are continuing to find opportunities in the Fraser Valley, even in the face of lower inventories,” said Narinder Bains, Chair of the Fraser Valley Real Estate Board. “With prices remaining strong, we expect to see inventories increase over the coming months as sellers seek to capitalize on price growth after sitting out for so long.”
The Board received 2,478 new listings in April, off by 3.2 per cent compared to March, and down by 31.6 per cent compared to last year. The month ended with a total active inventory of 4,632, a 2.2 per cent increase over March, and 14 per cent less than April 2022.
“Our members are starting to see a rise in multiple offers on properties as the spring market kicks in,” said Board CEO, Baldev Gill. “With the heightened activity, many homeowners are asking: is now the right time to buy or sell? There is no simple – or single – answer to this question, but a wise first step would be to consult with a professional REALTOR® to determine the best path to meet your personal objectives.”
Low inventories helped nudge prices upward with the composite Benchmark price up by 2.8 per cent to $992,000 and single-family detached homes up by nearly four per cent, month-over-month.
Across Fraser Valley in April, the average number of days to sell a single-family detached home was 25 days and a townhome was 23 days. Apartments took, on average, 26 days to sell.
Find all the infographics related to the April Market Statistics by visiting the Facebook Album.
Abbotsford

Cloverdale
Langley
Mission
North Delta
North Surrey
Surrey Central
White Rock / South Surrey
Looking for more information about the real estate market in specific neighbourhoods in Surrey, Langley and Fraser Valley?
Macdonald Realty has offices in North Delta, White Rock/South Surrey, and Langley. Please email [email protected] or call 1-877-278-3888 to be matched with a REALTOR® working in your area.
MLS® Home Price Index (HPI) Benchmark Price
Average and median home prices are often misinterpreted, are affected by change in the mix of homes sold, and can swing dramatically from month to month (based on the types and prices of properties that sold in a given month). The MLS® HPI overcomes these shortcomings and uses the concept of a benchmark home, a notional home with common attributes of typical homes in a defined area. Visit www.housepriceindex.ca for more information.
This blog post is based on market data provided by the Fraser Valley Real Estate Board (FVREB) www.fvreb.bc.ca