
Here are the latest real estate market statistics from Macdonald Realty on the Greater Vancouver listings and sales in October 2020.
Find all the infographics by visiting the Facebook Album.
According to the Real Estate Board of Greater Vancouver, home sale and new listing activity remained at near-record levels across Metro Vancouver in October.
“Home has been a focus for residents during the pandemic. With more days and evenings spent at home this year, people are re-thinking their housing situation,” Colette Gerber, REBGV Chair said. “Throughout this period, REALTORS® have been working to understand and adapt to the latest safety protocols so that they can continue to help the public meet their housing needs in a safe and responsible way.”
Colette also has talked about demand and multiple offers:
“With demand on the rise, homes priced right for today’s market are receiving attention and, at times, garnering multiple offers,” Gerber said. “To understand the market conditions in your neighbourhood and property type of choice, work with your local REALTOR® to assess the latest MLS® housing market information.”
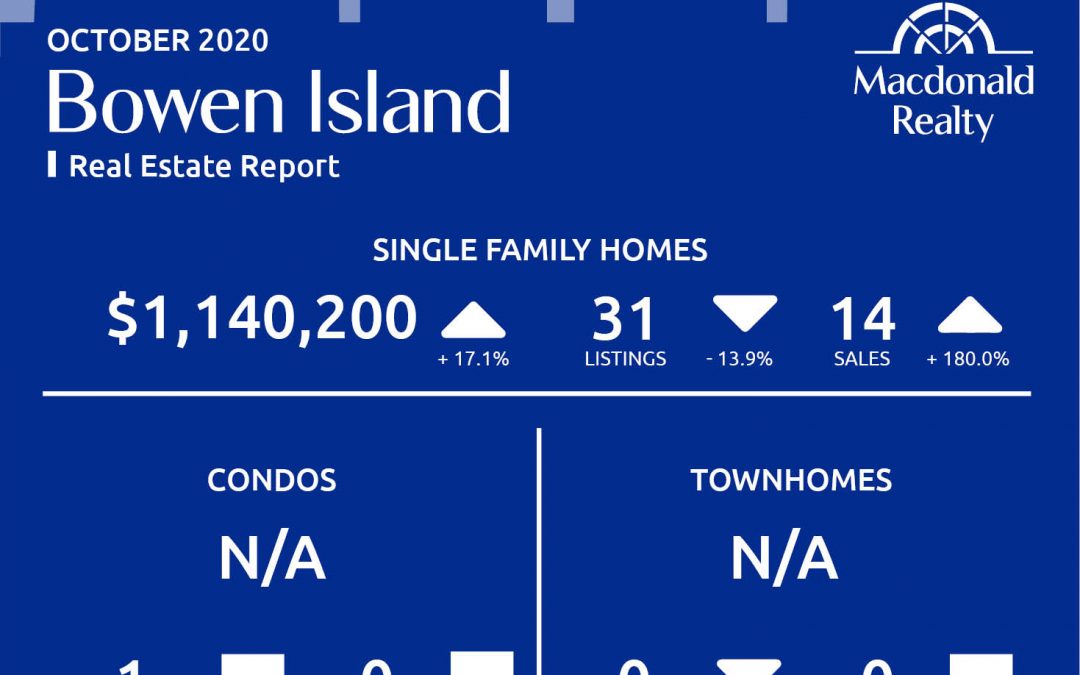
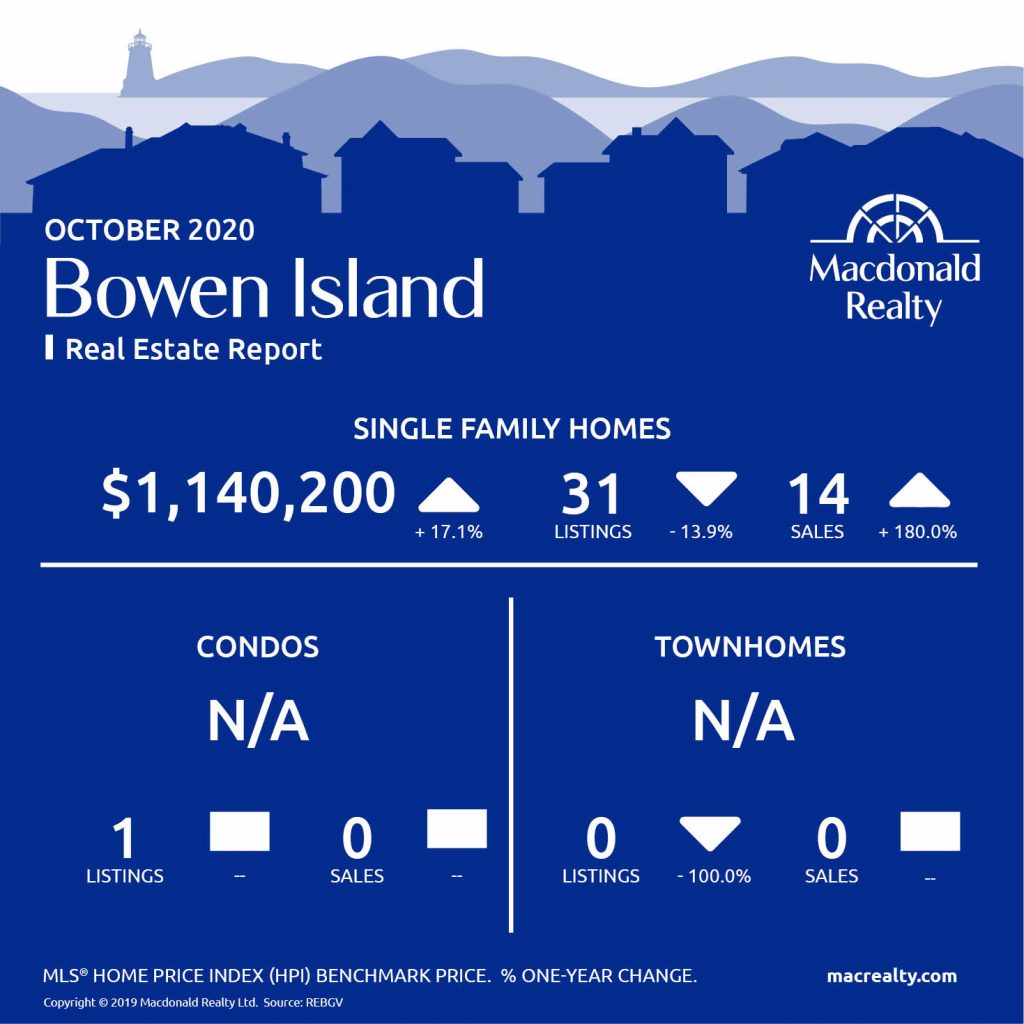
Bowen Island
In October 2020, there were 14 sales of detached homes and 31 active listings in Bowen Island. The benchmark sale price was $1,140,200.
The condo market had 1 active listing.
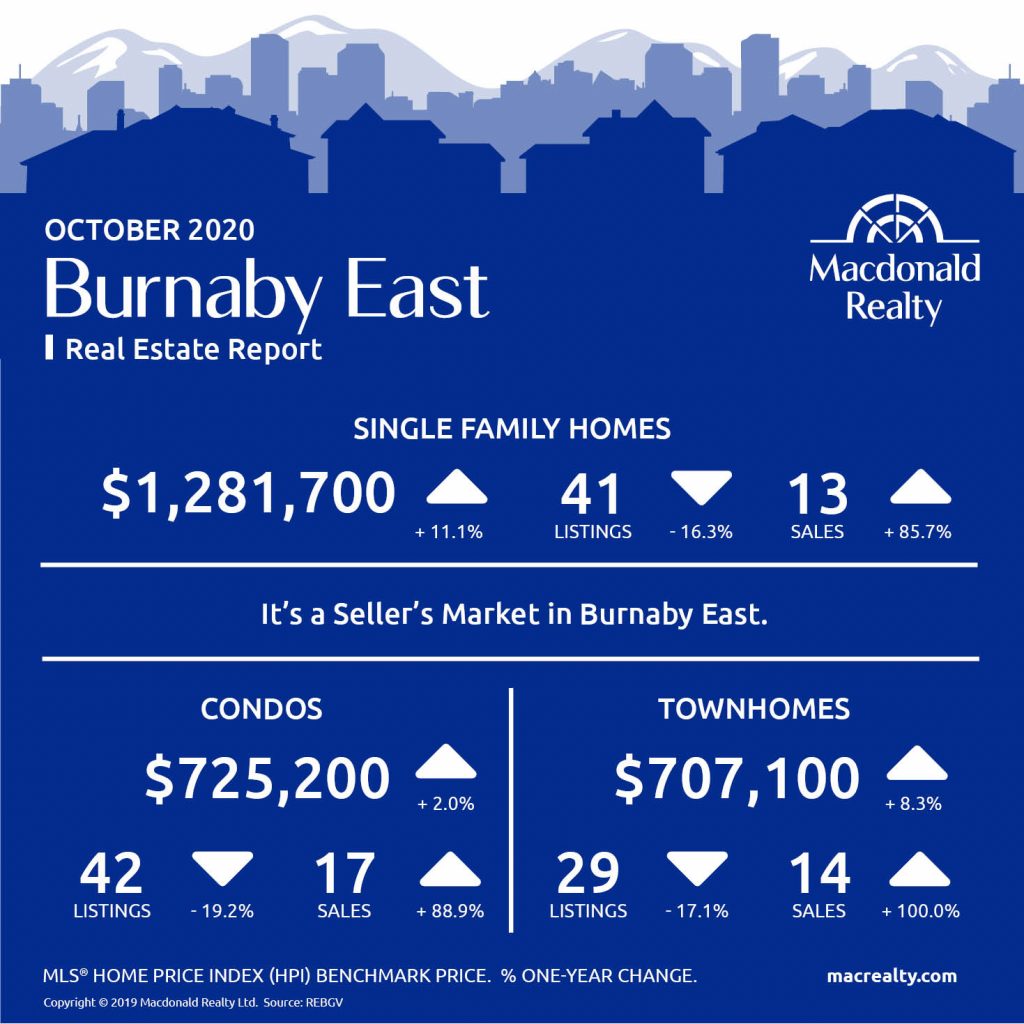
Burnaby East
In October 2020, there were 13 sales of detached homes and 41 active listings in Burnaby East. The benchmark sale price was $1,281,700.
The condo market had 17 sales and 42 active listings at the end of the month. The benchmark sale price was $725,200.
The townhome market had 14 sales and, the active listings were 29. The benchmark sale price was $707,100.
It’s a seller’s market in Burnaby East.
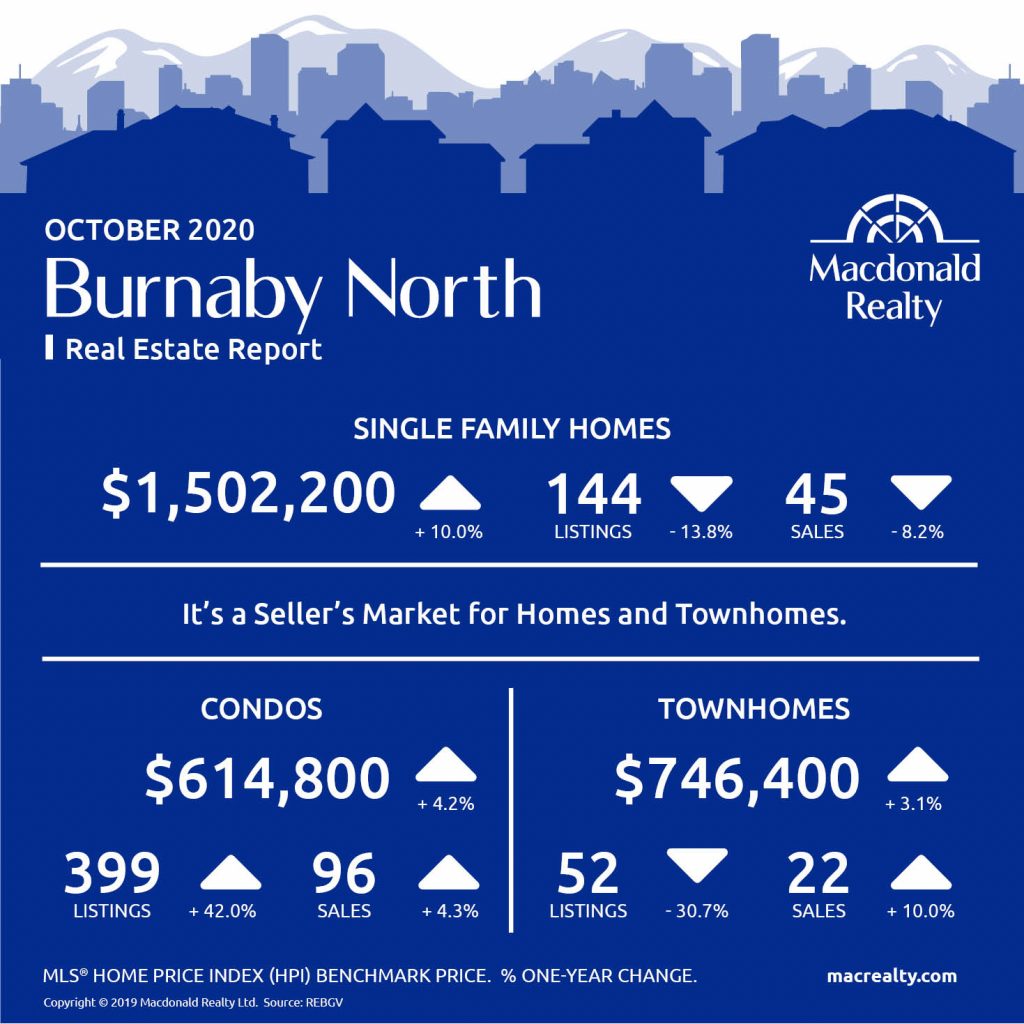
Burnaby North
In October 2020, there were 45 sales of detached homes and 144 active listings in Burnaby North. The benchmark sale price was $1,502,200.
The condo market had 96 sales and 399 active listings at the end of the month. The benchmark sale price was $614,800.
The townhome market had 22 sales and, the active listings were 52. The benchmark sale price was $746,400.
It’s a seller’s market for homes and townhomes.
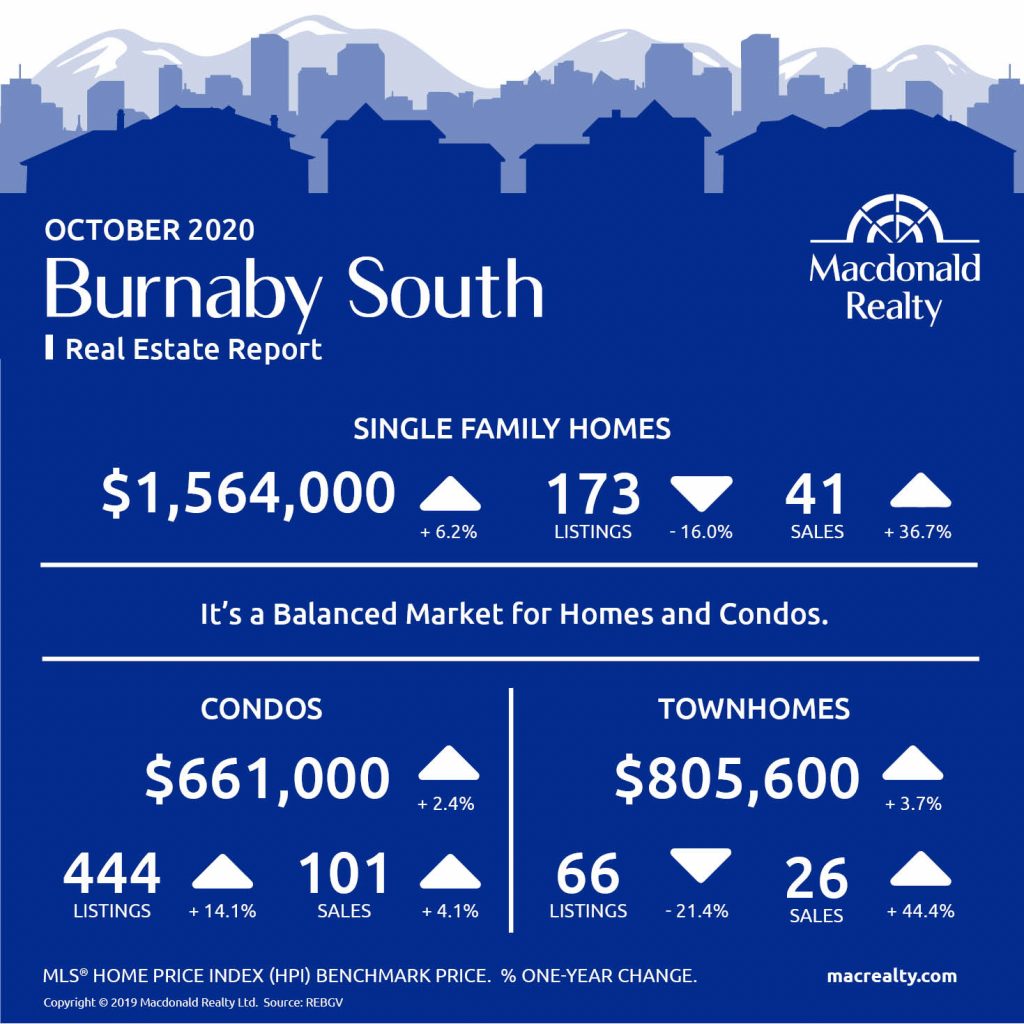
Burnaby South
In October 2020, there were 41 sales of detached homes and 173 active listings in Burnaby South. The benchmark sale price was $1,564,000.
The condo market had 101 sales and 444 active listings at the end of the month. The benchmark sale price was $661,000.
The townhome market had 26 sales and 66 active listings. The benchmark sale price was $805,600.
It’s a balanced market for homes and condos.
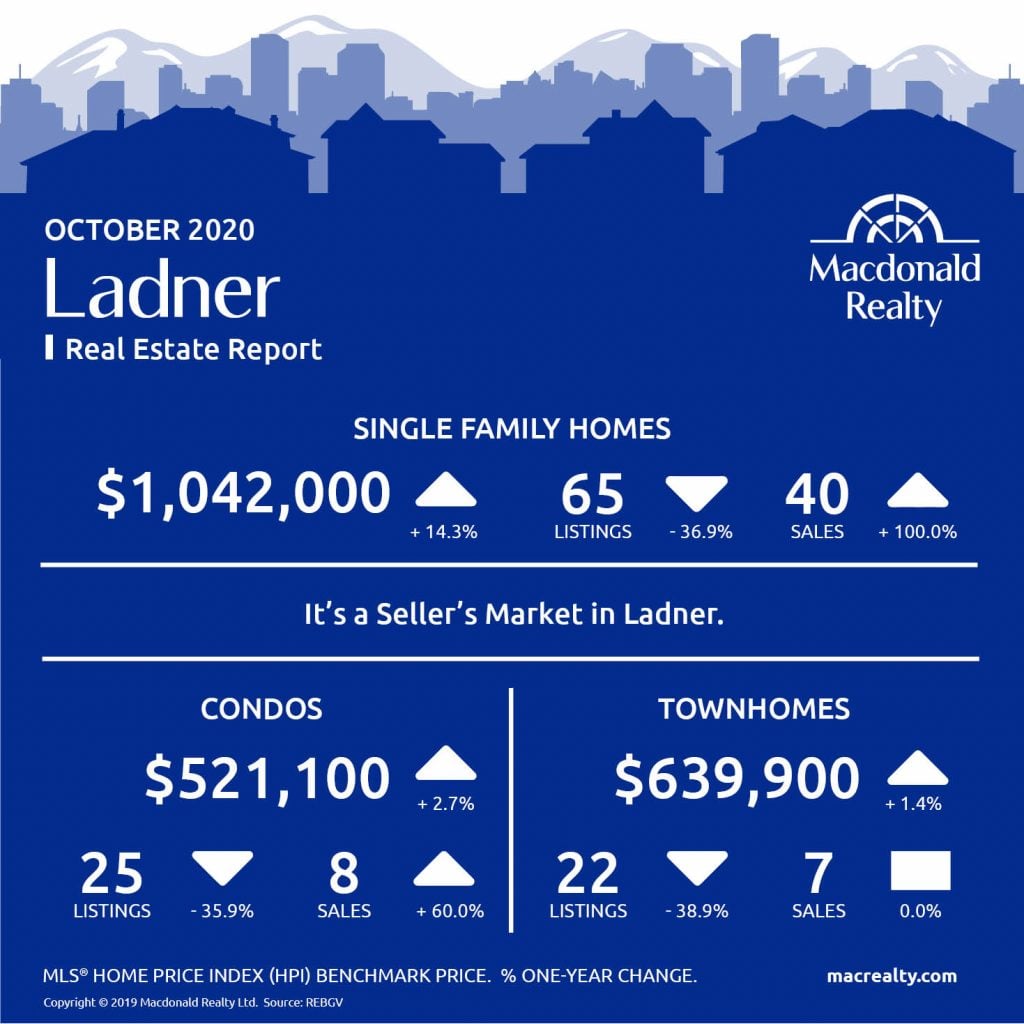
Ladner
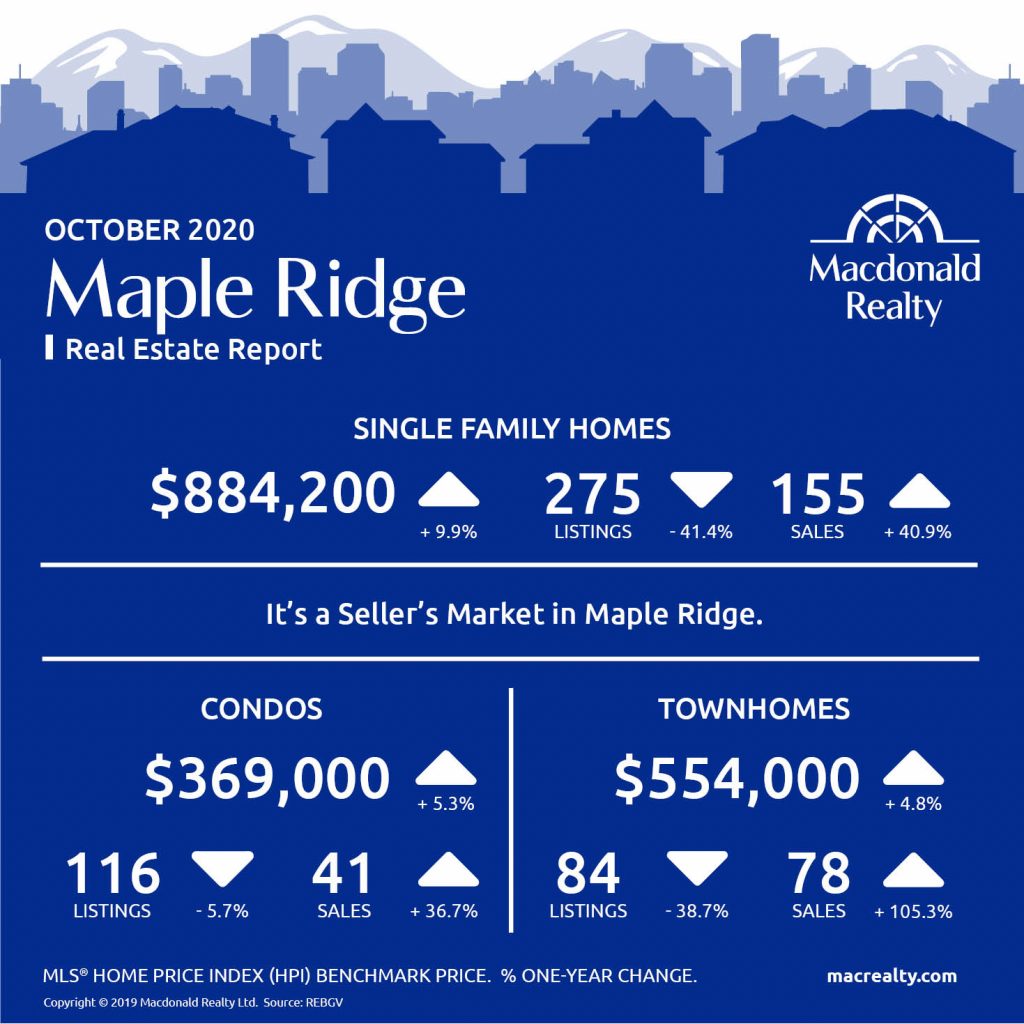
Maple Ridge
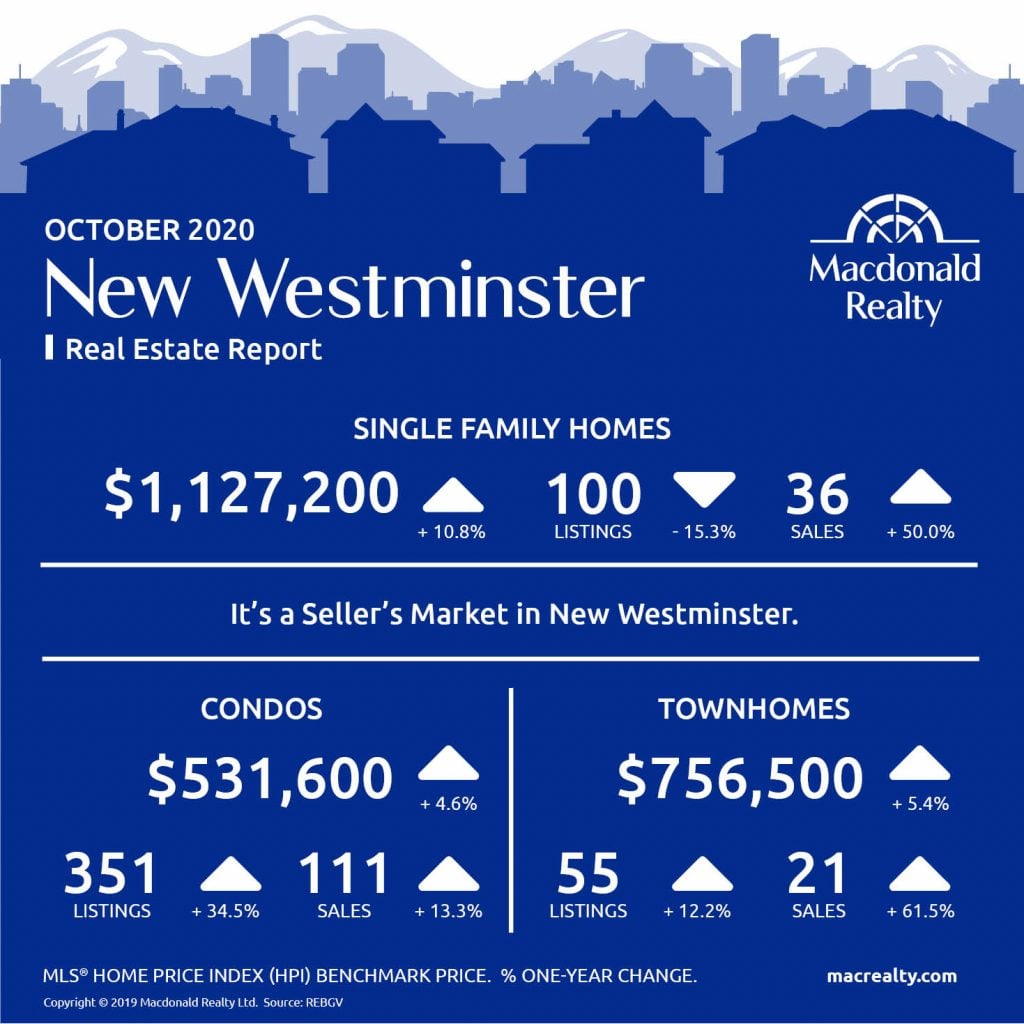
New Westminster
North Vancouver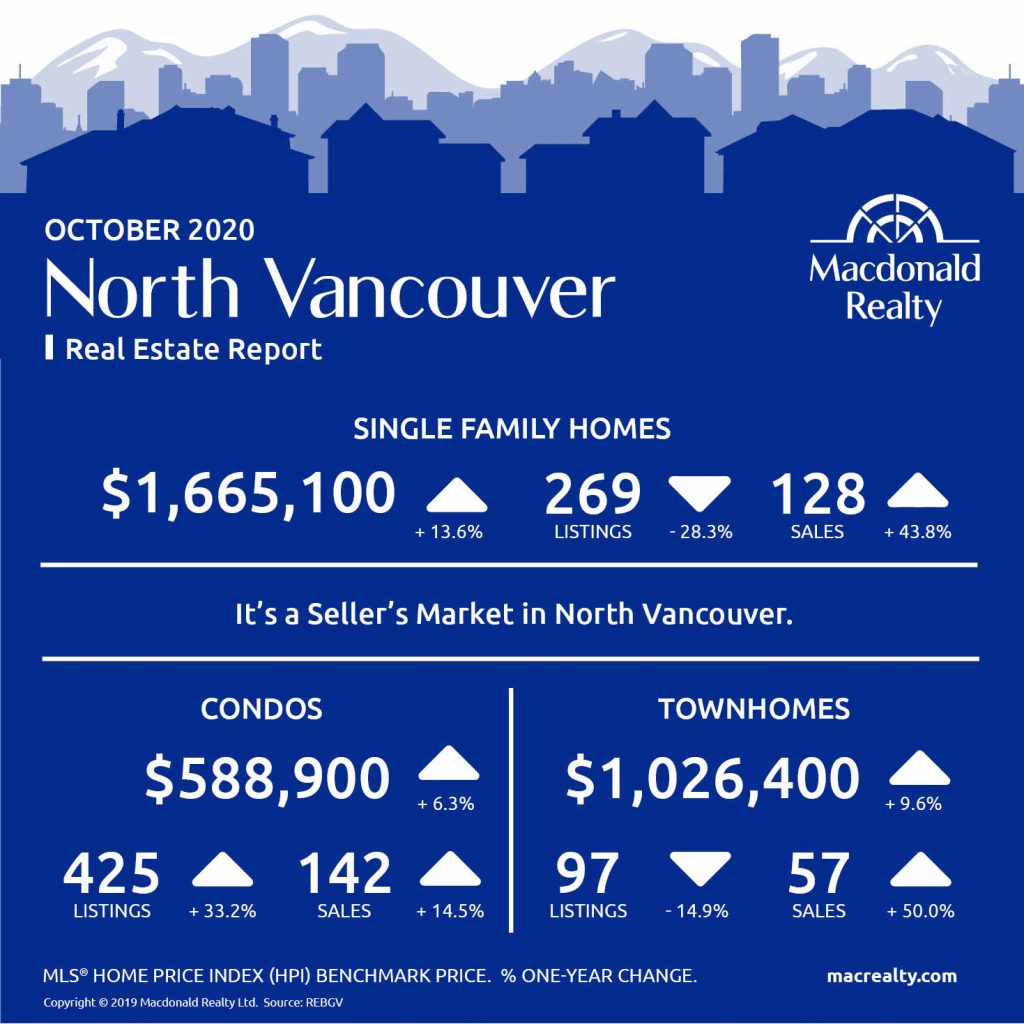
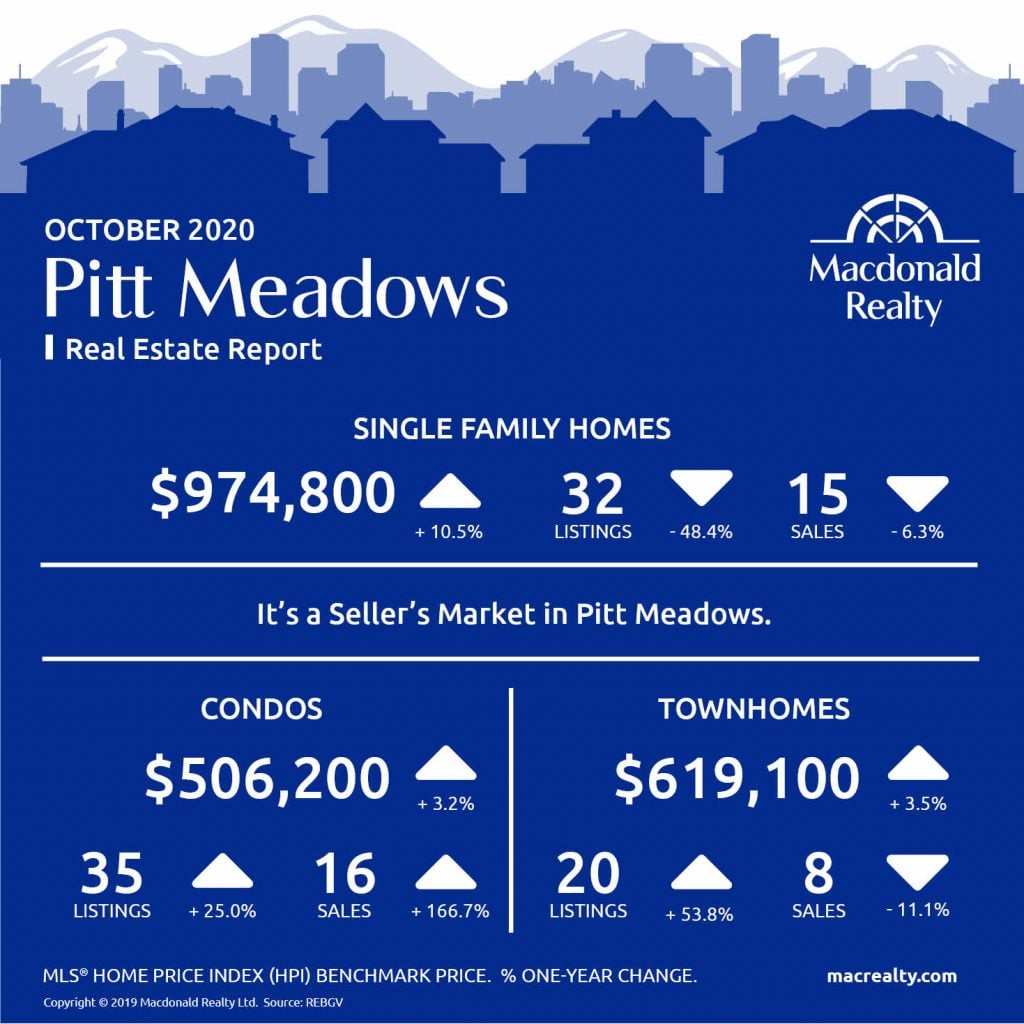
Pitt Meadows
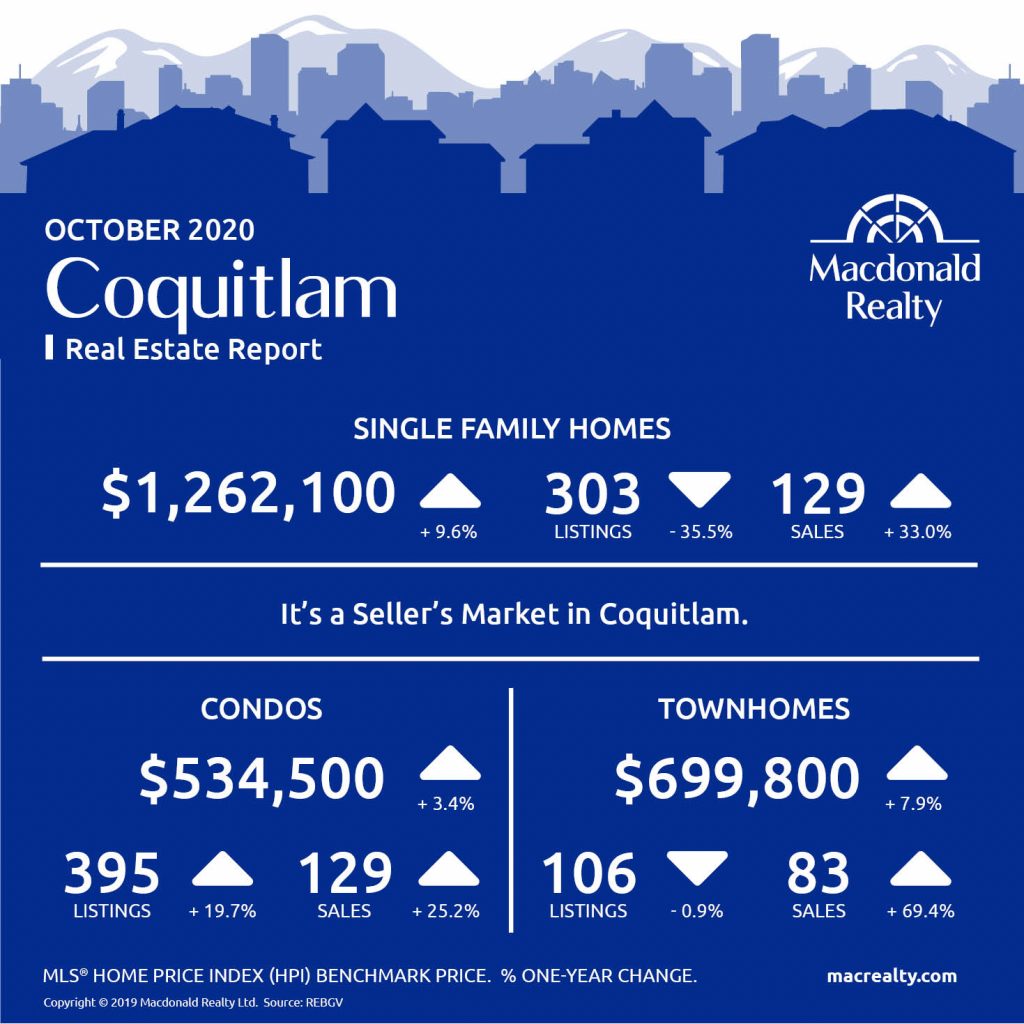
Coquitlam
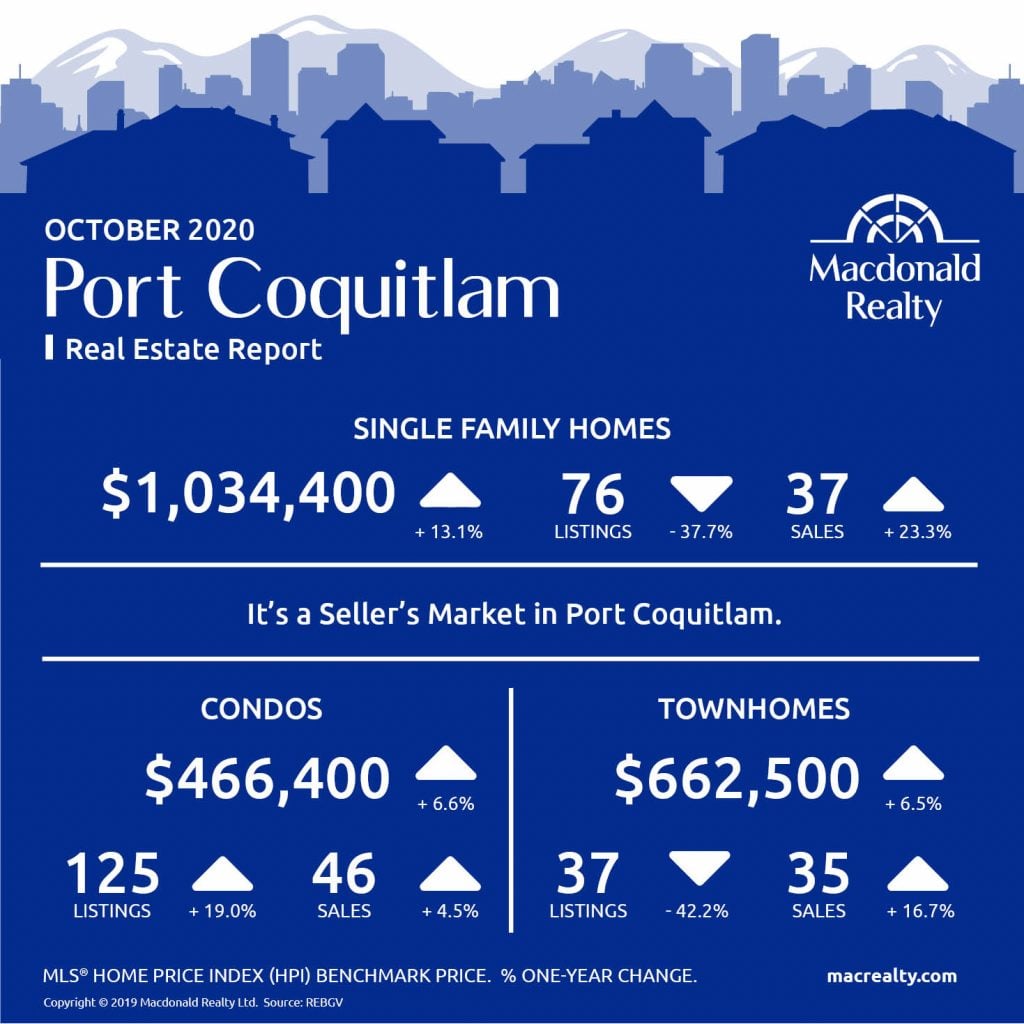
Port Coquitlam
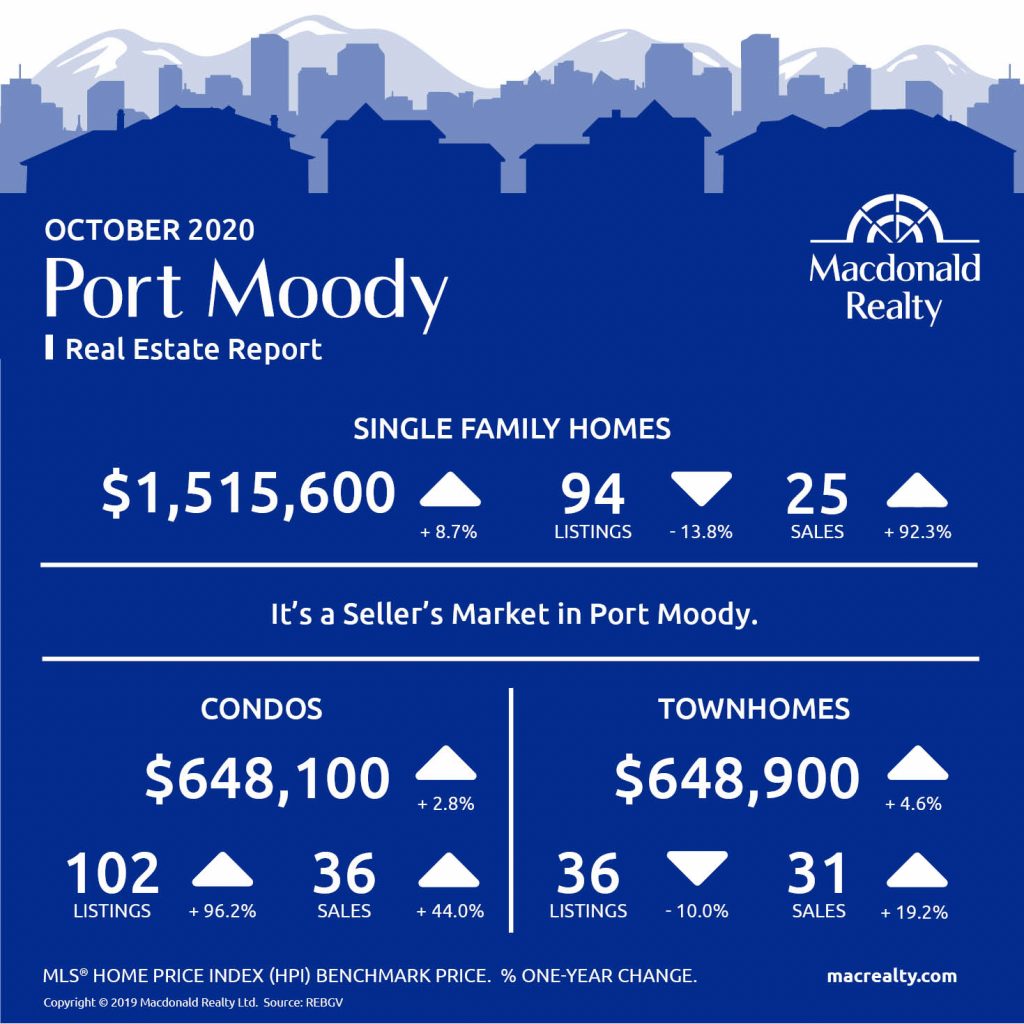
Port Moody
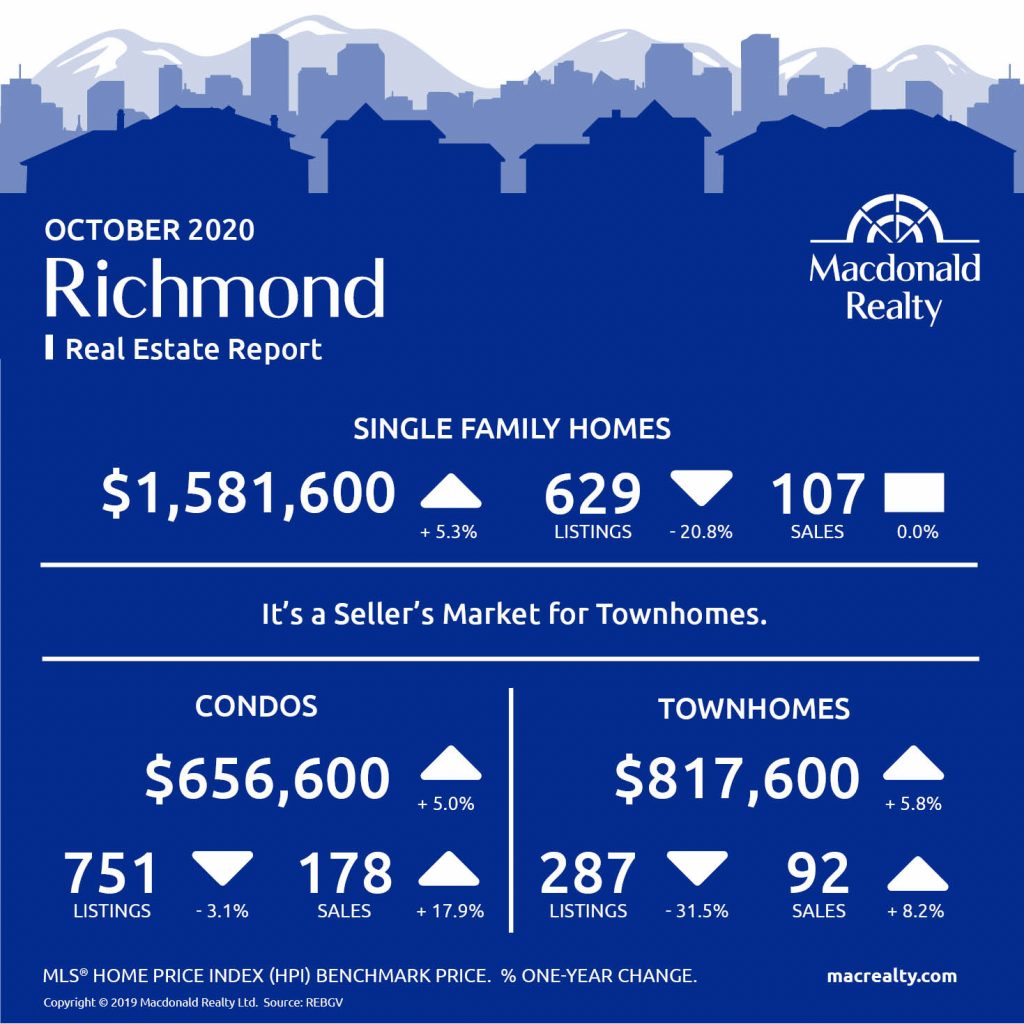
Richmond
Tsawwassen

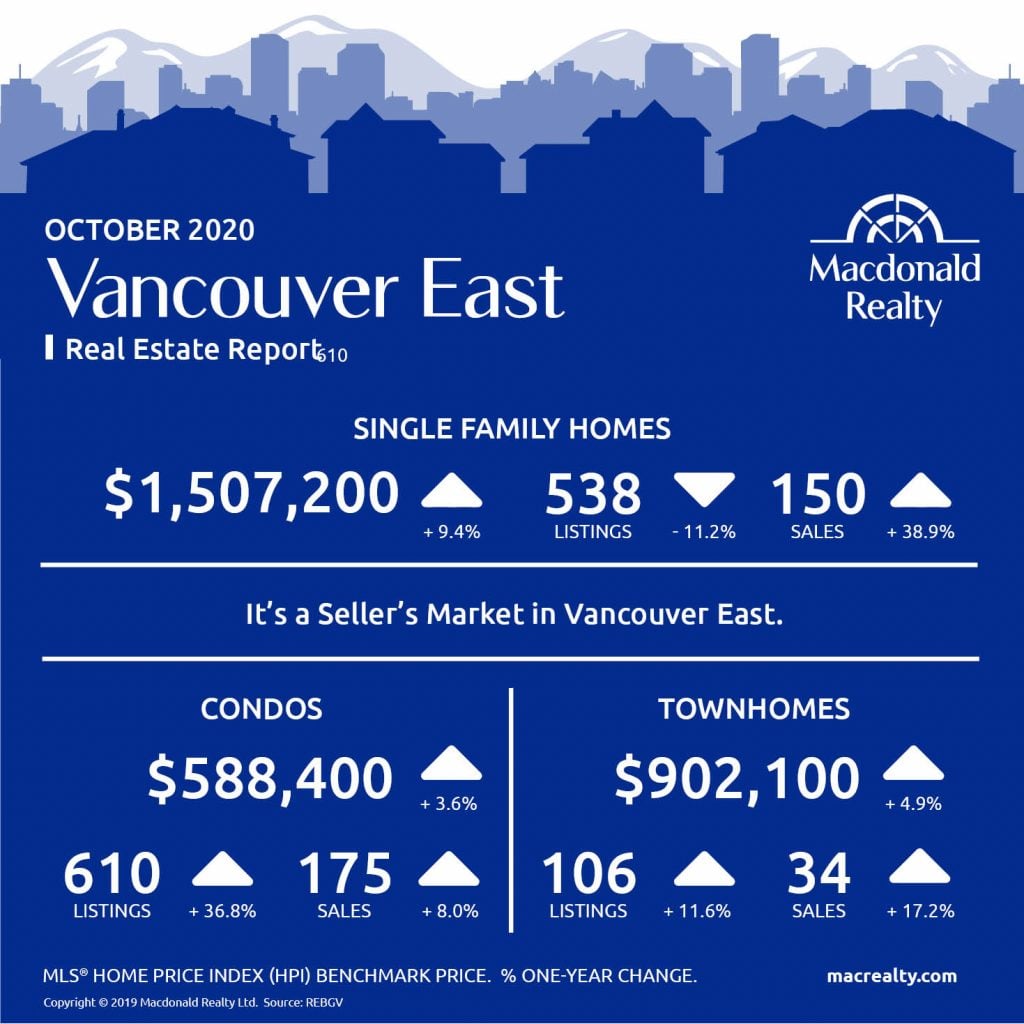
Vancouver East
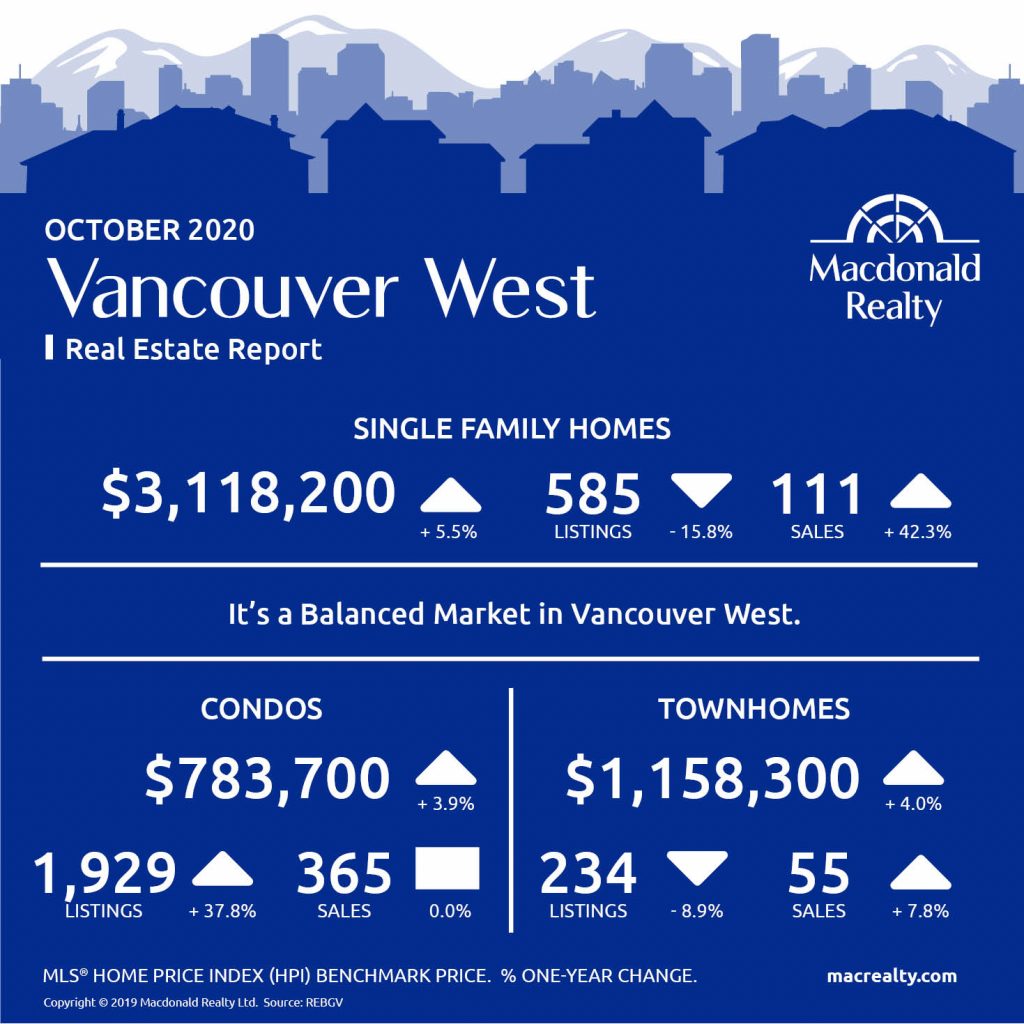
Vancouver West
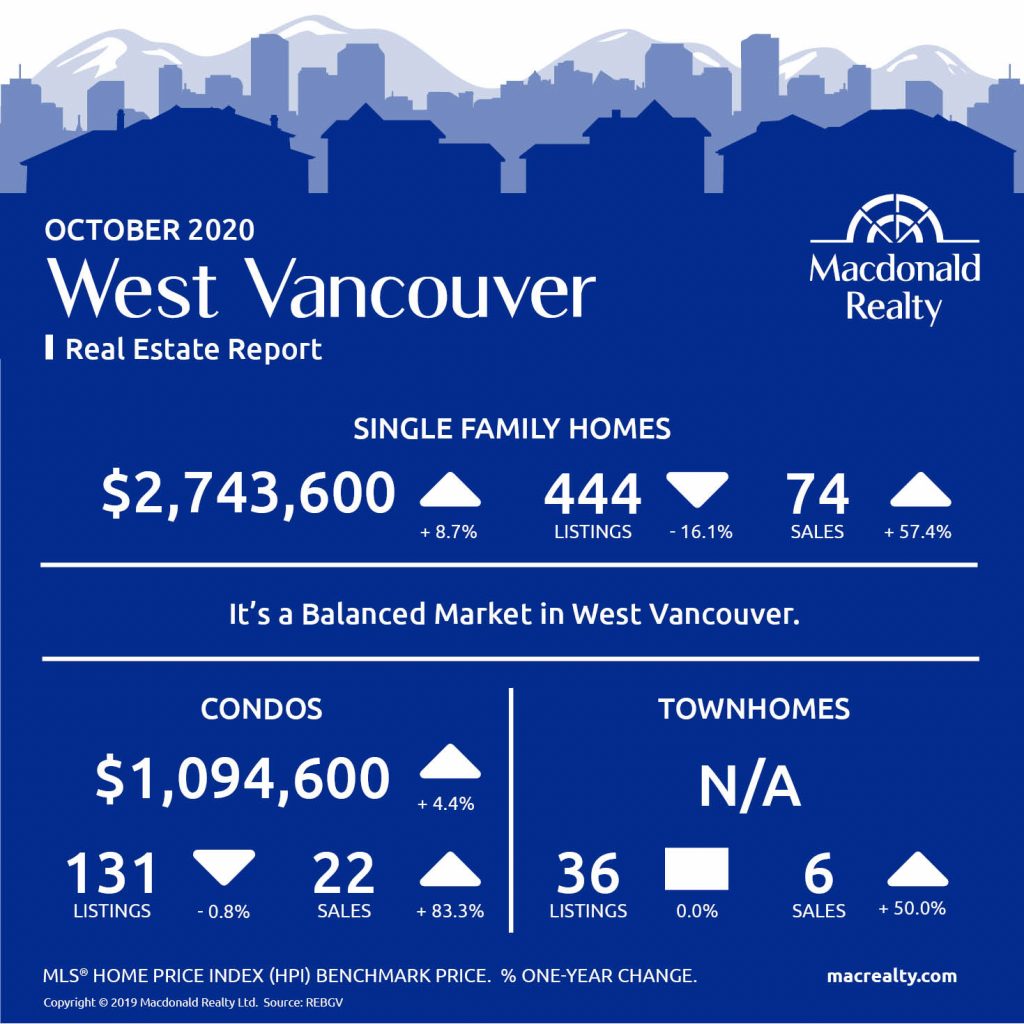
West Vancouver
Looking for more information about the real estate market in specific neighbourhoods in the Greater Vancouver?
Macdonald Realty has offices across the Greater Vancouver. Please email [email protected] or call 1-877-278-3888 to be matched with a REALTOR® working in your area.
MLS® Home Price Index (HPI) Benchmark Price
Average and median home prices are often misinterpreted, are affected by change in the mix of homes sold, and can swing dramatically from month to month (based on the types and prices of properties that sold in a given month). The MLS® HPI overcomes these shortcomings and uses the concept of a benchmark home, a notional home with common attributes of typical homes in a defined area. Visit www.housepriceindex.ca for more information.
This blog post is based on market data provided by the Real Estate Board of Greater Vancouver (REBGV) www.rebgv.org

