
Here are the latest real estate market statistics from Macdonald Realty on the Greater Vancouver listings and sales in October 2023. Find all the infographics by visiting the Facebook Album.
An increase in newly listed properties is providing more choice to home buyers across Metro Vancouver, but sales remain below long-term averages.
The Real Estate Board of Greater Vancouver (REBGV) reports that residential sales in the region totalled 1,996 in October 2023, a 3.7 per cent increase from the 1,924 sales recorded in October 2022. This total is 29.5 per cent below the 10-year seasonal average (2,832) for October.
“With properties coming to market at a rate roughly five per cent above the ten-year seasonal average, there seems to be a continuation of the renewed interest on the part of sellers to participate in the market that we’ve been watching this fall,” Andrew Lis, REBGV’s director of economics and data analytics said. “Counterbalancing this increase in supply, however, is the fact sales remain almost 30 per cent below their ten-year seasonal average, which tells us demand is not as strong as we might expect this time of year.”
There were 4,664 detached, attached and apartment properties newly listed for sale on the Multiple Listing Service® (MLS®) in Metro Vancouver in October 2023. This represents a 15.4 per cent increase compared to the 4,043 properties listed in October 2022 and is 4.8 per cent above the 10-year seasonal average (4,449) for the month.
The total number of properties currently listed for sale on the MLS® system in Metro Vancouver is 11,599, a 12.6 per cent increase compared to October 2022 (10,305). This change is also 0.6 per cent above the 10-year seasonal average (11,526).
Across all detached, attached and apartment property types, the sales-to-active listings ratio for October 2023 is 17.9 per cent. By property type, the ratio is 12.9 per cent for detached homes, 20.9 per cent for attached, and 21.5 per cent for apartments.
Analysis of the historical data suggests downward pressure on home prices occurs when the ratio dips below 12 per cent for a sustained period, while home prices often experience upward pressure when it surpasses 20 per cent over several months.
“With more supply in the form of resale inventory, and weaker demand in the form of slower sales, we’ve seen market conditions overall adjust towards more balanced conditions. It’s noteworthy that the multifamily segment remains more active than the detached segment at this time,” Lis said. “While the highest borrowing costs we’ve seen in over a decade continue to constrain affordability, a silver lining for buyers is that price increases have abated with these more balanced market conditions, meaning purchasing power is holding steady for the moment.”
The MLS® Home Price Index composite benchmark price for all residential properties in Metro Vancouver is currently $1,196,500. This represents a 4.4 per cent increase over October 2022 and a 0.6 per cent decrease compared to September 2023.
*Areas covered by the Real Estate Board of Greater Vancouver include Burnaby, Coquitlam, Maple Ridge, New Westminster, North Vancouver, Pitt Meadows, Port Coquitlam, Port Moody, Richmond, South Delta, Squamish, Sunshine Coast, Vancouver, West Vancouver, and Whistler. Check out the infographics of Squamish, Sunshine Coast and Whistler, HERE.
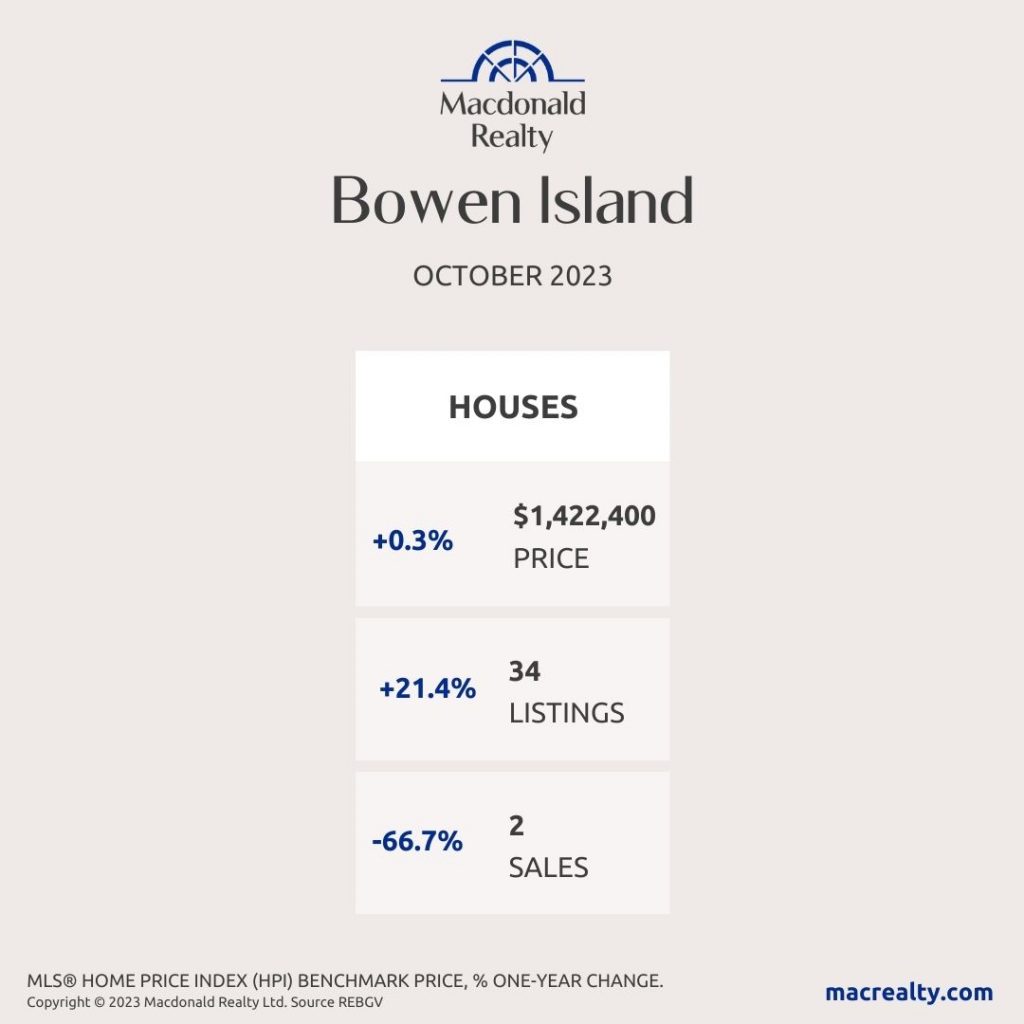
Bowen Island
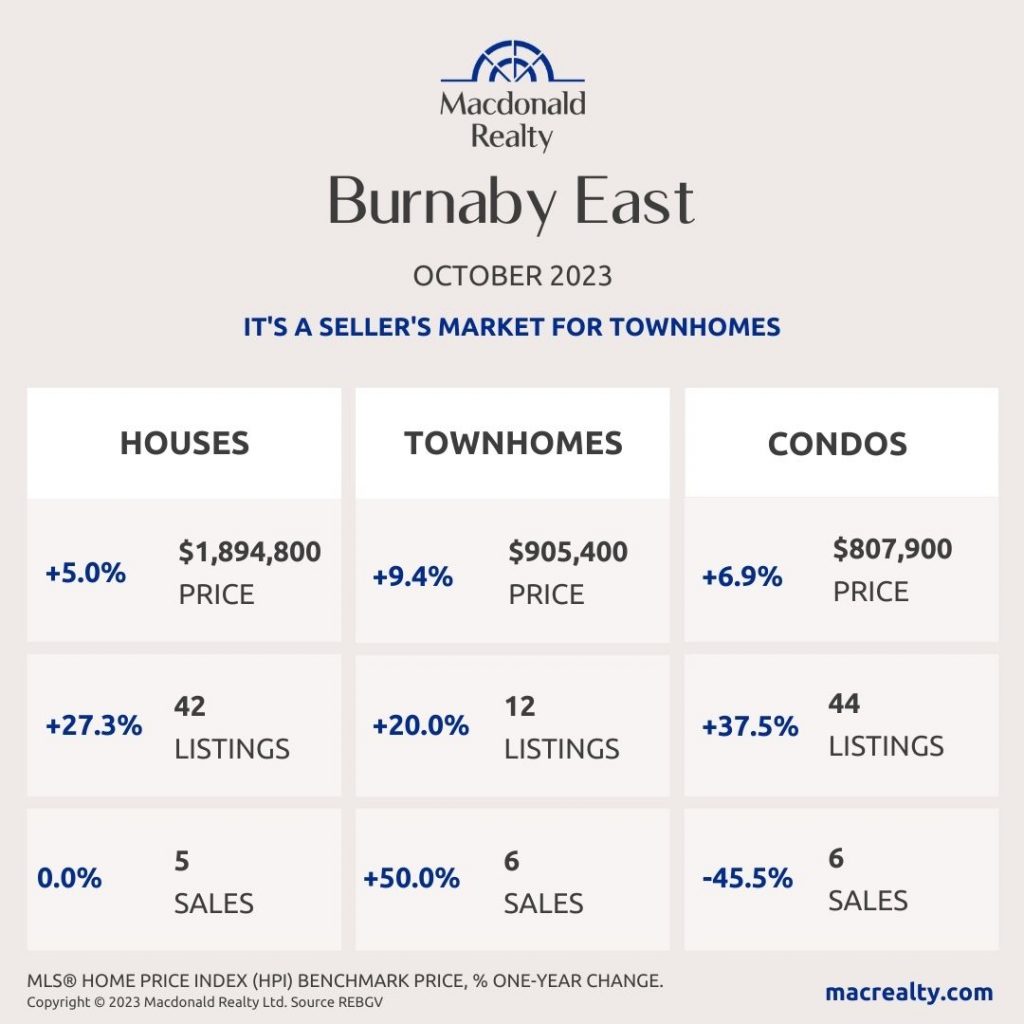
Burnaby East
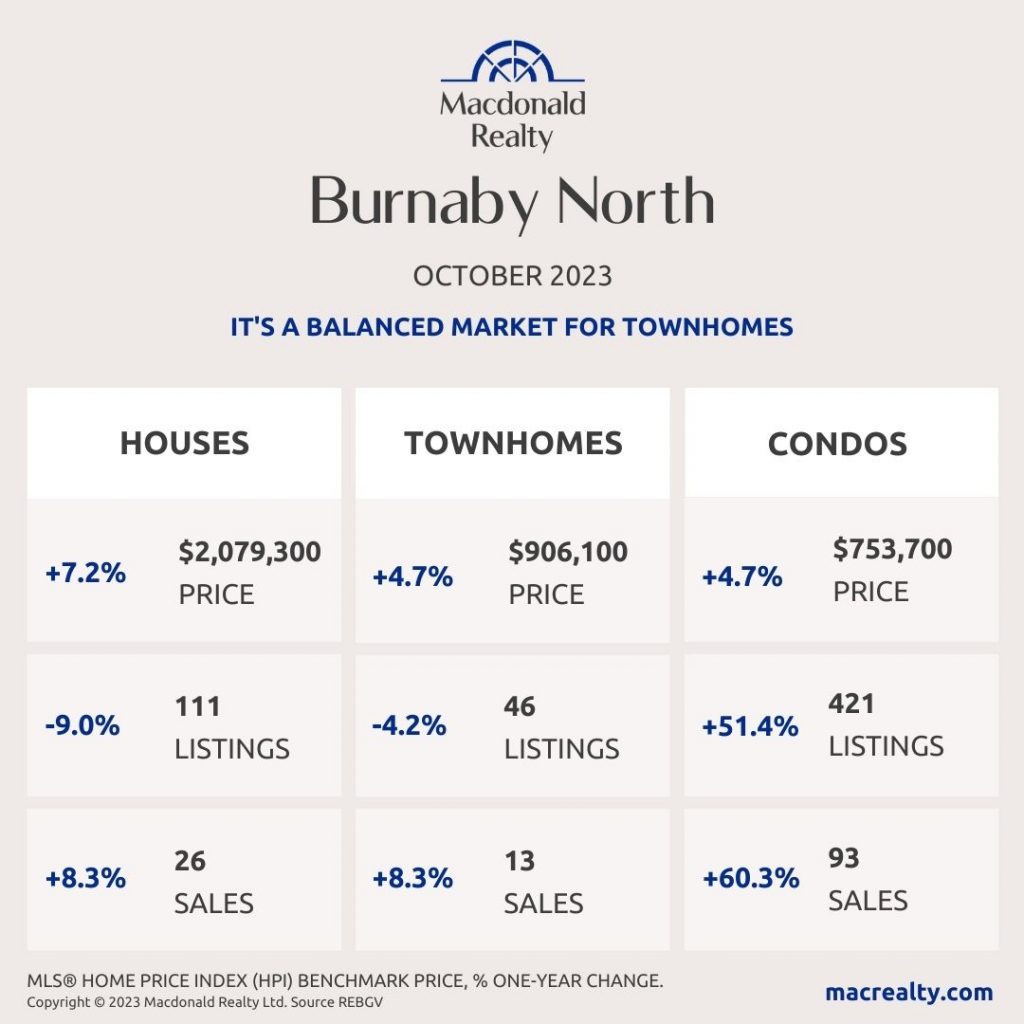
Burnaby North
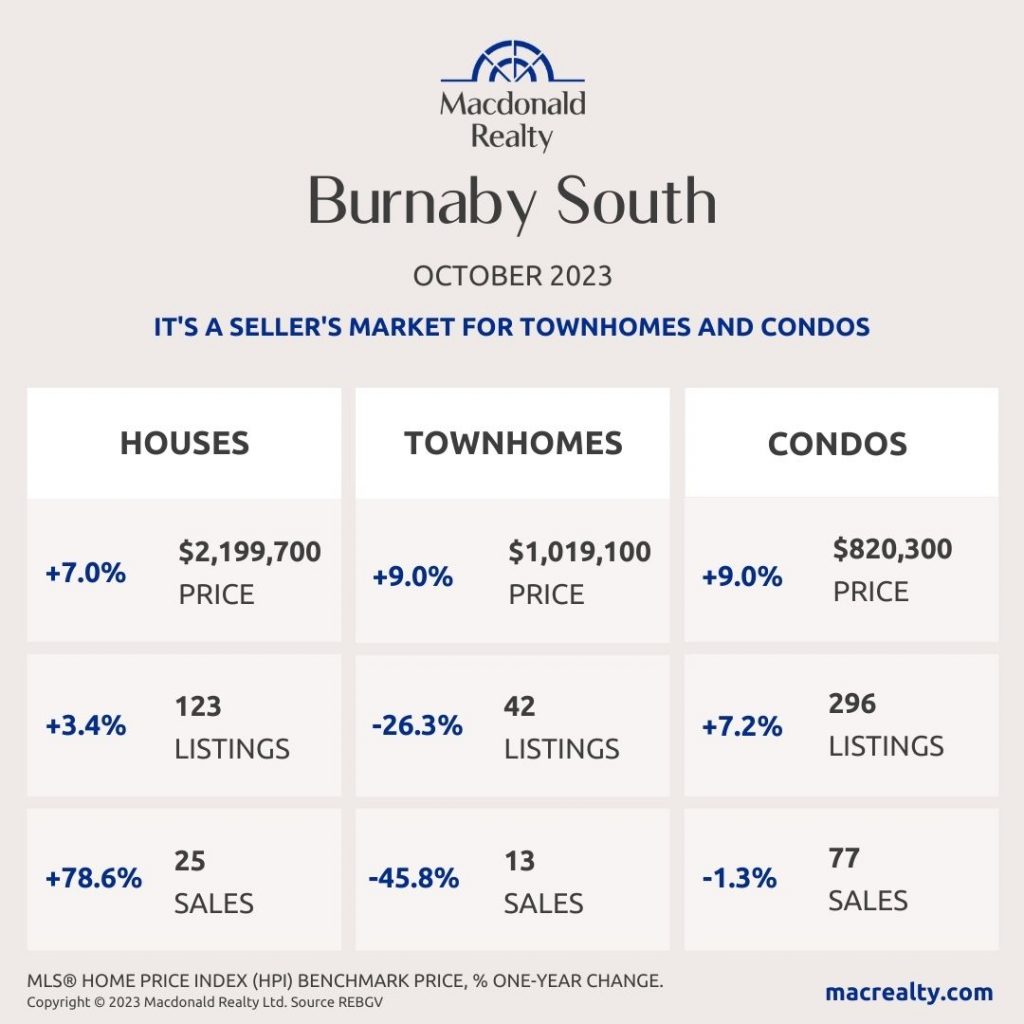
Burnaby South
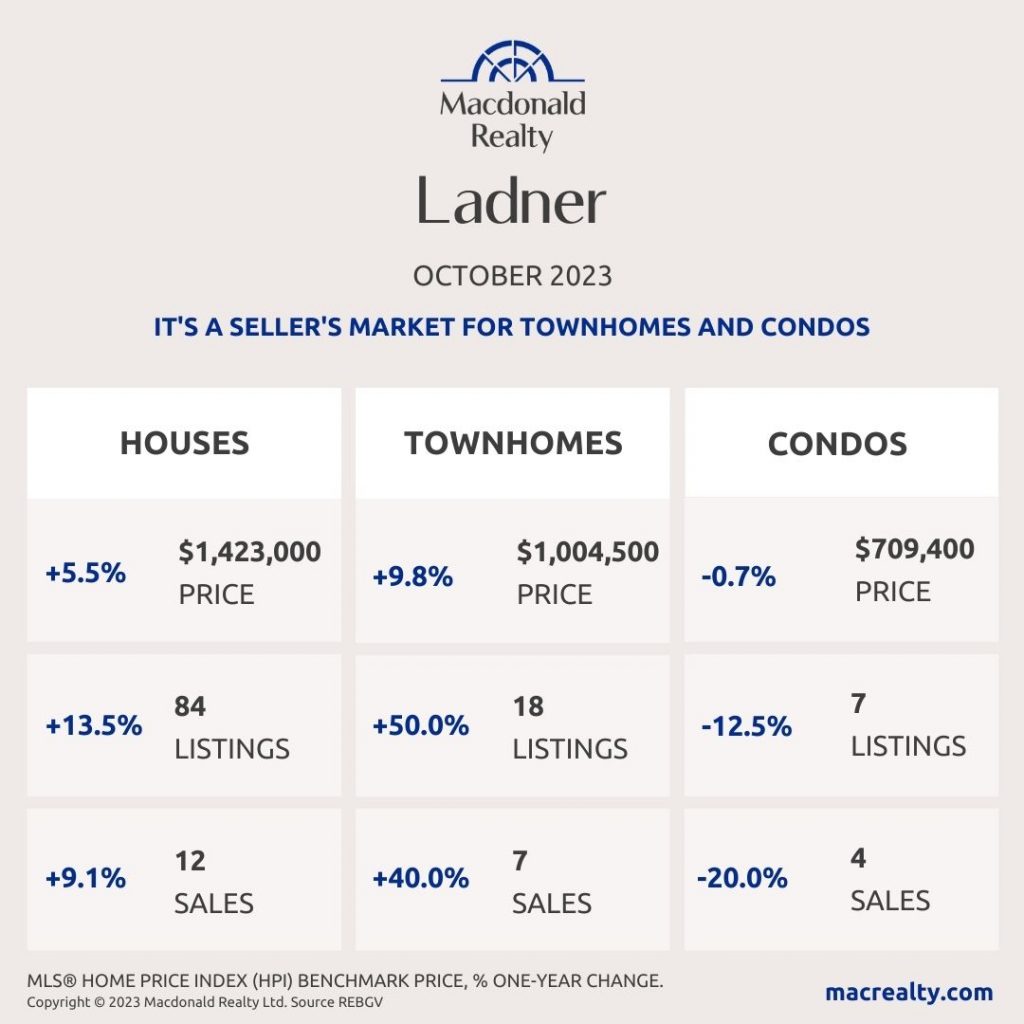
Ladner
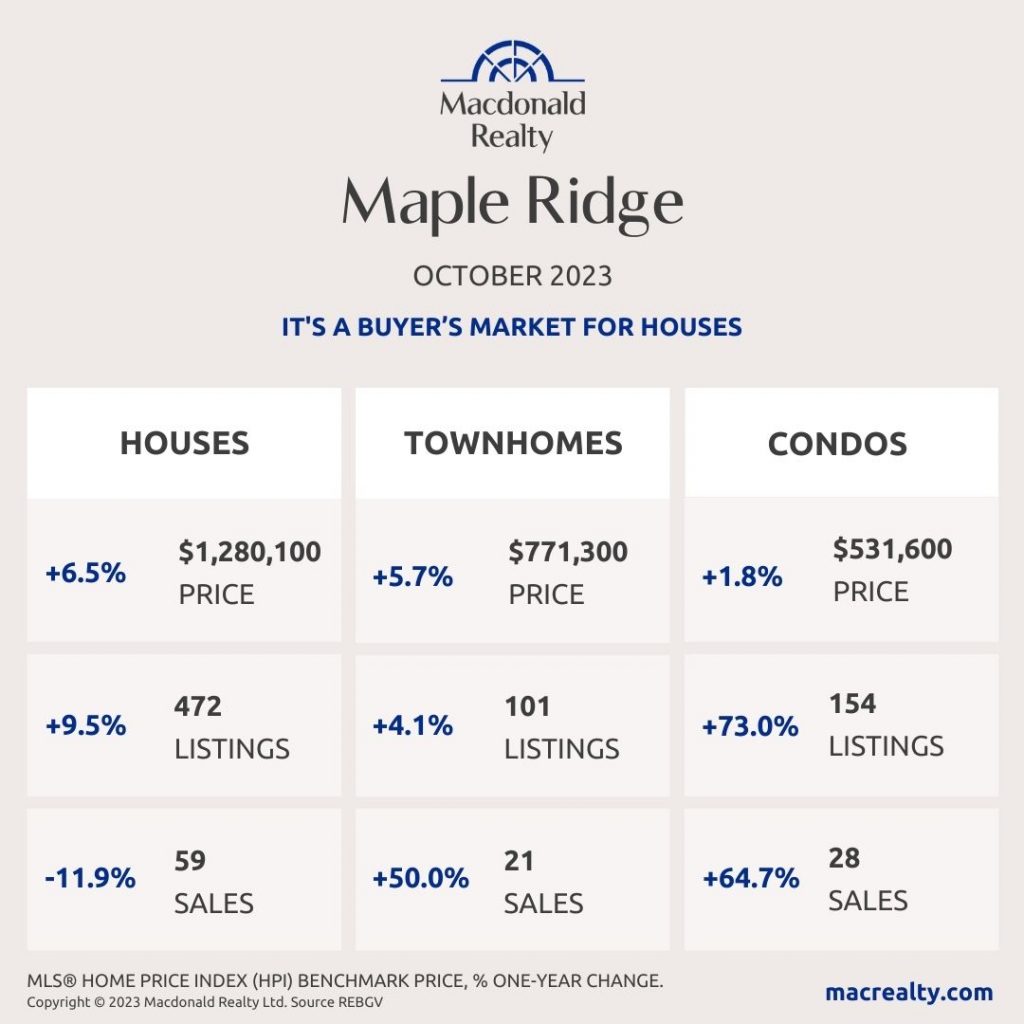
Maple Ridge
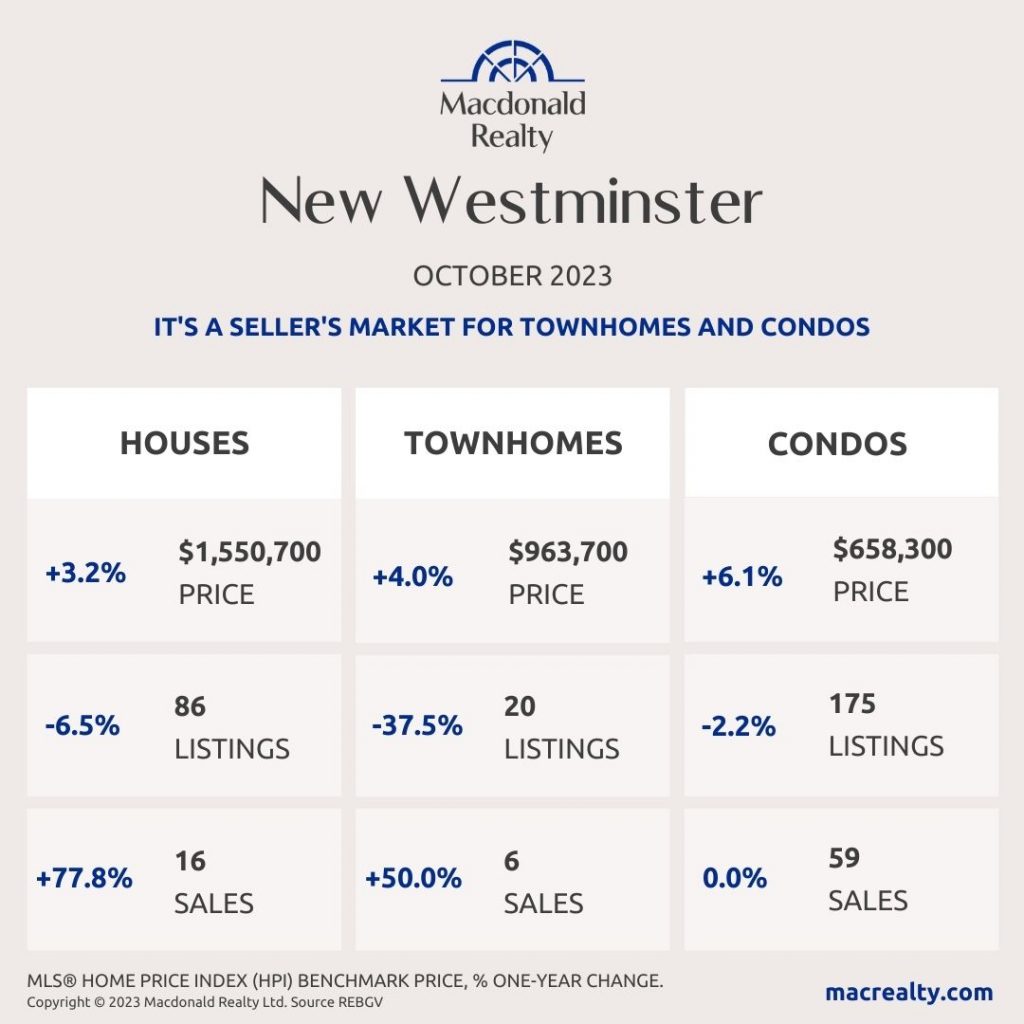
New Westminster
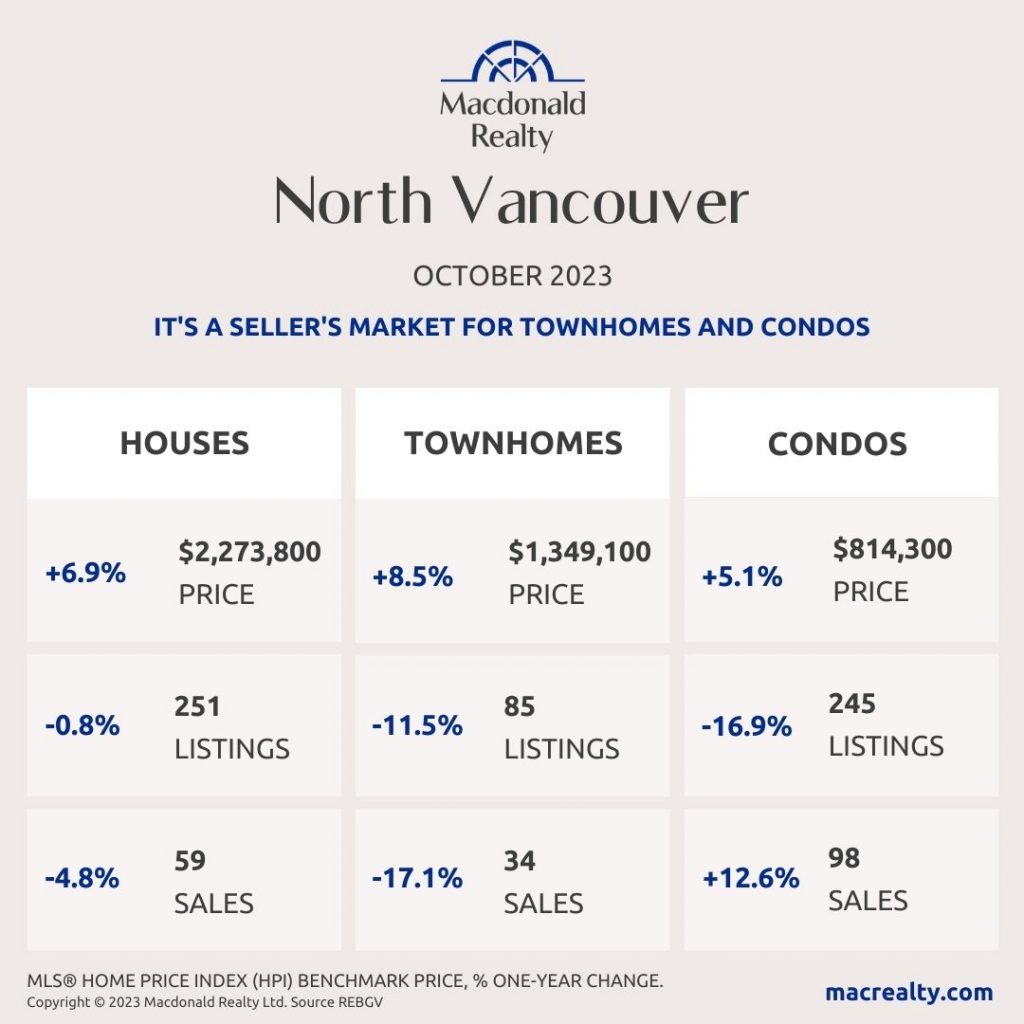
North Vancouver
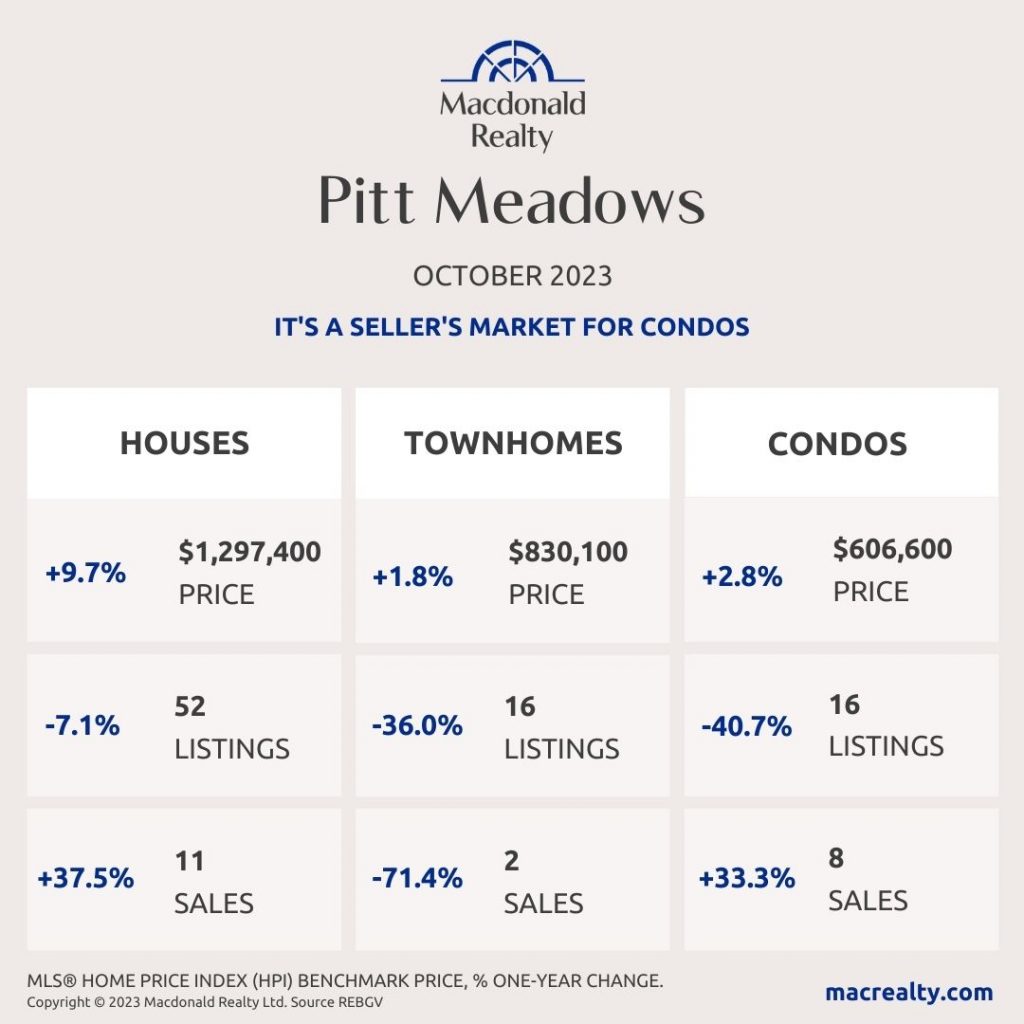
Pitt Meadows
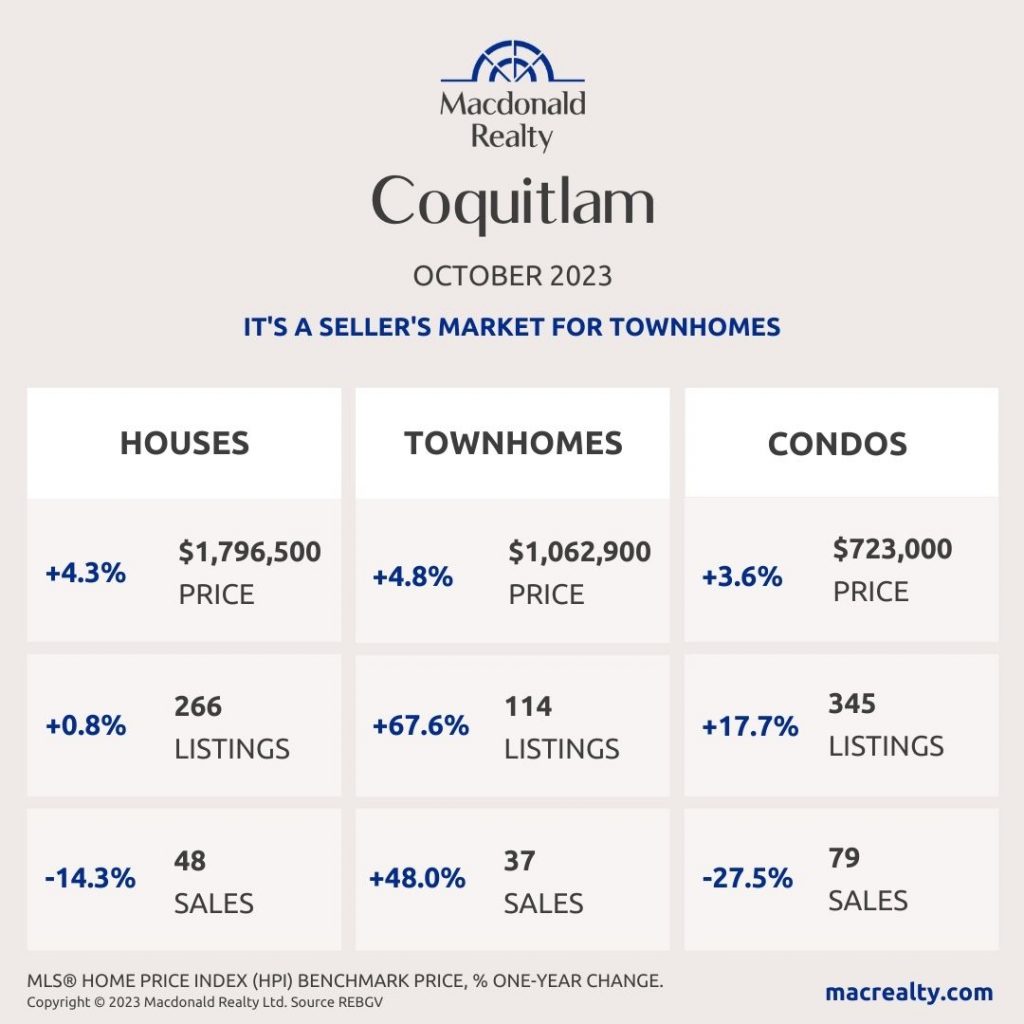
Coquitlam
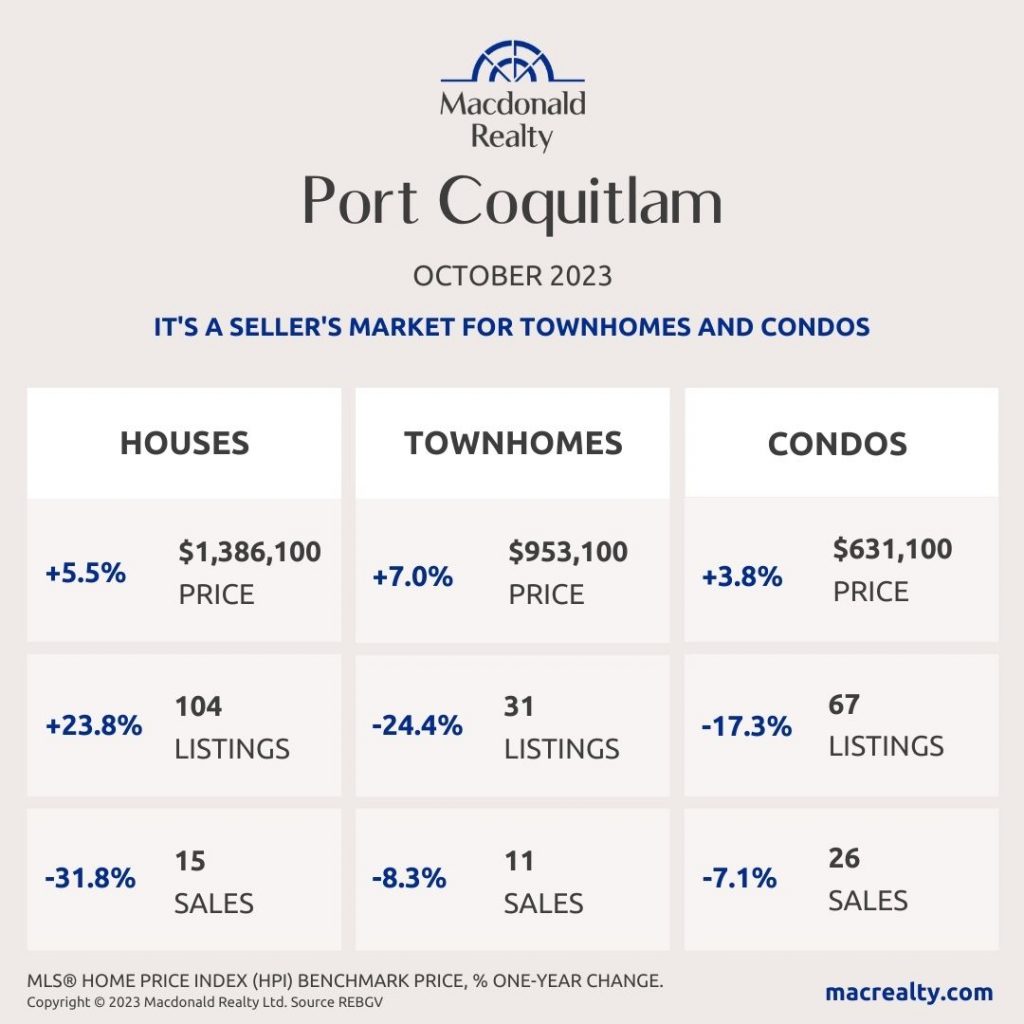
Port Coquitlam
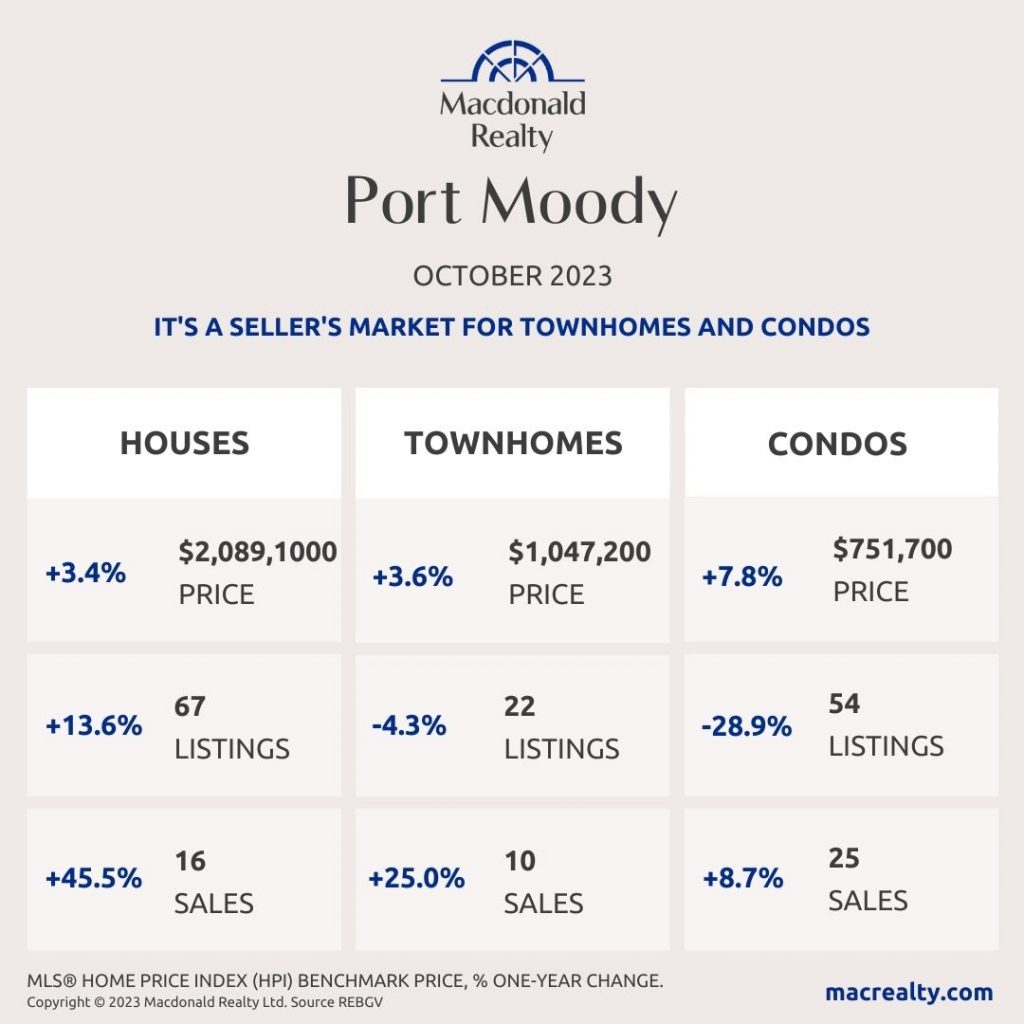
Port Moody
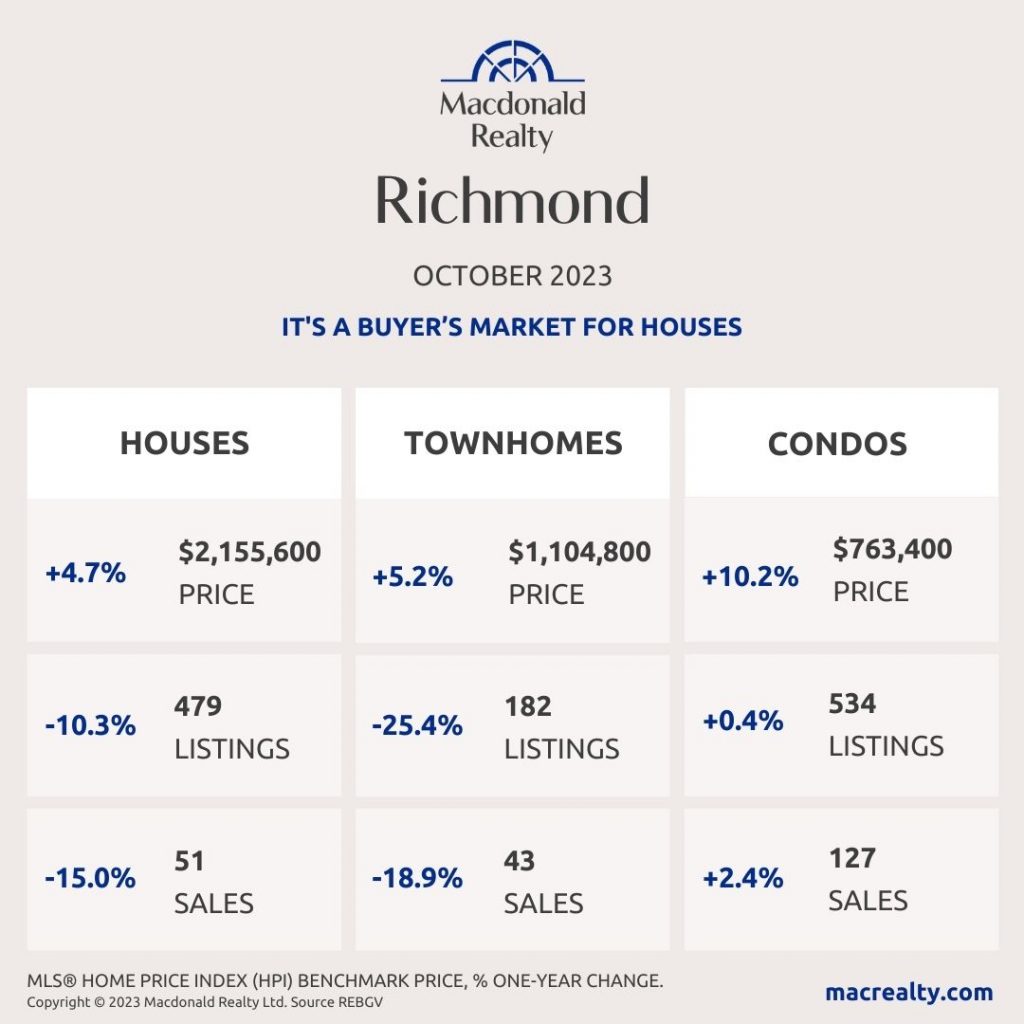
Richmond
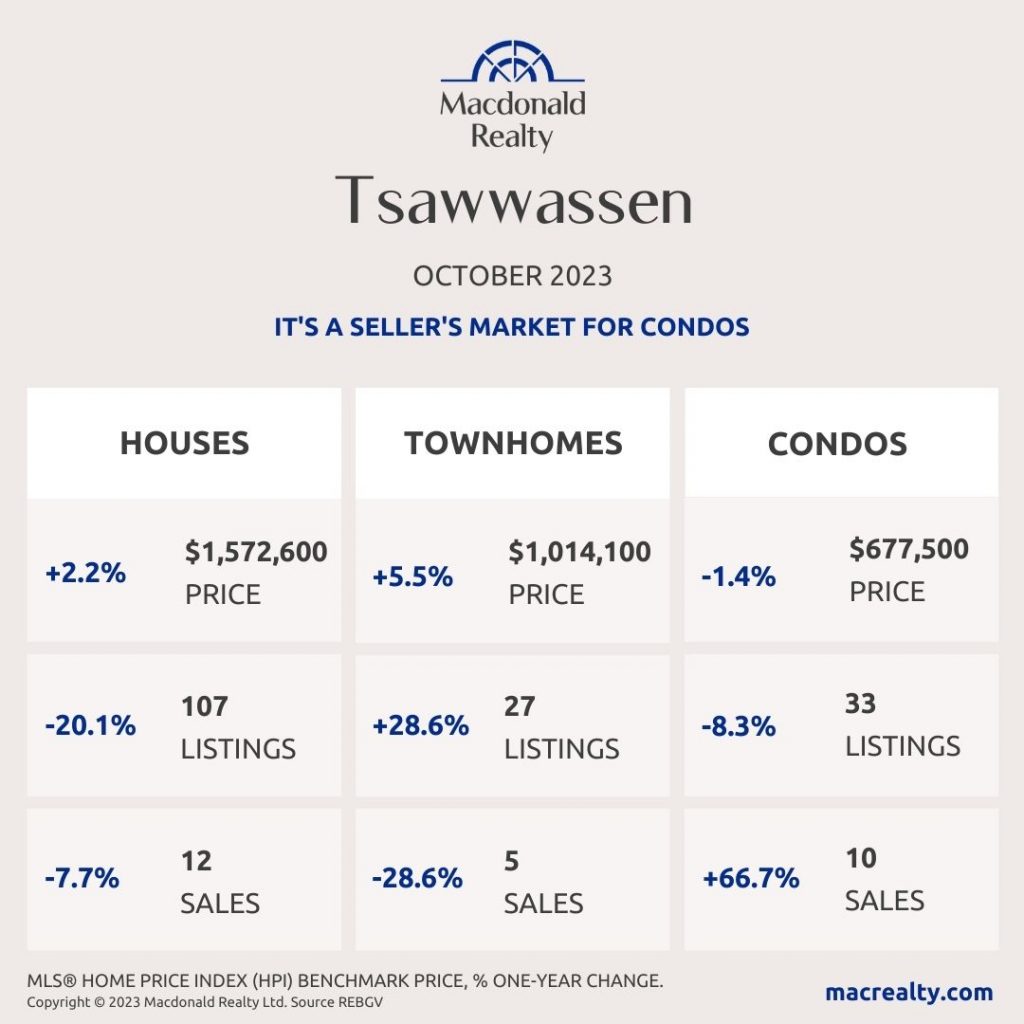
Tsawwassen
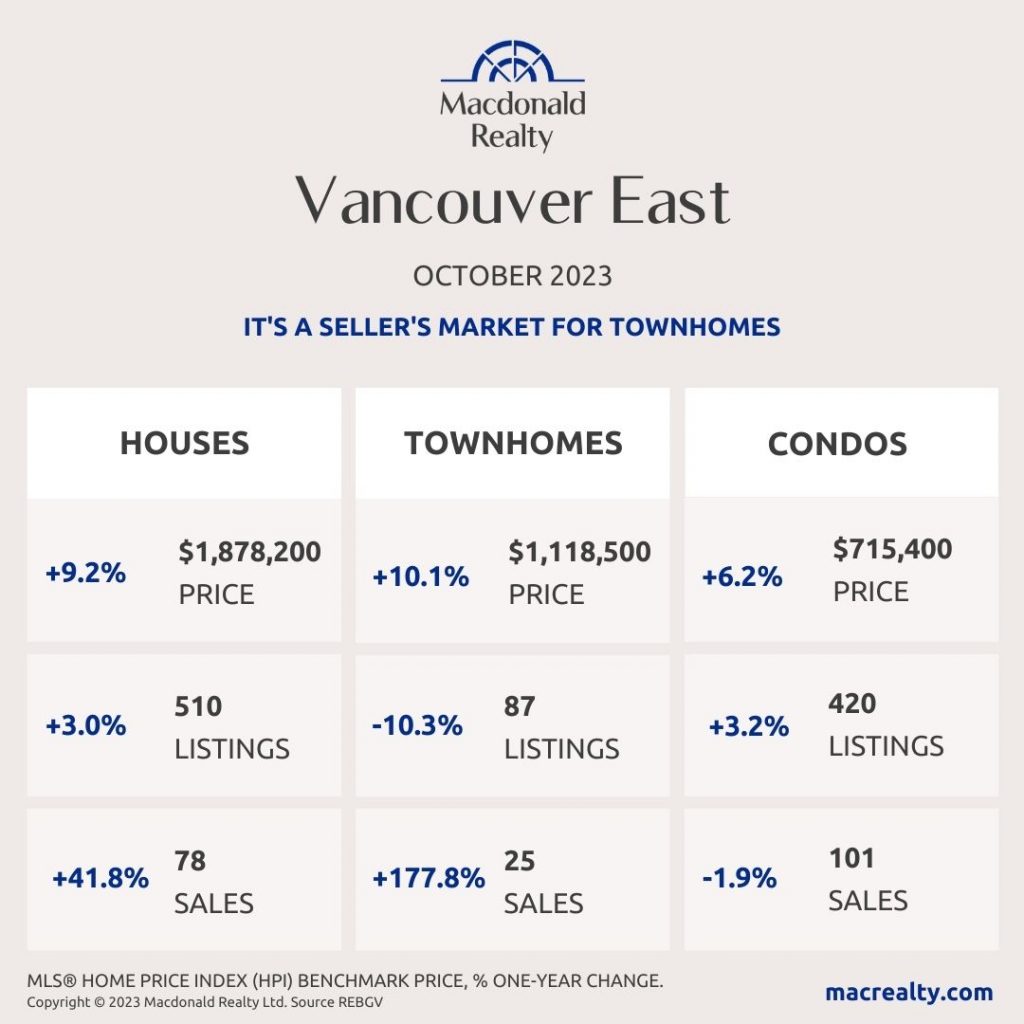
Vancouver East
Vancouver West

West Vancouver
Looking for more information about the real estate market in specific neighbourhoods in the Greater Vancouver?
Macdonald Realty has offices across the Greater Vancouver. Please email [email protected] or call 1-877-278-3888 to be matched with a REALTOR® working in your area.
MLS® Home Price Index (HPI) Benchmark Price
Average and median home prices are often misinterpreted, are affected by change in the mix of homes sold, and can swing dramatically from month to month (based on the types and prices of properties that sold in a given month). The MLS® HPI overcomes these shortcomings and uses the concept of a benchmark home, a notional home with common attributes of typical homes in a defined area. Visit www.housepriceindex.ca for more information.
This blog post is based on market data provided by the Real Estate Board of Greater Vancouver (REBGV) www.rebgv.org

