January 2022 – Lower Mainland Monthly Update (REBGV & FVREB)
Sales Break all records in 2021!
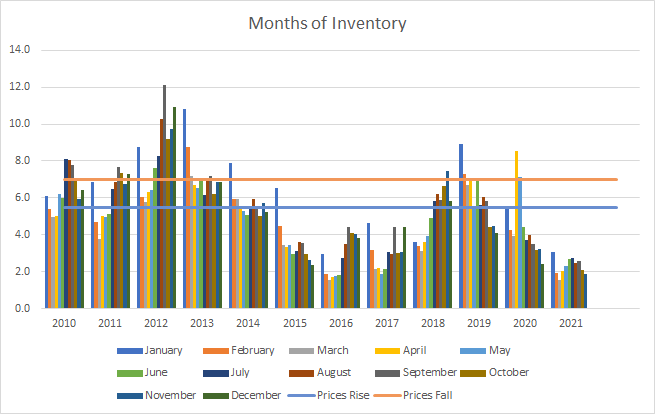
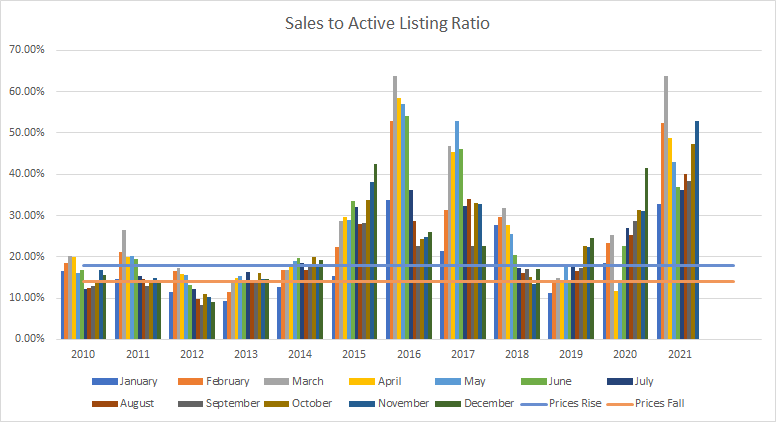
The most reliable indicator of market prices is the Sales to Active Listings Ratio (SAL). This is the ratio between the number of sales in a given month and the number of active listings at month-end.
In hotter markets in BC, a long-term analysis has shown that prices will usually act in the following ways:
- 7+ Months of Inventory (Under 14% SAL): Prices will likely DECLINE
- 5 – 7 Months of Inventory (14% – 18% SAL): Prices will likely be STABLE
- Less than 5.5 Months of Inventory (Over 18% SAL): Prices will likely RISE
Visit this link to learn more about house prices and inventory.
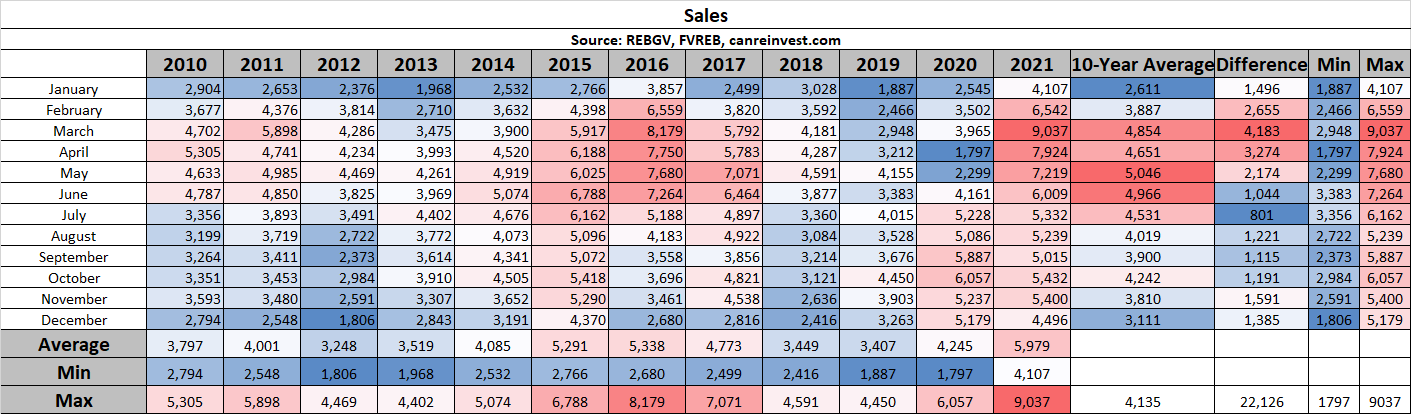
Sales
The 4,496 Sales in December is lower than last year (5,179), but is still 30% HIGHER than the 10-year average (3,111).
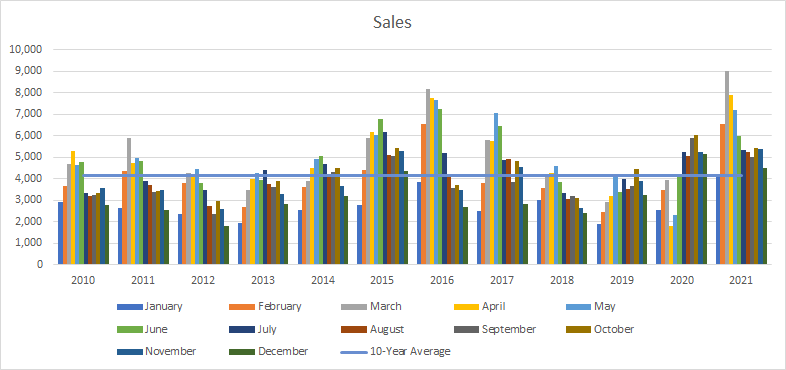
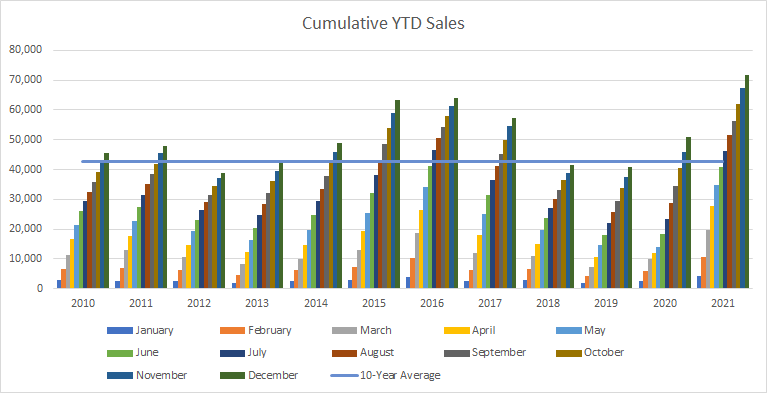
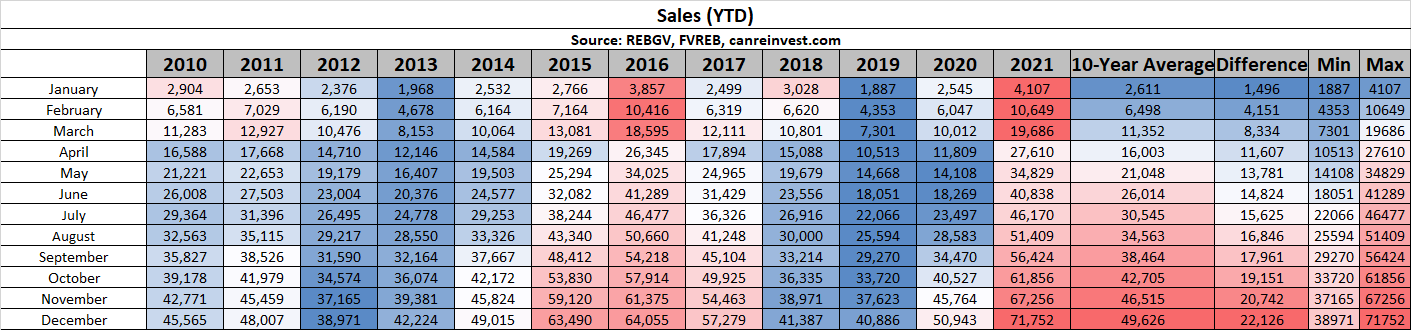
Cumulative Year-to-date Sales
71,752 Sales in 2021 is an ALL-TIME RECORD, beating the previous high of 64,055 (2016) and is over 30% higher than the 10-year average (49,626)
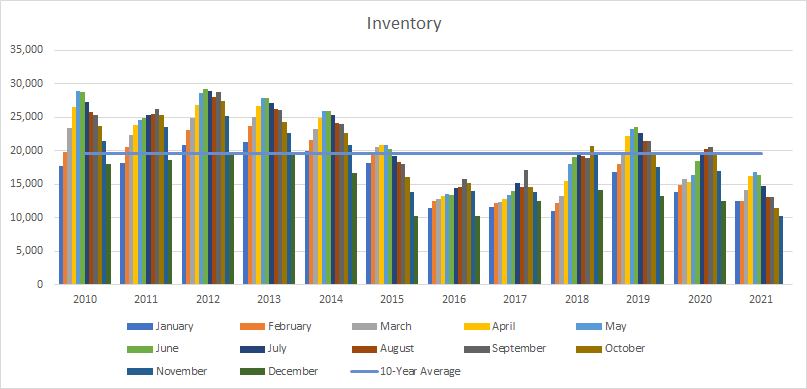
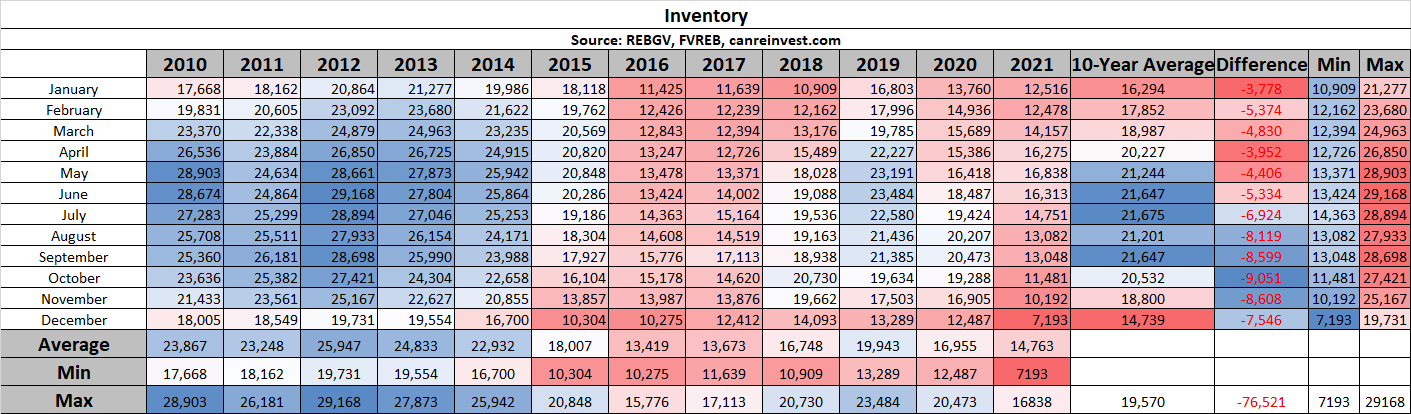
Inventory
Inventory in December reached an ALL-TIME LOW of 7,193 active listings. To put this in perspective, inventory from 2010 – 2014 averaged 25,000 listings.
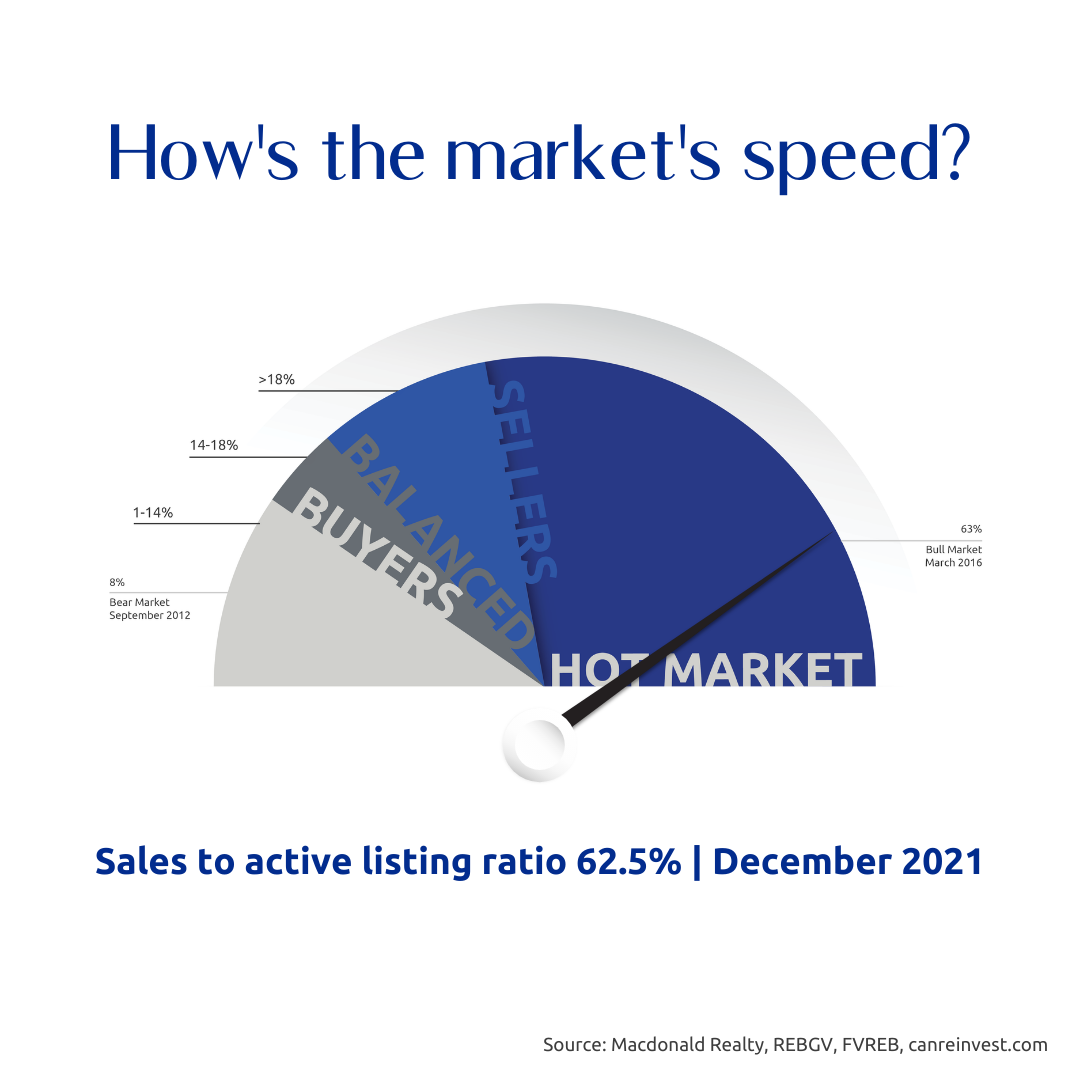
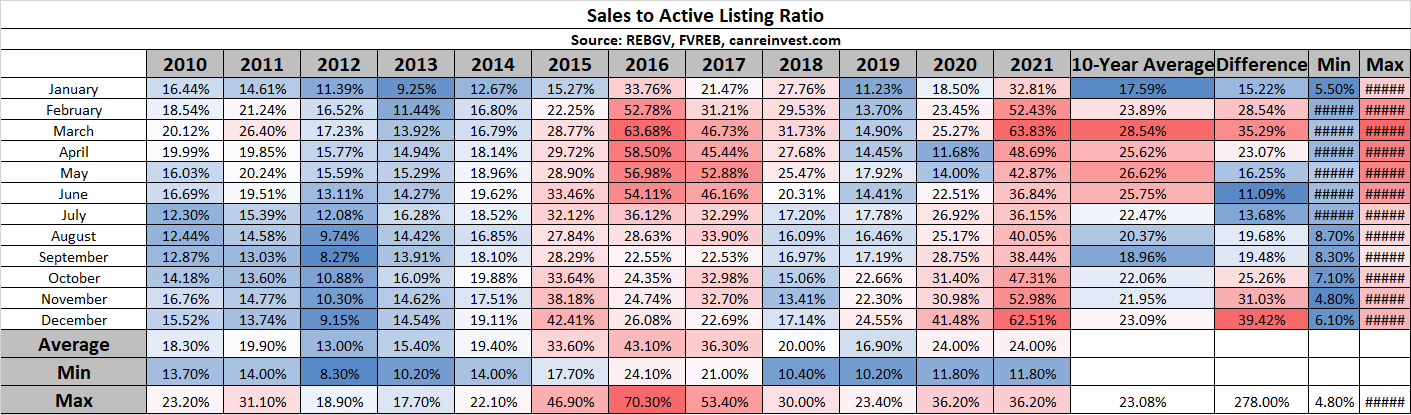
Sales to Active Listings
At 62.5%, SAL is close to the ALL-TIME HIGH of 63.7% set in March 2016
Months of Inventory
With only 1.6 Months of Inventory, this ties the ALL-TIME LOW in MOI, indicating rising prices moving forward.