by Macrealty Marketing Team | Jan 7, 2021 | Market Updates
Here are the latest real estate market statistics from Macdonald Realty on Okanagan listings and sales in December 2020.
Find the infographics by visiting the Facebook Album.
Central Okanagan: Kelowna and Lake Country
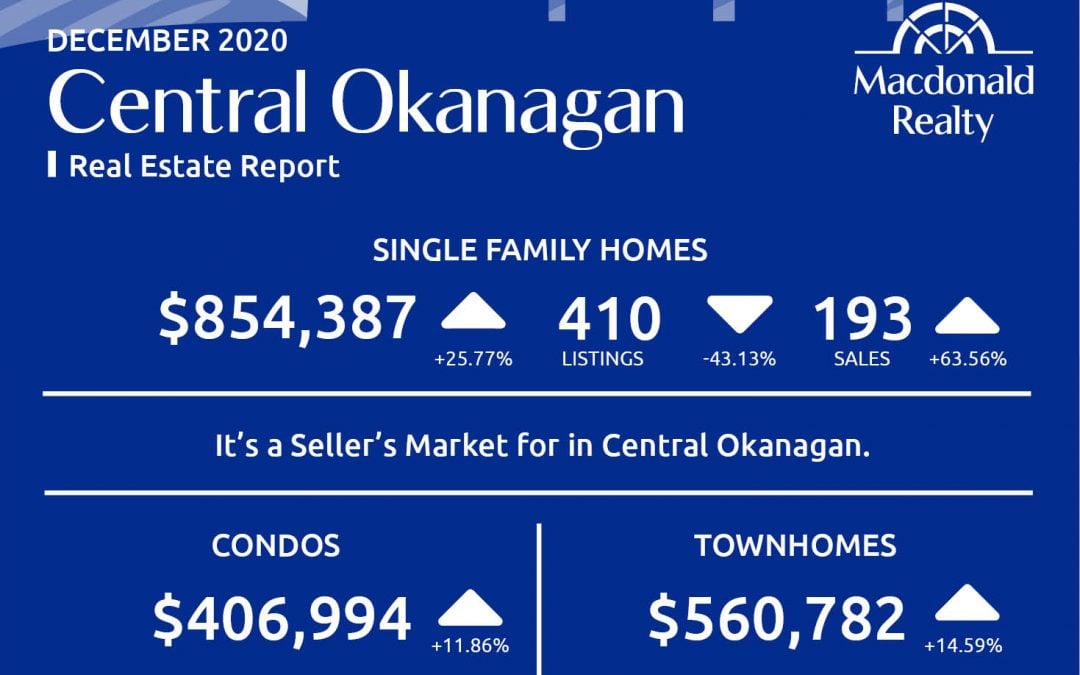
There were 193 sales, 410 active listings, and an $854,387 average sale price for detached homes in the Central Okanagan market, including Kelowna and Lake Country.
The condo market featured 102 sales and 367 active listings at the end of the month. The average sale price was $406,994.
Townhome sales were 98, active listings were 170 and the average sale price was $560,782.
It’s a seller’s market in Central Okanagan.

North Okanagan: Vernon and surrounding area
In North Okanagan, including Vernon and the surrounding area and the average sale price was $651,430. At the end of the month, there were 85 sales and 165 active listings.
There were 16 sales and 78 active listings for condos. The average sale price was $285,768.
In comparison, townhomes featured 32 sales, 49 active listings and a $371,186 average sale price.
It’s a seller’s market for Homes and Townhomes in North Okanagan.

Looking for more information about the real estate market in specific neighbourhoods in Okanagan?
Macdonald Realty has offices in Kelowna and across BC. Please email [email protected] or call 1-877-278-3888 to be matched with a REALTOR® working in your area.
This blog post is based on market data provided by Okanagan Mainline Real Estate Board (OMREB) www.omreb.com.
by Macrealty Marketing Team | Dec 3, 2020 | Market Updates
Here are the latest real estate market statistics from Macdonald Realty on Okanagan listings and sales in November 2020.
Find the infographics by visiting the Facebook Album.
Central Okanagan: Kelowna and Lake Country
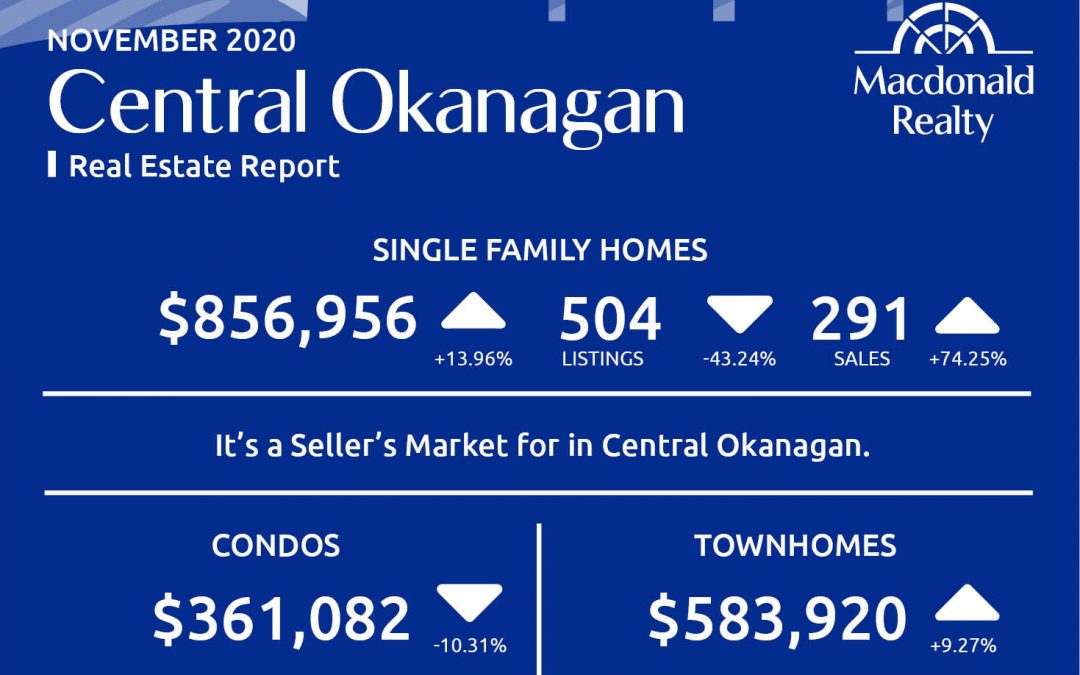
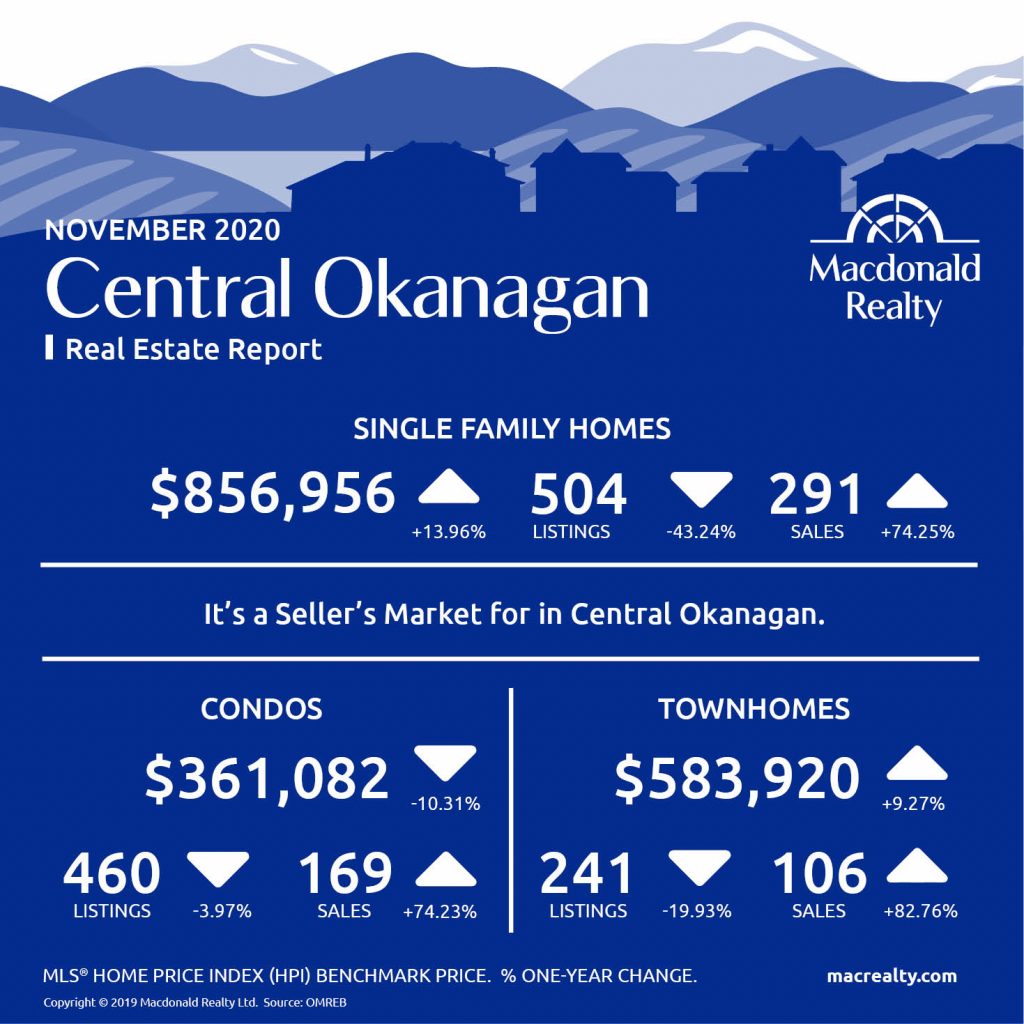
There were 291 sales, 504 active listings, and an $856,956 average sale price for detached homes in the Central Okanagan market, including Kelowna and Lake Country.
The condo market featured 169 sales and 460 active listings at the end of the month. The average sale price was $361,082.
Townhome sales were 106, active listings were 241 and the average sale price was $583,920.
It’s a seller’s market in Central Okanagan.
North Okanagan: Vernon and surrounding area
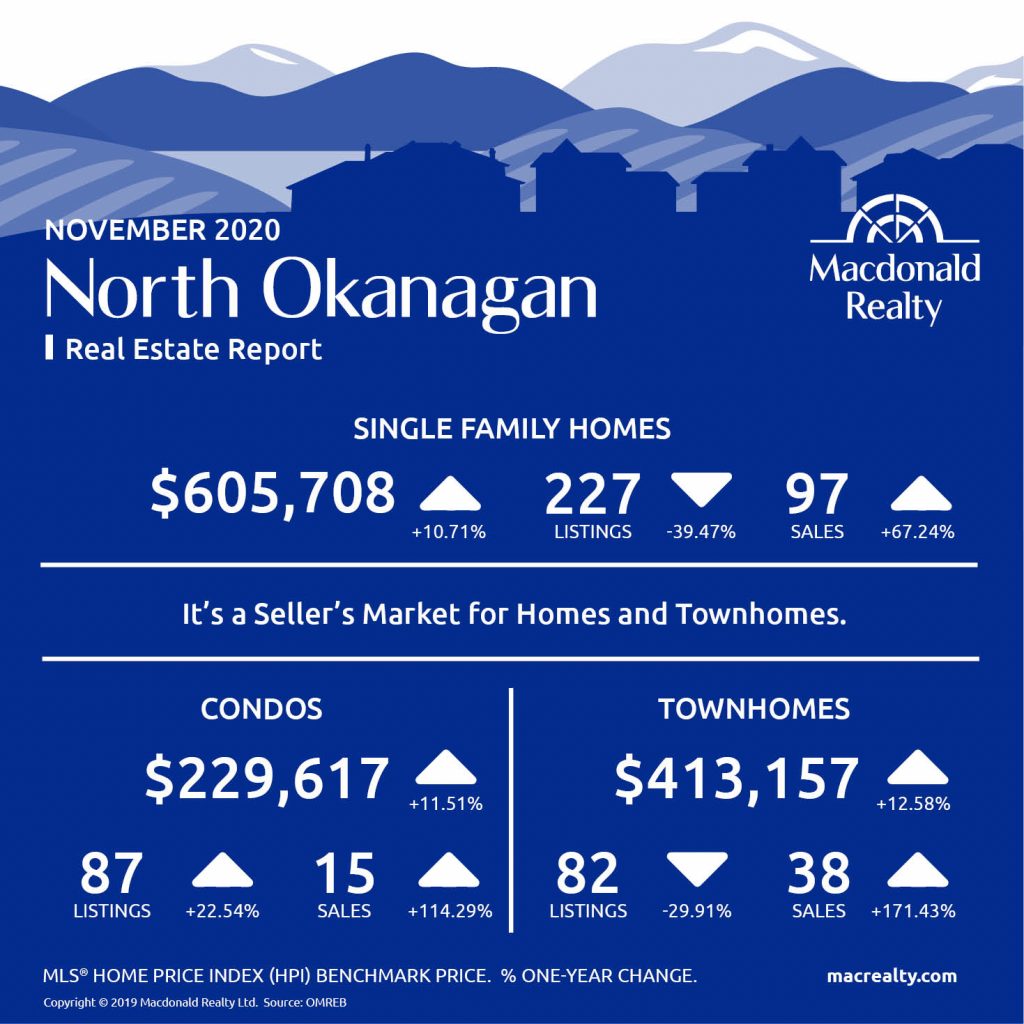
In North Okanagan, including Vernon and the surrounding area and the average sale price was $605,708. At the end of the month, there were 97 sales and 227 active listings.
There were 15 sales and 87 active listings for condos. The average sale price was $229,617.
In comparison, townhomes featured 38 sales, 82 active listings and a $413,157 average sale price.
It’s a seller’s market in North Okanagan.
Looking for more information about the real estate market in specific neighbourhoods in Okanagan?
Macdonald Realty has offices in Kelowna and across BC. Please email [email protected] or call 1-877-278-3888 to be matched with a REALTOR® working in your area.
This blog post is based on market data provided by Okanagan Mainline Real Estate Board (OMREB) www.omreb.com.

by Macrealty Marketing Team | Nov 4, 2020 | Market Updates
Here are the latest real estate market statistics from Macdonald Realty on Okanagan listings and sales in October 2020.
Find the infographics by visiting the Facebook Album.
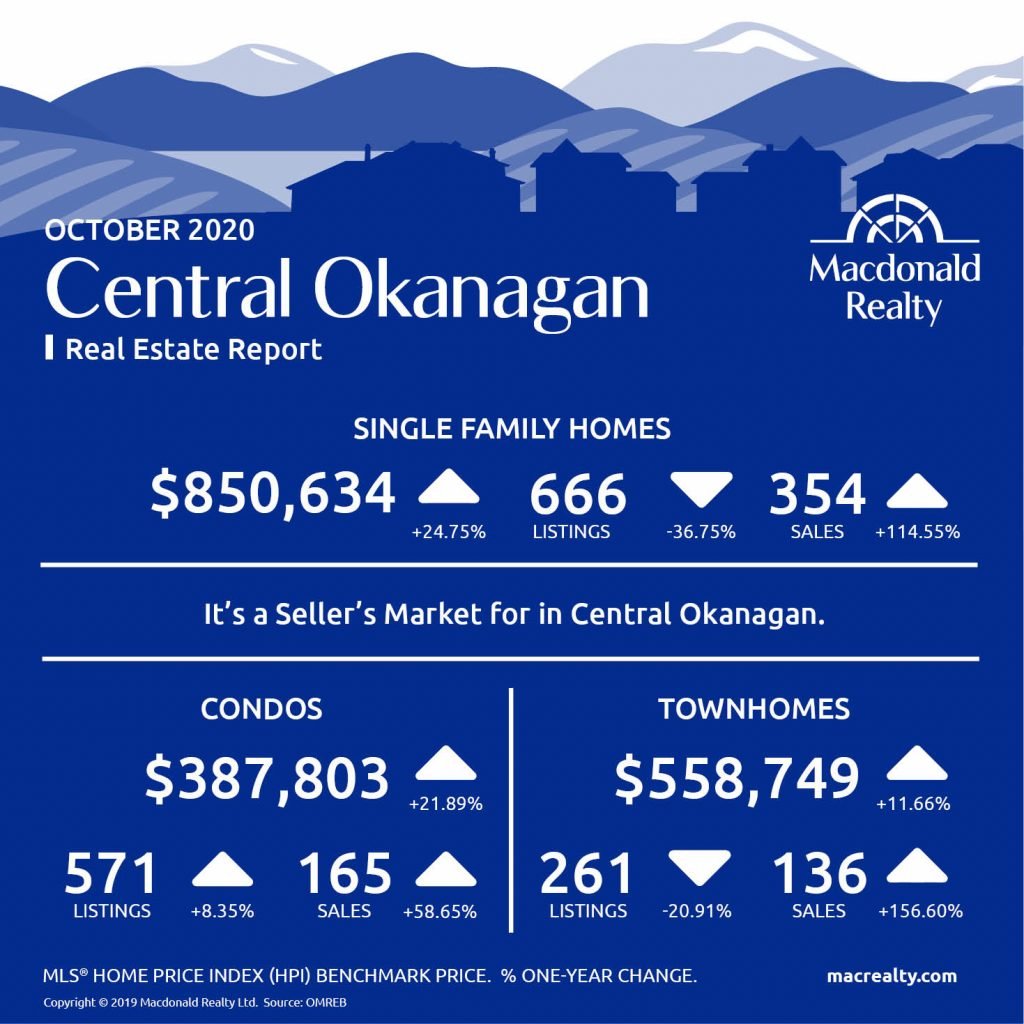
Central Okanagan: Kelowna and Lake Country
There were 354 sales, 666 active listings, and an $850,634 average sale price for detached homes in the Central Okanagan market, including Kelowna and Lake Country.
The condo market featured 165 sales and 571 active listings at the end of the month. The average sale price was $387,803.
Townhome sales were 136, active listings were 261and the average sale price was $558,749.
It’s a seller’s market in Central Okanagan.
North Okanagan: Vernon and surrounding area
In North Okanagan, including Vernon and the surrounding area and the average sale price was $624,801. At the end of the month, there were 143 sales and 293 active listings.
There were 24 sales and 82 active listings for condos. The average sale price was $280,815.
In comparison, townhomes featured 35 sales, 101 active listings and a $412,183 average sale price.
It’s a seller’s market in North Okanagan.

Looking for more information about the real estate market in specific neighbourhoods in Okanagan?
Macdonald Realty has offices in Kelowna and across BC. Please email [email protected] or call 1-877-278-3888 to be matched with a REALTOR® working in your area.
This blog post is based on market data provided by Okanagan Mainline Real Estate Board (OMREB) www.omreb.com.
by Macrealty Marketing Team | Oct 5, 2020 | Market Updates
Here are the latest real estate market statistics from Macdonald Realty on Okanagan listings and sales in September 2020.
Find the infographics by visiting the Facebook Album.
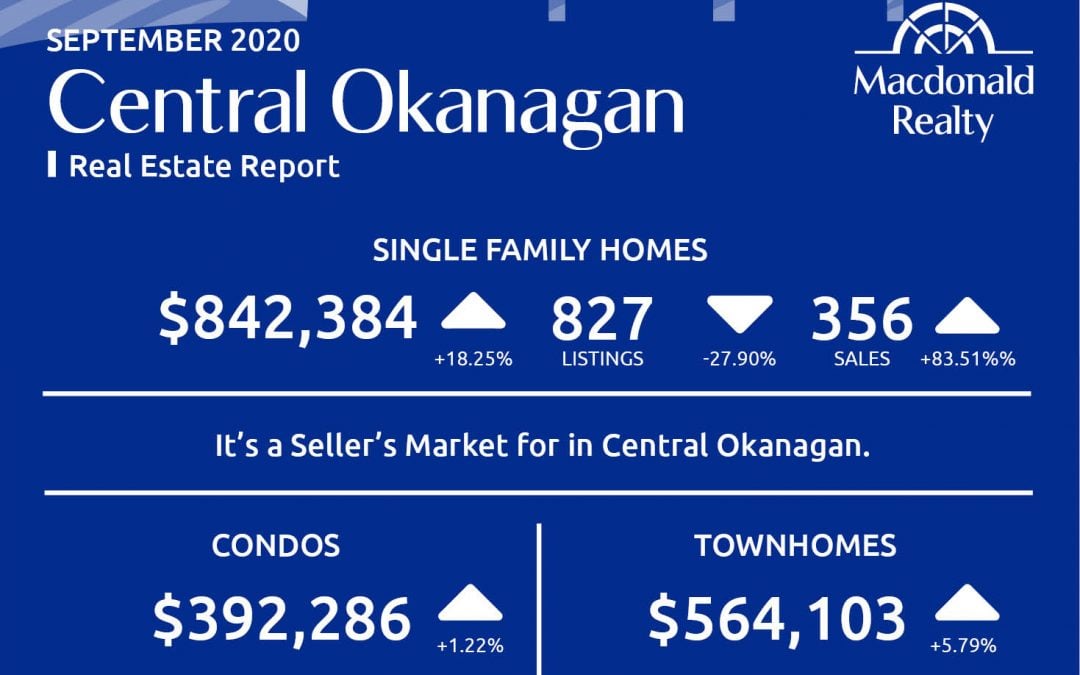
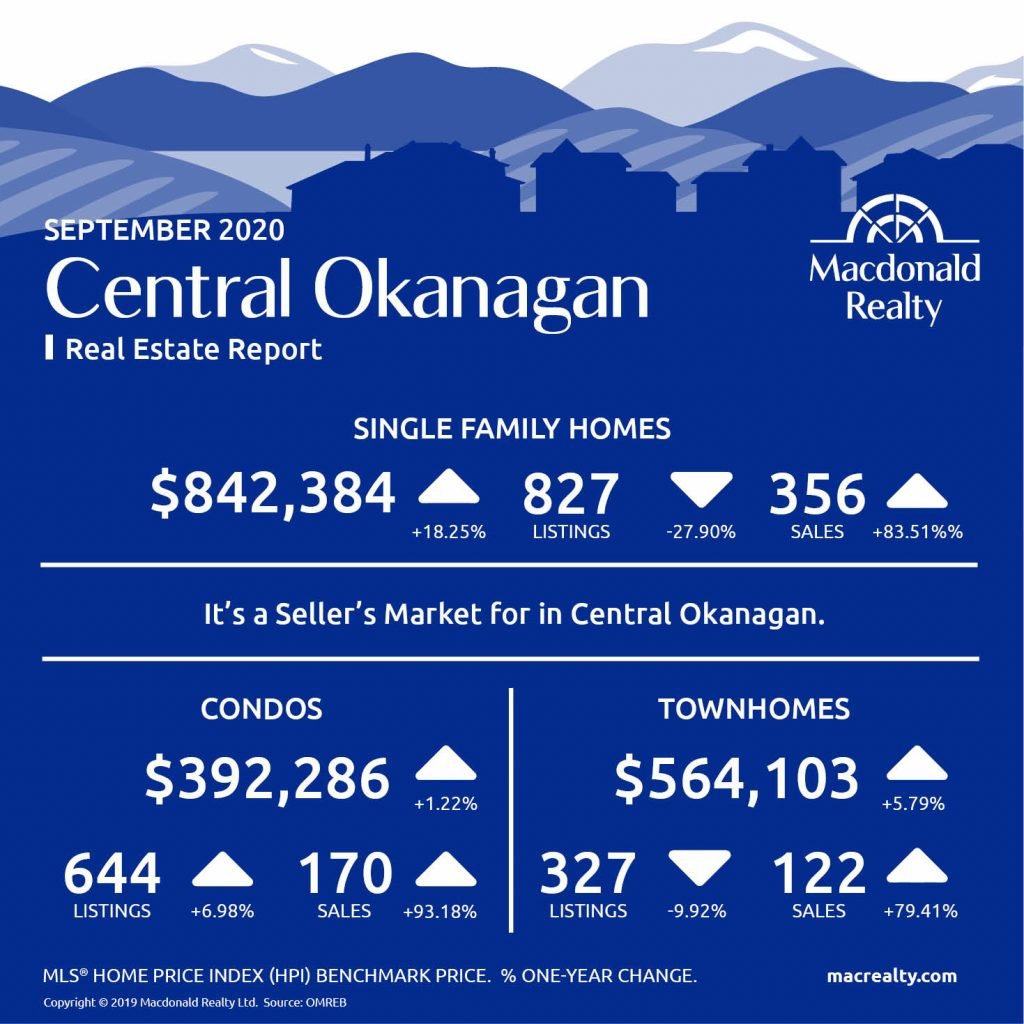
Central Okanagan: Kelowna and Lake Country
There were 356 sales, 827 active listings, and an $842,384 average sale price for detached homes in the Central Okanagan market, including Kelowna and Lake Country.
The condo market featured 170 sales and 644 active listings at the end of the month. The average sale price was $392,286.
Townhome sales were 122, active listings were 327 and the average sale price was $564,103.
It’s a seller’s market in Central Okanagan.
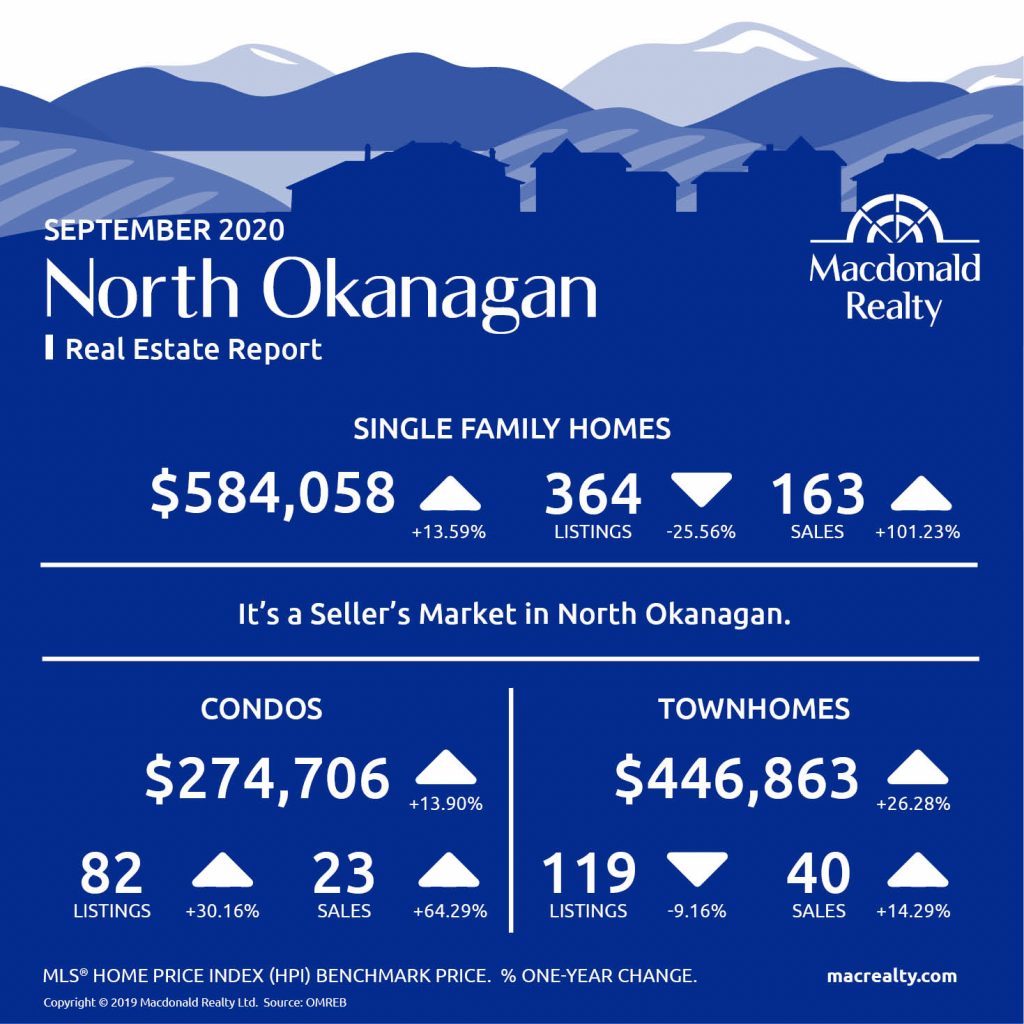
North Okanagan: Vernon and surrounding area
In North Okanagan, including Vernon and the surrounding area and the average sale price was $584,058. At the end of the month, there were 163 sales and 364 active listings.
There were 23 sales and 82 active listings for condos. The average sale price was $274,706.
In comparison, townhomes featured 40 sales, 119 active listings and a $446,863 average sale price.
It’s a seller’s market in North Okanagan.
Looking for more information about the real estate market in specific neighbourhoods in Okanagan?
Macdonald Realty has offices in Kelowna and across BC. Please email [email protected] or call 1-877-278-3888 to be matched with a REALTOR® working in your area.
This blog post is based on market data provided by Okanagan Mainline Real Estate Board (OMREB) www.omreb.com.
by Macrealty Marketing Team | Sep 3, 2020 | Market Updates
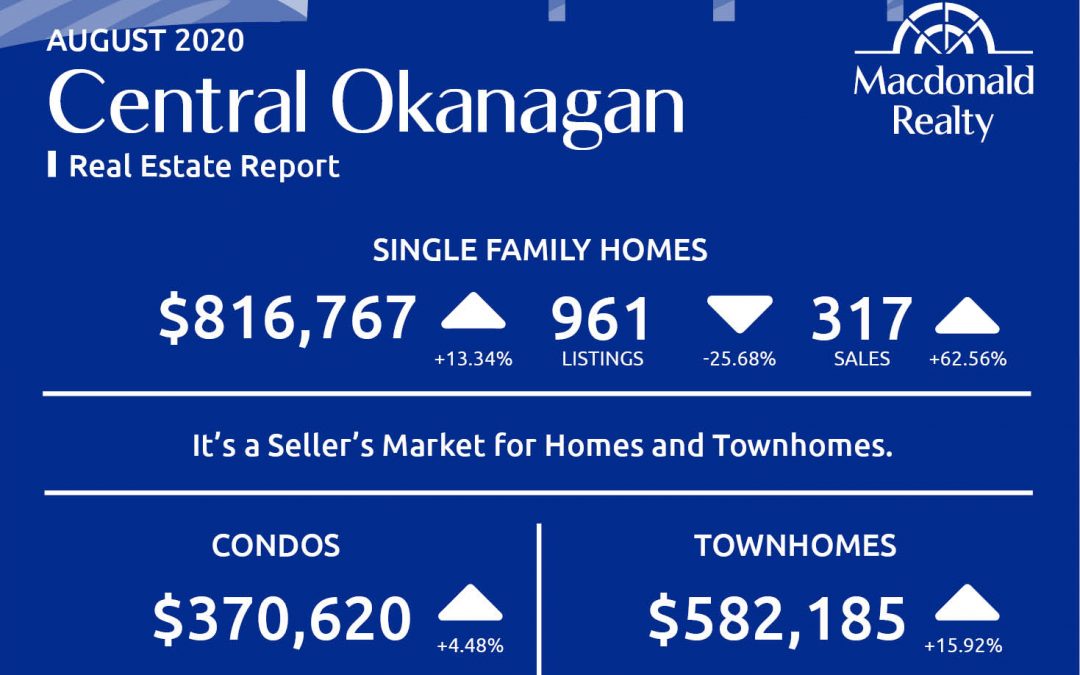
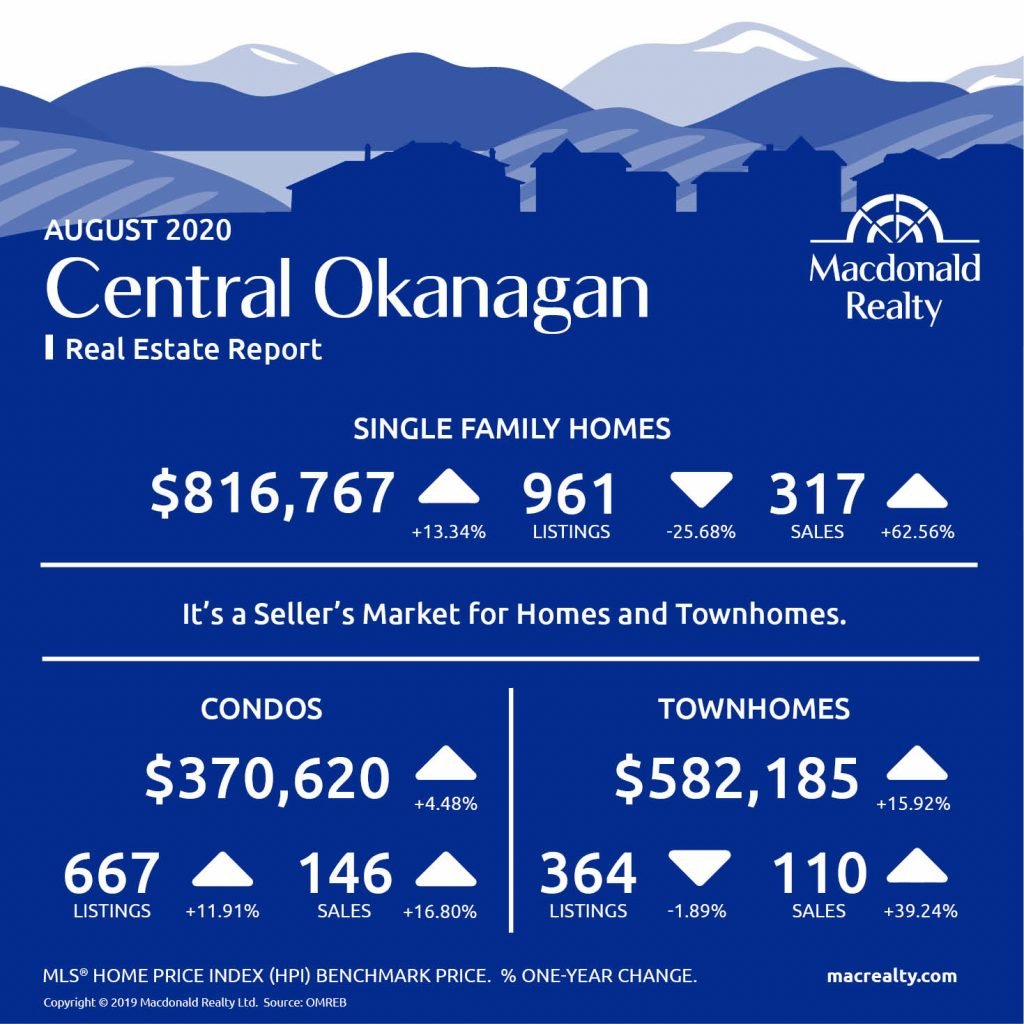
Here are the latest real estate market statistics from Macdonald Realty on Okanagan listings and sales in August 2020.
Find the infographics by visiting the Facebook Album.
Central Okanagan: Kelowna and Lake Country
There were 317 sales, 961 active listings, and an $816,767 average sale price for detached homes in the Central Okanagan market, including Kelowna and Lake Country.
The condo market featured 146 sales and 667 active listings at the end of the month. The average sale price was $370,620.
Townhome sales were 110, active listings were 364 and the average sale price was $582,185.
It’s a seller’s market for homes and townhomes in Central Okanagan.
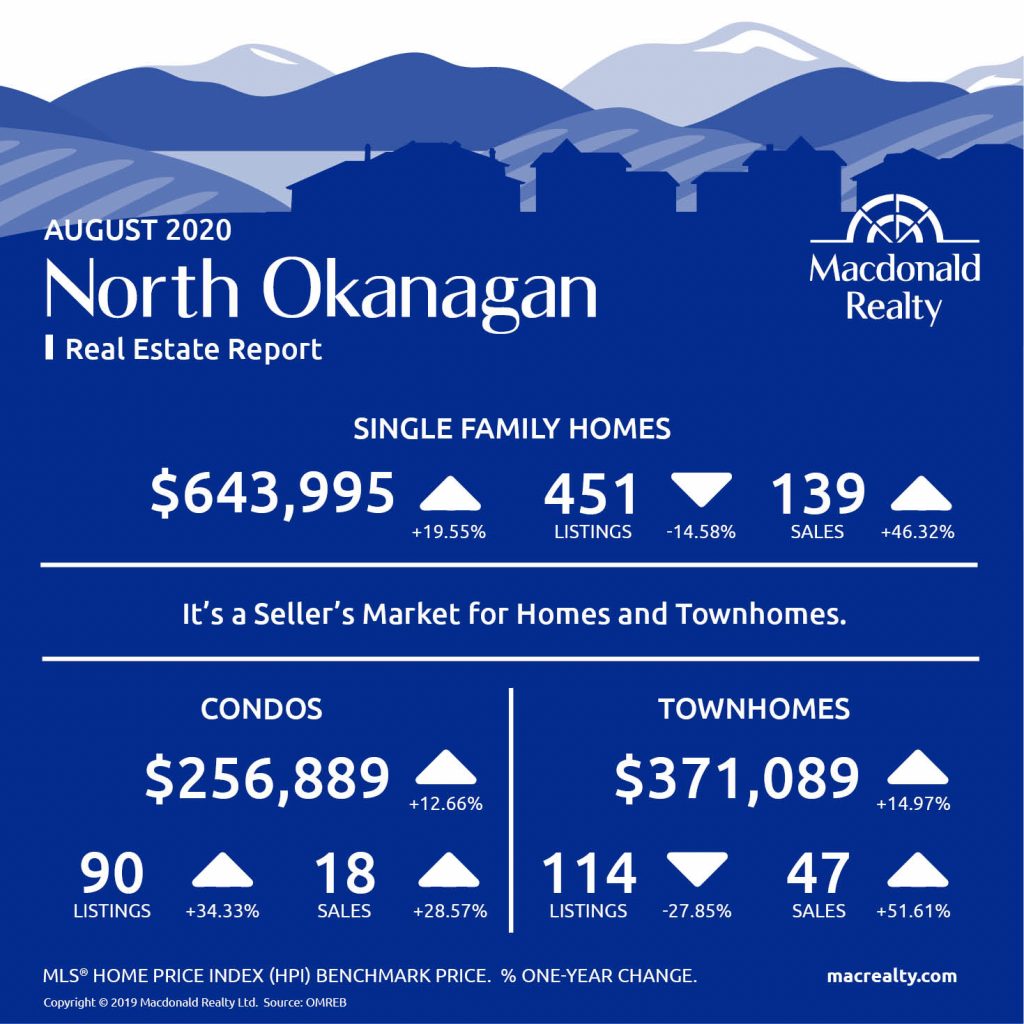
North Okanagan: Vernon and surrounding area
In North Okanagan, including Vernon and the surrounding area and the average sale price was $643,995. At the end of the month, there were 139 sales and 451 active listings.
There were 18 sales and 90 active listings for condos. The average sale price was $256,889.
In comparison, townhomes featured 47 sales, 114 active listings and a $371,089 average sale price.
It’s a seller’s market for homes and townhomes in North Okanagan.
Looking for more information about the real estate market in specific neighbourhoods in Okanagan?
Macdonald Realty has offices in Kelowna and across BC. Please email [email protected] or call 1-877-278-3888 to be matched with a REALTOR® working in your area.
This blog post is based on market data provided by Okanagan Mainline Real Estate Board (OMREB) www.omreb.com.

