Okanagan Real Estate Market Statistics – September 2019
Here are the latest real estate market statistics from Macdonald Realty on Okanagan listings and sales in September 2019.
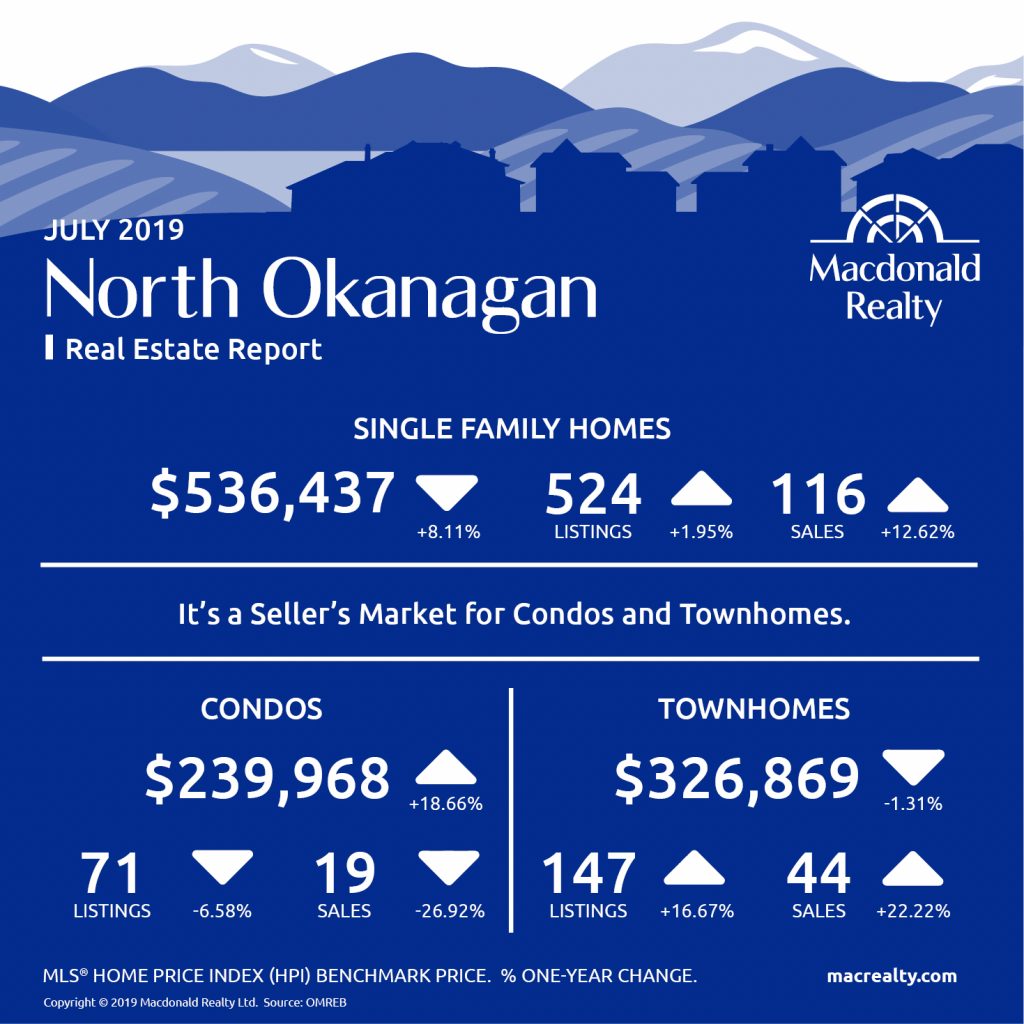
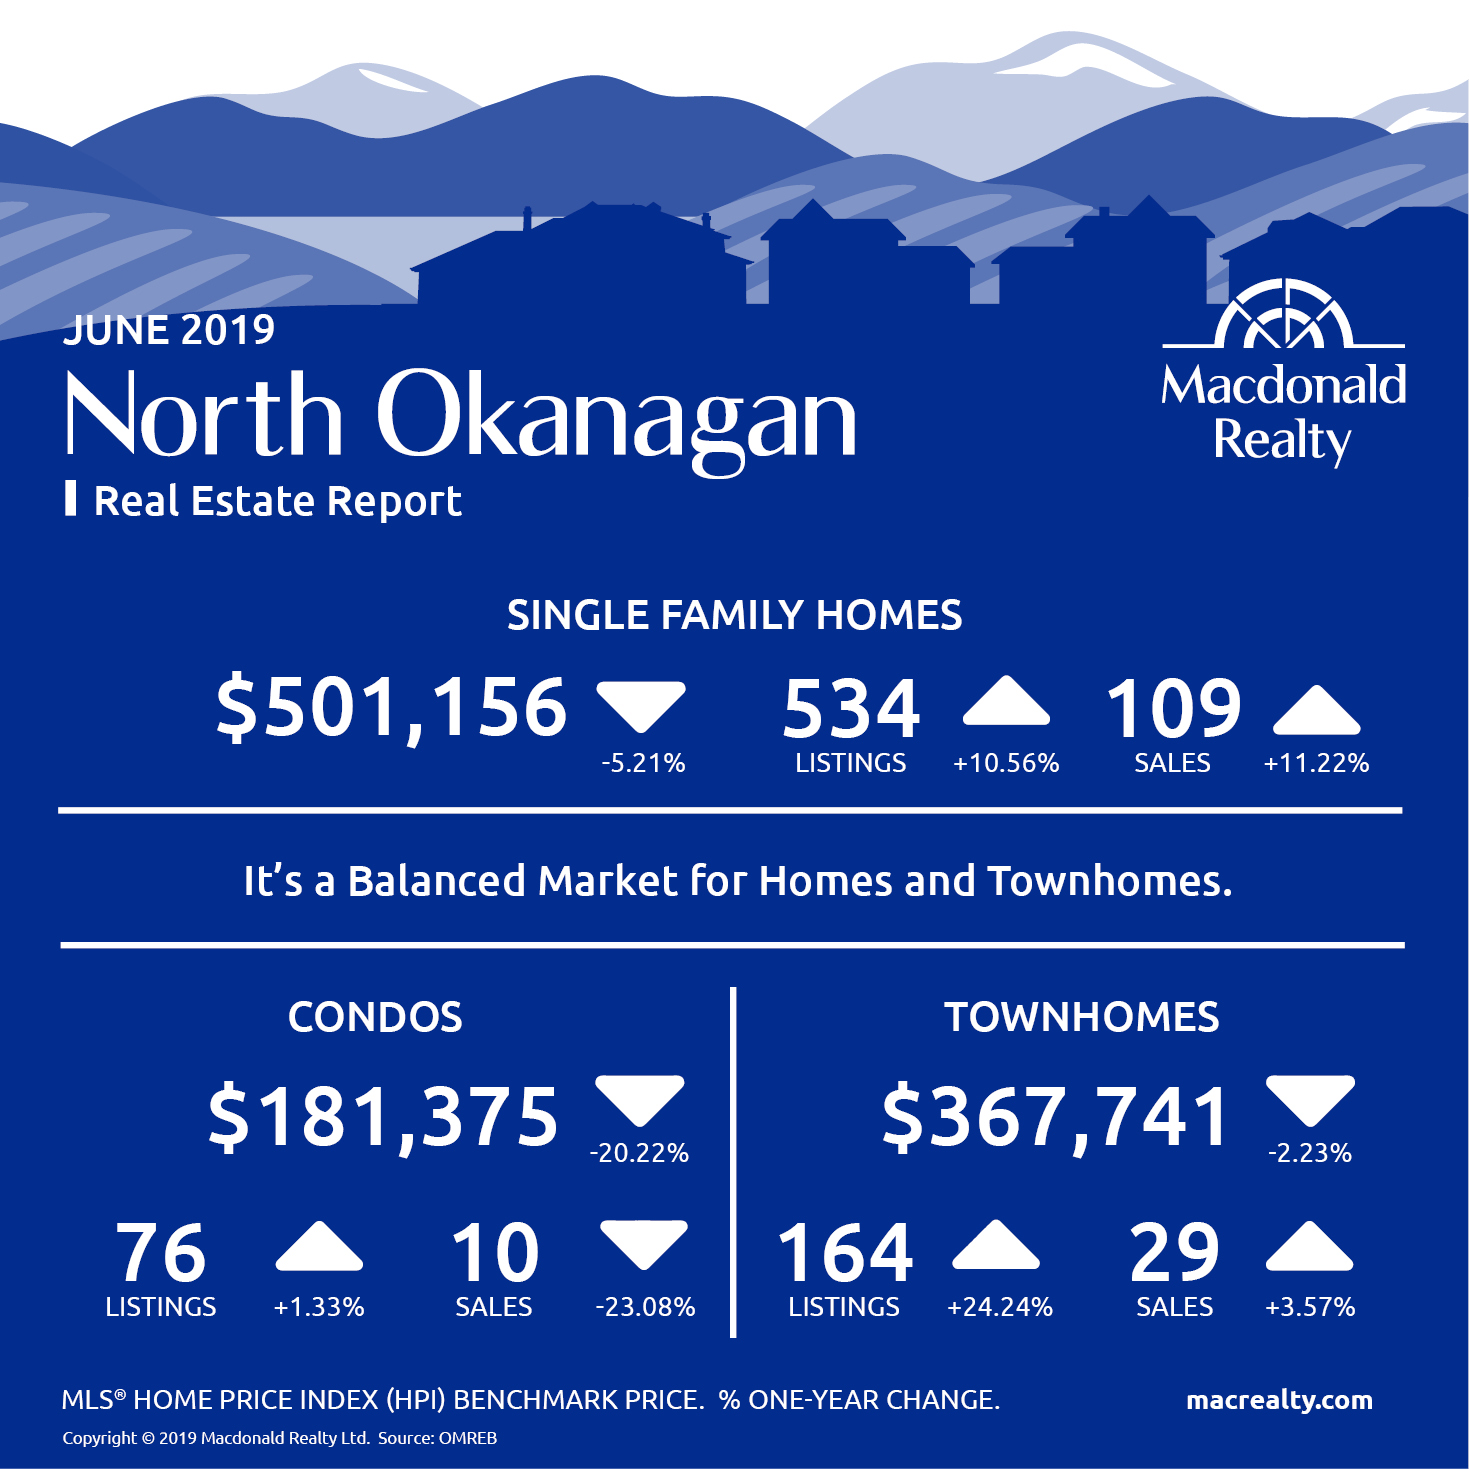
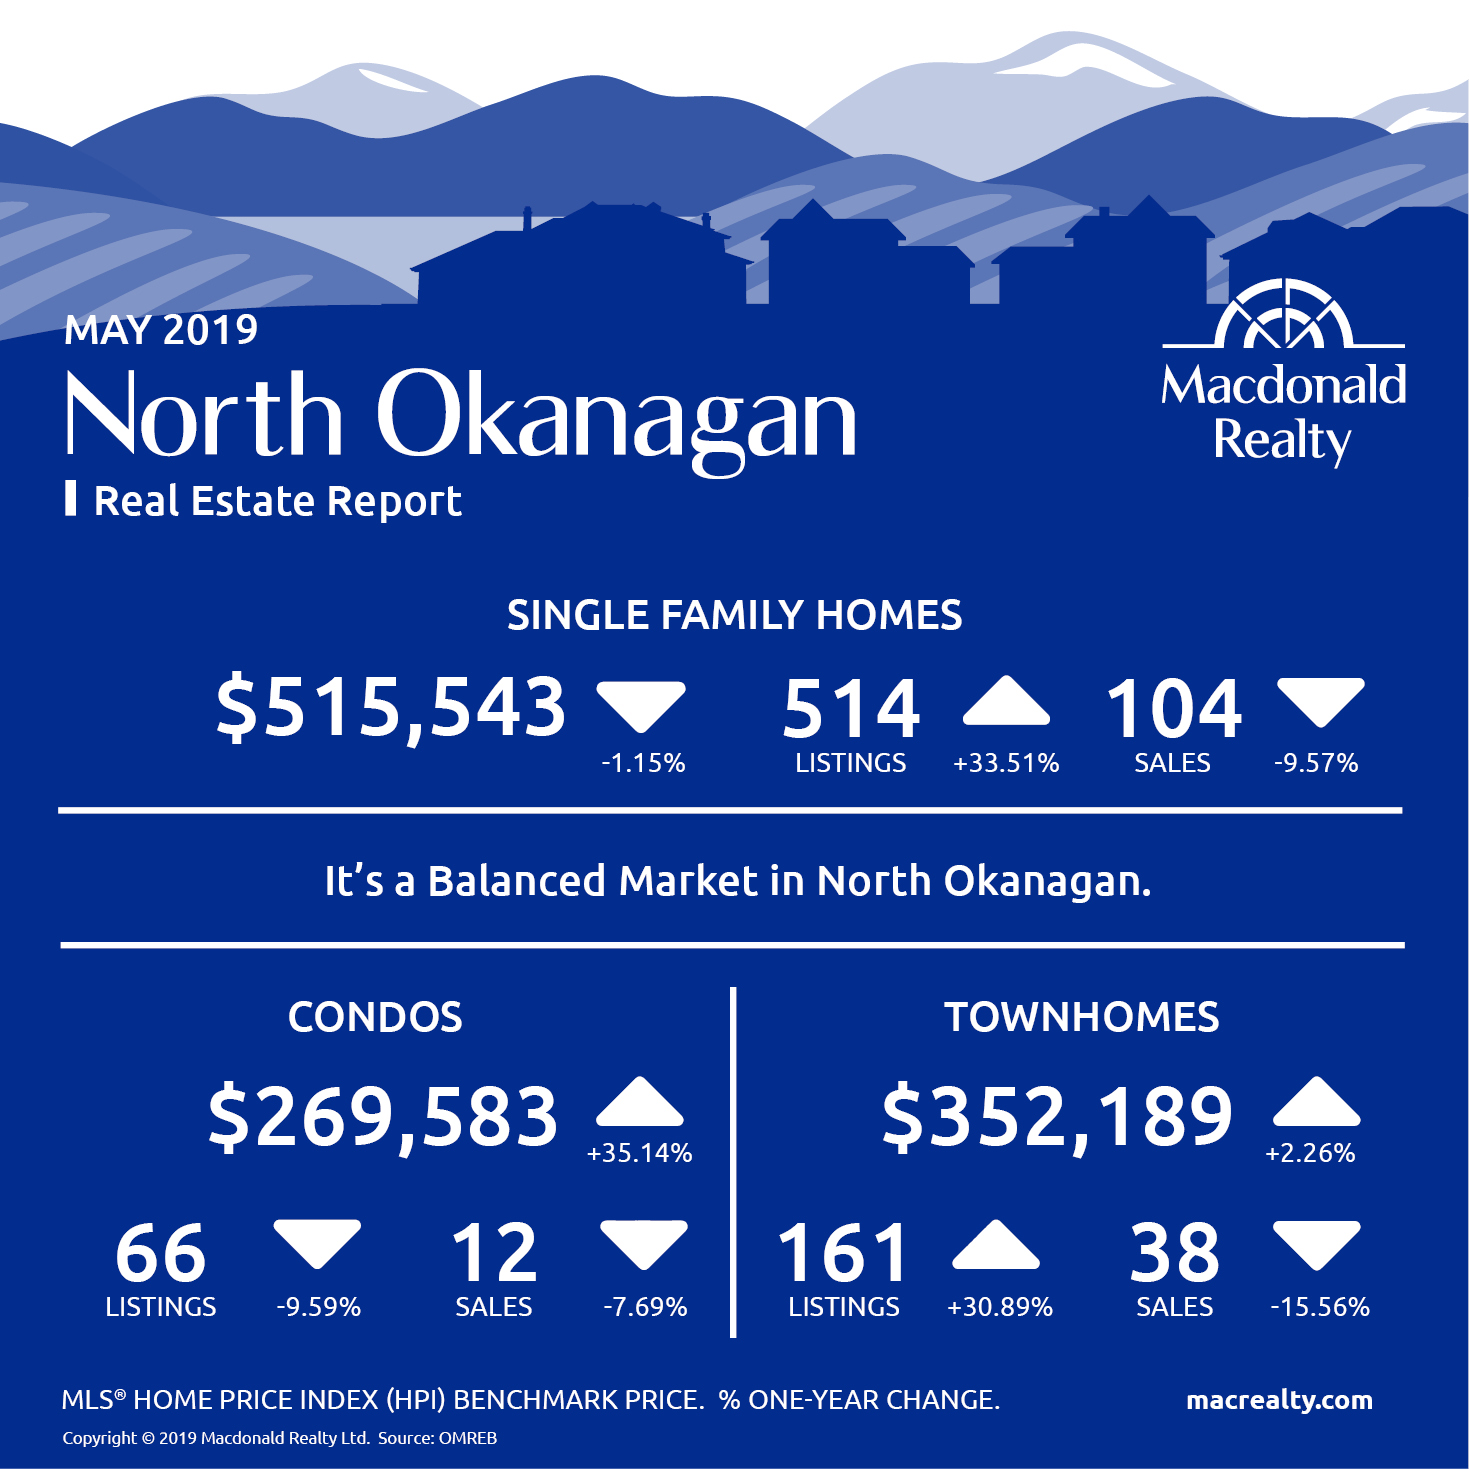
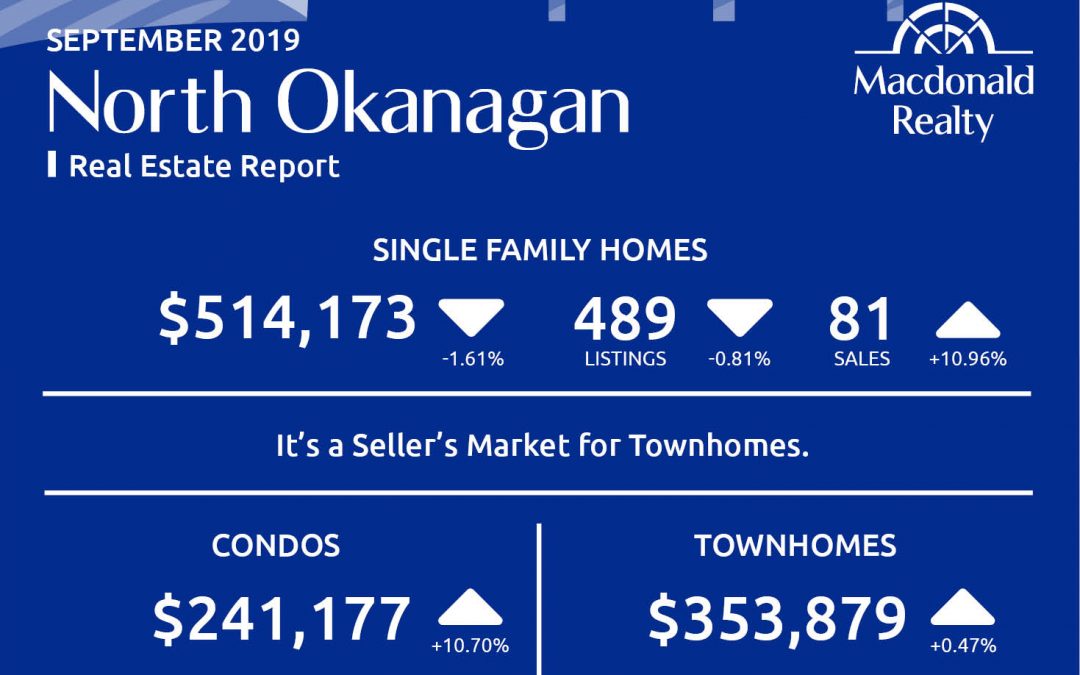
North Okanagan: Vernon and surrounding area
In North Okanagan, including Vernon and the surrounding area and the average sale price was $514,173. At the end of the month, there were 81 sales and 489 active listings.
There were 14 sales and 63 active listings for condos. The average sale price was $241,177.
In comparison, townhomes featured 35 sales, 131 active listings and a $353,879 average sale price.
It’s a seller’s market for townhomes in North Okanagan.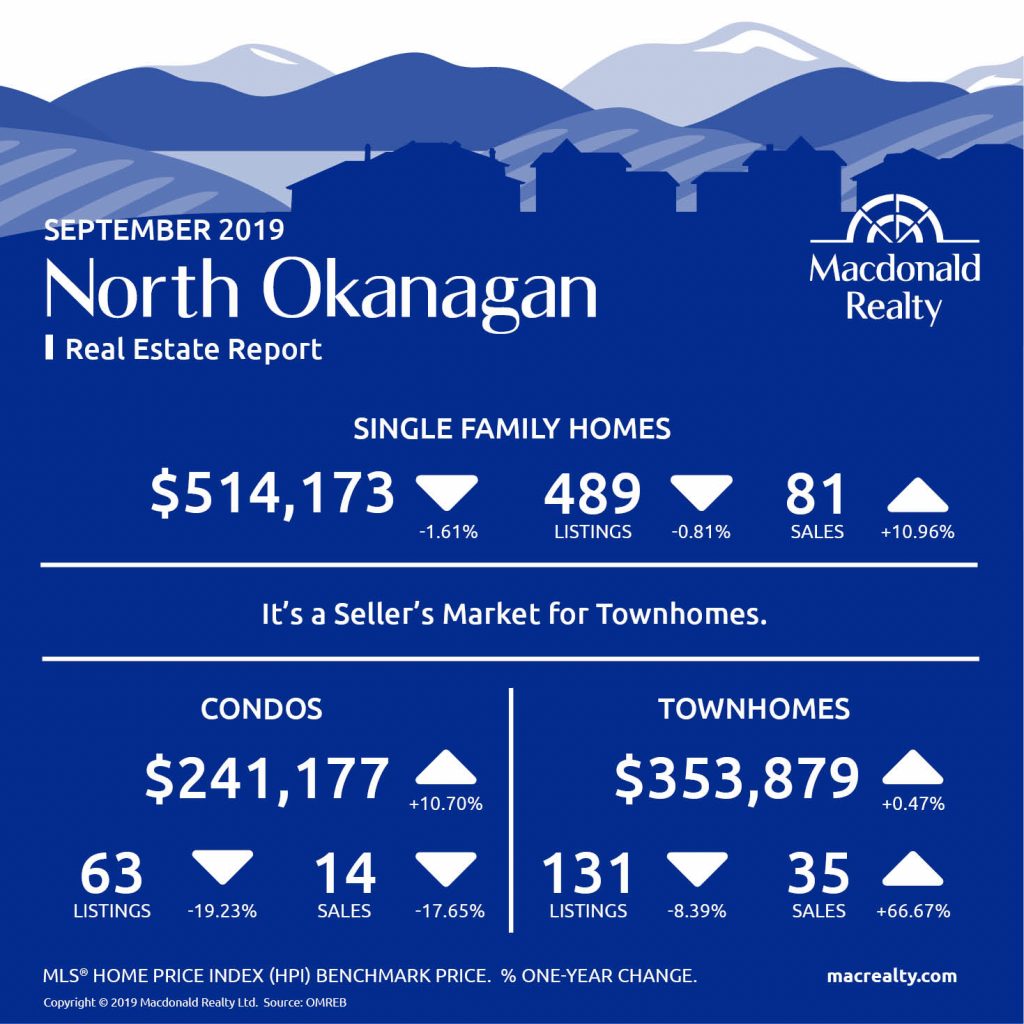
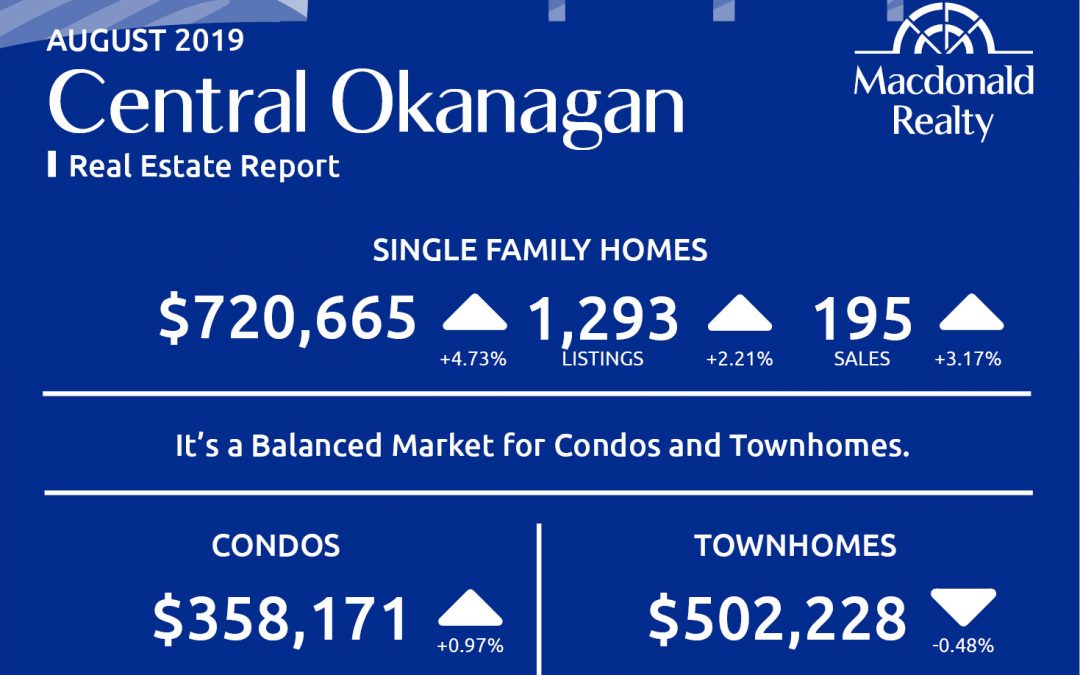
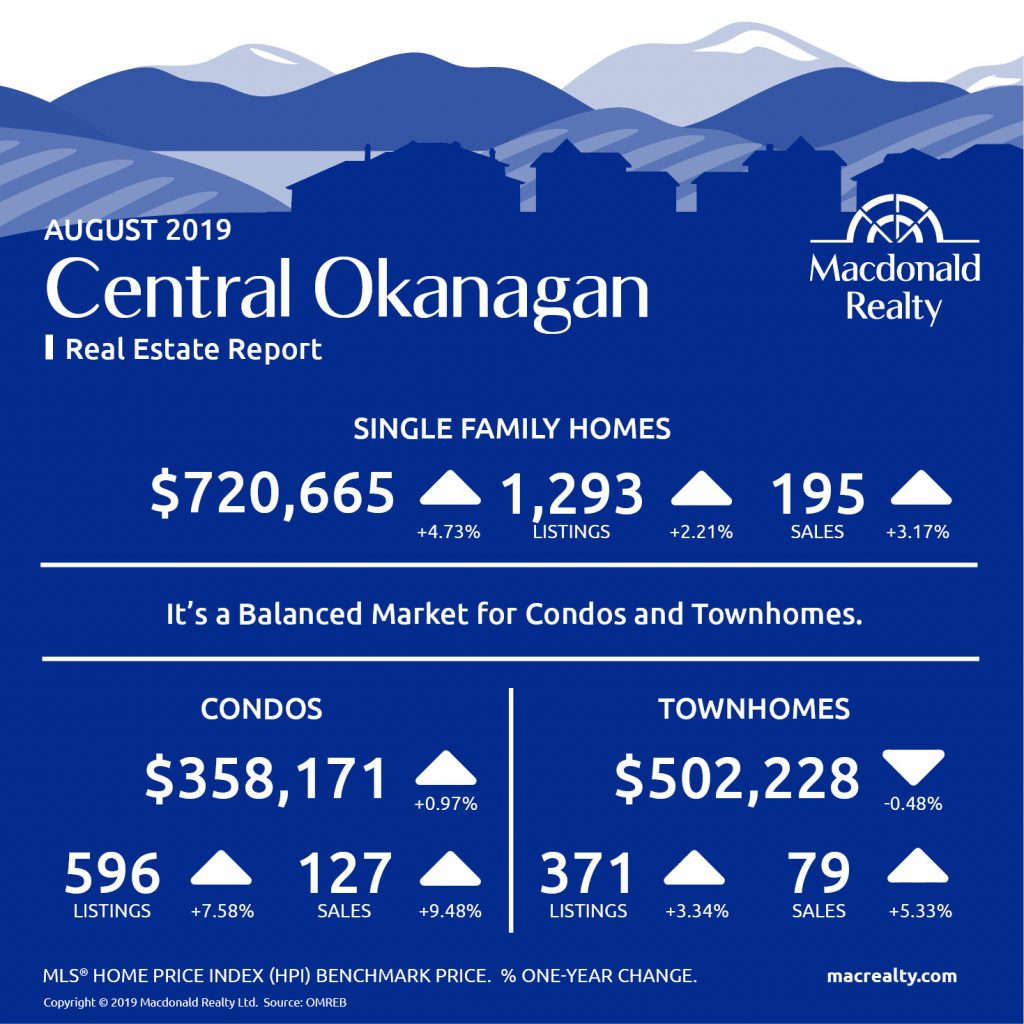
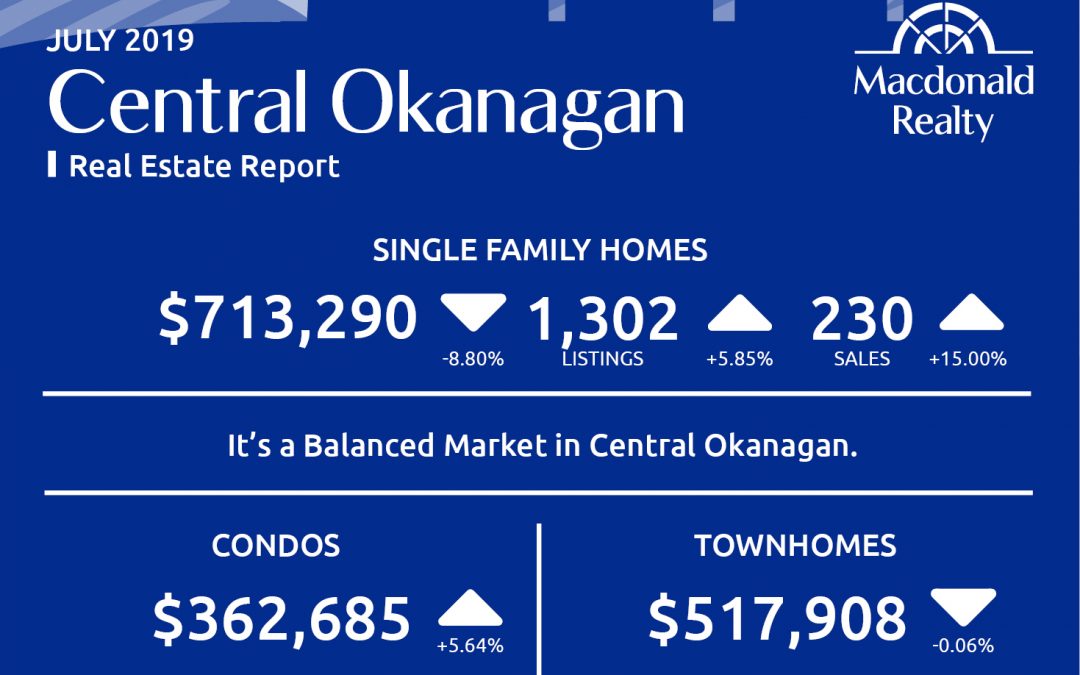
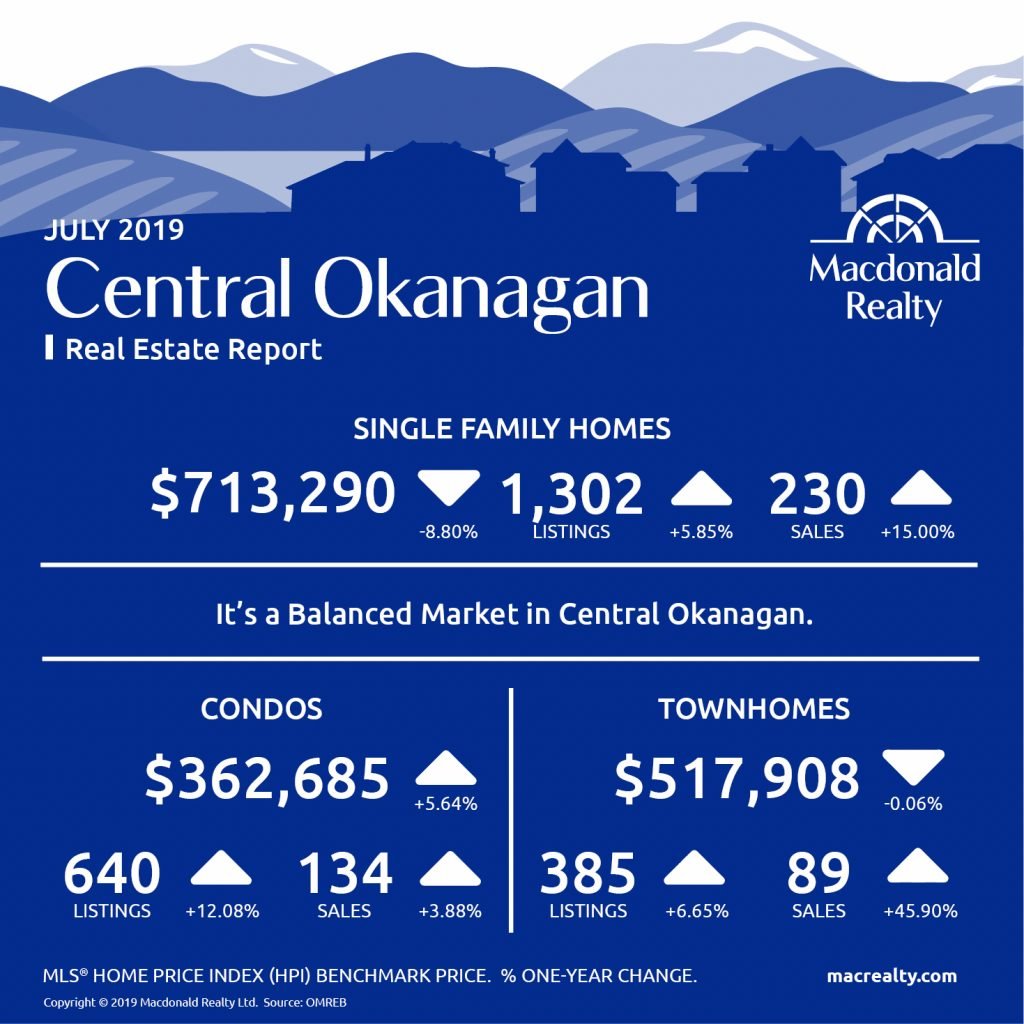
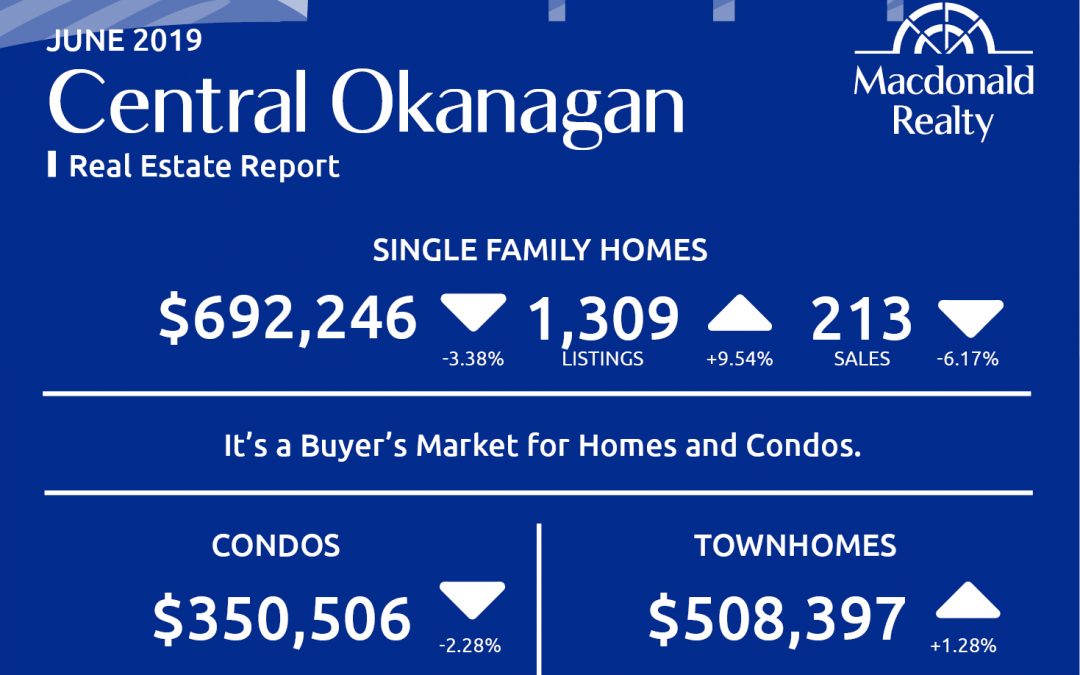
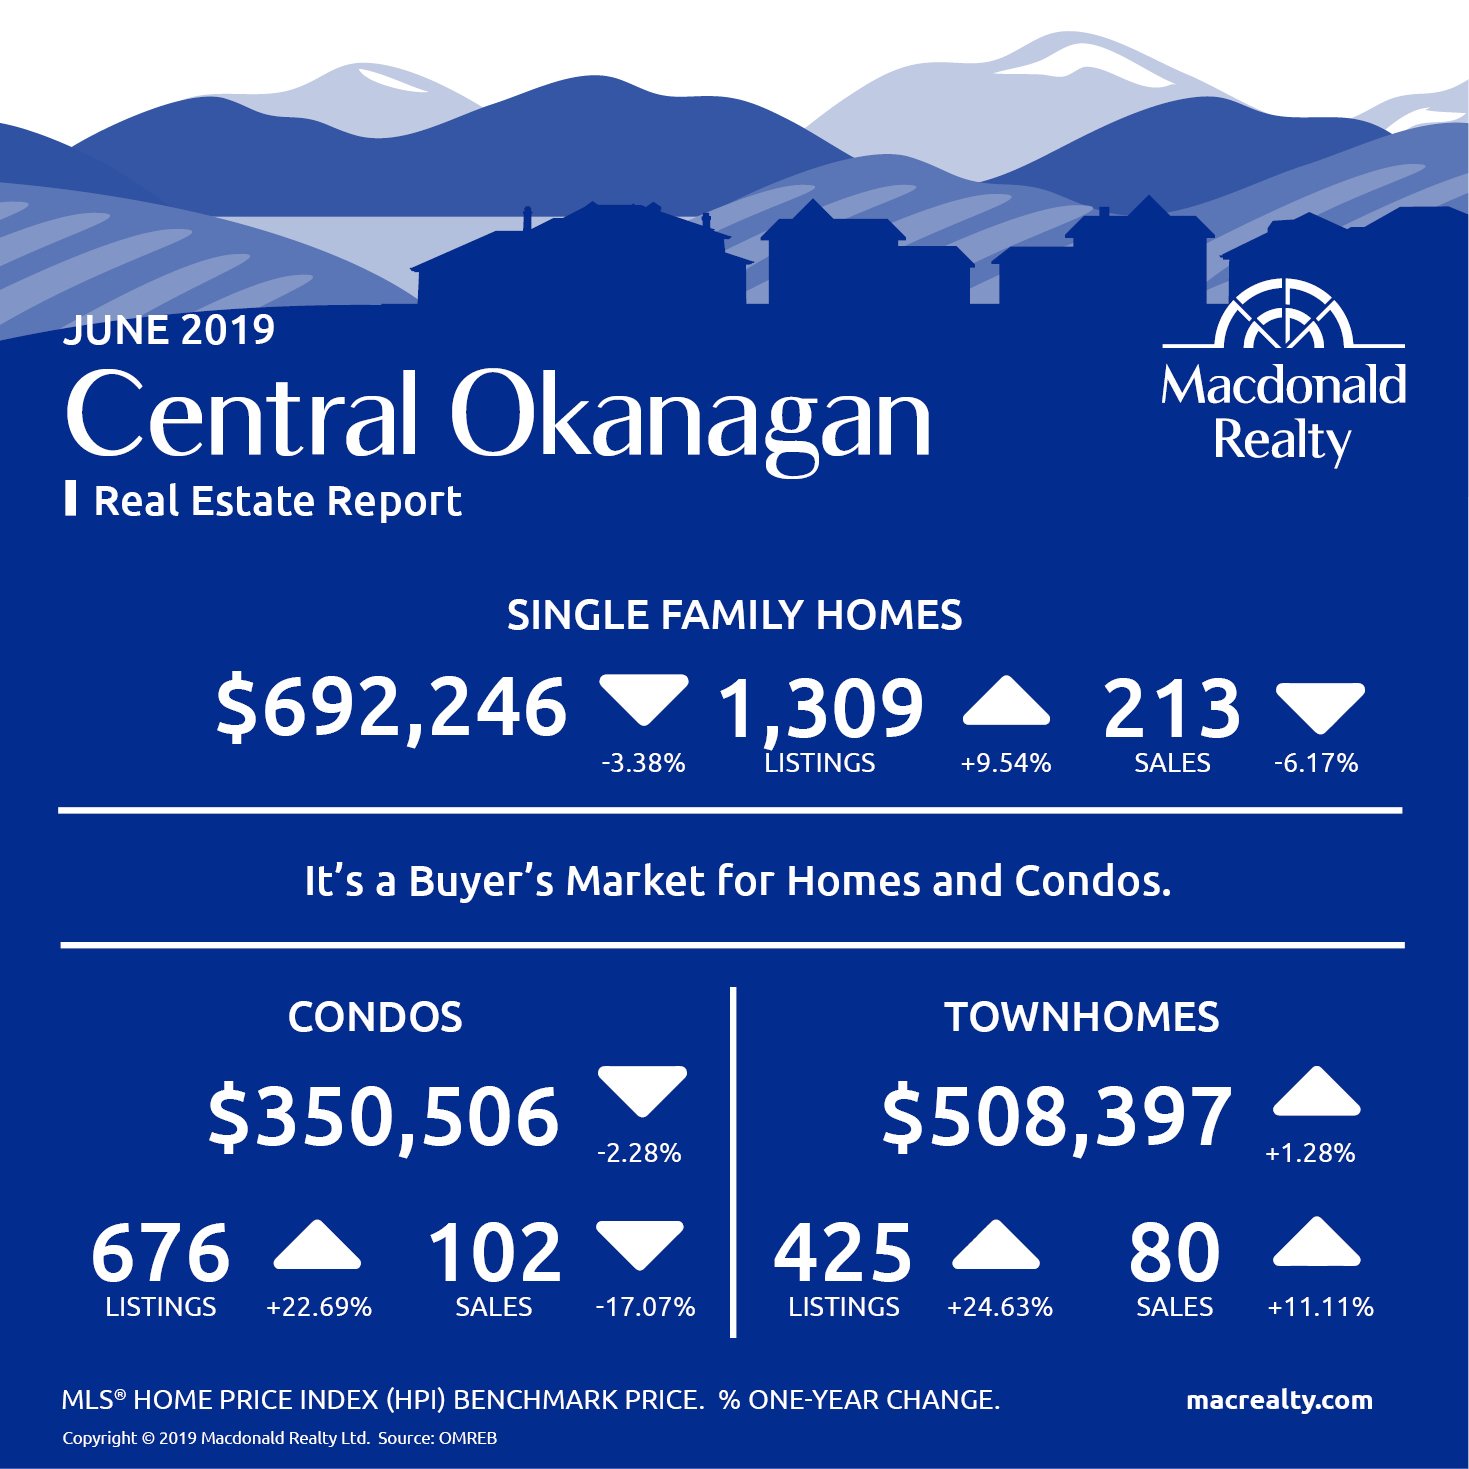
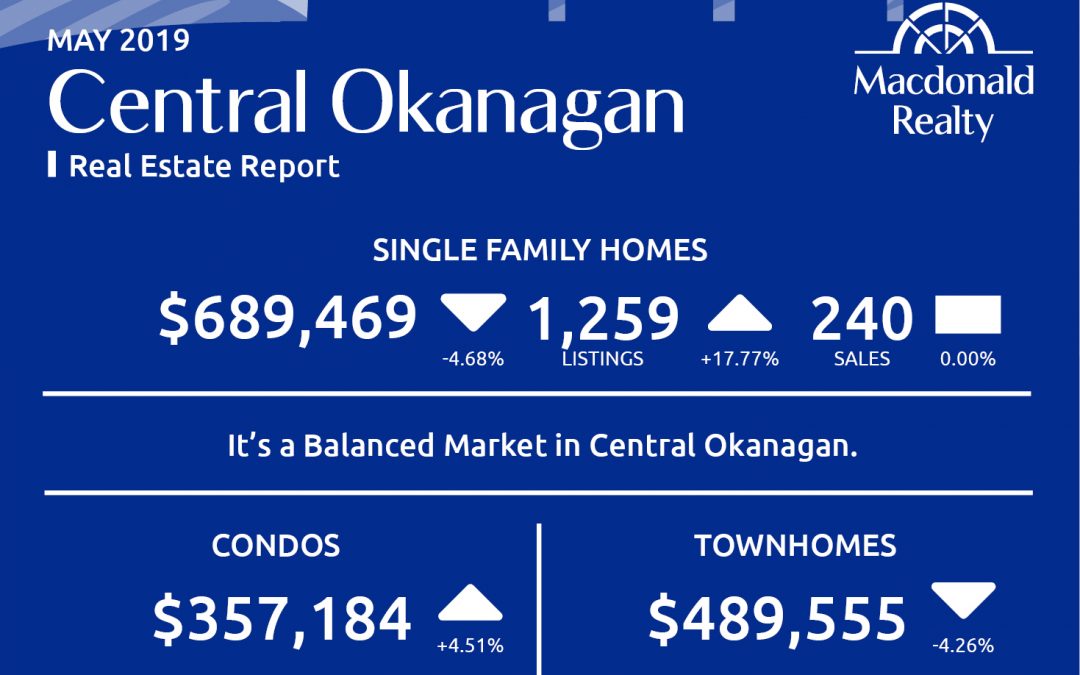
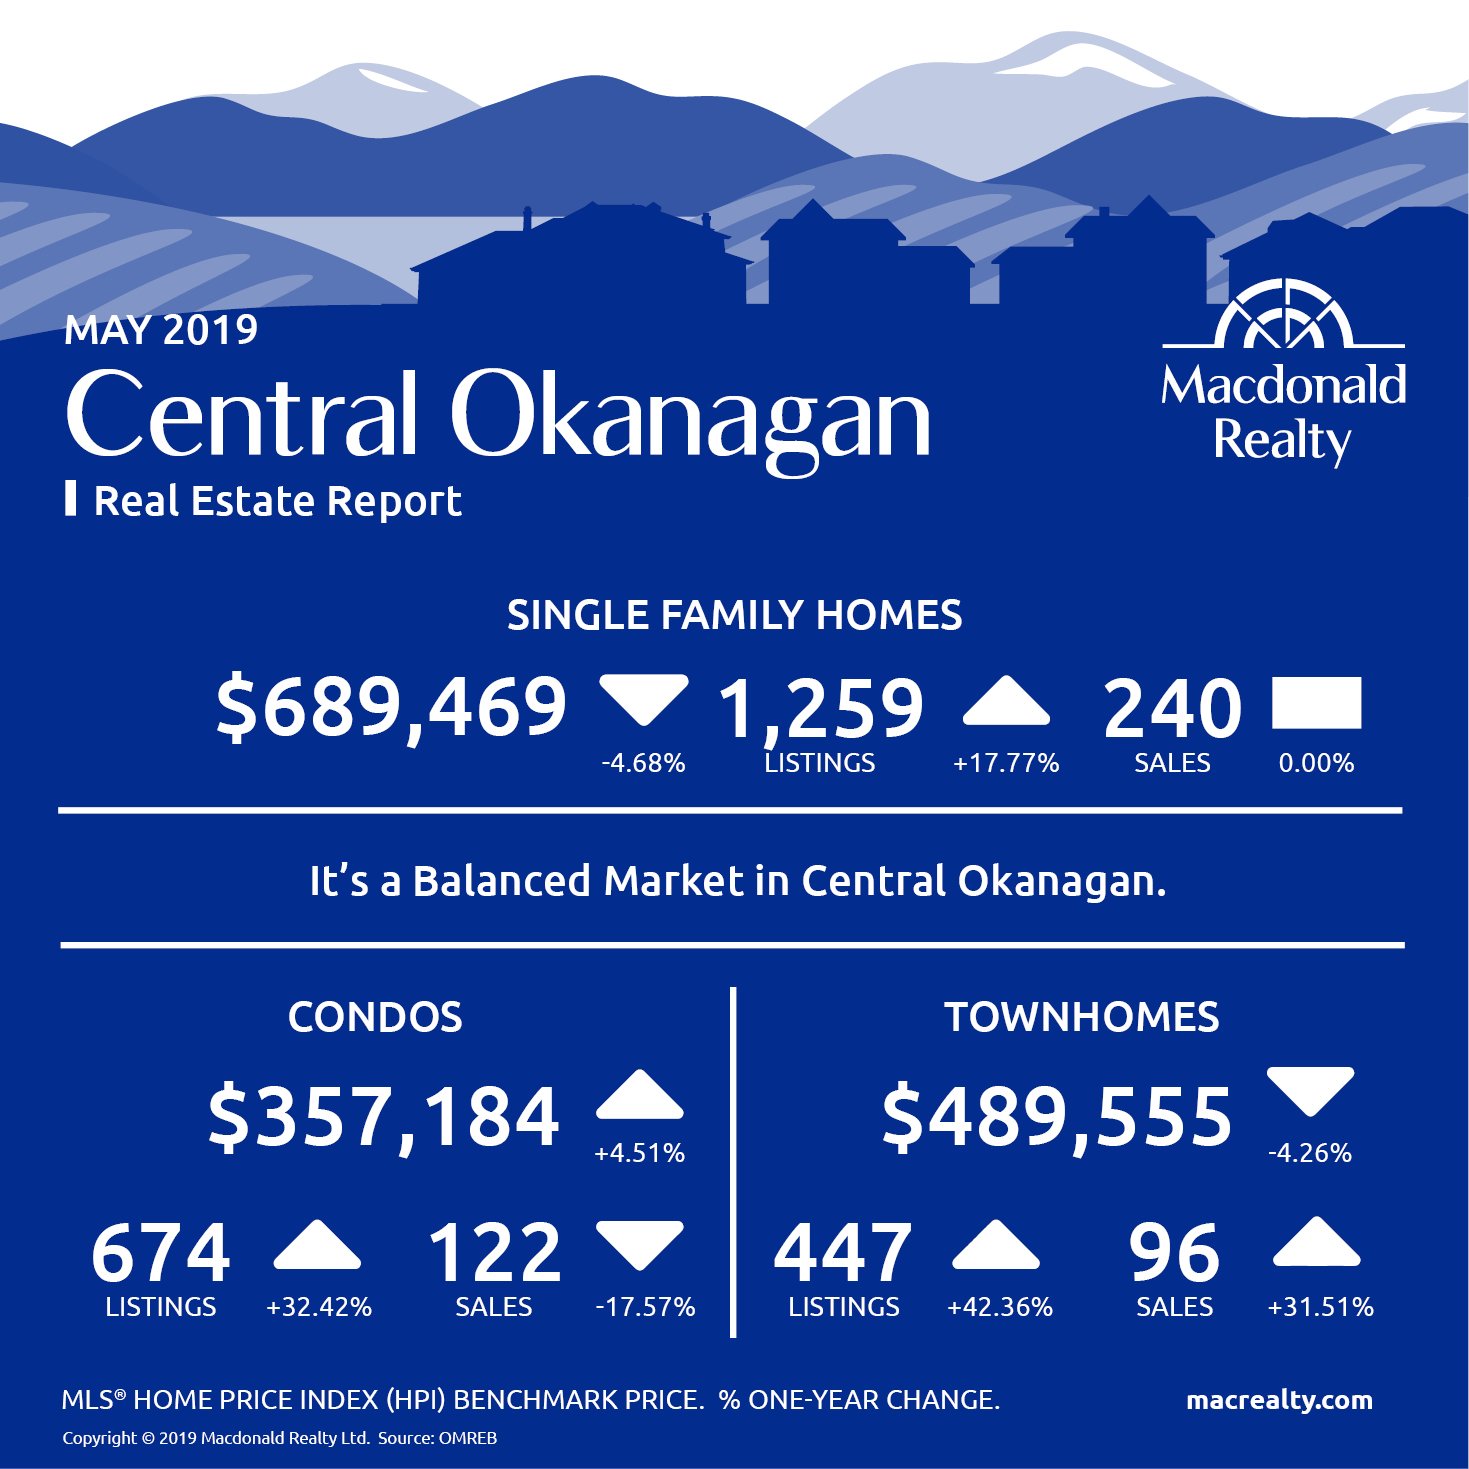
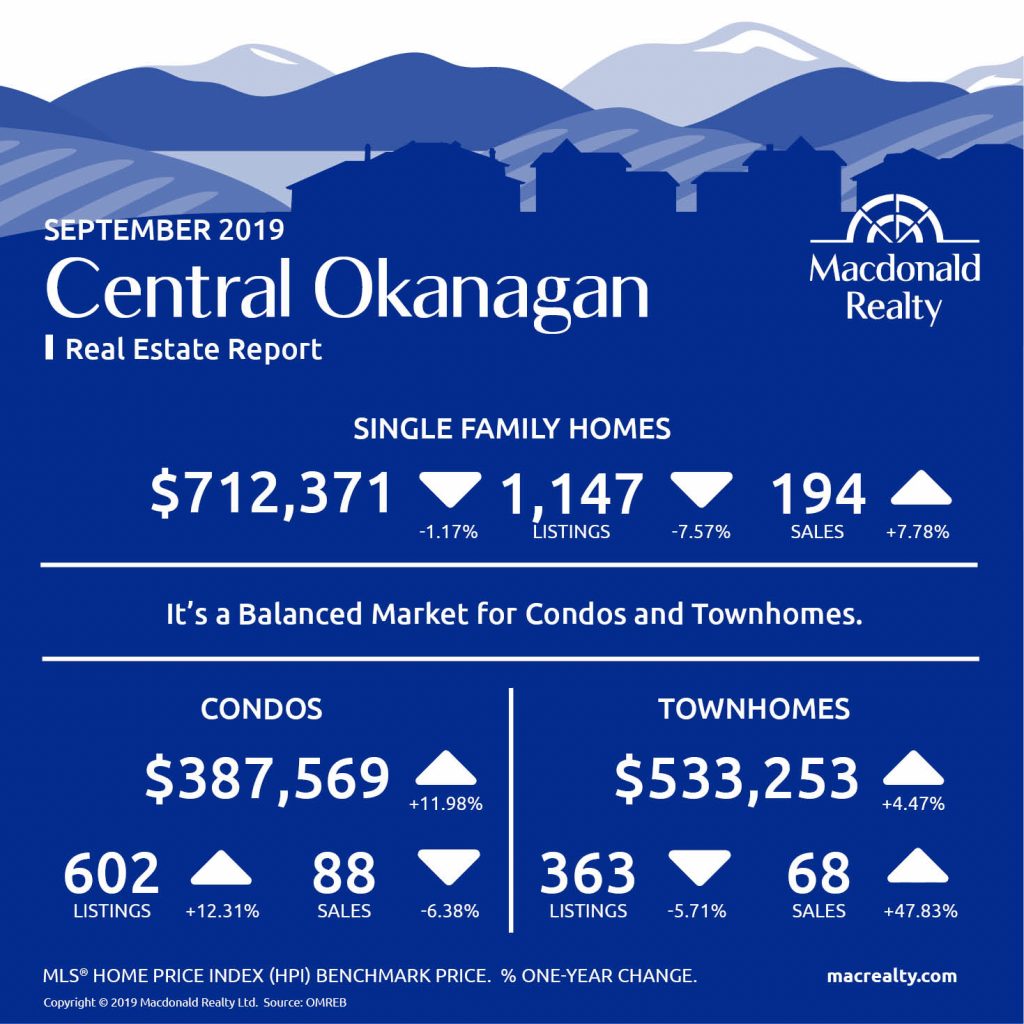
Central Okanagan: Kelowna and Lake Country
There were 194 sales, 1,147 active listings, and a $712,371 average sale price for detached homes in the Central Okanagan market, including Kelowna and Lake Country.
The condo market featured 88 sales and 602 active listings at the end of the month. The average sale price was $387,569.
Townhome sales were 68, active listings were 363 and the average sale price was $533,253.
It’s a balanced market for condos and townhomes in Central Okanagan.
Looking for more information about the real estate market in specific neighbourhoods in Okanagan?
Macdonald Realty has offices in Kelowna and across BC. Please email [email protected] or call 1-877-278-3888 to be matched with a REALTOR® working in your area.
This blog post is based on market data provided by Okanagan Mainline Real Estate Board (OMREB) www.omreb.com.