by Macrealty Marketing Team | Dec 18, 2023 | Company
10 Questions With Arthur Ng
Managing Broker, Burnaby
Arthur Ng, Managing Broker of Macdonald Realty’s Burnaby office, shares the story of how he got into real estate, his best advice for those looking to join the industry as an agent, and where you can find him in his free time – all in this 10 Questions interview.
How did you get into the real estate industry? I was attending BCIT in the administration program and enrolled in the real estate option. In one of my business classes, an instructor suggested I meet with his past co-worker in the HR field who operated a brokerage in West Vancouver. My eyes opened when I saw the real estate office operations.
On my initial visit to the brokerage, I was in awe with the activity that was buzzing in the office. Agents were at their desks on calls and making appointments. Listings and sales were being posted on the boards. Voice pagers and announcements over the PA system were frantic because all calls went to the office. It was like the stock exchange! The environment alone made me want to start right away in the business. This was the typical Monday morning meeting in the bullpen. My meeting with the MB only confirmed my decision to be in the real estate industry.
What led to you to become a managing broker? While doing some summer work for the brokerage, I saw how the business operated and the support offered to the salespeople. I was told that if I wanted to manage an office, I had to sell real estate first to understand what salespeople go through and the challenges they face. After 6 years in sales, an opportunity to manage an office appeared. I never looked back. My mentor and Managing Broker was one of the people who helped to develop the clauses used for today’s residential real estate contracts!
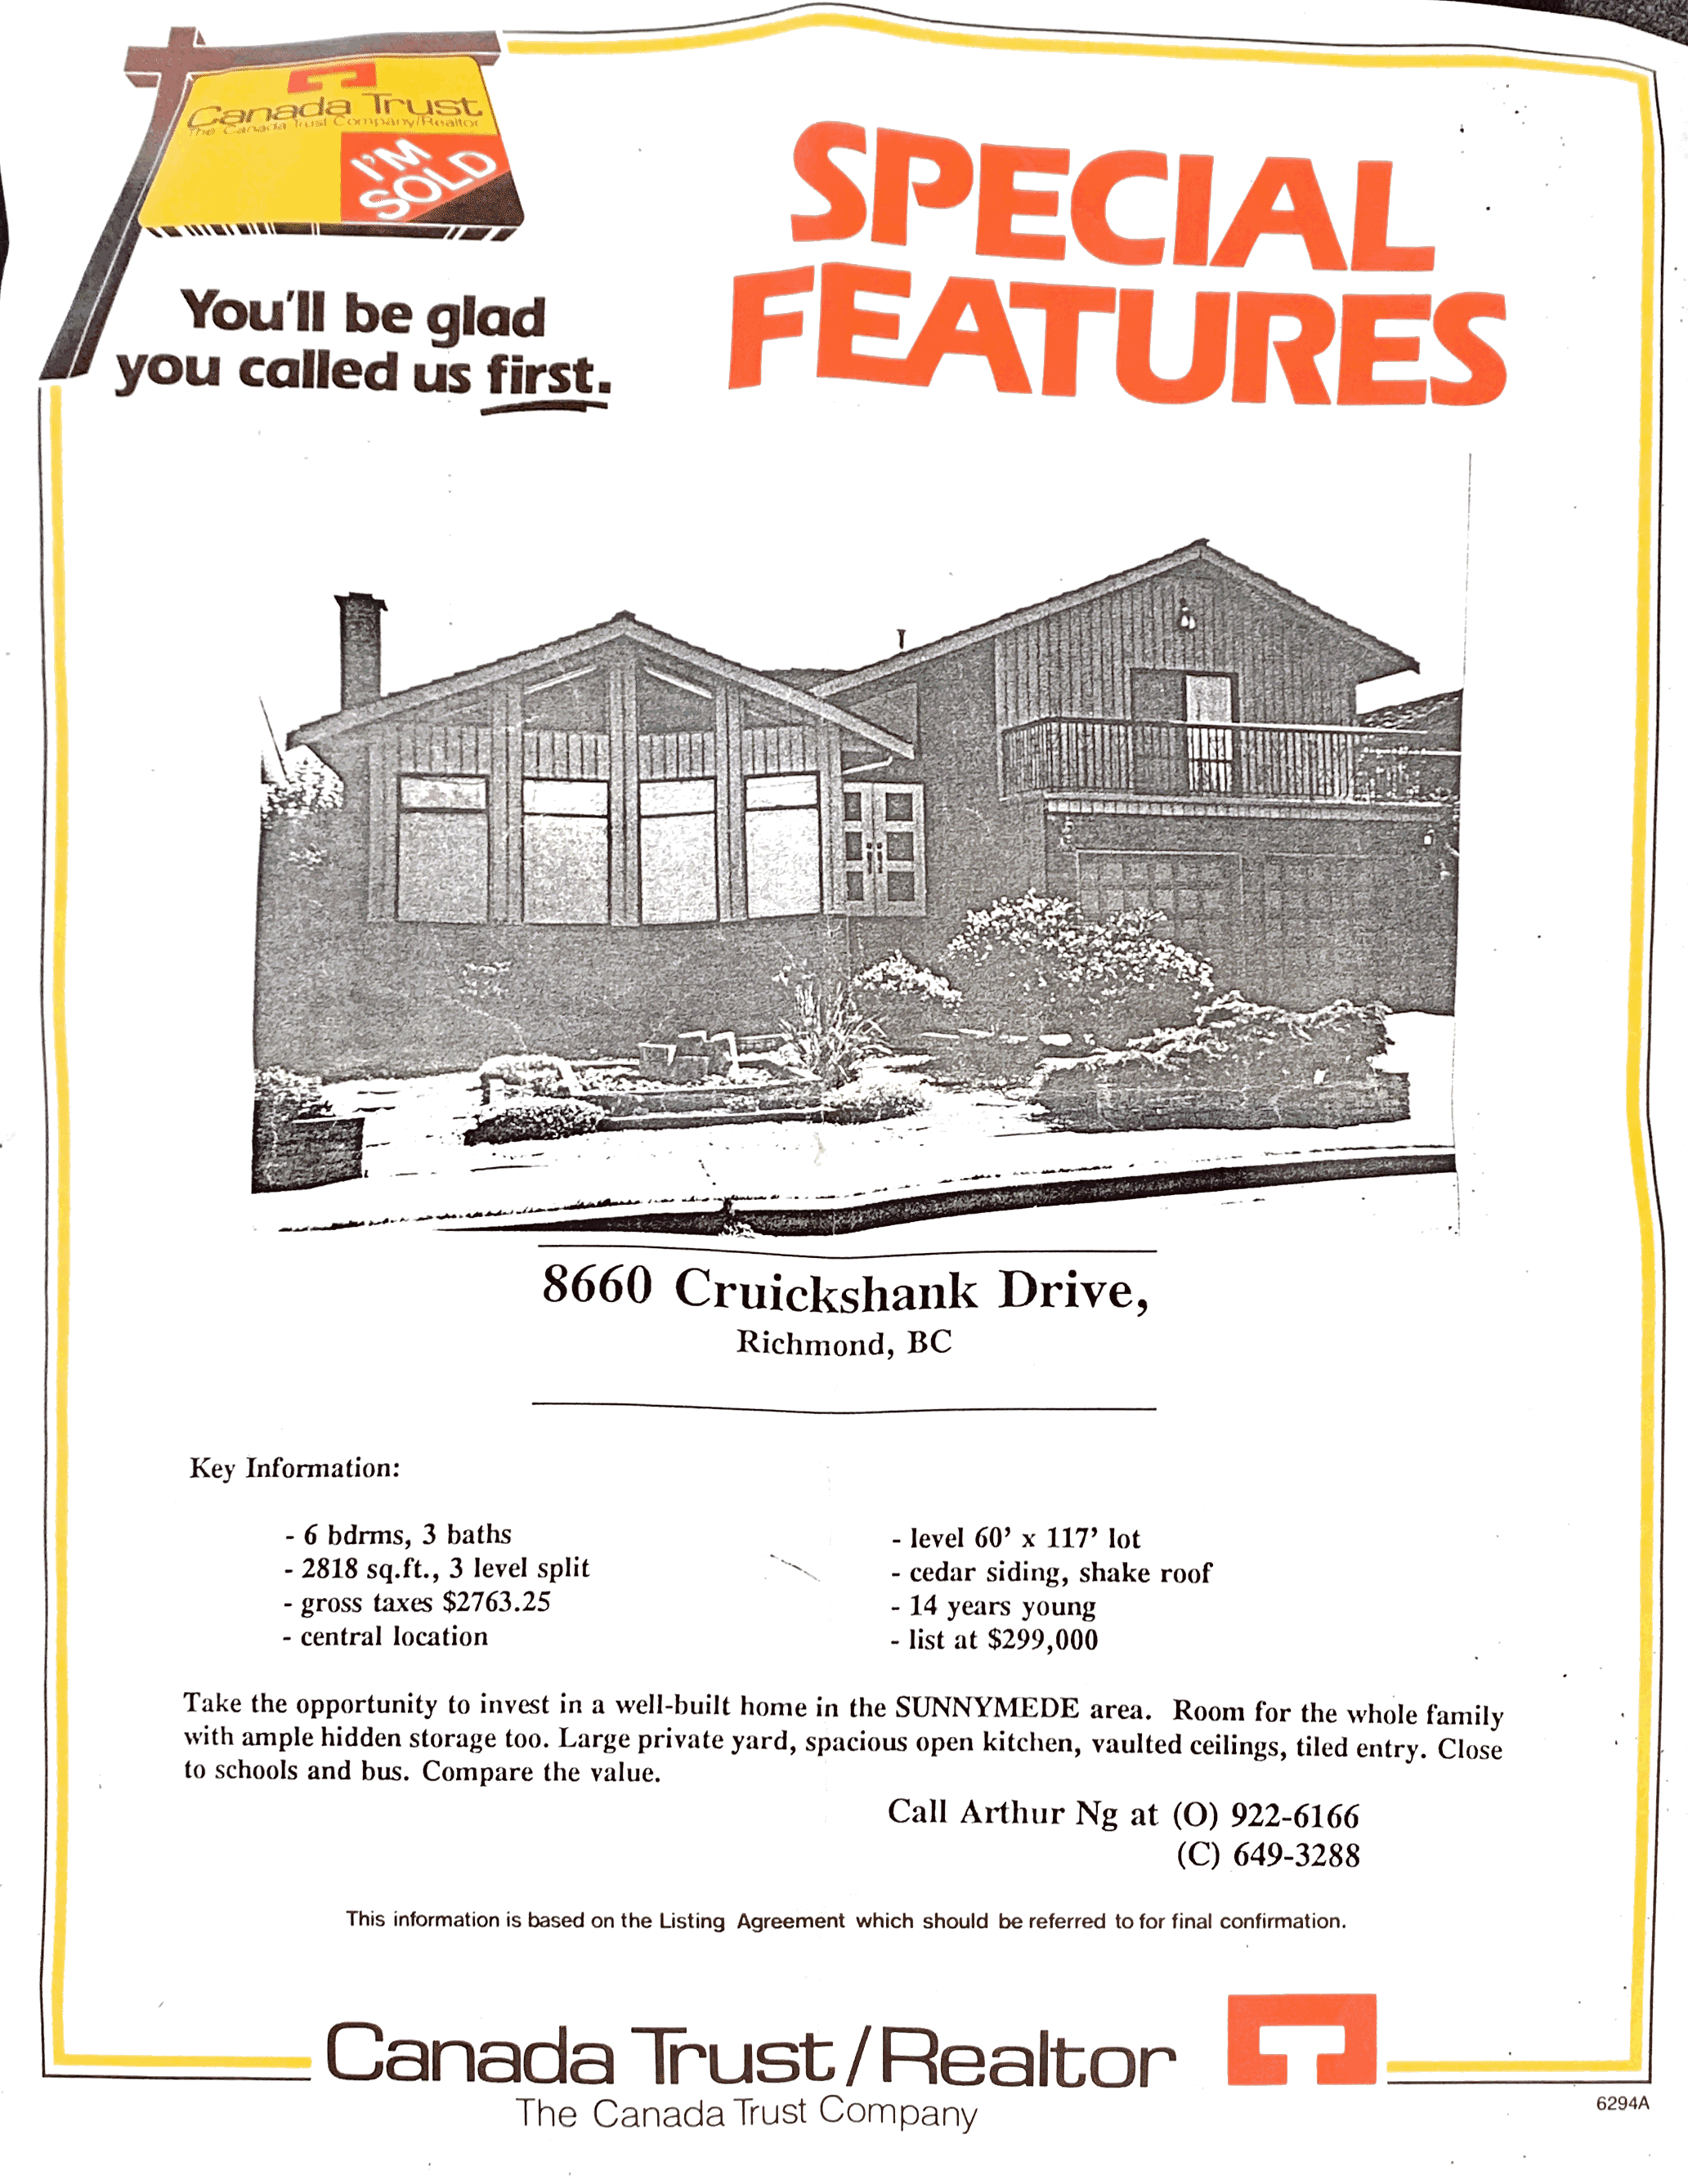
What is one thing you wish you knew when you first got into real estate? Don’t expect the phone to ring off the hook, nor should you expect a line-up of buyers and sellers waiting for your services once you get your real estate license. Leads are not provided; you have to secure the business on your own! The success of a top agent does not happen overnight.
Above: Arthur’s very first listing, circa 1992.
What is your advice to someone who wants to become an agent? Understand the real work involved before you decide to get into the industry. It’s relatively easy to get your real estate license (after spending $5k for the course and fees), it’s quite another to make a living and succeed. Is this the career you really want or just wanting to try it out? You need to be self-motivated and very, very disciplined. If you are financially strapped, commission sales may not be the right fit.
What is the best piece of advice you’ve received (related to real estate industry)? Don’t spend your commission before the sale completes unless you have other firm sales in your pipeline and don’t forget to leave money aside for CRA! Stay humble and don’t let success get to your head. The market goes in cycles as does the commission.
Why do you enjoy working in the real estate industry? I like to say I’m in it to make a difference in our industry. I do my part by helping agents to be successful and doing the right thing, teaching new licensees via BCFSA and the APC (Applied Practice Course) program to help ensure agents understand their role and obligations. Being on the Professional Conduct Committee for the REBGV also helps me stay updated on compliance topics.
What is your favorite thing about working at Macdonald Realty? I enjoy the support that is available to staff and salespeople alike. While you are working independently within your office, you are not alone.
Above: Arthur’s Culinary Creations: a simple Sunday breakfast; healthy oatmeal cookies (complete wtih wheat bran/germ, hemp hearts, and oats) that he makes occasionally for office meetings; ancient sourdough bread; and sourdough bagels that his wife makes from scratch.
What is a fun fact about yourself? I’m a food lover (and can cook) but not really a foodie. I could spend hours in the supermarket and more time in the kitchen preparing the meal! I do let my wife bake her sourdough bread from scratch regularly.
What is your favorite quote? “Do unto others as you would have them do unto you,” or “Treat others the way you want to be treated” – the Golden Rule.
What is a book that everyone should read? While I have no favorites (though cookbooks do come to mind), everyone should be reading something to keep their mind active and always learning. Most of my materials are technical in nature, dealing with rules and regulations, legislation, etc. (i.e., really dull stuff).
by Macrealty Marketing Team | Dec 5, 2023 | Market Updates
November 2023 – Lower Mainland Monthly Update
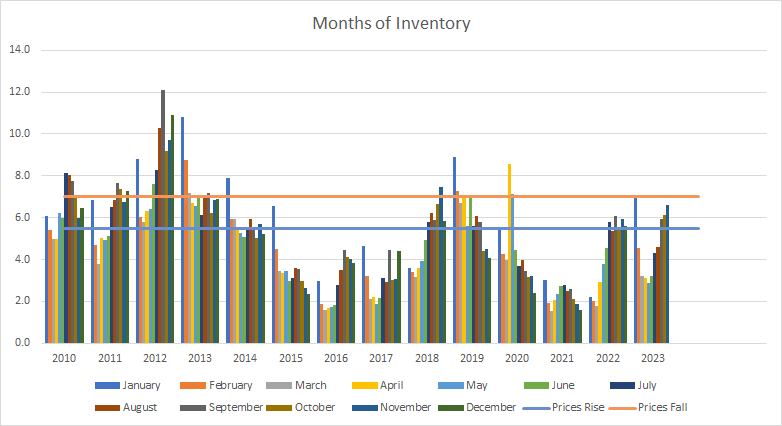
At 6.6 Months of Inventory, Prices have traditionally softened.
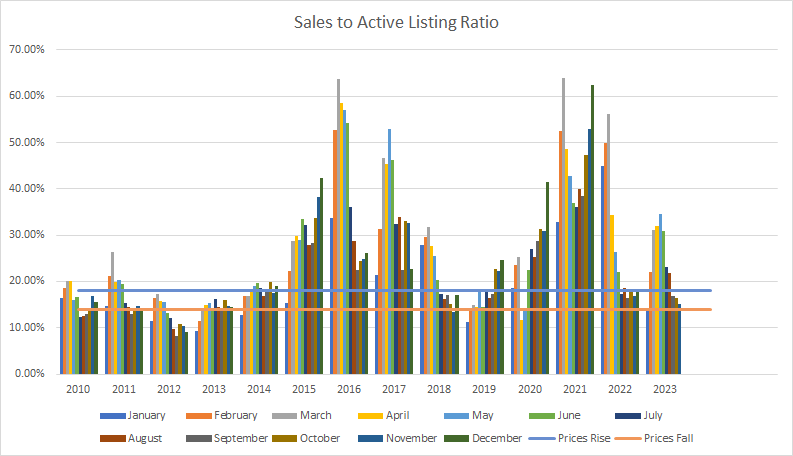
The most reliable indicator of market prices is the Sales to Active Listings Ratio (SAL). This is the ratio between the number of sales in a given month and the number of active listings at month-end.
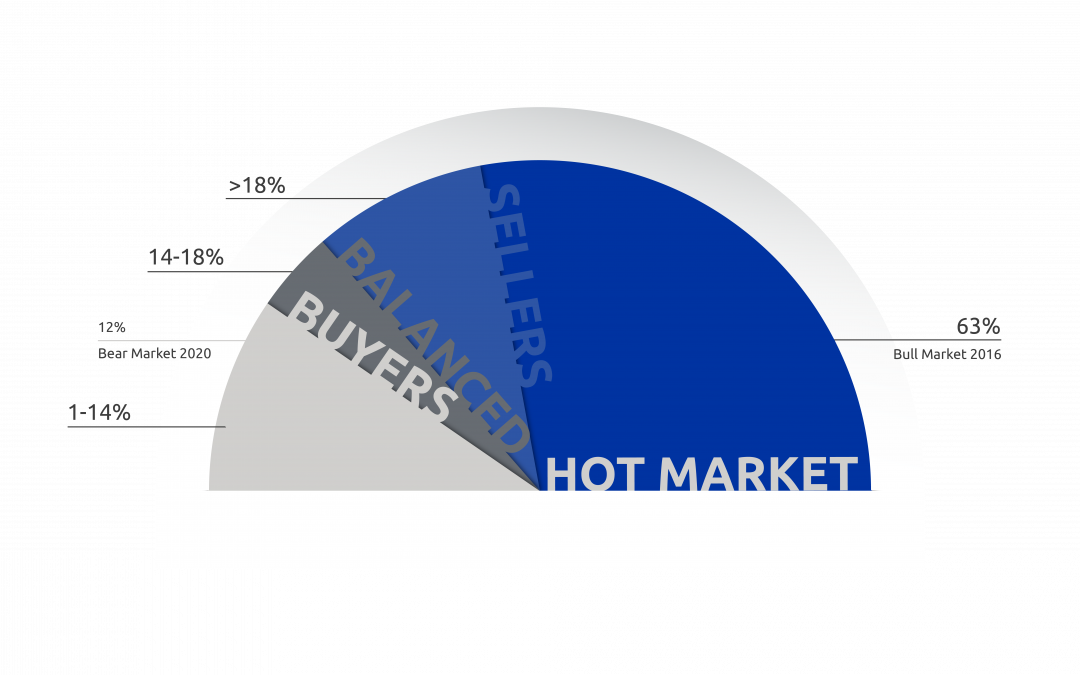
In hotter markets in BC, a long-term analysis has shown that prices will usually act in the following ways:
- 7+ Months of Inventory (Under 14% SAL): Prices will likely DECLINE
- 5 – 7 Months of Inventory (14% – 18% SAL): Prices will likely be STABLE
- Less than 5.5 Months of Inventory (Over 18% SAL): Prices will likely RISE
Visit this link to learn more about house prices and inventory.
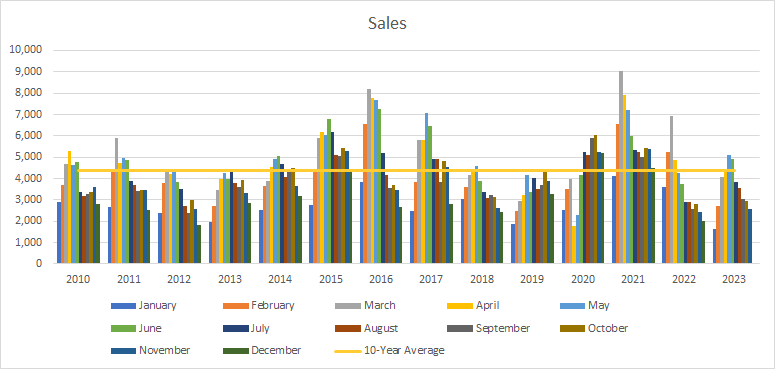
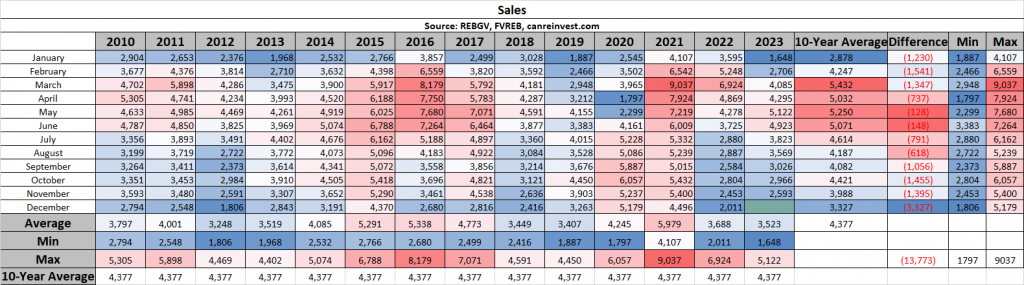
Sales
Sales (2,593) were about the same as a year ago (2,453), and were 25% below the 10-year average (3,988).
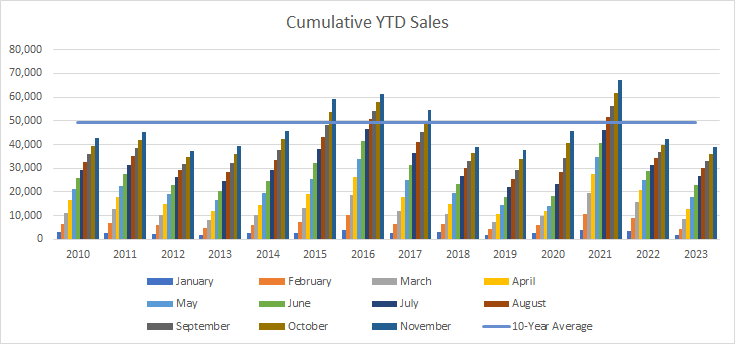
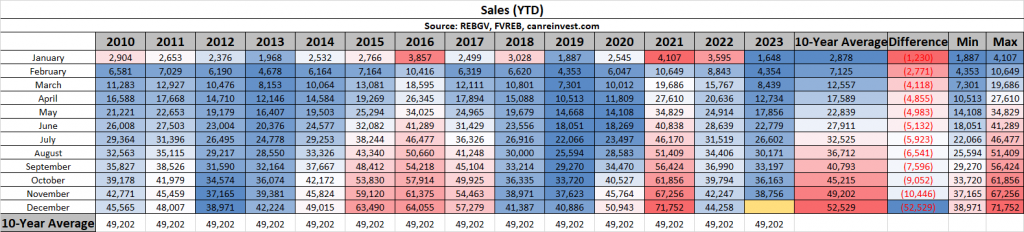
Cumulative Year-to-date Sales
2023 will likely end up as one of the slowest years in recent memory as sales (38,756) remain far below the 10-year average (49,202).
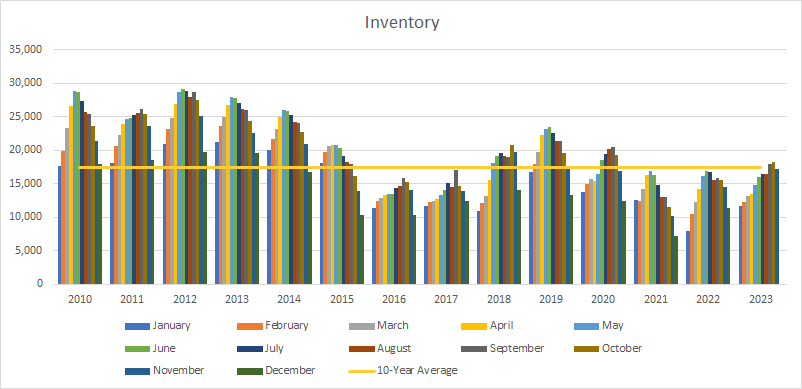
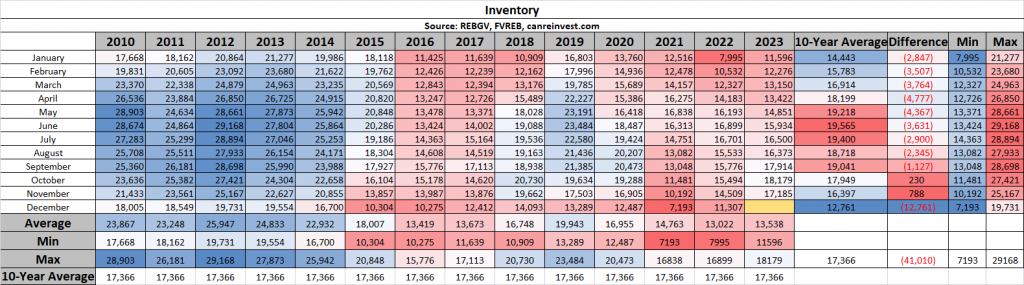
Inventory
Inventory (17,185 active listings) fell slightly from the previous month, but remain above the 10-year average for the first time since Nov 2020 (16,397 average).e).
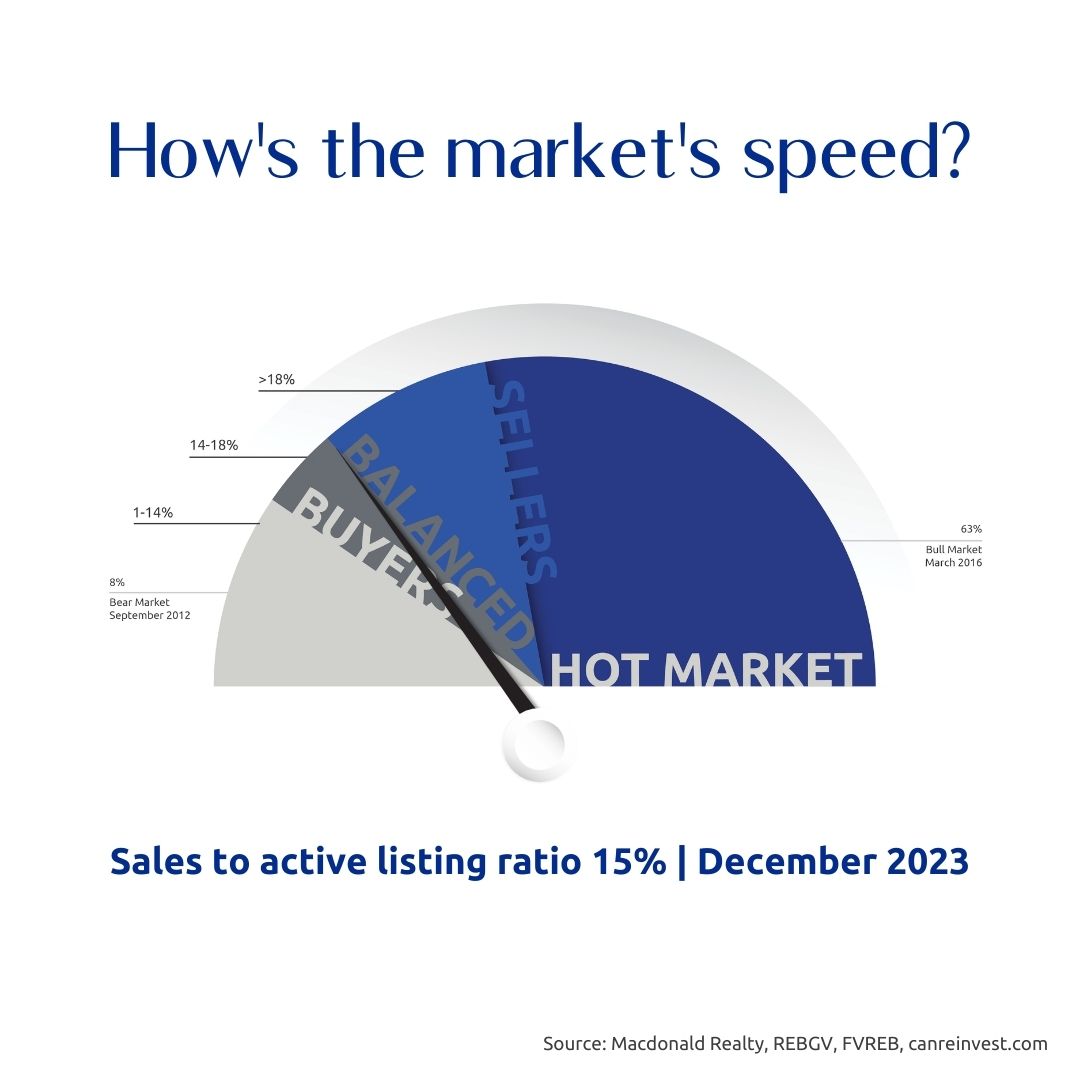
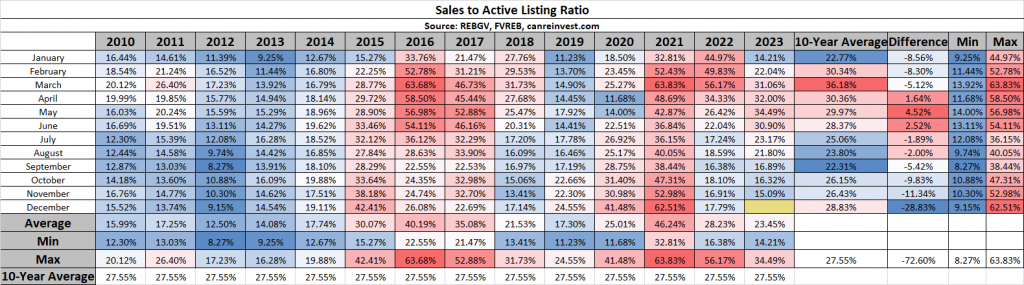
Sales to Active Listings
Low sales and rising inventory have the Sales to Active Listing Ratio at 15%, indicating softening prices.
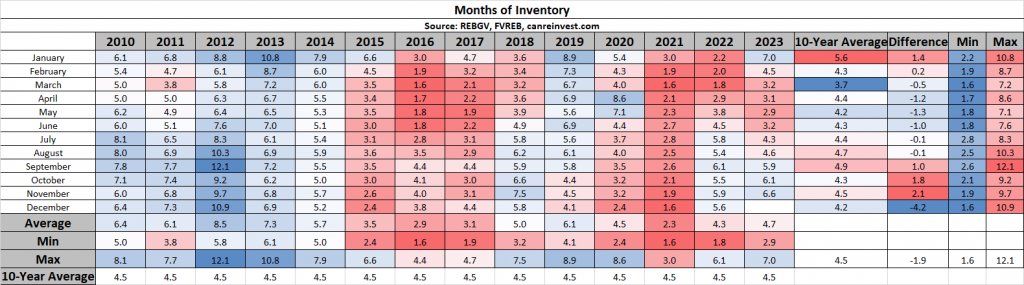
Months of Inventory
Similarly, Months of Inventory rose to 6.6 MOI, indicating a slow market and softening prices.
Want to learn more about these stats or discuss your move to Macdonald Realty?
Check out careersinbcrealestate.com to connect today!
by Macrealty Marketing Team | Dec 5, 2023 | Market Updates
Here are the latest real estate market statistics from Macdonald Realty on Okanagan listings and sales in November 2023.
Find the infographics by visiting the Facebook Album.
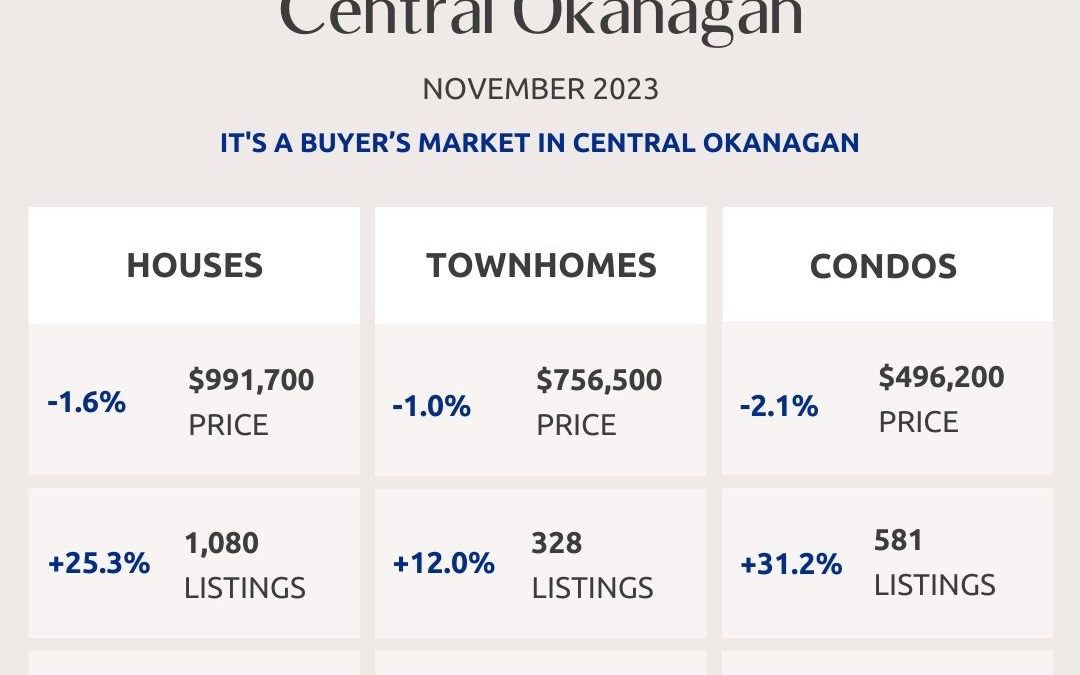
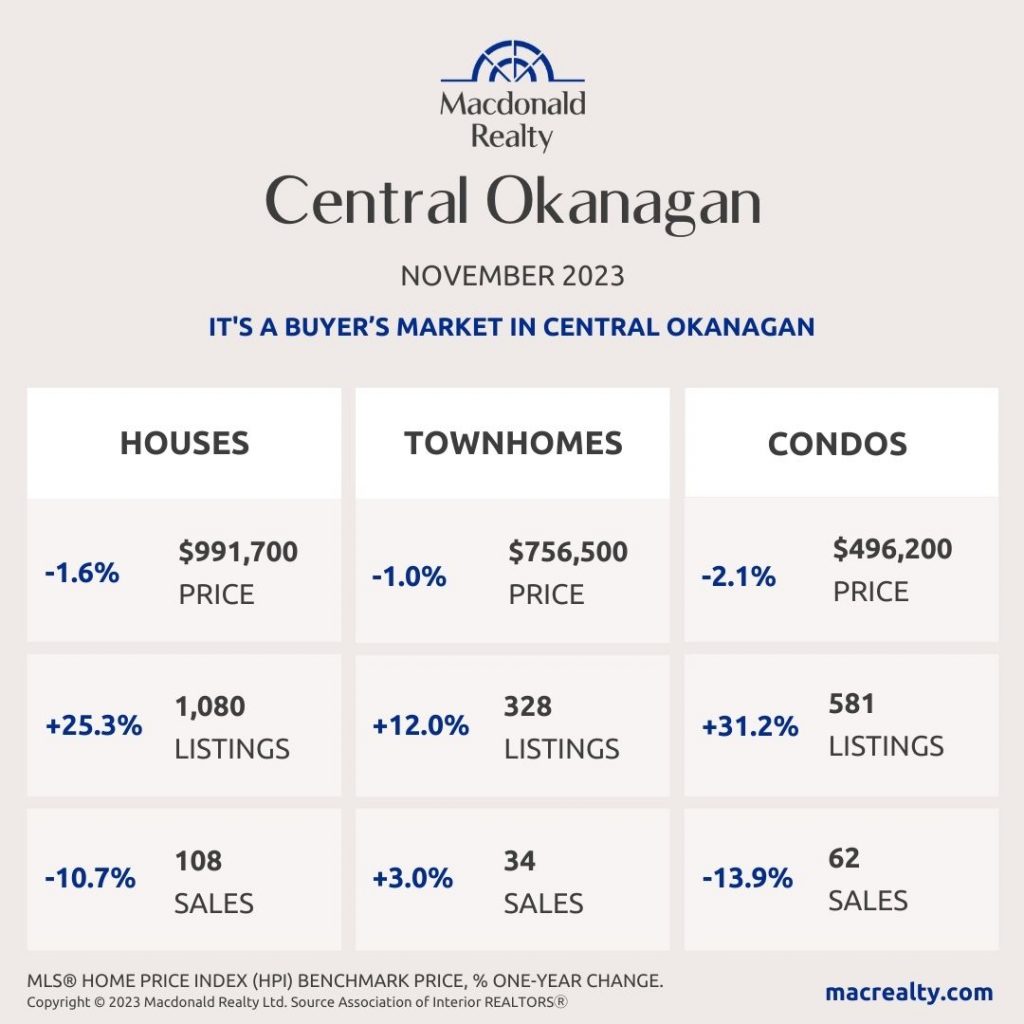
Central Okanagan: Kelowna and Lake Country
There were 108 sales, 1,080 active listings, and $991,700 average sale price for detached homes in the Central Okanagan market, including Kelowna and Lake Country. The condo market featured 62 sales and 581 active listings at the end of the month. The average sale price was $496,200. Townhome sales were 34, active listings were 328 and the average sale price was $756,500. It’s a buyer’s market in Central Okanagan.
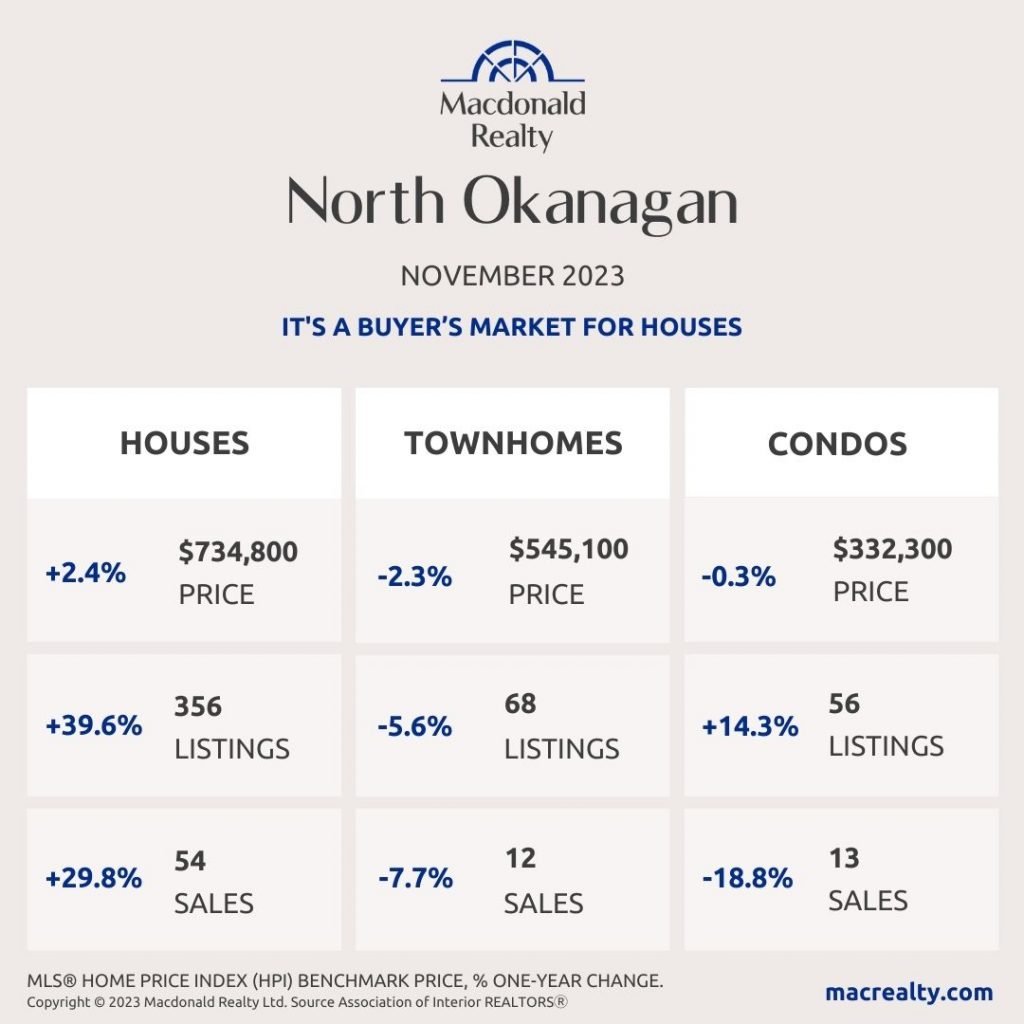
North Okanagan: Vernon and surrounding area
In North Okanagan, including Vernon and the surrounding area and the average detached home sale price was $734,800. At the end of the month, there were 54 sales and 356 active listings. There were 13 sales and 56 active listings for condos. The average sale price was $332,300. In comparison, townhomes featured 12 sales, 68 active listings and a $545,100 average sale price. It’s a buyer’s market for houses in North Okanagan.
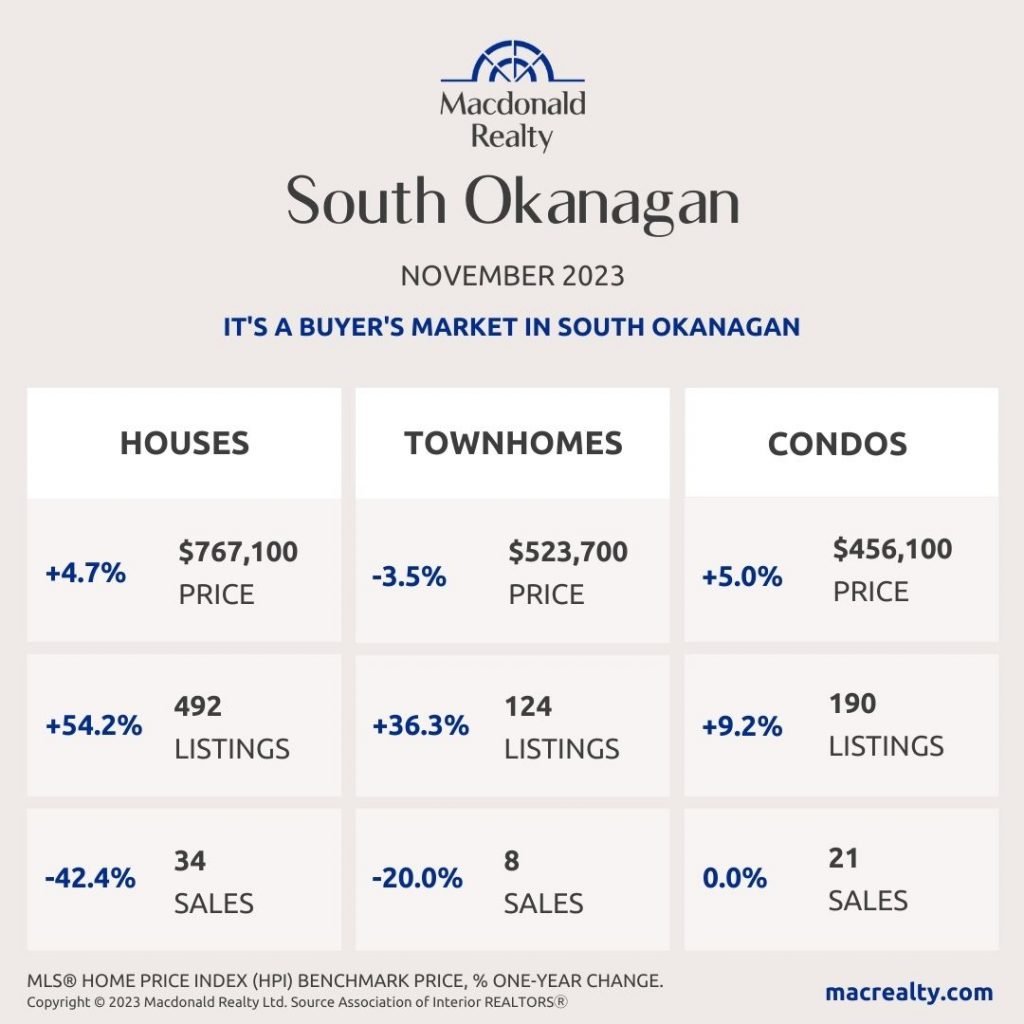
South Okanagan
There were 34 sales, 492 active listings, and $767,100 average sale price for detached homes in the South Okanagan market.
The condo market featured 21 sales and 190 active listings at the end of the month. The average sale price was $456,100. Townhome sales were 8, active listings were 124 and the average sale price was $523,700. It’s a buyer’s market in South Okanagan.
Looking for more information about the real estate market in specific neighbourhoods in Okanagan?
Macdonald Realty has offices in Kelowna and across BC. Please email [email protected] or call 1-877-278-3888 to be matched with a REALTOR® working in your area.
This blog post is based on market data provided by the Association Of Interior REALTORS® https://www.interiorrealtors.ca/.
by Macrealty Marketing Team | Dec 5, 2023 | Market Updates
Here are the latest real estate market statistics from Macdonald Realty on Greater Victoria, Saanich Peninsula, Parksville/Qualicum, and Nanaimo listings and sales in September 2023. Find all the infographics related to the August Market Statistics by visiting the
Facebook Album.
A total of 394 properties sold in the Victoria Real Estate Board region this November, a 2.6 per cent increase from the 384 properties sold in November 2022 and a 3.2 per cent decrease from October 2023. Sales of condominiums were down 11.8 per cent from November 2022 with 120 units sold. Sales of single family homes increased by 6 per cent from November 2022 with 193 sold.
“It’s unsurprising to see this slight relaxation of sales in the market,” said Victoria Real Estate Board Chair Graden Sol. “Given the current interest rate environment, our sales numbers are lower than long term averages, but the pattern of seasonality within those lower numbers is what we would expect for this part of the year. We have seen a healthy twenty-five per cent increase in the number of listings on market compared to last year and this is positive news as we recover from that long-term trend of very low inventory.“
There were 2,644 active listings for sale on the Victoria Real Estate Board Multiple Listing Service® at the end of November 2023, a decrease of 4.1 per cent compared to the previous month of October and a 25.2 per cent increase from the 2,111 active listings for sale at the end of November 2022.
“The longer we are in balanced market conditions, the easier transitions for buyers and sellers become,” adds Sol. “Local people who planned to sell and move within the Greater Victoria area may have hesitated to list their homes back when record low inventory meant less choice when they became buyers. Now that we see some balance in the market, these people have more inventory to pick from and may feel more confident listing their existing home. And of course, all buyers are having better experiences with more time and more choice. We always anticipate a seasonal reduction in activity over winter, but if you are contemplating a move in the new year, now is an excellent time to consult with your favourite REALTOR® to create your strategy.”
The Multiple Listing Service® Home Price Index benchmark value for a single family home in the Victoria Core in November 2022 was $1,248,600. The benchmark value for the same home in November 2023 increased by 3 per cent to $1,286,400, which is down from October’s value of $1,305,900. The MLS® HPI benchmark value for a condominium in the Victoria Core area in November 2022 was $568,400, while the benchmark value for the same condominium in November 2023 increased by 1.6 per cent to $577,400, which is down from the October value of $585,600.
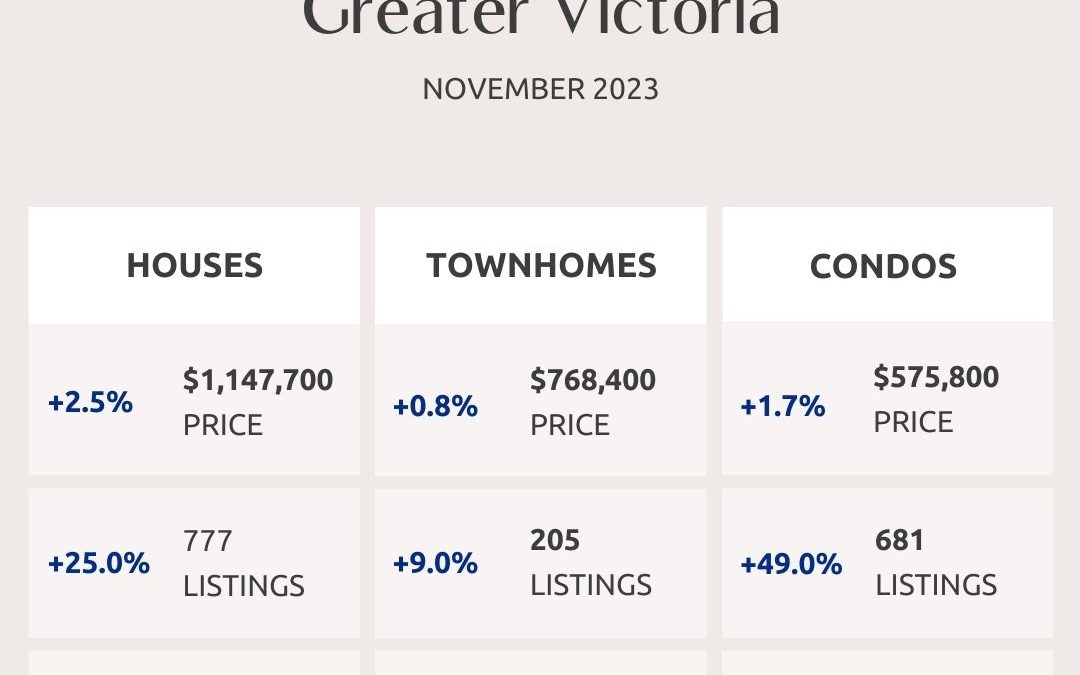
Greater Victoria

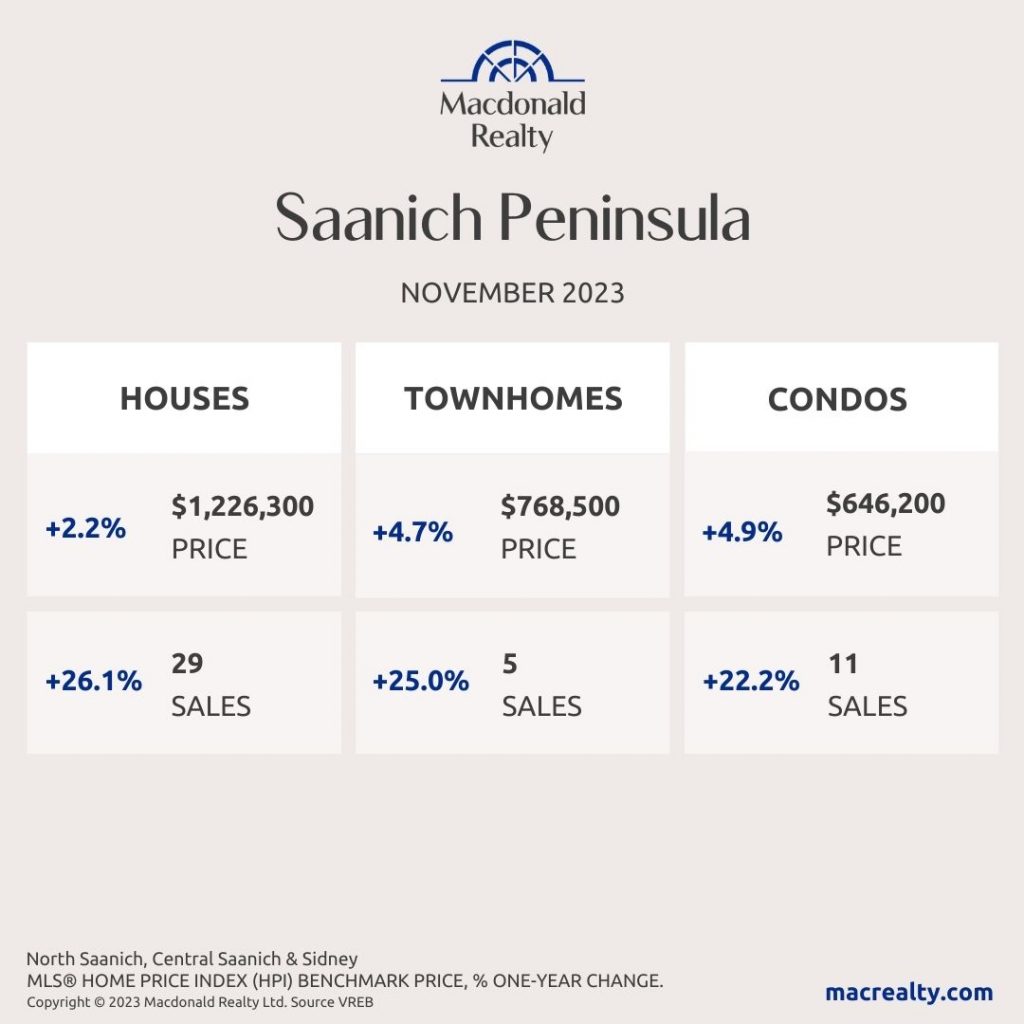
Saanich Peninsula
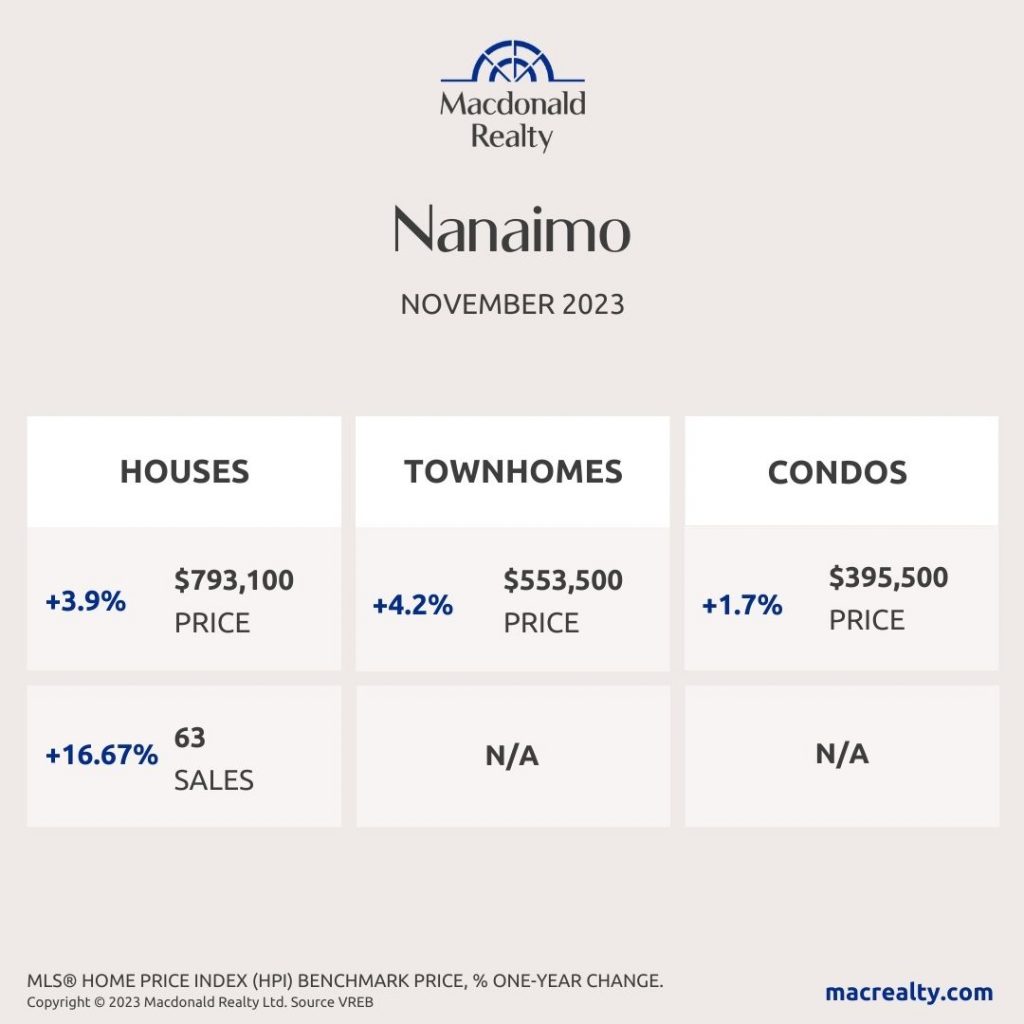
Nanaimo
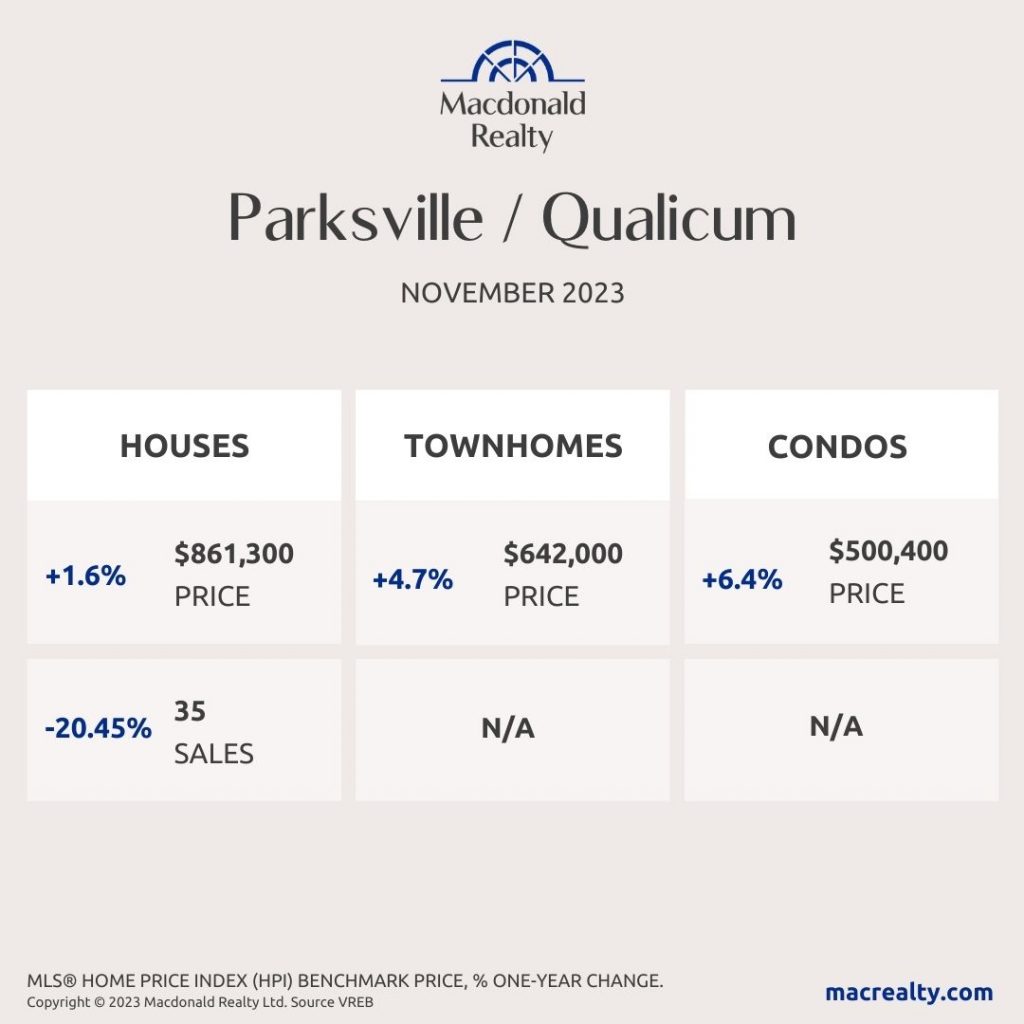
Parksville / Qualicum
Looking for more information about the real estate market in specific neighbourhoods in Victoria, Saanich Peninsula, Parksville, Nanaimo, Vancouver Island and the Gulf Islands?
Macdonald Realty has offices in downtown Victoria, Sidney, Parksville and Salt Spring Island. Please email [email protected] or call 1-877-278-3888 to be matched with a REALTOR® working in your area.
MLS® Home Price Index (HPI) Benchmark Price
Average and median home prices are often misinterpreted, are affected by change in the mix of homes sold, and can swing dramatically from month to month (based on the types and prices of properties that sold in a given month). The MLS® HPI overcomes these shortcomings and uses the concept of a benchmark home, a notional home with common attributes of typical homes in a defined area. Visit www.housepriceindex.ca for more information.
This blog post is based on market data provided by the Victoria Real Estate Board (VREB) www.vreb.org and the Vancouver Island Real Estate Board (VIREB) www.vireb.com. Market data from the VIREB includes listings and sales in Campbell River, Comox Valley, Cowichan Valley Nanaimo, Parksville/Qualicum, Port Alberni/West, North Island, and the Islands.
by Macrealty Marketing Team | Dec 4, 2023 | Market Updates
Here are the latest real estate market statistics from Macdonald Realty on the Greater Vancouver listings and sales in November 2023. Find all the infographics by visiting the Facebook Album.
With one month left in 2023, a steady increase in housing inventory is offering home buyers across Metro Vancouver1 among the largest selection to choose from since 2021.
The Real Estate Board of Greater Vancouver (REBGV) reports that residential sales2 in the region totalled 1,702 in November 2023, a 4.7 per cent increase from the 1,625 sales recorded in November 2022. This was 33 per cent below the 10-year seasonal average (2,538).
“We’ve been watching the number of active listings in our market increase over the past few months, which is giving buyers more to choose from than they’ve been used to seeing over the past few years,” Andrew Lis, REBGV’s director of economics and data analytics said. “When paired with the seasonal slowdown in sales we typically see this time of year, this increase in supply is creating balanced conditions across Metro Vancouver’s housing market.”
There were 3,369 detached, attached and apartment properties newly listed for sale on the Multiple Listing Service® (MLS®) in Metro Vancouver in November 2023. This represents a 9.8 per cent increase compared to the 3,069 properties listed in November 2022. This was 2.8 per cent below the 10-year seasonal average (3,464).
The total number of properties currently listed for sale on the MLS® system in Metro Vancouver is 10,931, a 13.5 per cent increase compared to November 2022 (9,633). This is 3.7 per cent above the 10-year seasonal average (10,543).
Across all detached, attached and apartment property types, the sales-to-active listings ratio for November 2023 is 16.3 per cent. By property type, the ratio is 12.7 per cent for detached homes, 19.8 per cent for attached, and 18.2 per cent for apartments.
Analysis of the historical data suggests downward pressure on home prices occurs when the ratio dips below 12 per cent for a sustained period, while home prices often experience upward pressure when it surpasses 20 per cent over several months
“Balanced market conditions typically come with flatter price trends, and that’s what we’ve seen in the market since the summer months. These trends follow a period where prices rose over seven per cent earlier in the year,” Lis said. “You probably won’t find Cyber Monday discounts, but prices have edged lower by a few per cent since the summer. And with most economists expecting mortgage rates to fall modestly in 2024, market conditions for buyers are arguably the most favorable we’ve seen in some time in our market.”
The MLS® Home Price Index composite benchmark price for all residential properties in Metro Vancouver is currently $1,185,100. This represents a 4.9 per cent increase over November 2022 and a one per cent decrease compared to October 2023.
*Areas covered by the Real Estate Board of Greater Vancouver include Burnaby, Coquitlam, Maple Ridge, New Westminster, North Vancouver, Pitt Meadows, Port Coquitlam, Port Moody, Richmond, South Delta, Squamish, Sunshine Coast, Vancouver, West Vancouver, and Whistler. Check out the infographics of Squamish, Sunshine Coast and Whistler, HERE.
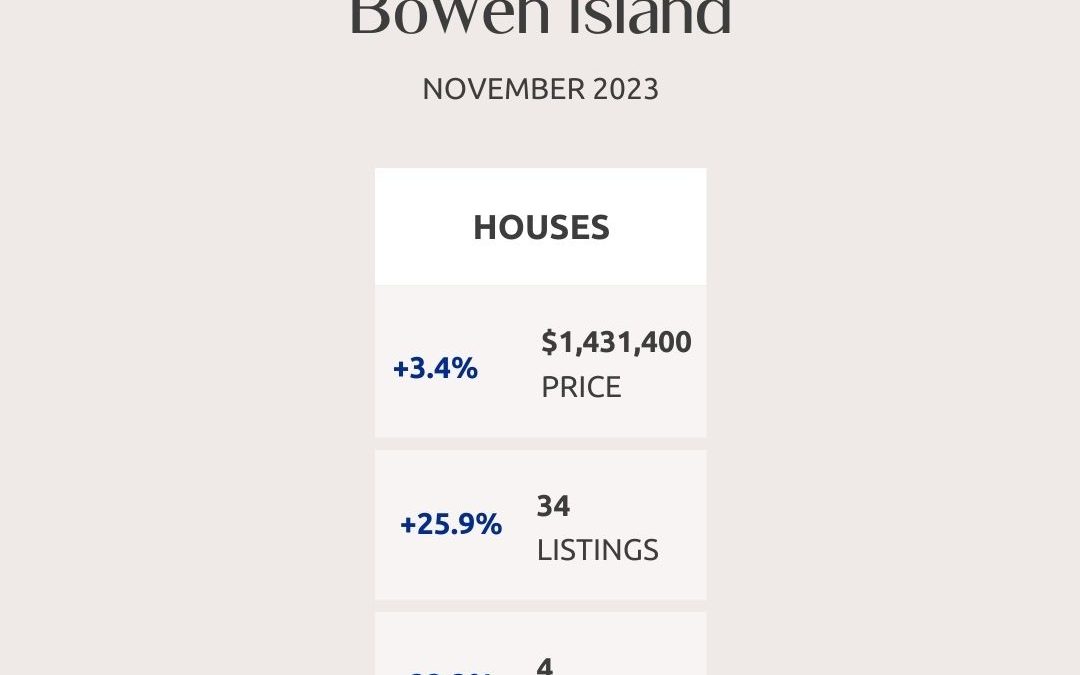
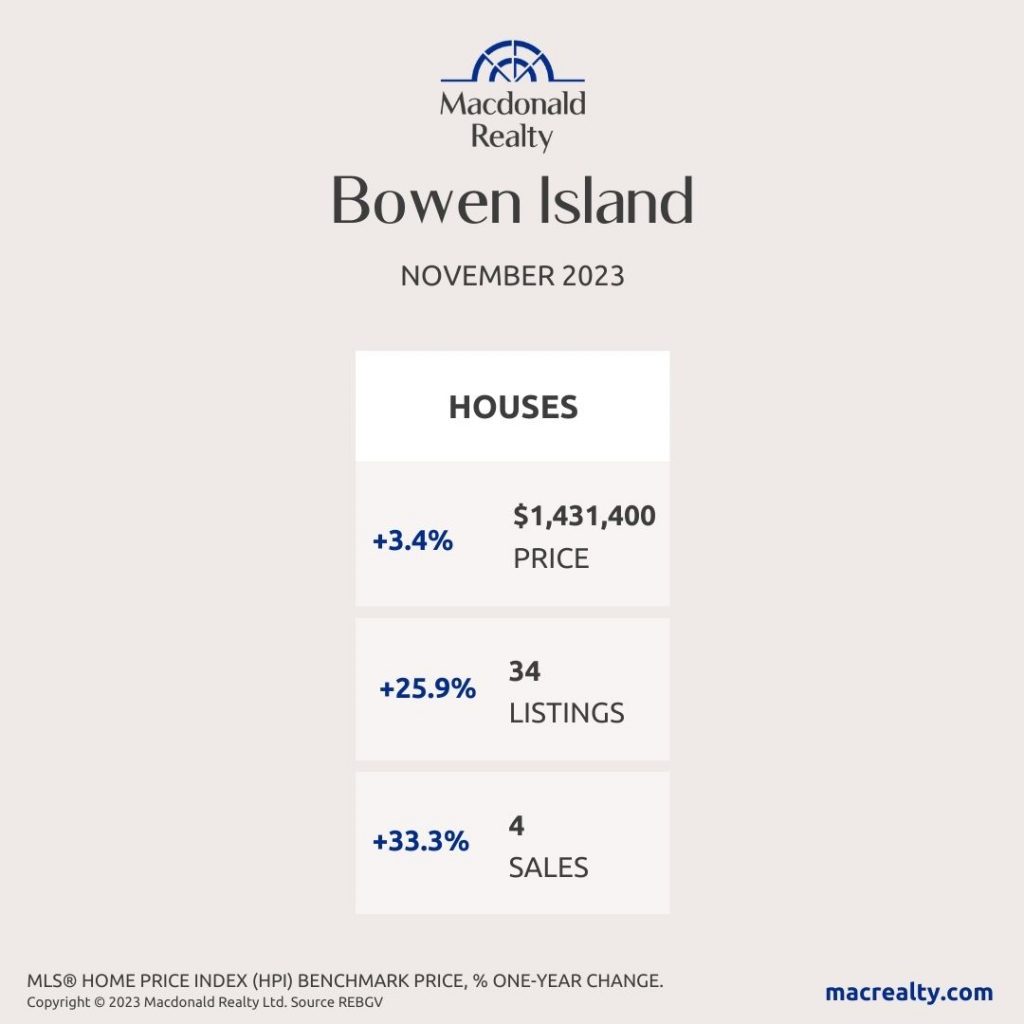
Bowen Island
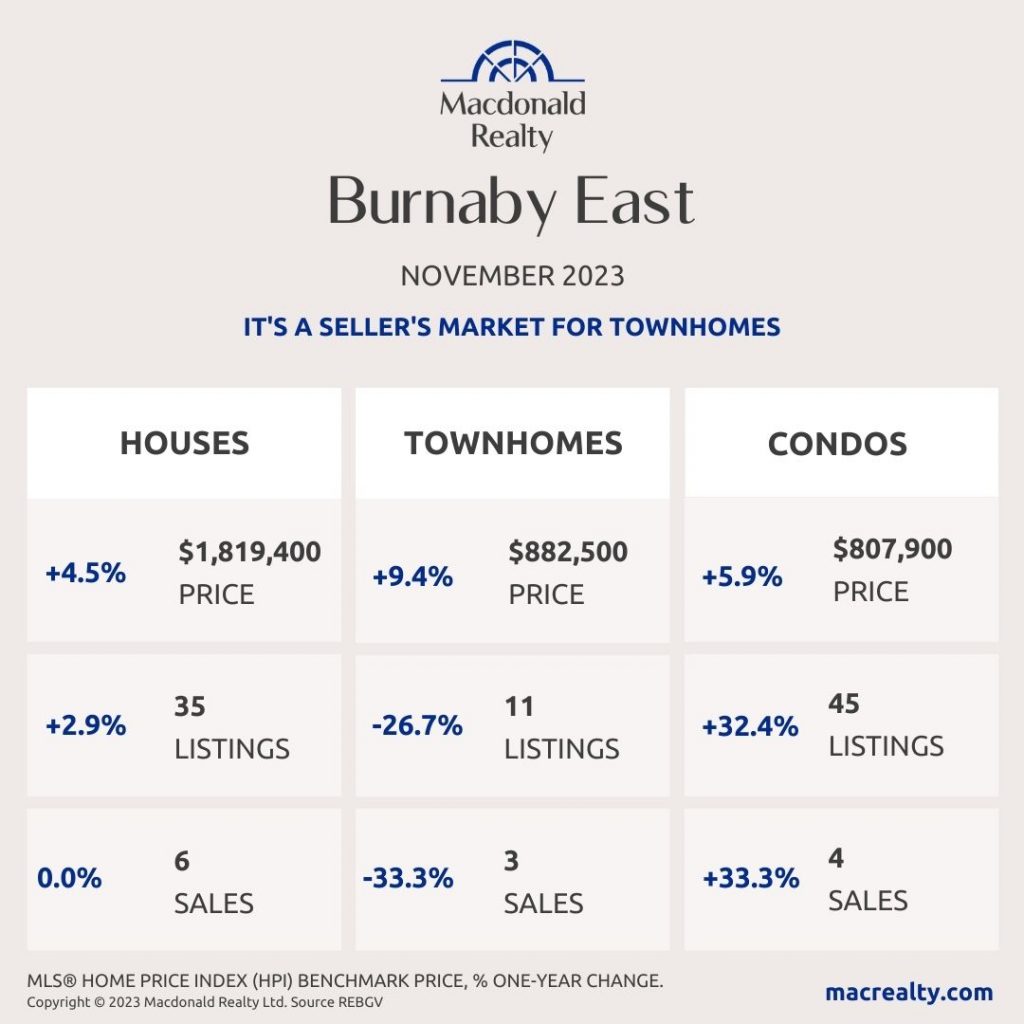
Burnaby East
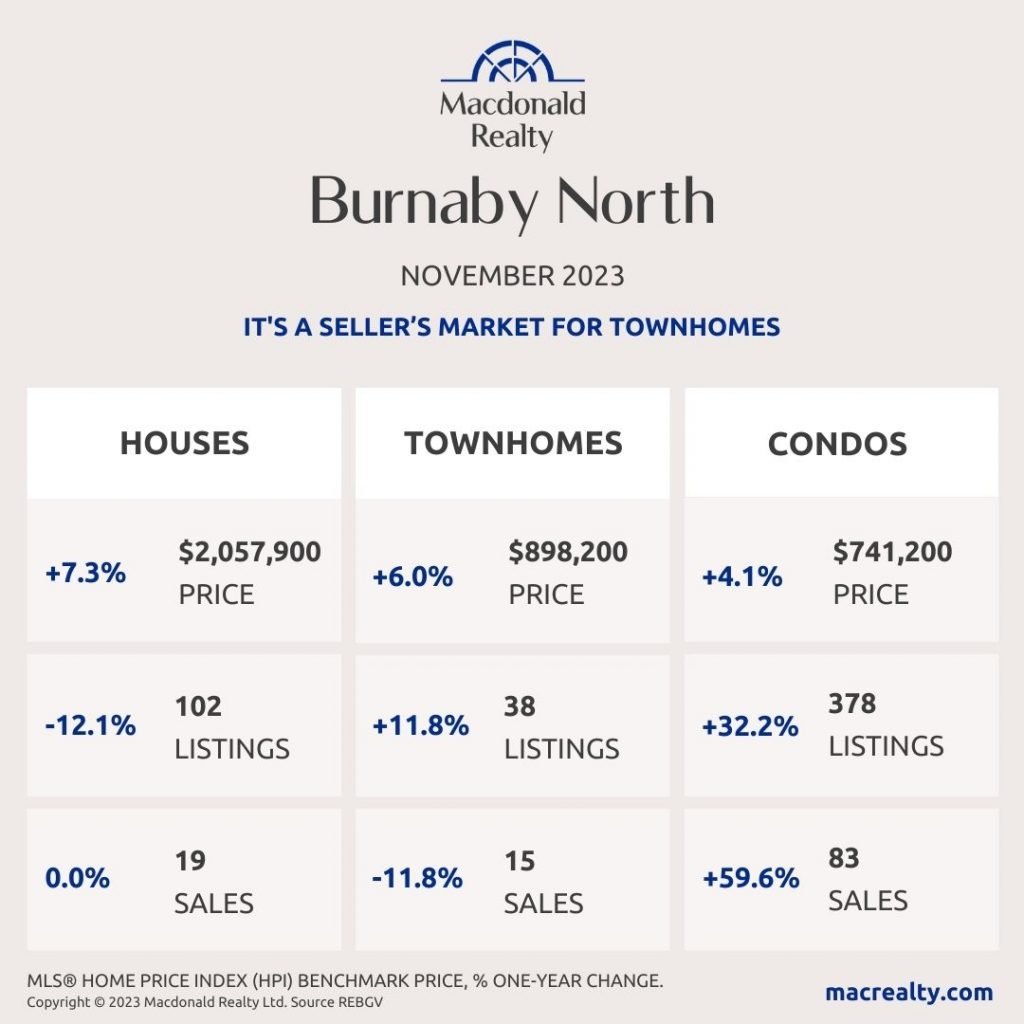
Burnaby North
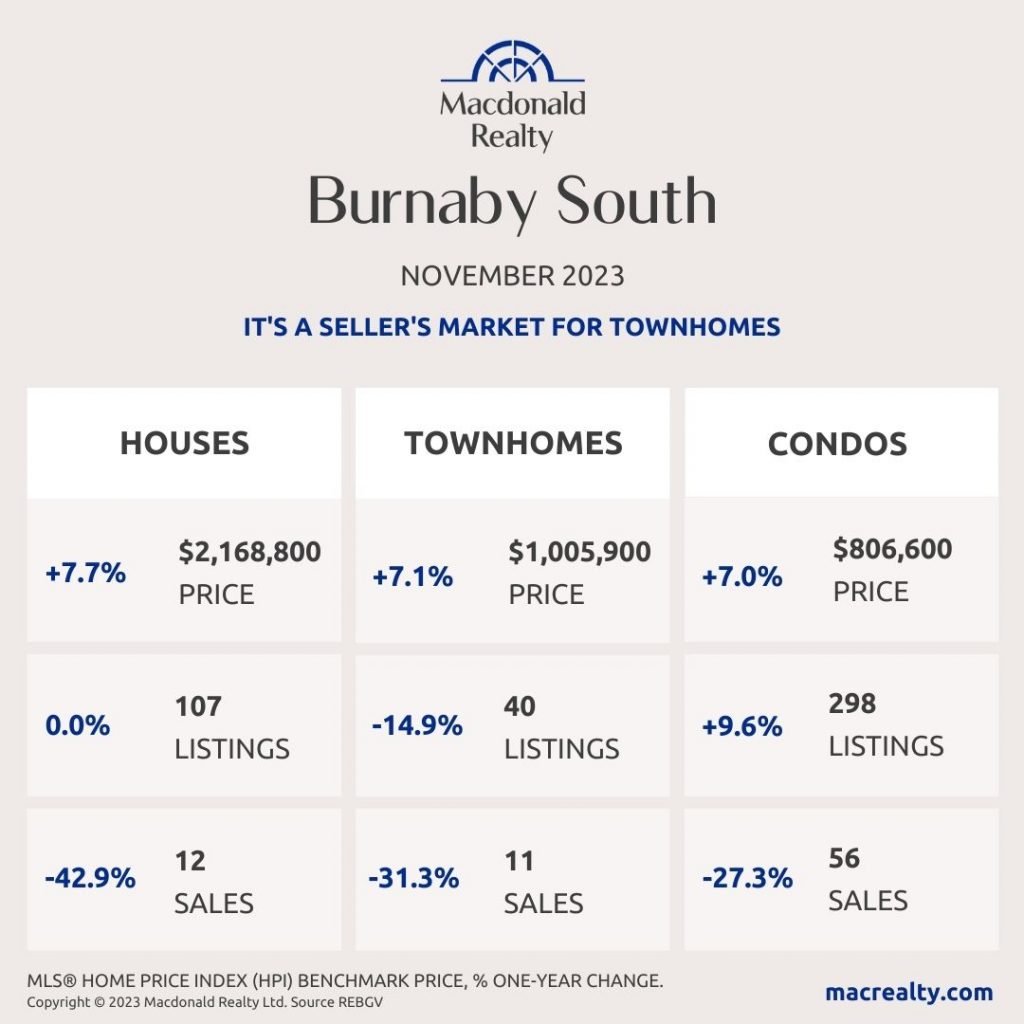
Burnaby South
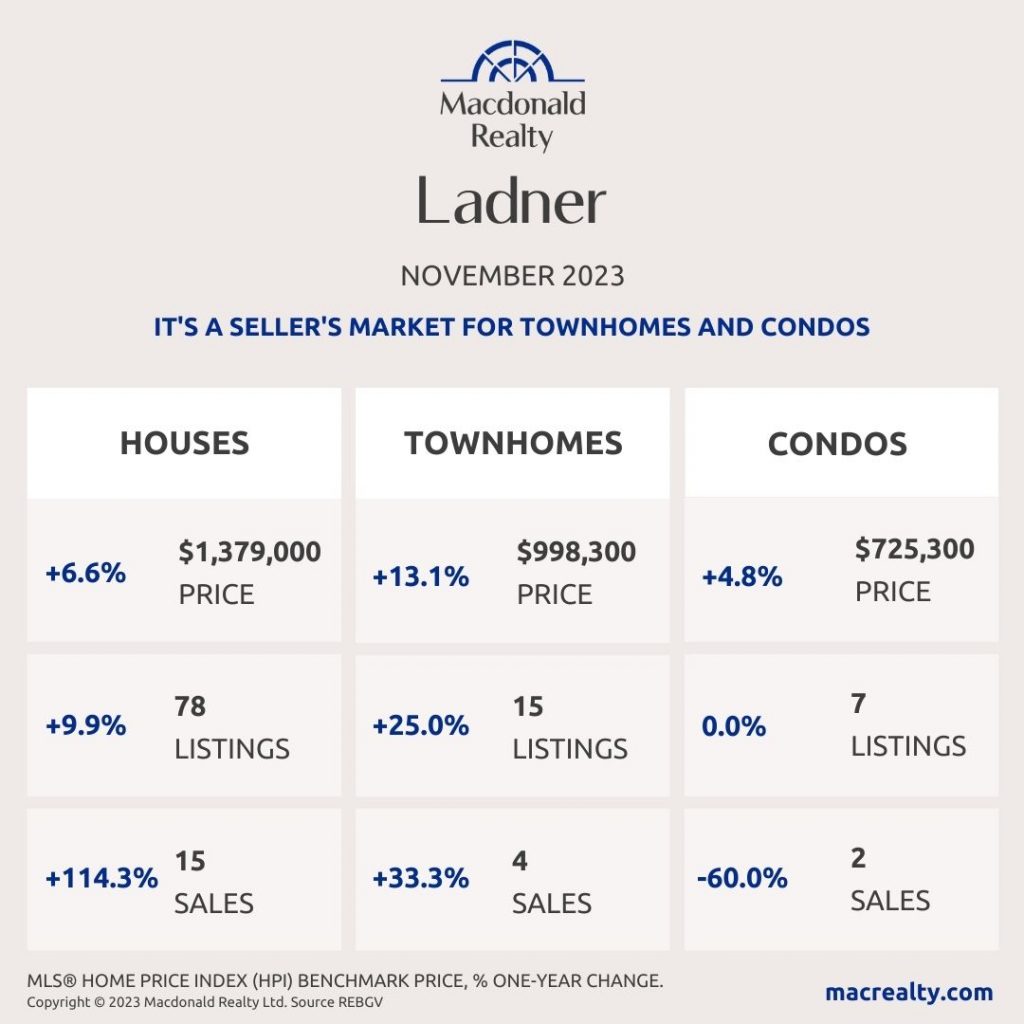
Ladner
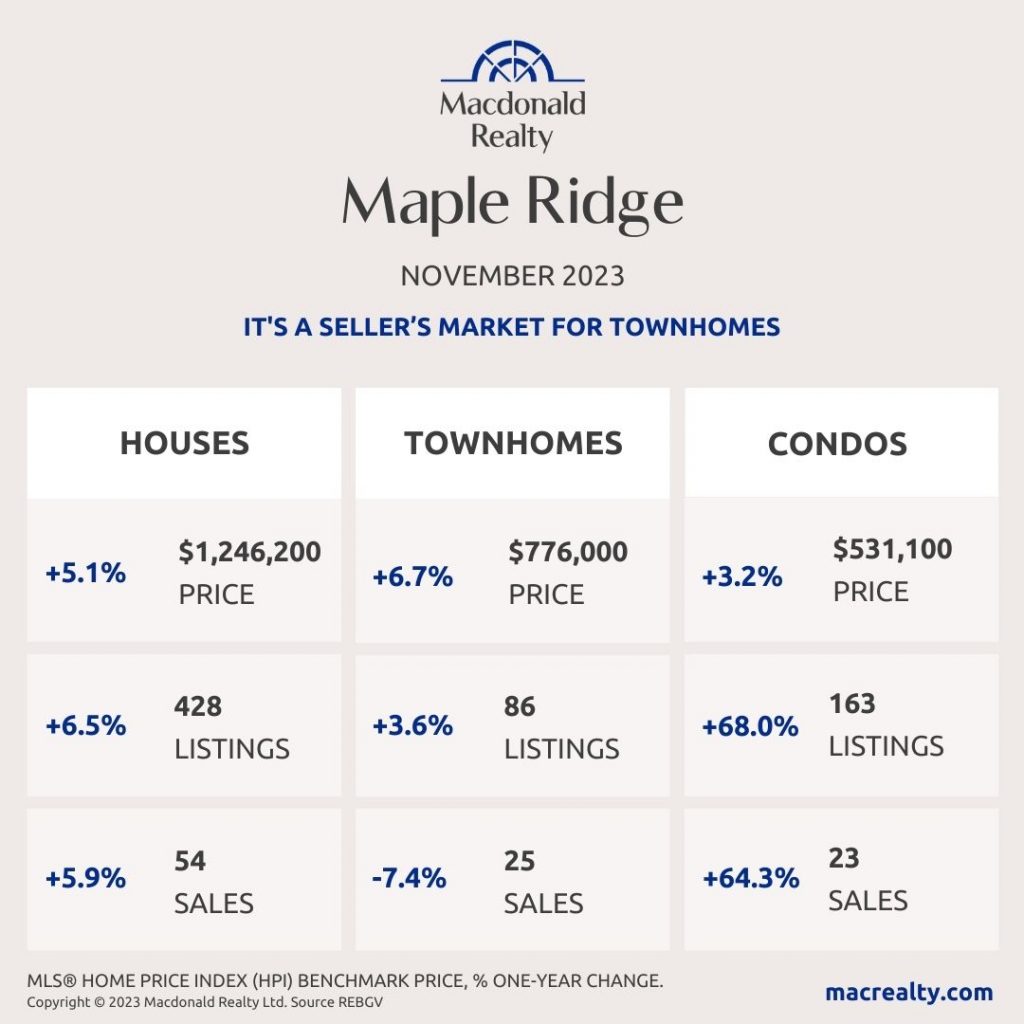
Maple Ridge
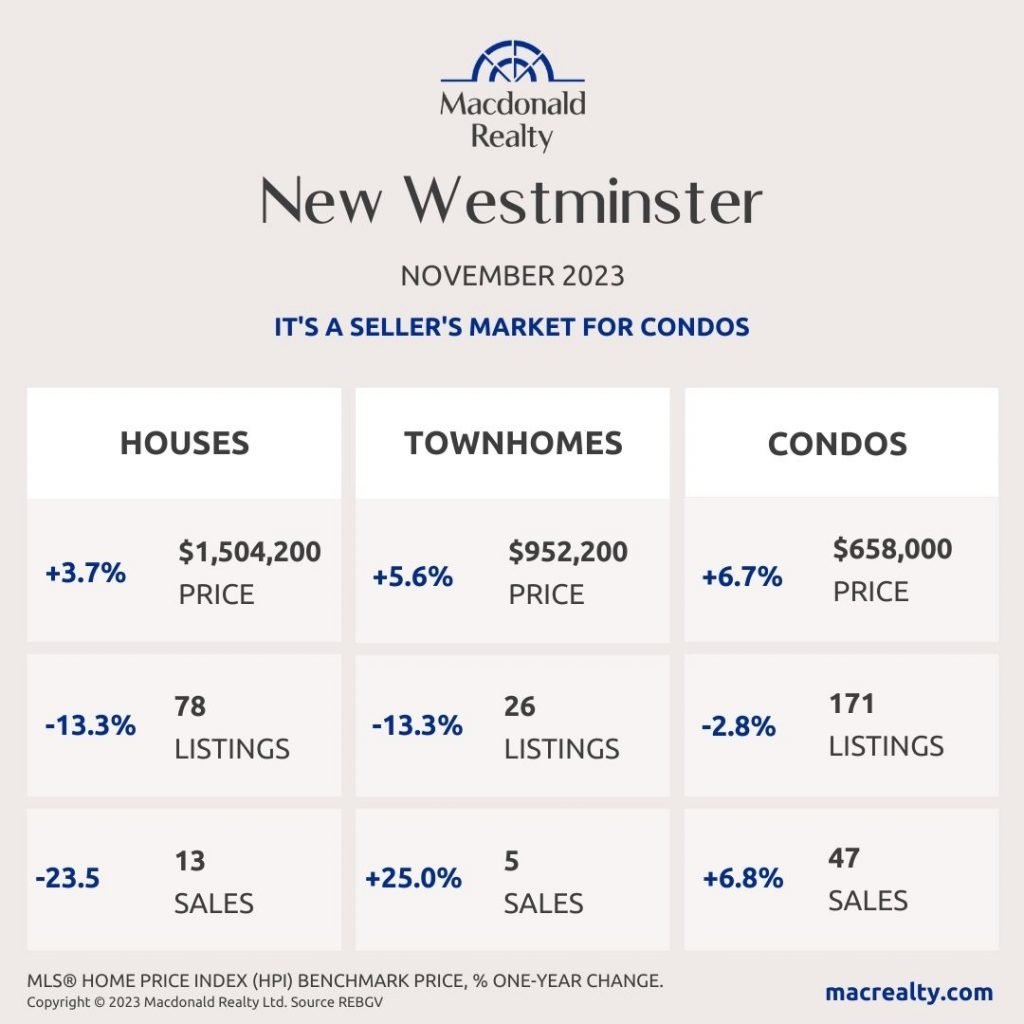
New Westminster
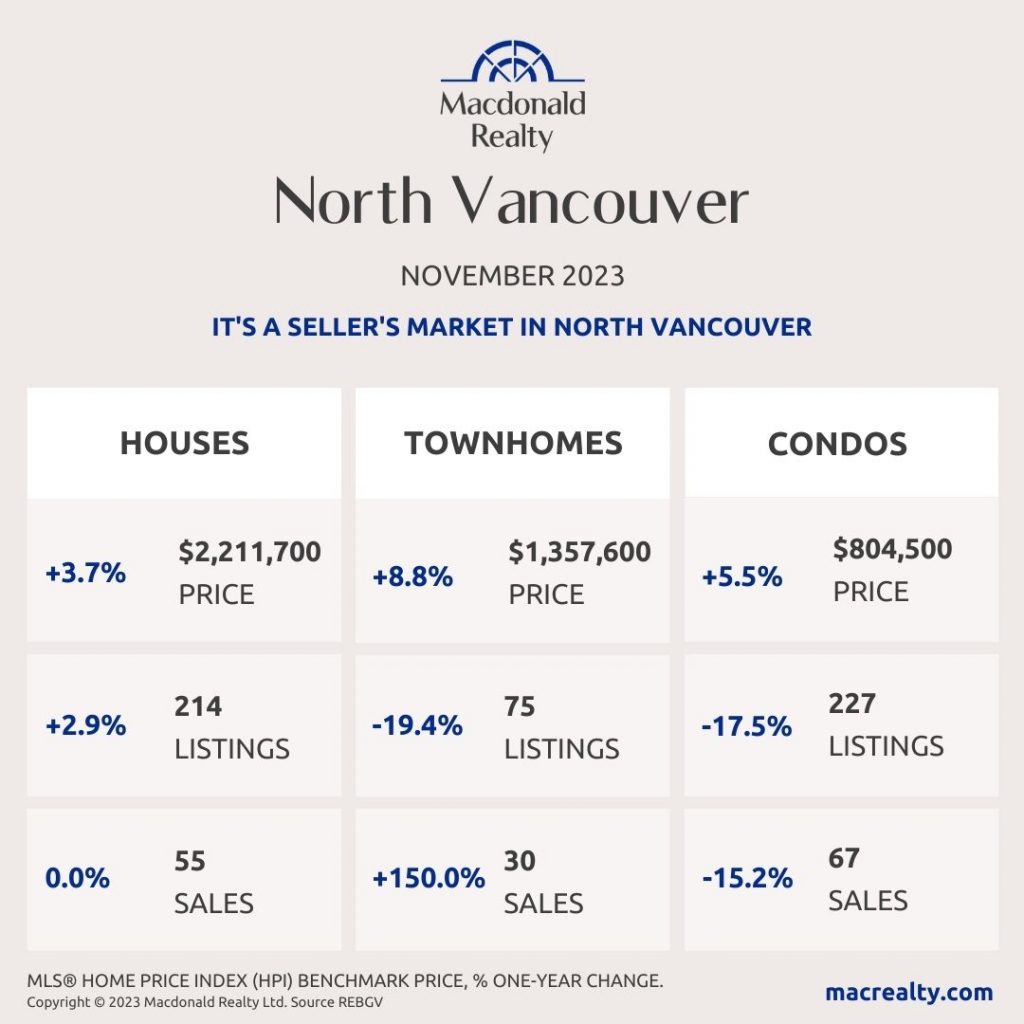
North Vancouver
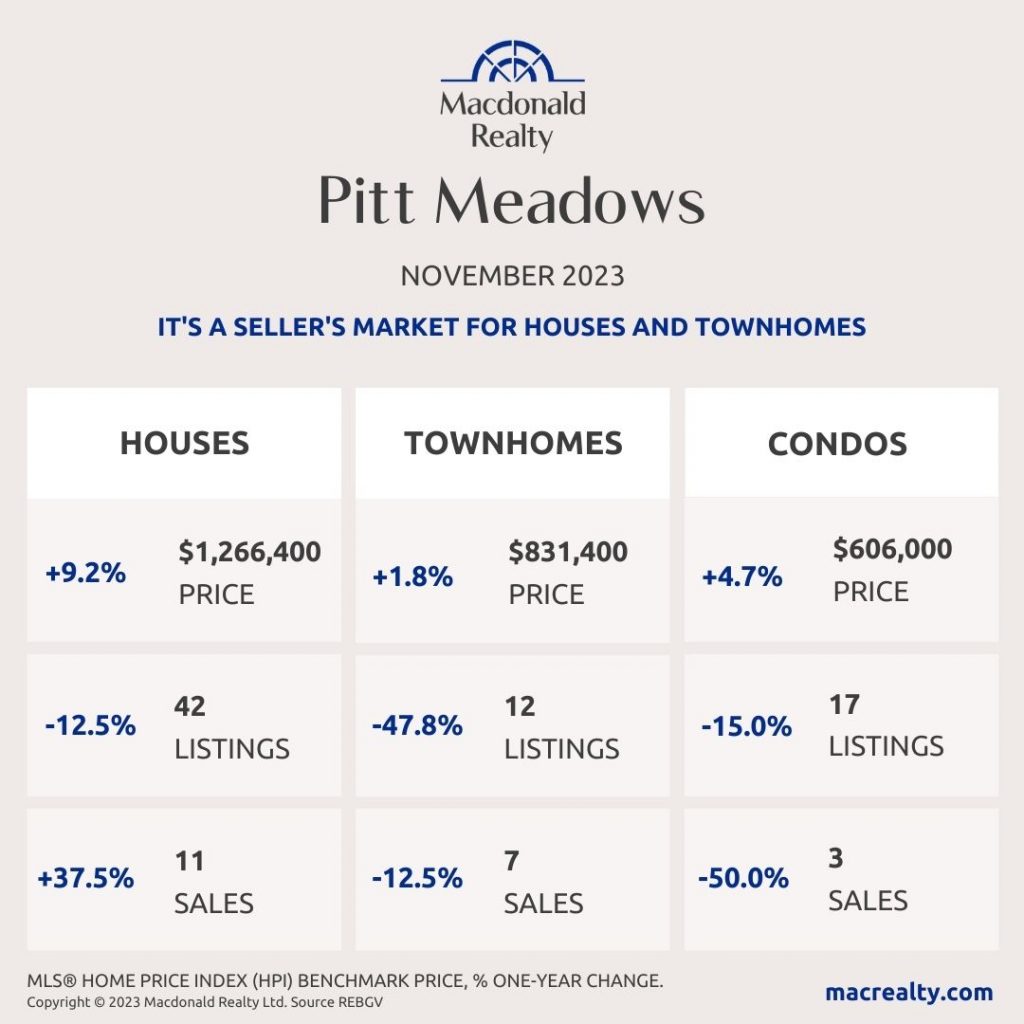
Pitt Meadows
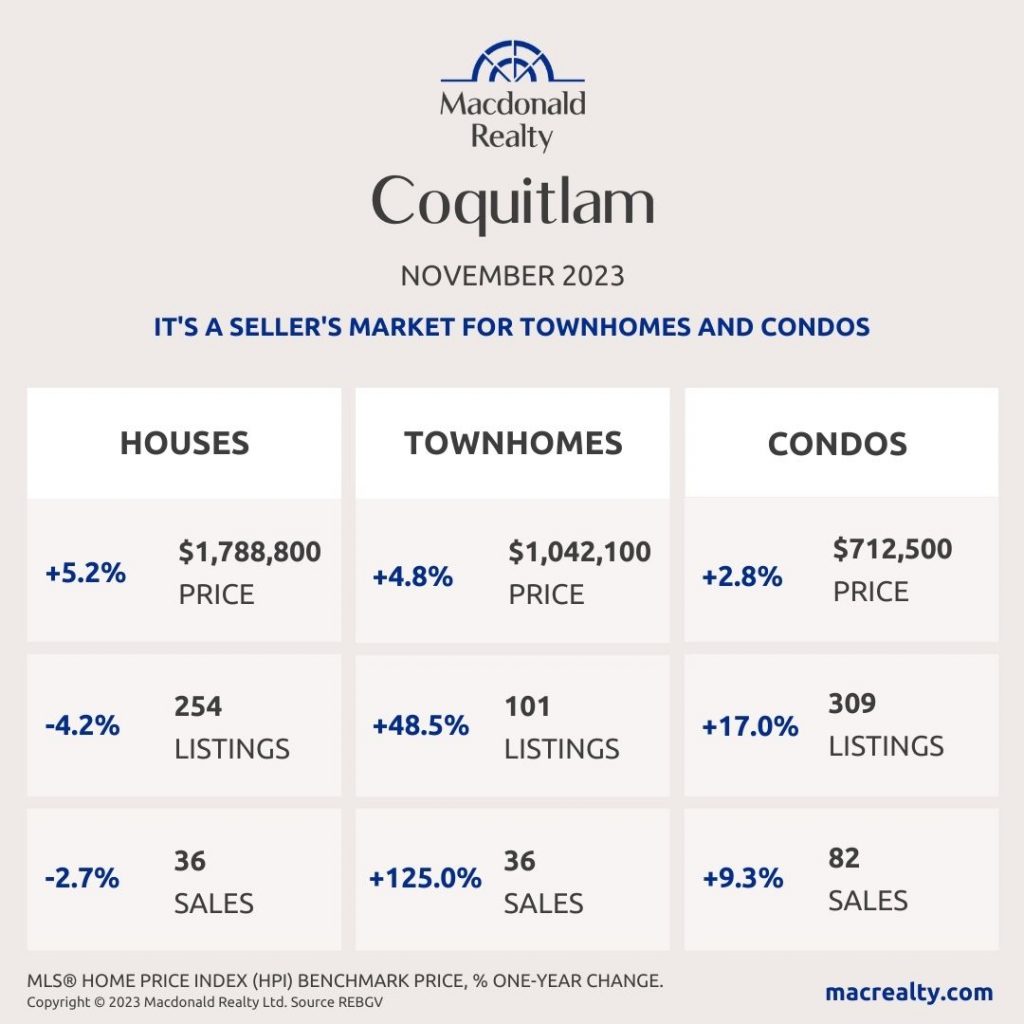
Coquitlam
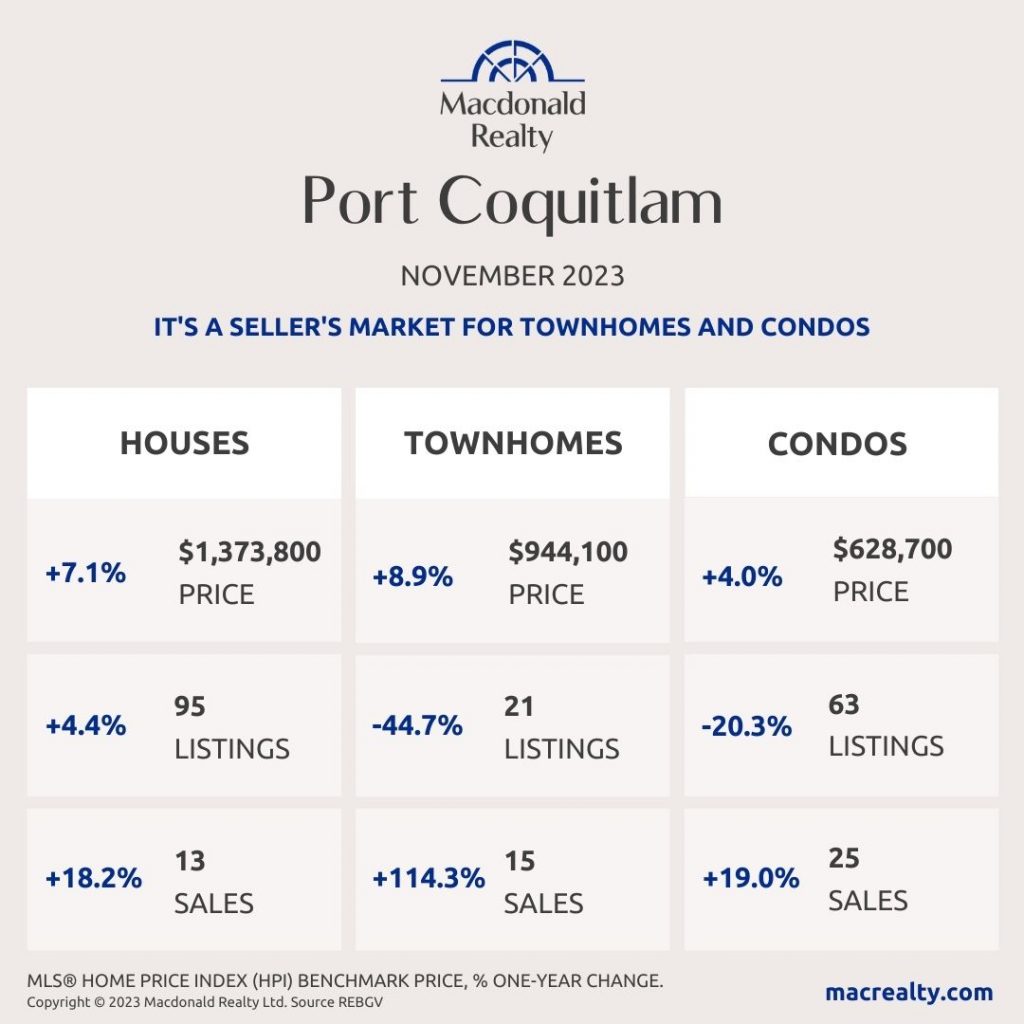
Port Coquitlam
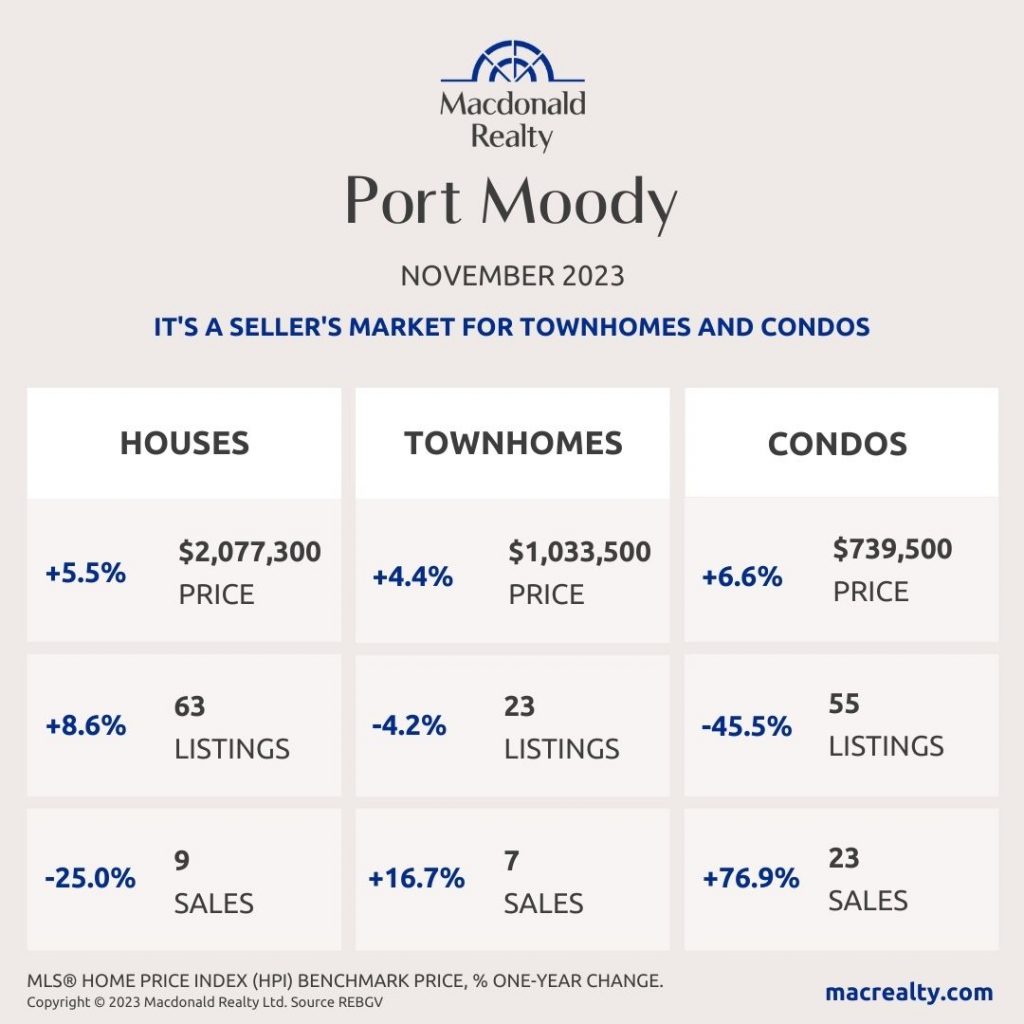
Port Moody
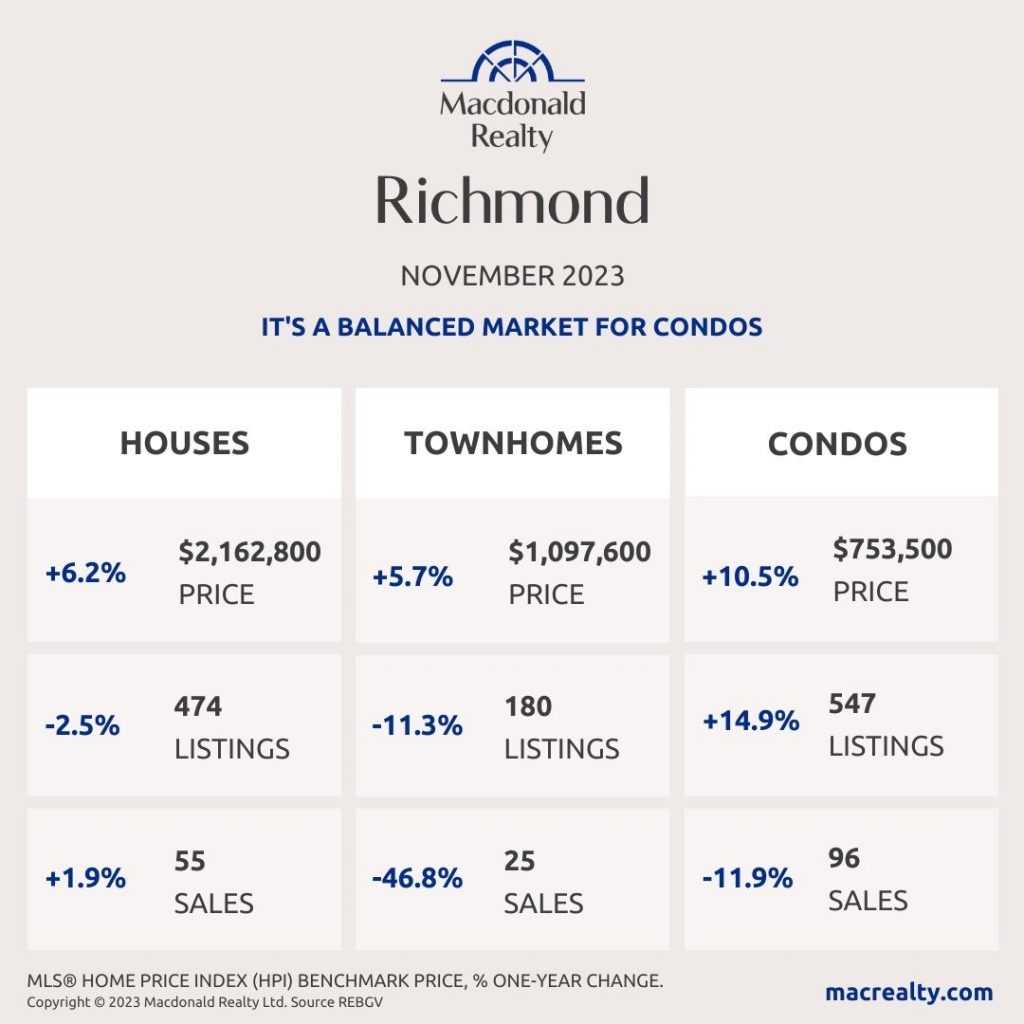
Richmond
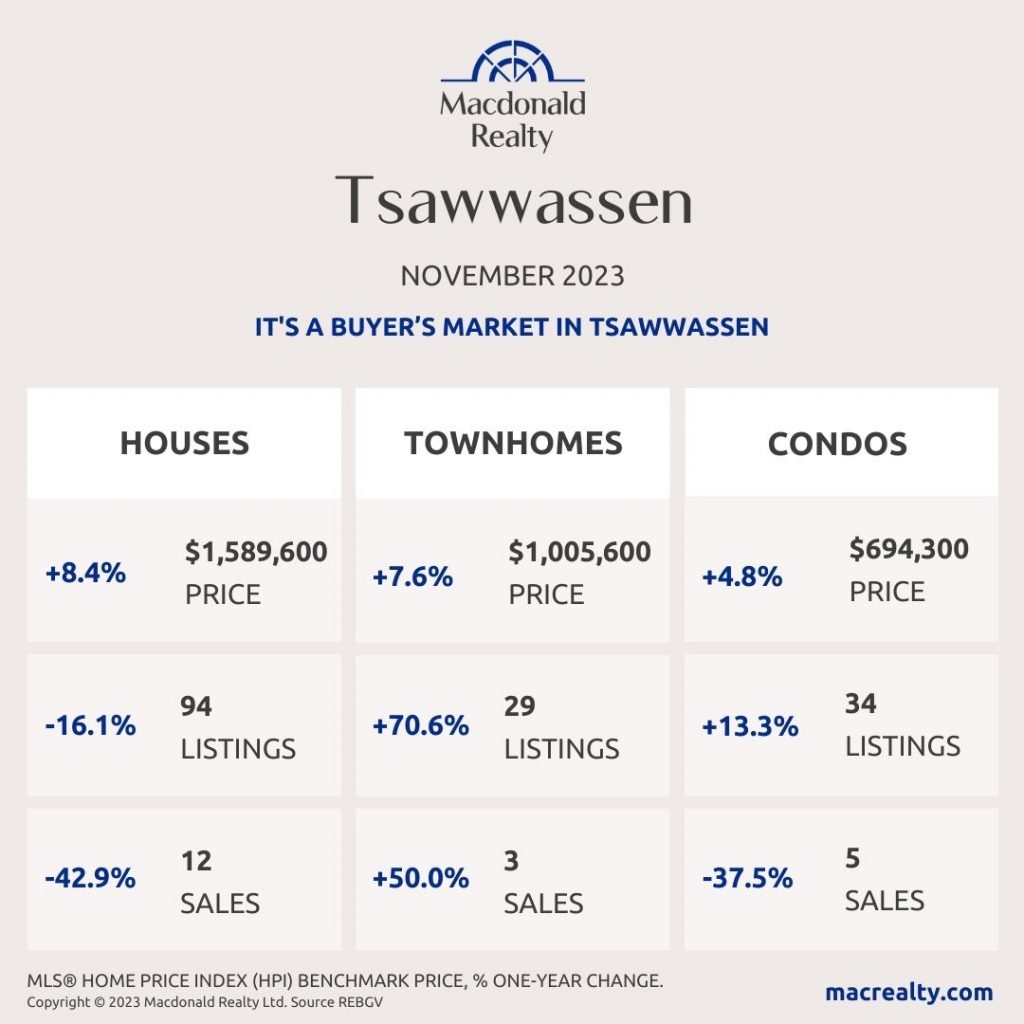
Tsawwassen
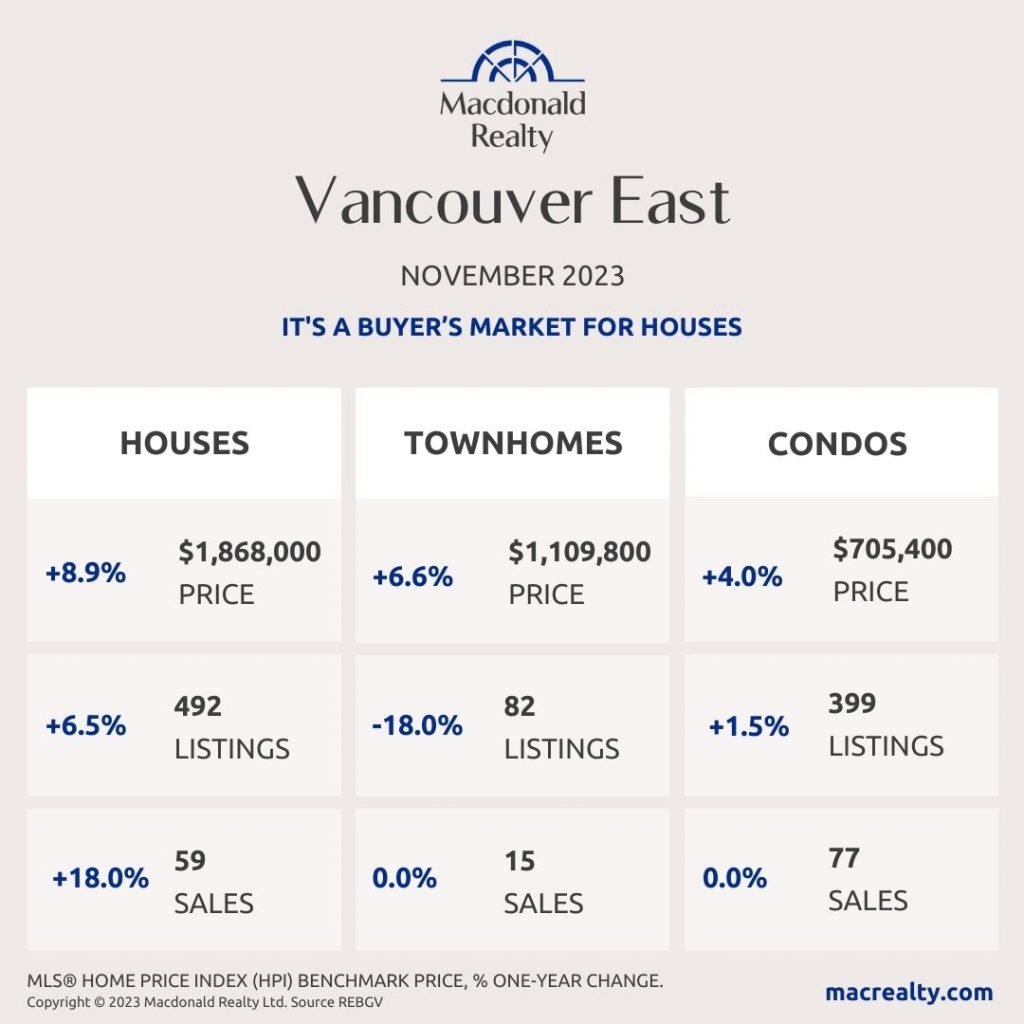
Vancouver East
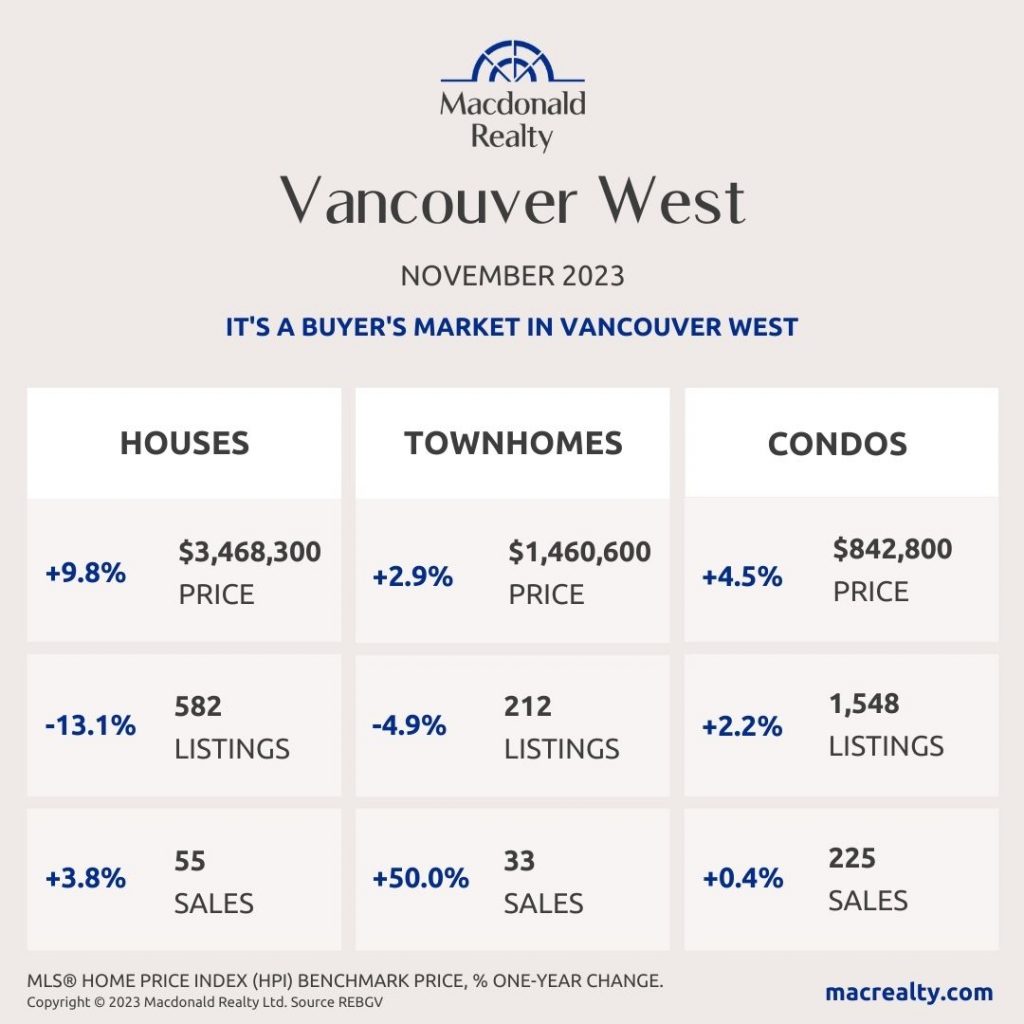
Vancouver West
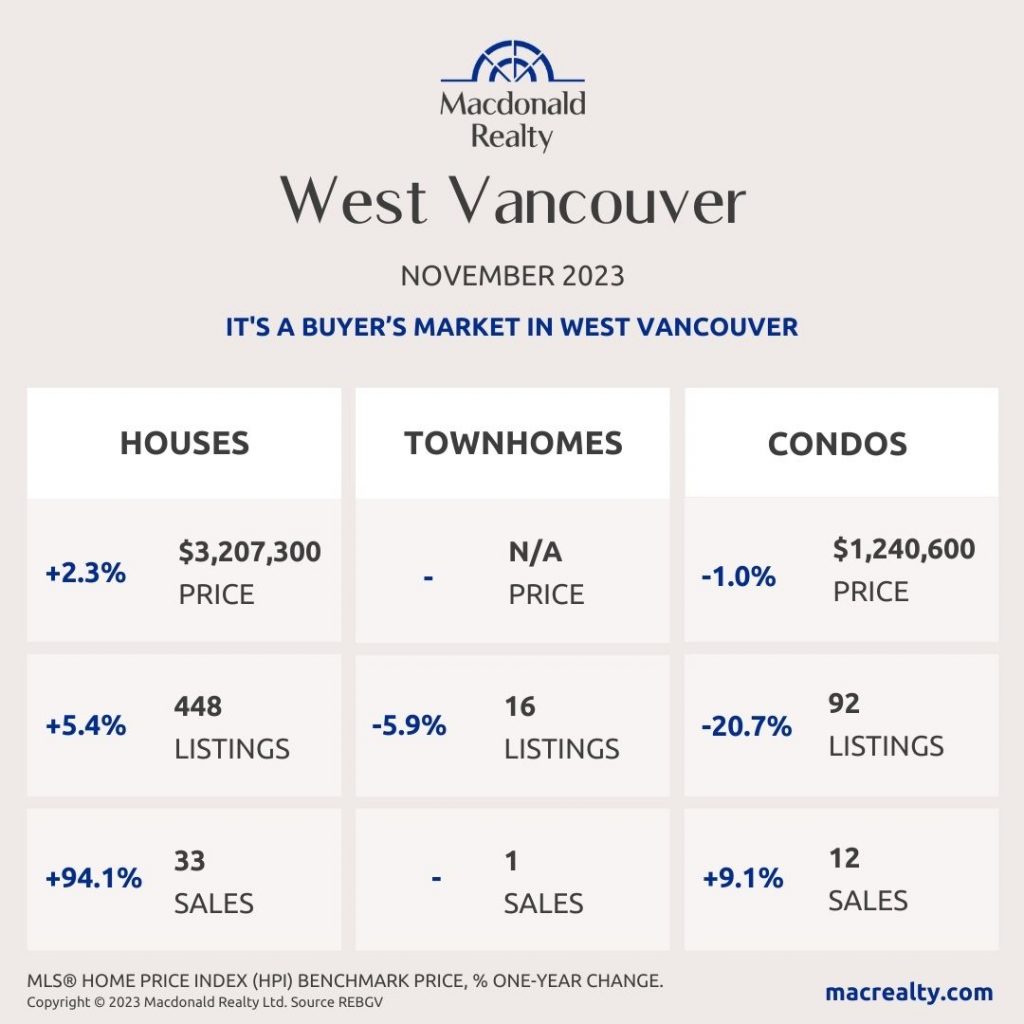
West Vancouver
Looking for more information about the real estate market in specific neighbourhoods in the Greater Vancouver?
Macdonald Realty has offices across the Greater Vancouver. Please email [email protected] or call 1-877-278-3888 to be matched with a REALTOR® working in your area.
MLS® Home Price Index (HPI) Benchmark Price
Average and median home prices are often misinterpreted, are affected by change in the mix of homes sold, and can swing dramatically from month to month (based on the types and prices of properties that sold in a given month). The MLS® HPI overcomes these shortcomings and uses the concept of a benchmark home, a notional home with common attributes of typical homes in a defined area. Visit www.housepriceindex.ca for more information.
This blog post is based on market data provided by the Real Estate Board of Greater Vancouver (REBGV) www.rebgv.org