by Macrealty Marketing Team | Dec 5, 2023 | Market Updates
November 2023 – Lower Mainland Monthly Update
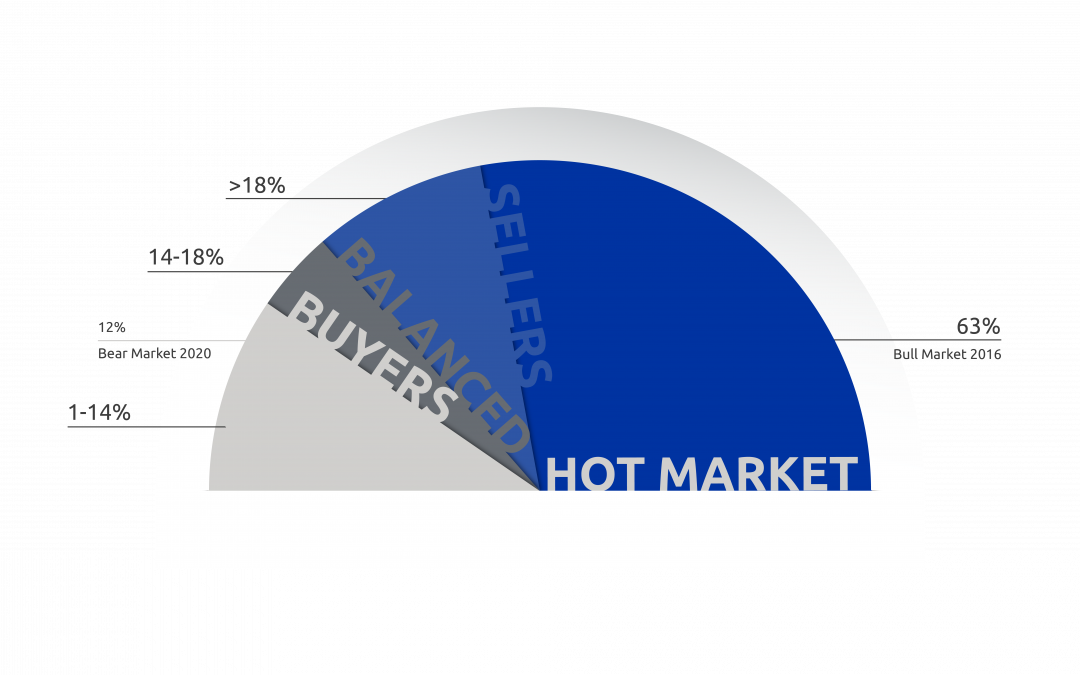
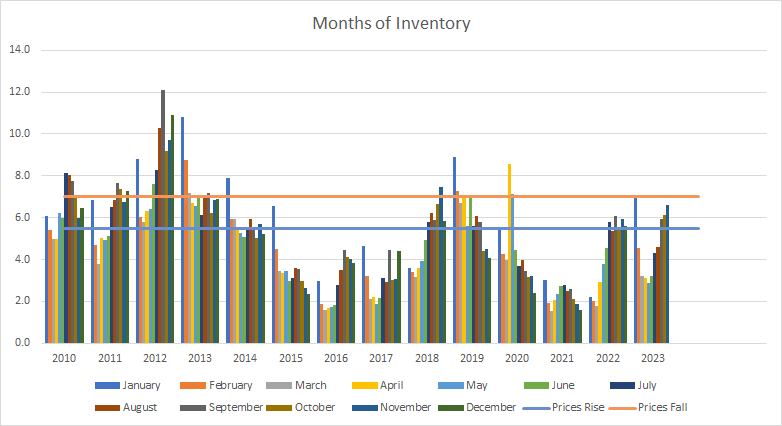
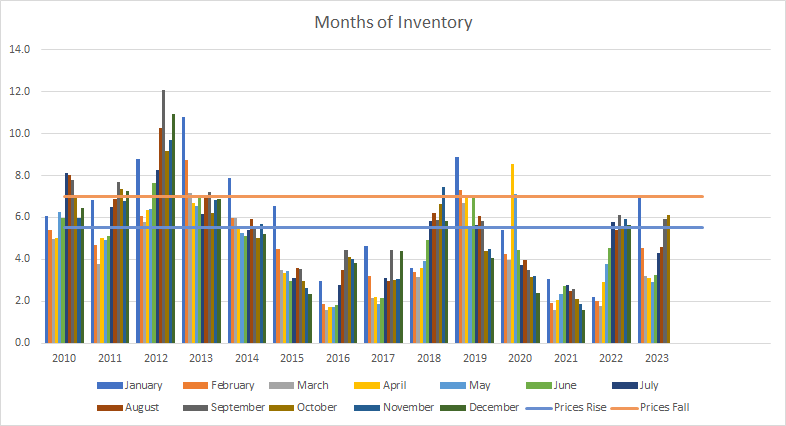
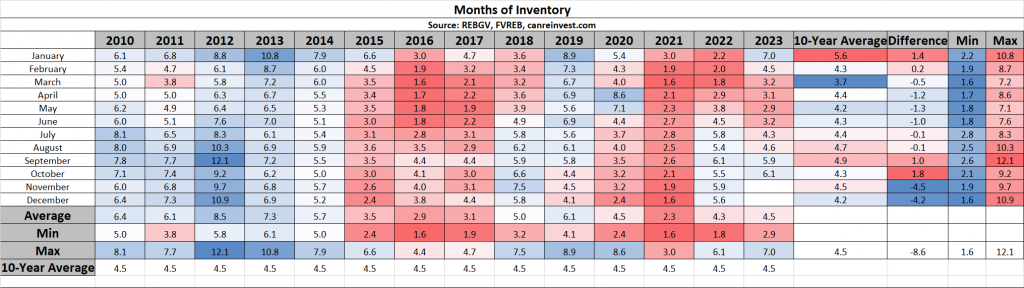
At 6.6 Months of Inventory, Prices have traditionally softened.
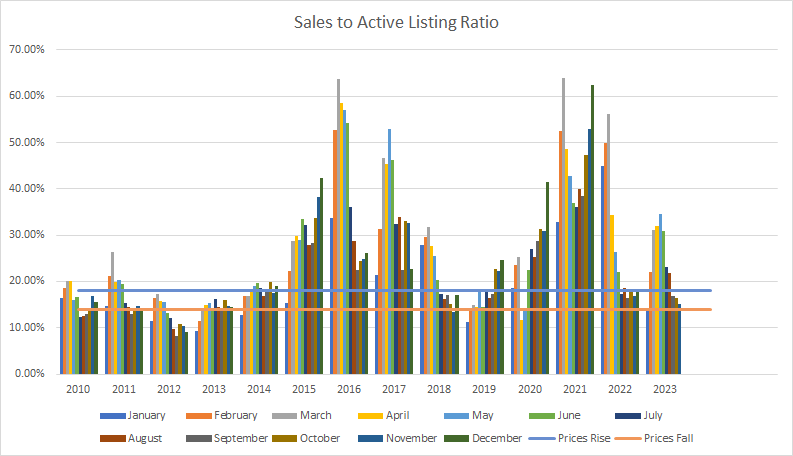
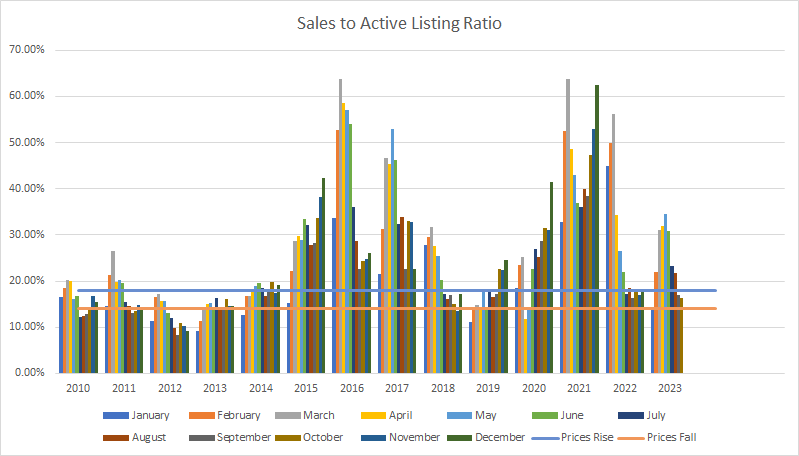
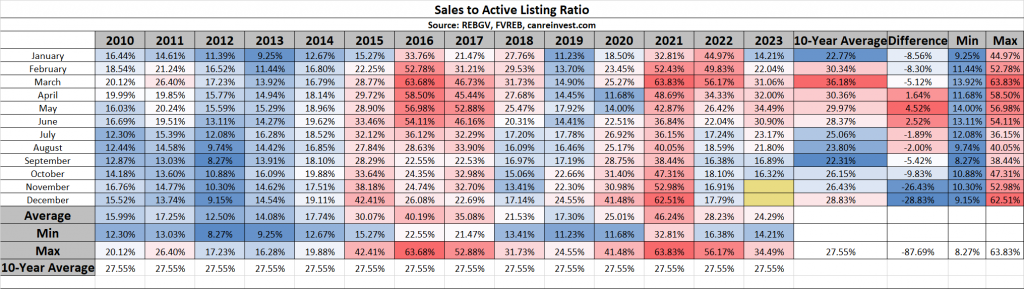
The most reliable indicator of market prices is the Sales to Active Listings Ratio (SAL). This is the ratio between the number of sales in a given month and the number of active listings at month-end.
In hotter markets in BC, a long-term analysis has shown that prices will usually act in the following ways:
- 7+ Months of Inventory (Under 14% SAL): Prices will likely DECLINE
- 5 – 7 Months of Inventory (14% – 18% SAL): Prices will likely be STABLE
- Less than 5.5 Months of Inventory (Over 18% SAL): Prices will likely RISE
Visit this link to learn more about house prices and inventory.
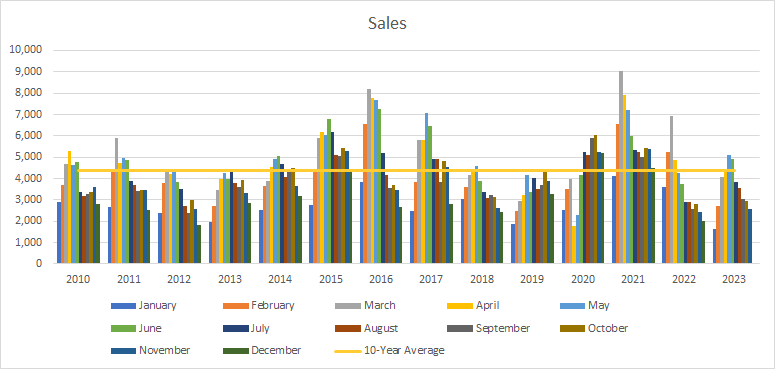
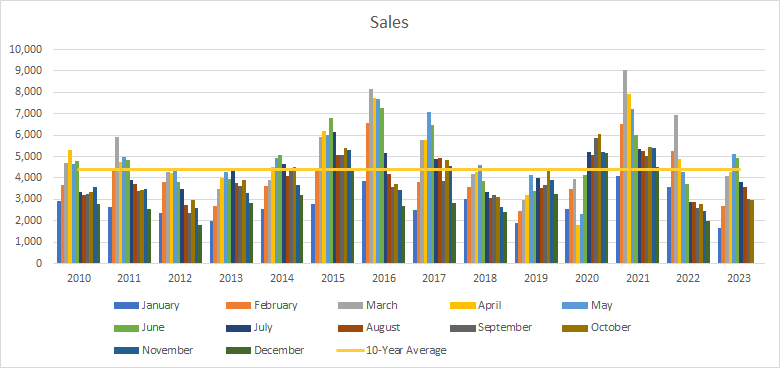
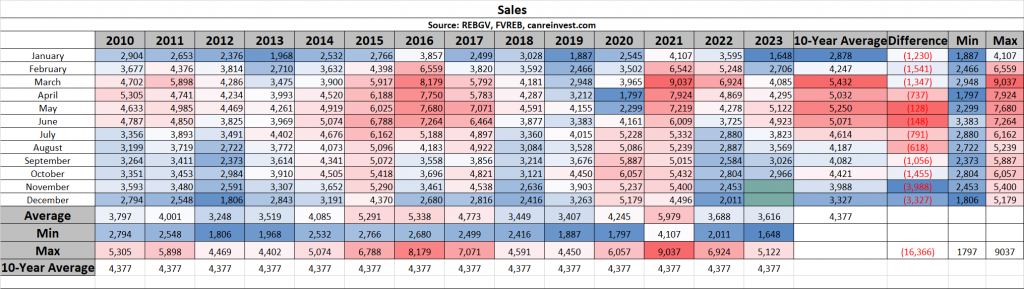
Sales
Sales (2,593) were about the same as a year ago (2,453), and were 25% below the 10-year average (3,988).
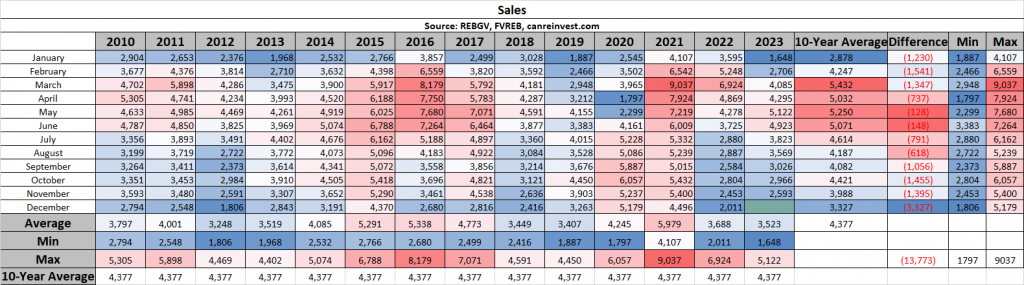
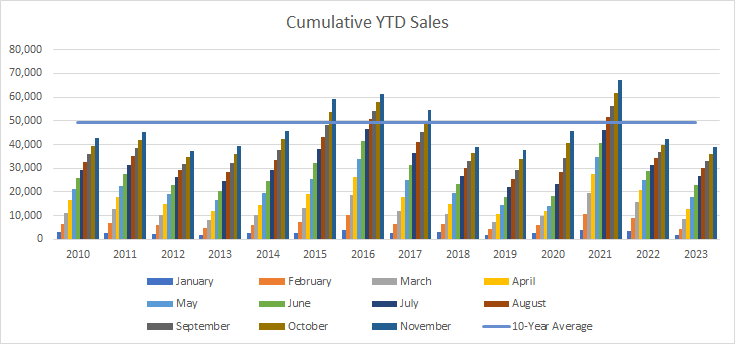
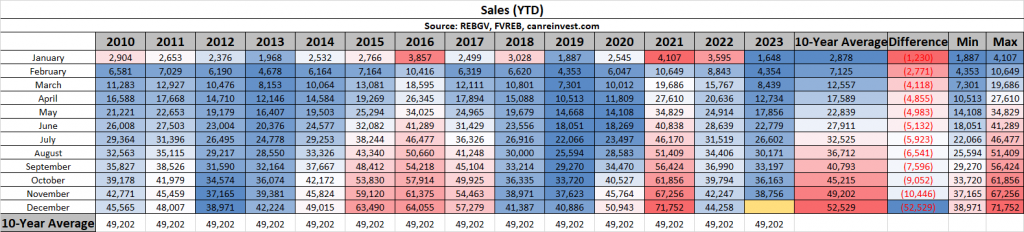
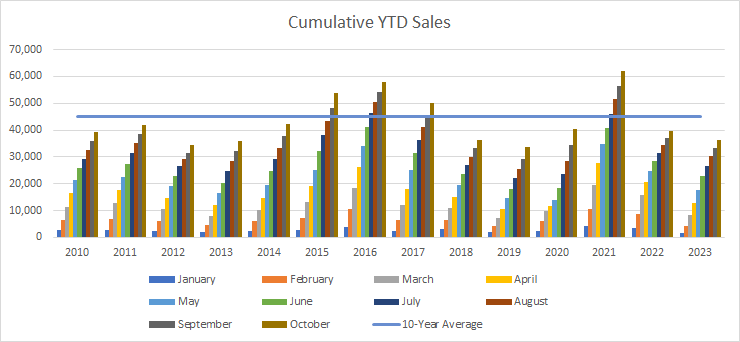
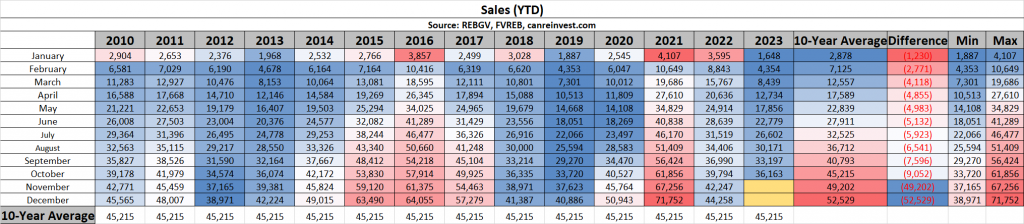
Cumulative Year-to-date Sales
2023 will likely end up as one of the slowest years in recent memory as sales (38,756) remain far below the 10-year average (49,202).
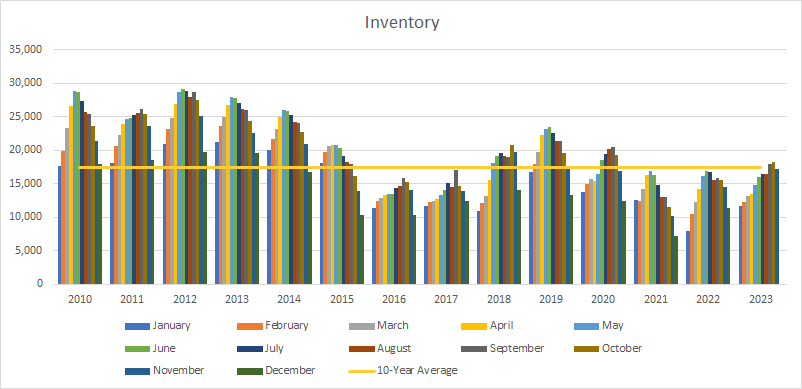
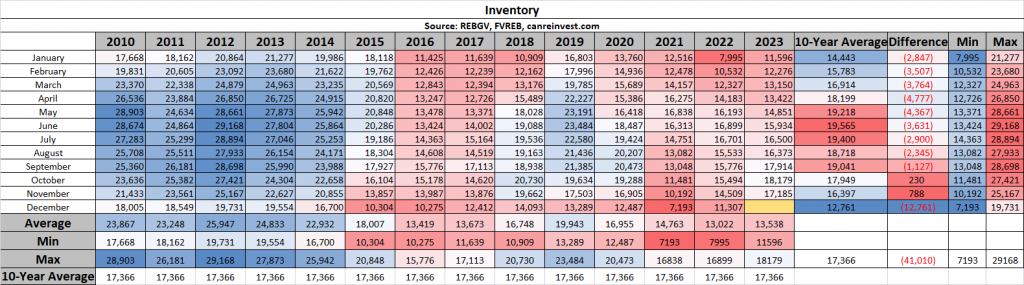
Inventory
Inventory (17,185 active listings) fell slightly from the previous month, but remain above the 10-year average for the first time since Nov 2020 (16,397 average).e).
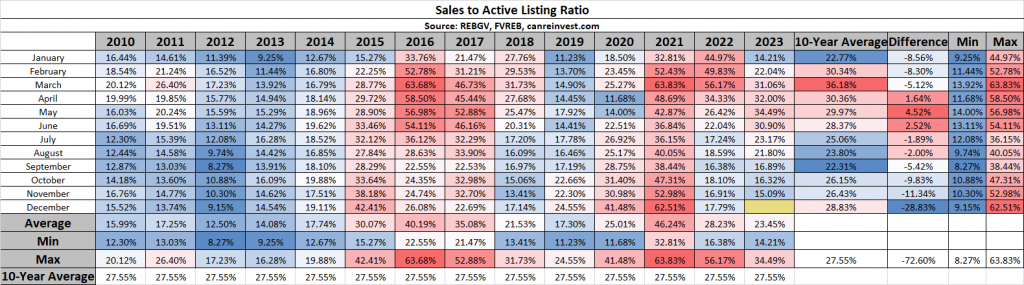
Sales to Active Listings
Low sales and rising inventory have the Sales to Active Listing Ratio at 15%, indicating softening prices.
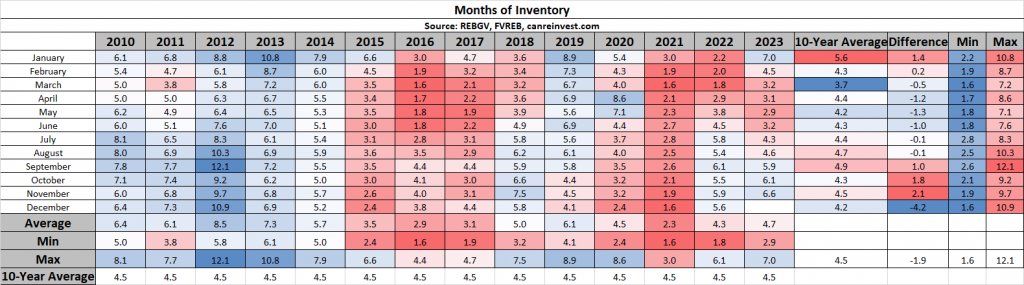
Months of Inventory
Similarly, Months of Inventory rose to 6.6 MOI, indicating a slow market and softening prices.
Want to learn more about these stats or discuss your move to Macdonald Realty?
Check out careersinbcrealestate.com to connect today!
by Macrealty Marketing Team | Dec 4, 2023 | Market Updates
The Fraser Valley real estate market continues to cool heading into the holiday season as buyers and sellers maintain the holding pattern seen over the latter half of this year.
The Fraser Valley Real Estate Board recorded 891 transactions on its Multiple Listing Service® (MLS®) in November, a drop of 8 per cent from the previous month, representing the 9th slowest November in a decade.
At 2,030 new listings also fell again, decreasing by 20 per cent from October and by 43 per cent since peaking in May at 3,533.
“As we head into the holiday season, buyers and sellers are busy with other priorities and will most likely continue to wait on the sidelines,” said Narinder Bains, Chair of the Fraser Valley Real Estate Board. “We anticipate this holding pattern, defined by slow sales and declining new listings, will continue through the winter months until we see some downward movement in interest rates.”
Active listings in November were 6,254, down by 5 per cent over last month and up by 17 per cent over November 2022. The sales-to-active listings ratio was 14 per cent, creating balanced conditions in the overall market. Detached houses are in balanced market territory at 12 per cent, while both townhomes and apartments remain in seller’s market territory. The market is considered balanced when the ratio is between 12 per cent and 20 per cent.
“With seasonality and high interest rates continuing to dampen sales activity, we expect to see sales slow further into early 2024,” said FVREB CEO Baldev Gill. “However, even a slow market can present opportunities, and buyers would be well-advised to work with a knowledgeable, professional REALTOR® who can provide expert advice and guidance.”
Find all the infographics related to the November Market Statistics by visiting the Facebook Album.
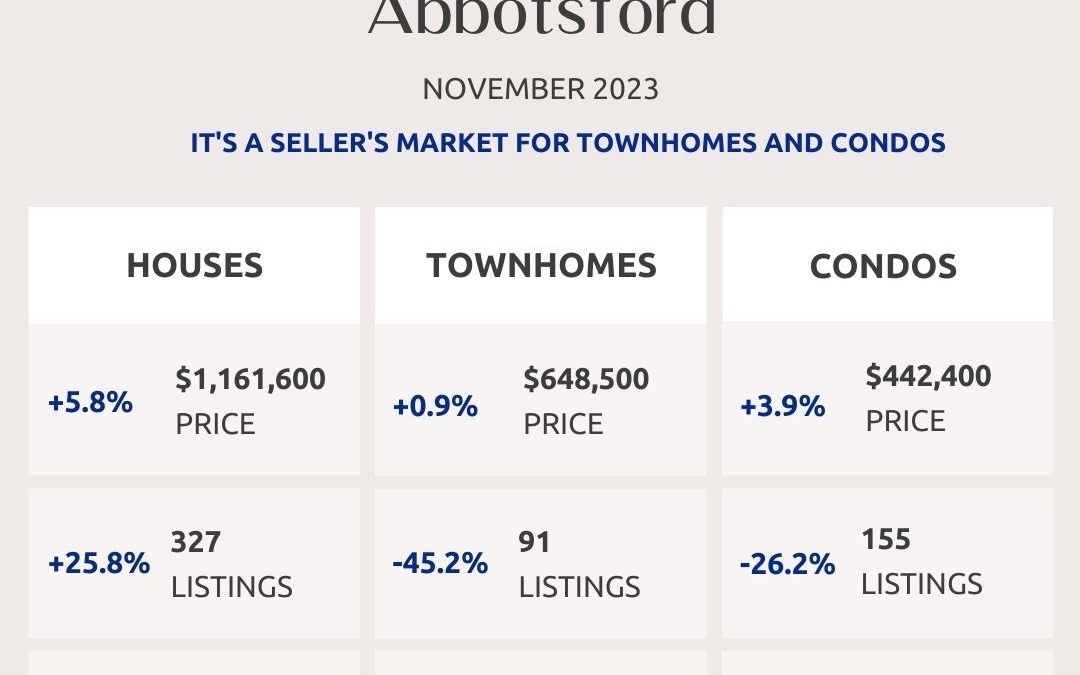
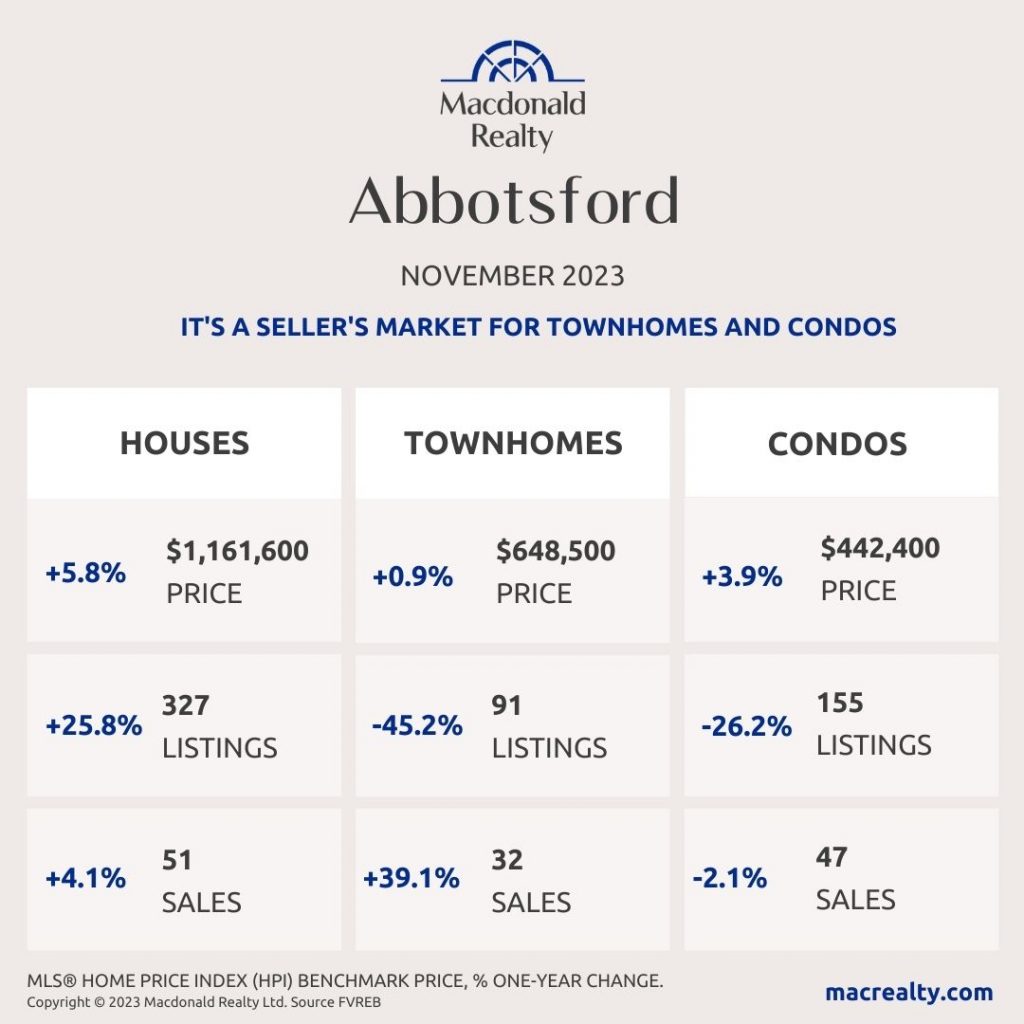
Abbotsford
Cloverdale

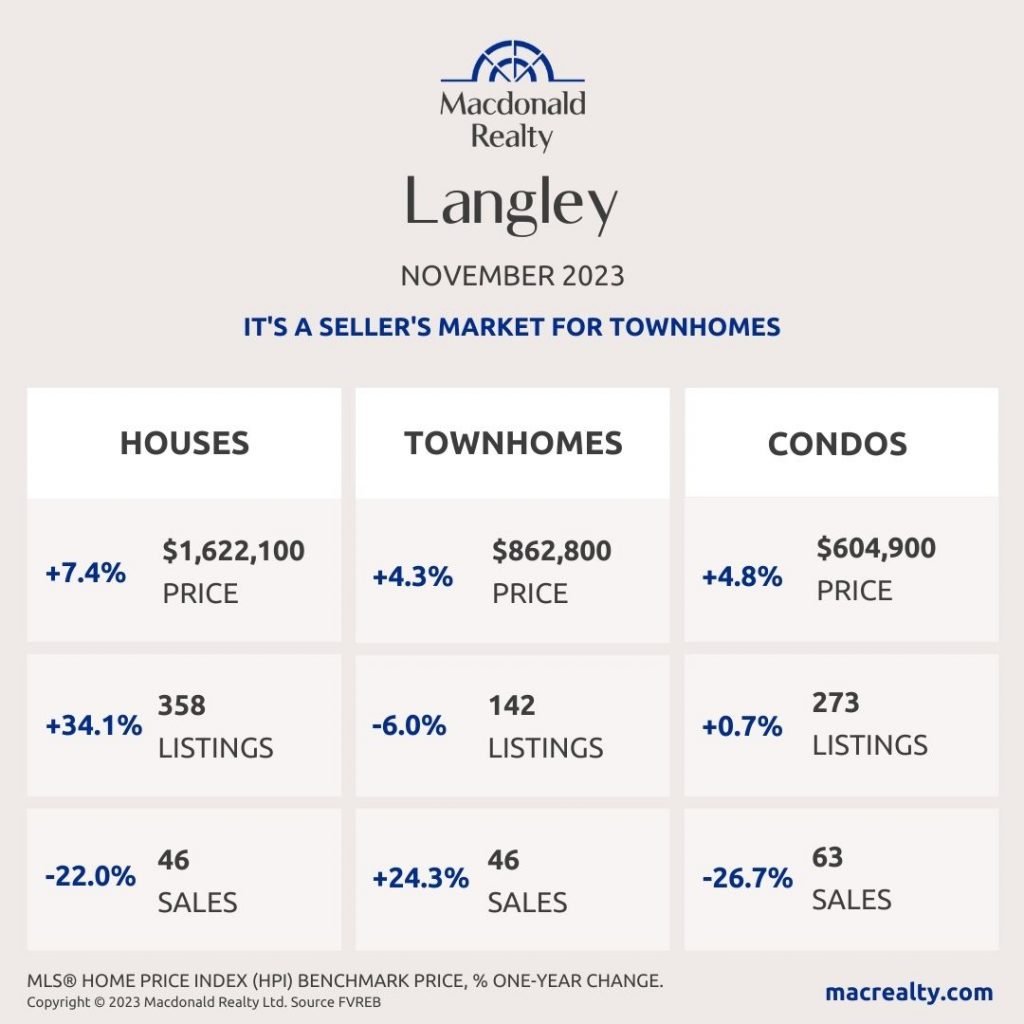
Langley
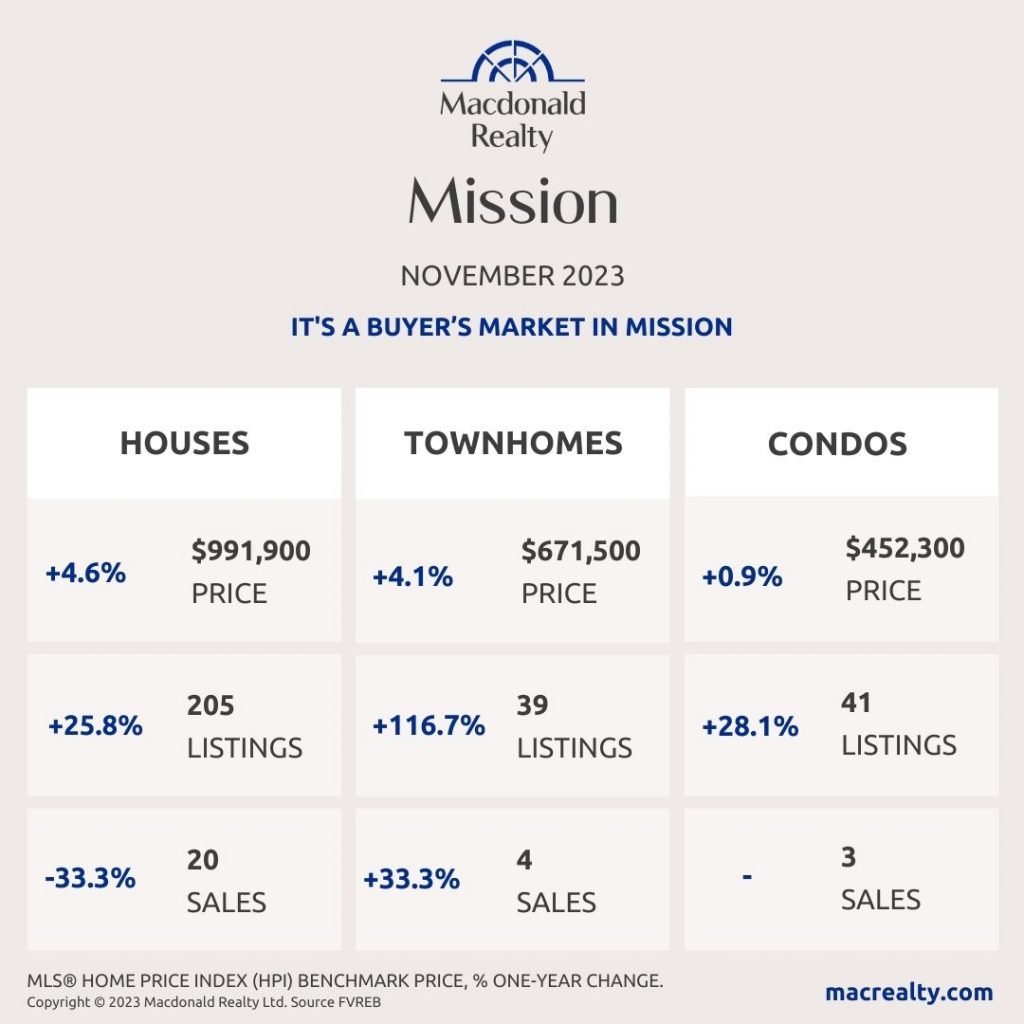
Mission
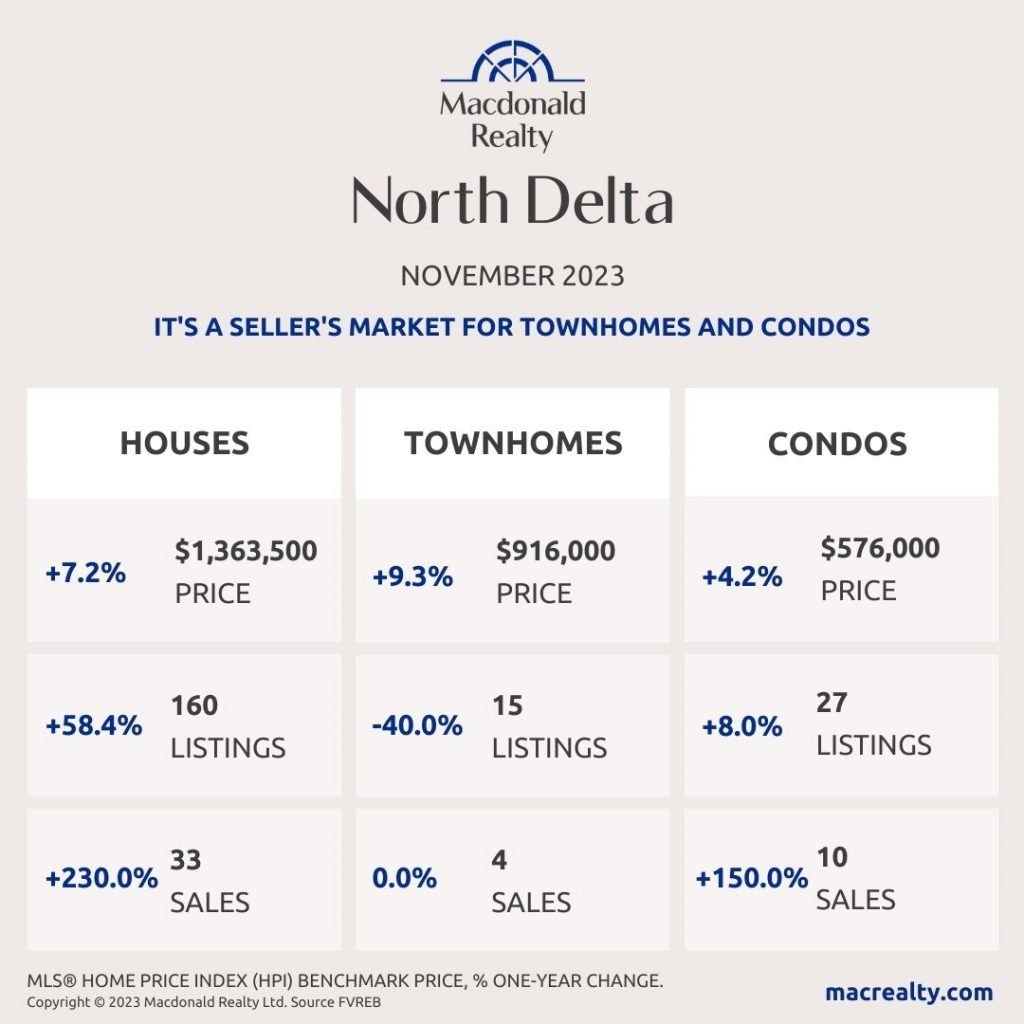
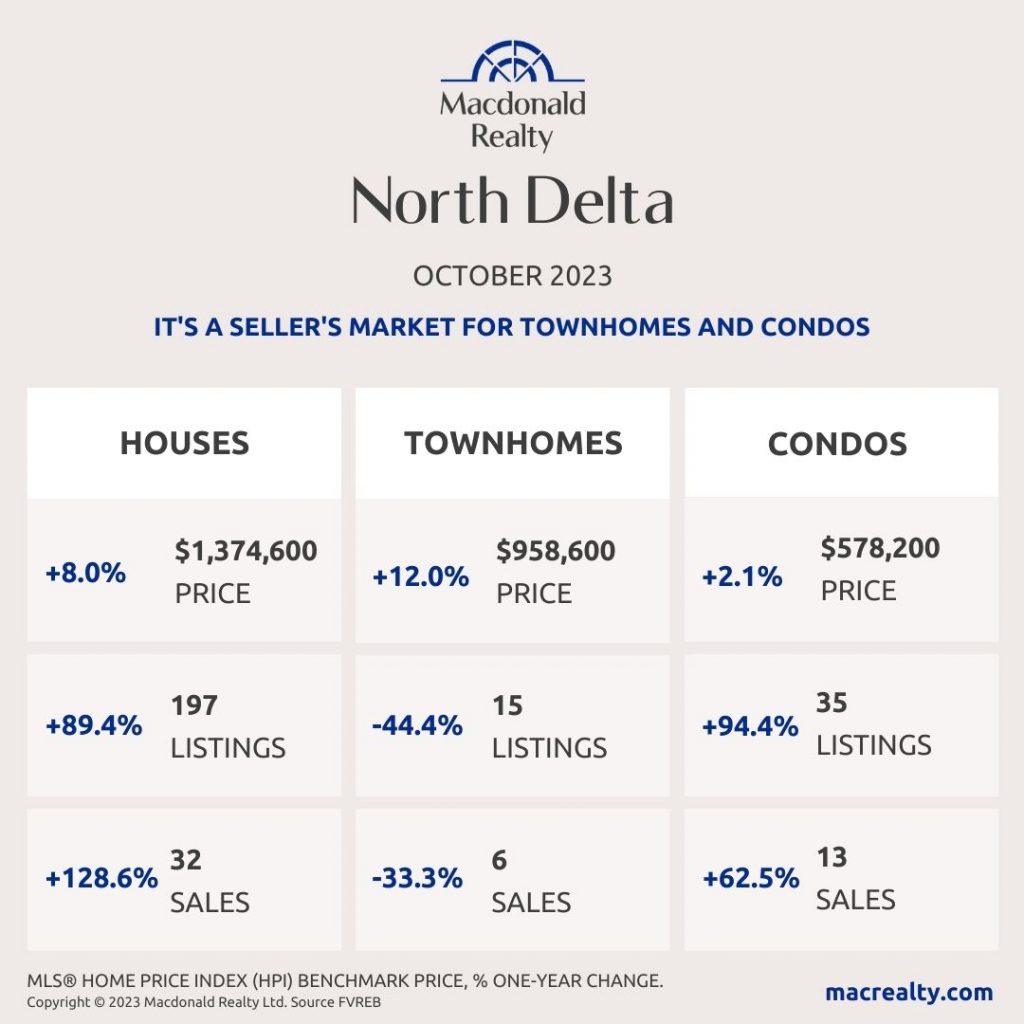
North Delta
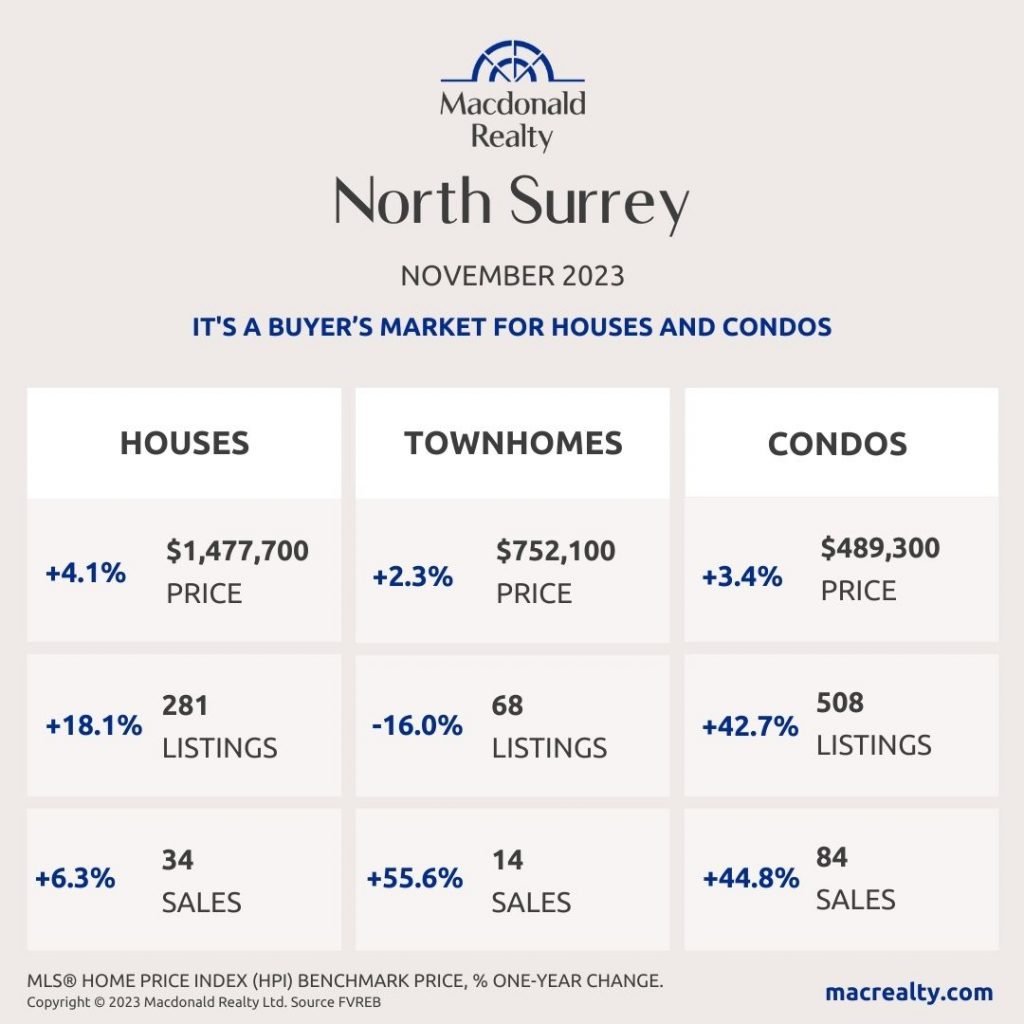
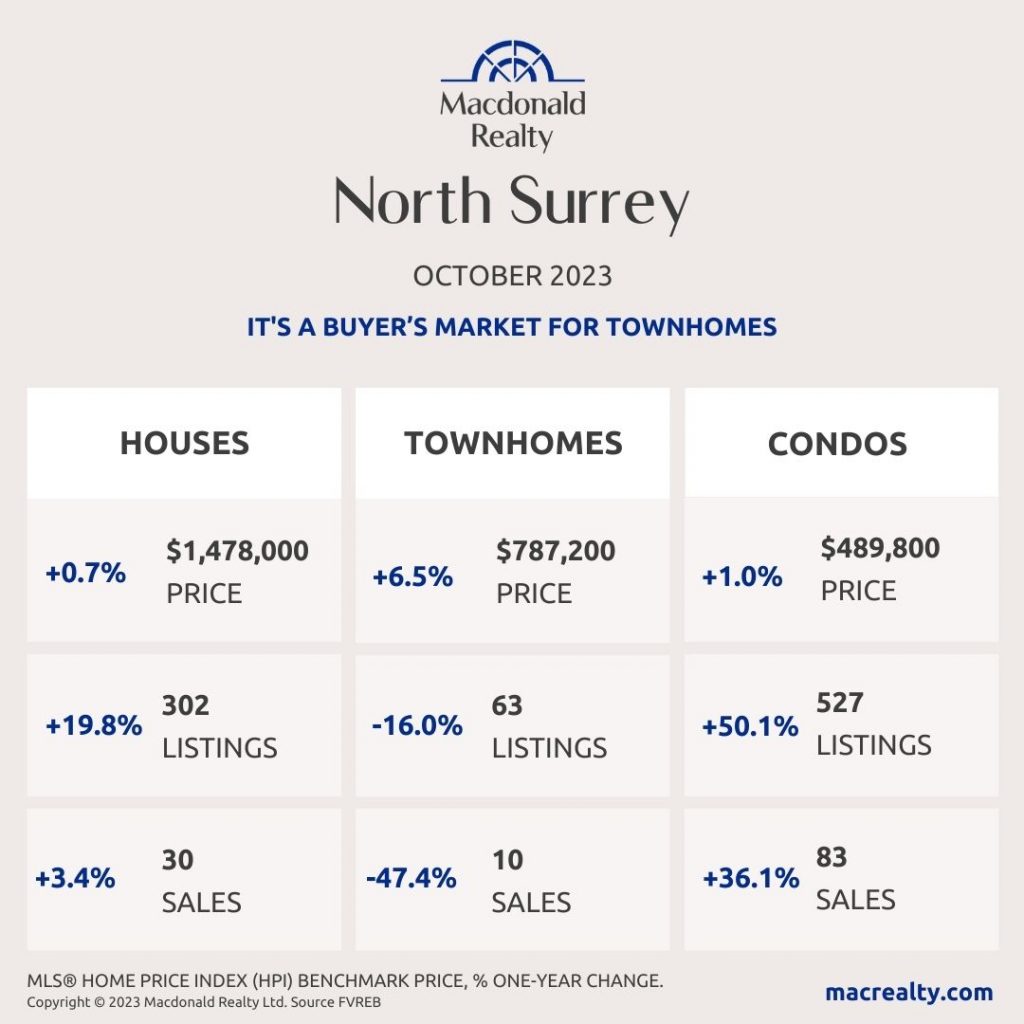
North Surrey
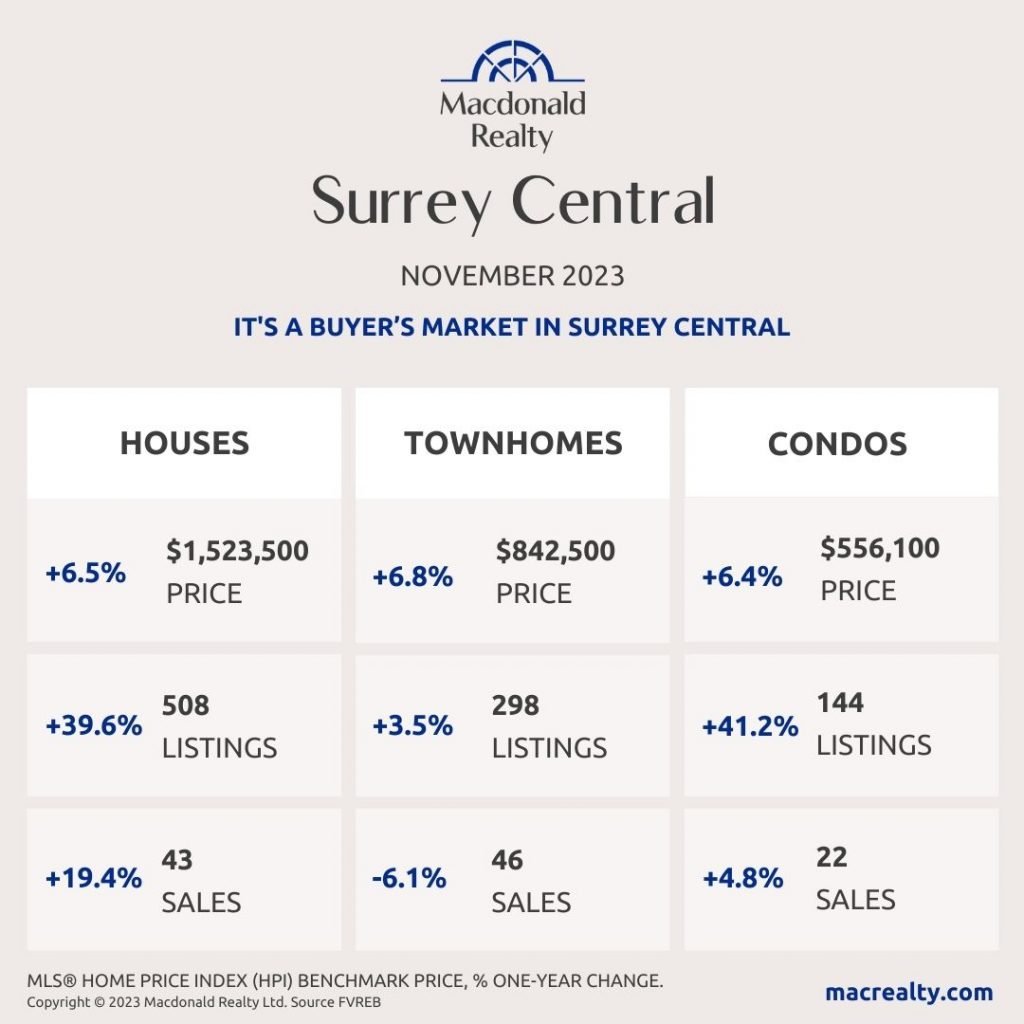
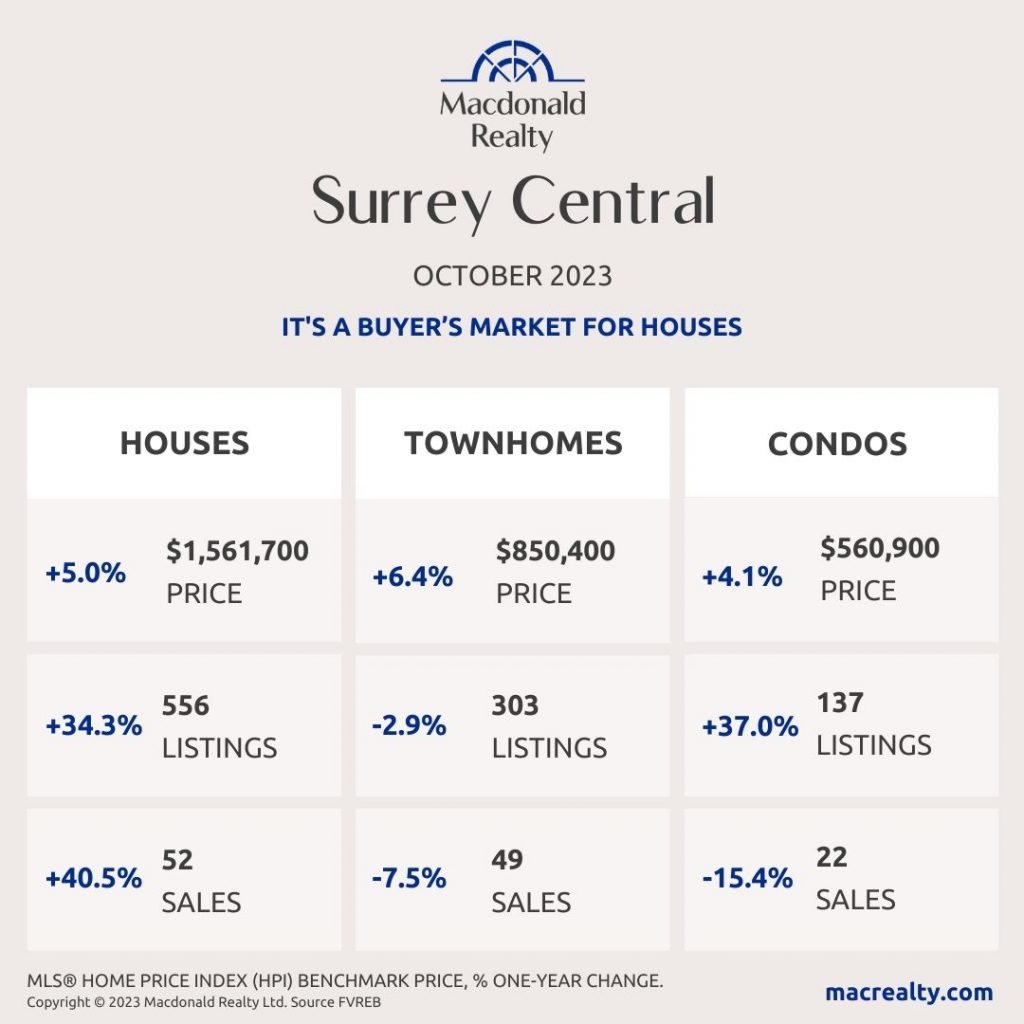
Surrey Central
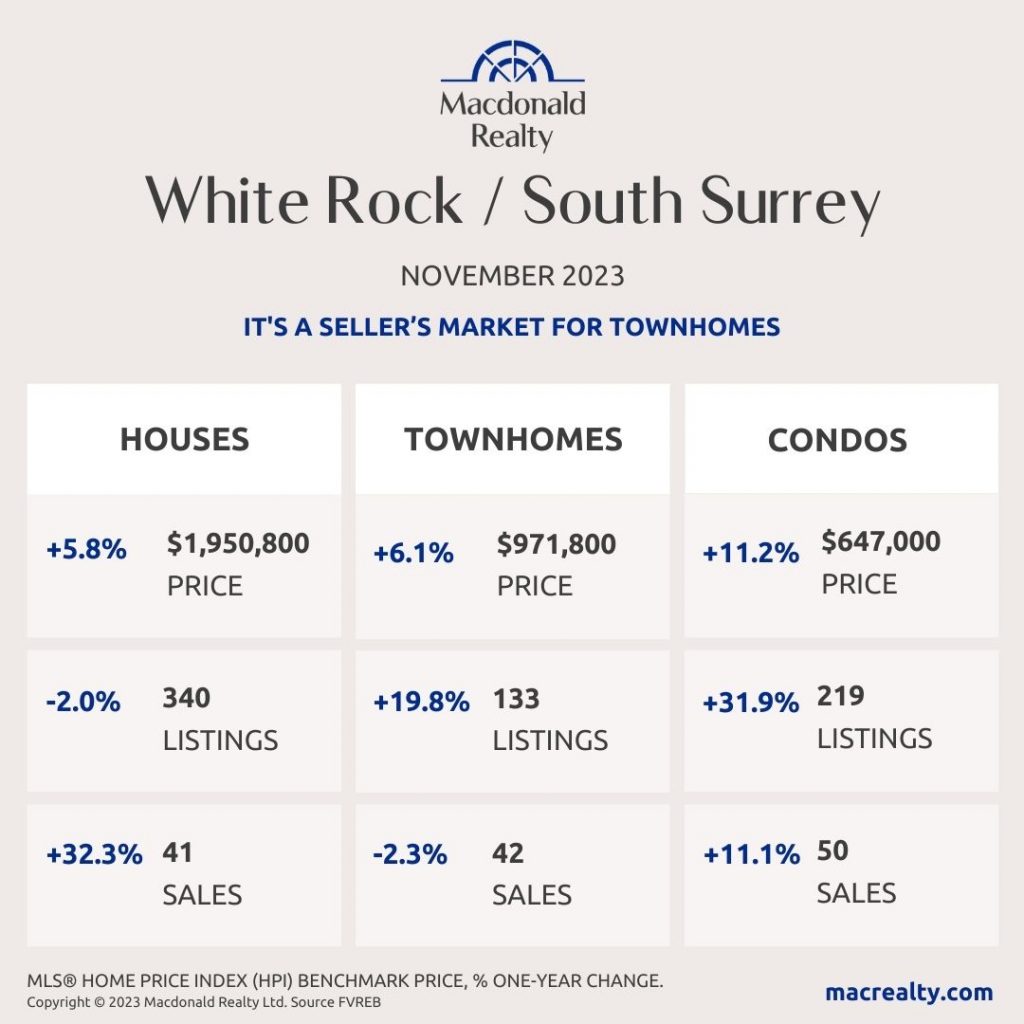
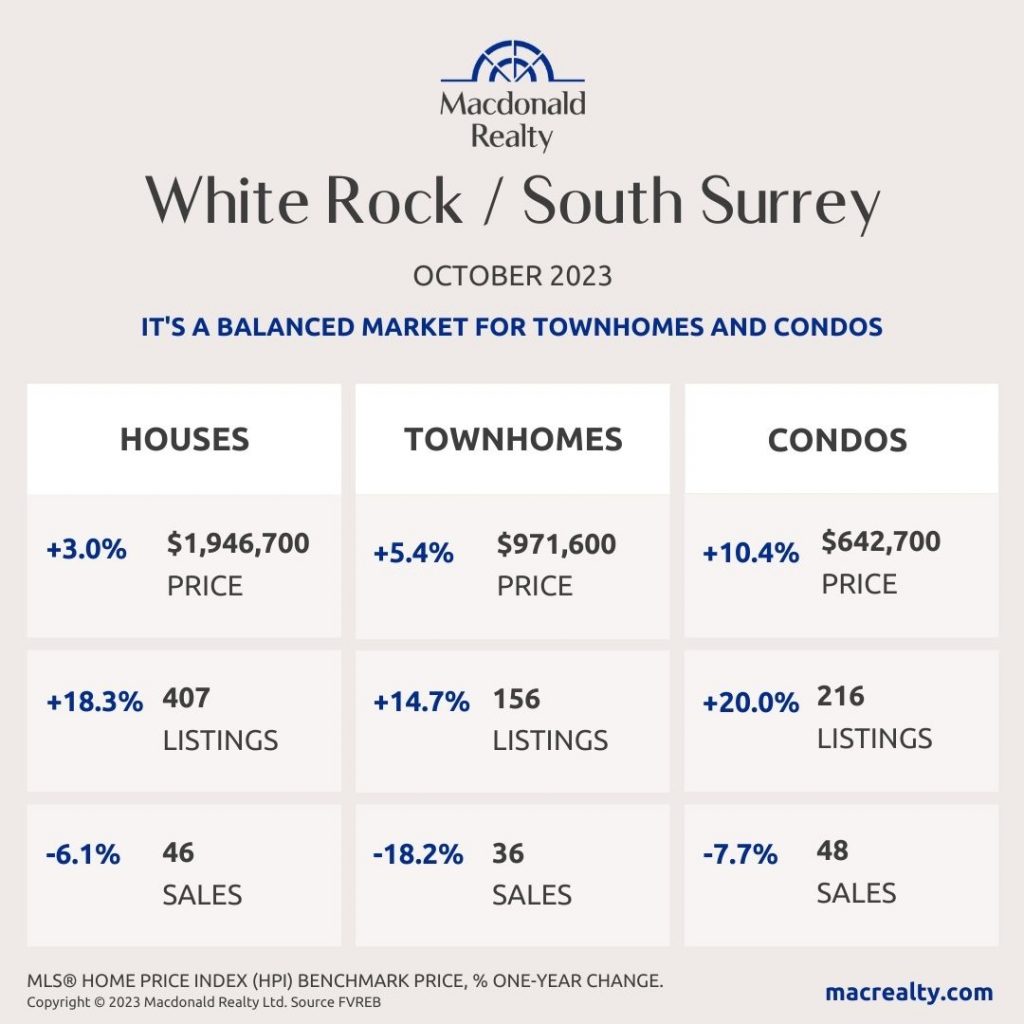
White Rock / South Surrey
Looking for more information about the real estate market in specific neighbourhoods in Surrey, Langley and Fraser Valley?
Macdonald Realty has offices in North Delta, White Rock/South Surrey, and Langley. Please email [email protected] or call 1-877-278-3888 to be matched with a REALTOR® working in your area.
MLS® Home Price Index (HPI) Benchmark Price
Average and median home prices are often misinterpreted, are affected by change in the mix of homes sold, and can swing dramatically from month to month (based on the types and prices of properties that sold in a given month). The MLS® HPI overcomes these shortcomings and uses the concept of a benchmark home, a notional home with common attributes of typical homes in a defined area. Visit www.housepriceindex.ca for more information.
This blog post is based on market data provided by the Fraser Valley Real Estate Board (FVREB) www.fvreb.bc.ca
by Macrealty Marketing Team | Nov 3, 2023 | Market Updates
Property sales and new listings in the Fraser Valley fell again in October as consumers continued to put home buying and selling decisions on hold in the face of elevated interest rates.
The Fraser Valley Real Estate Board recorded 970 transactions on its Multiple Listing Service® (MLS®) in October, a drop of 12 per cent from the previous month and the fourth consecutive decrease since the 12-month high of 1,935 sales recorded in June.
At 2,535, new listings also fell again, decreasing by 11 per cent from September and by 28 per cent since peaking in May at 3,533.
“What we’re seeing in the Fraser Valley and indeed across the province is the impact of sustained high interest rates on the overall market,” said Narinder Bains, Chair of the Fraser Valley Real Estate Board. “This has been the case since the latter half of the year so far, and we anticipate the trend will continue until we
start to see some downward movement in the policy rate.”
Active listings in October were 6,580, up by less than 1 per cent over last month and up by 17 per cent over October 2022. The sales-to-active listings ratio was 15 per cent, creating balanced conditions in the overall market, with detached houses dipping into buyers’ market territory at 12 per cent. The market is considered balanced when the ratio is between 12 per cent and 20 per cent.
“As the market continues to adjust to the new rate realities, pricing and financing strategies become critical,” said FVREB CEO, Baldev Gill. “A knowledgeable professional REALTOR®, armed with the latest comparative market data and neighbourhood insights, can be the key to determining optimal market timing.”
Find all the infographics related to the October Market Statistics by visiting the Facebook Album.
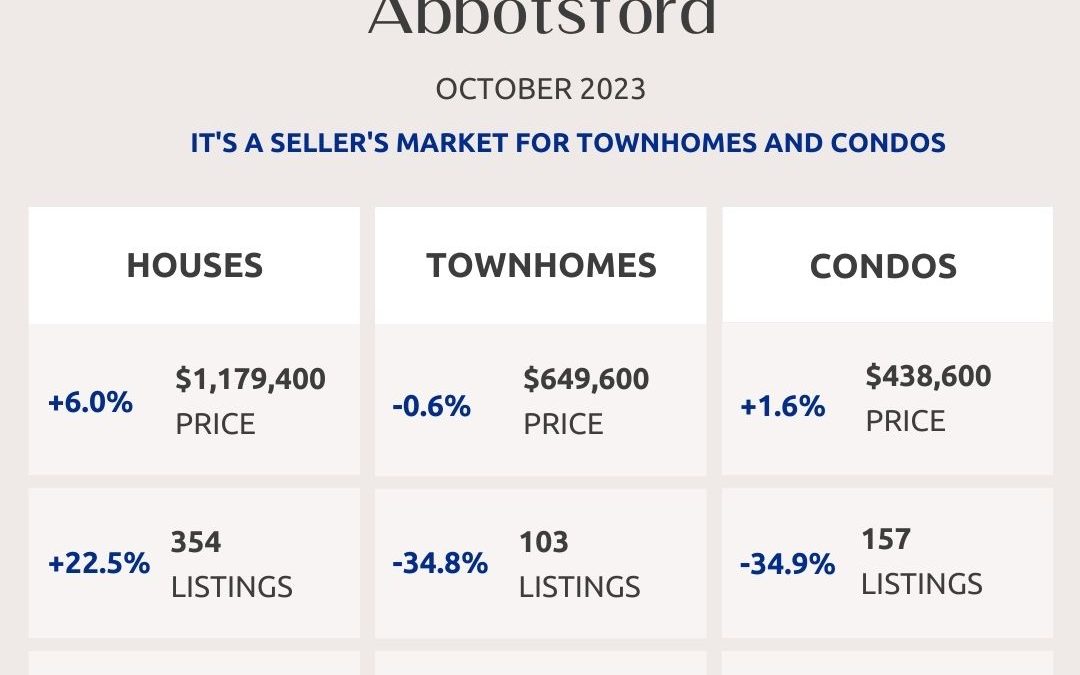
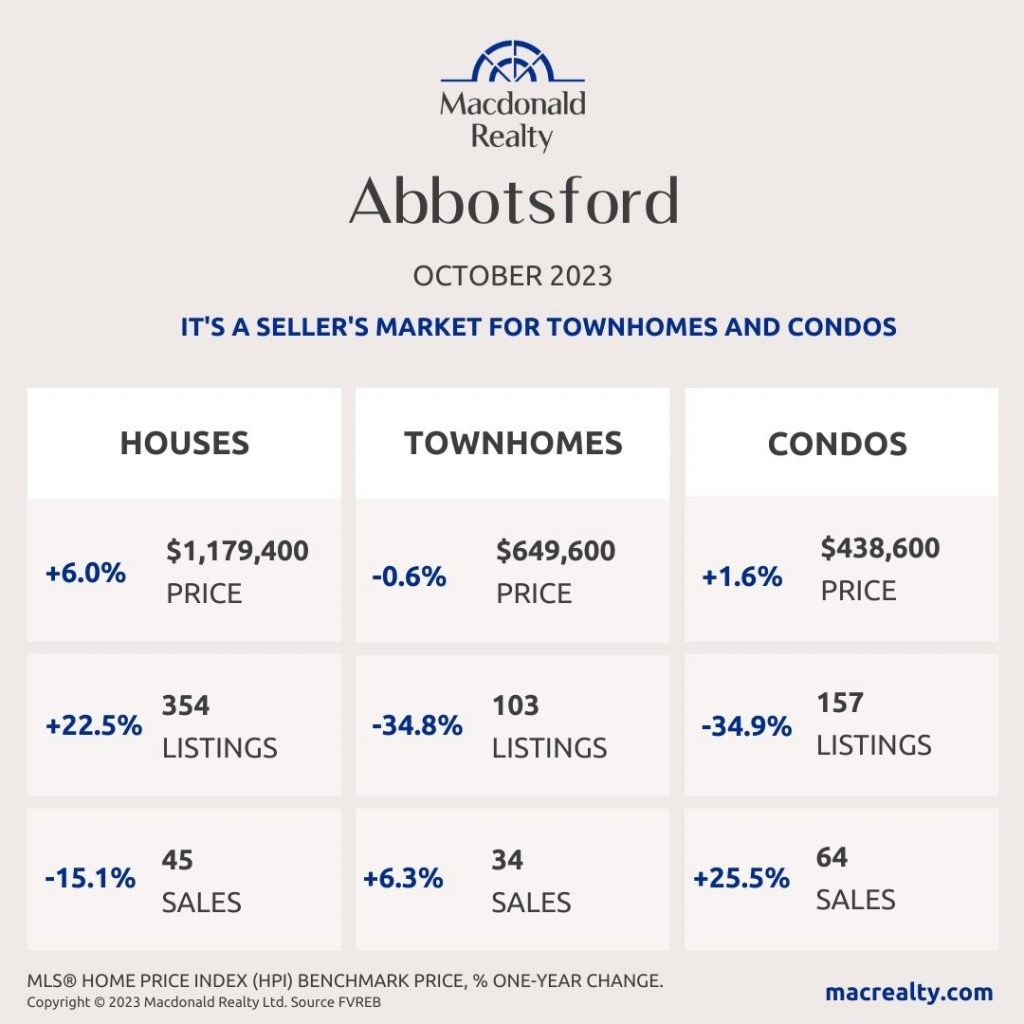
Abbotsford
Cloverdale

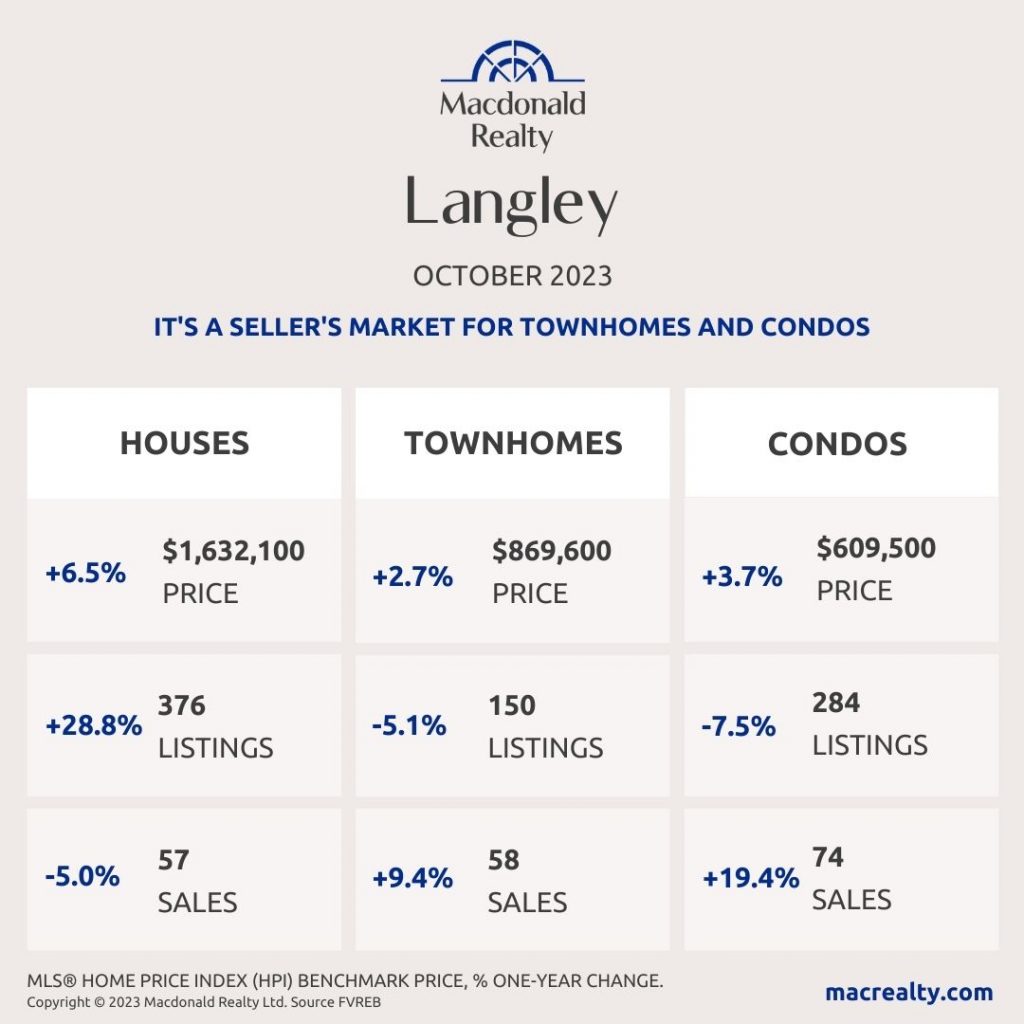
Langley
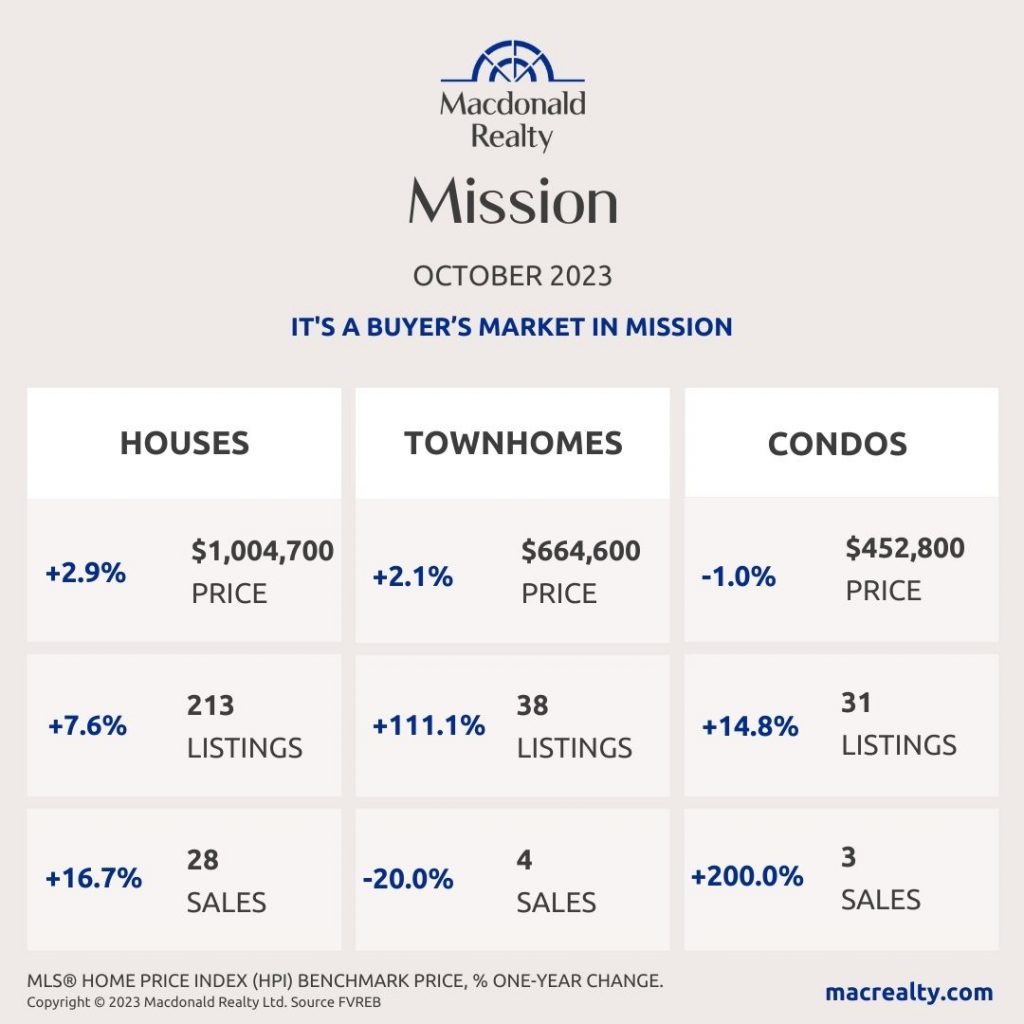
Mission
North Delta
North Surrey
Surrey Central
White Rock / South Surrey
Looking for more information about the real estate market in specific neighbourhoods in Surrey, Langley and Fraser Valley?
Macdonald Realty has offices in North Delta, White Rock/South Surrey, and Langley. Please email [email protected] or call 1-877-278-3888 to be matched with a REALTOR® working in your area.
MLS® Home Price Index (HPI) Benchmark Price
Average and median home prices are often misinterpreted, are affected by change in the mix of homes sold, and can swing dramatically from month to month (based on the types and prices of properties that sold in a given month). The MLS® HPI overcomes these shortcomings and uses the concept of a benchmark home, a notional home with common attributes of typical homes in a defined area. Visit www.housepriceindex.ca for more information.
This blog post is based on market data provided by the Fraser Valley Real Estate Board (FVREB) www.fvreb.bc.ca
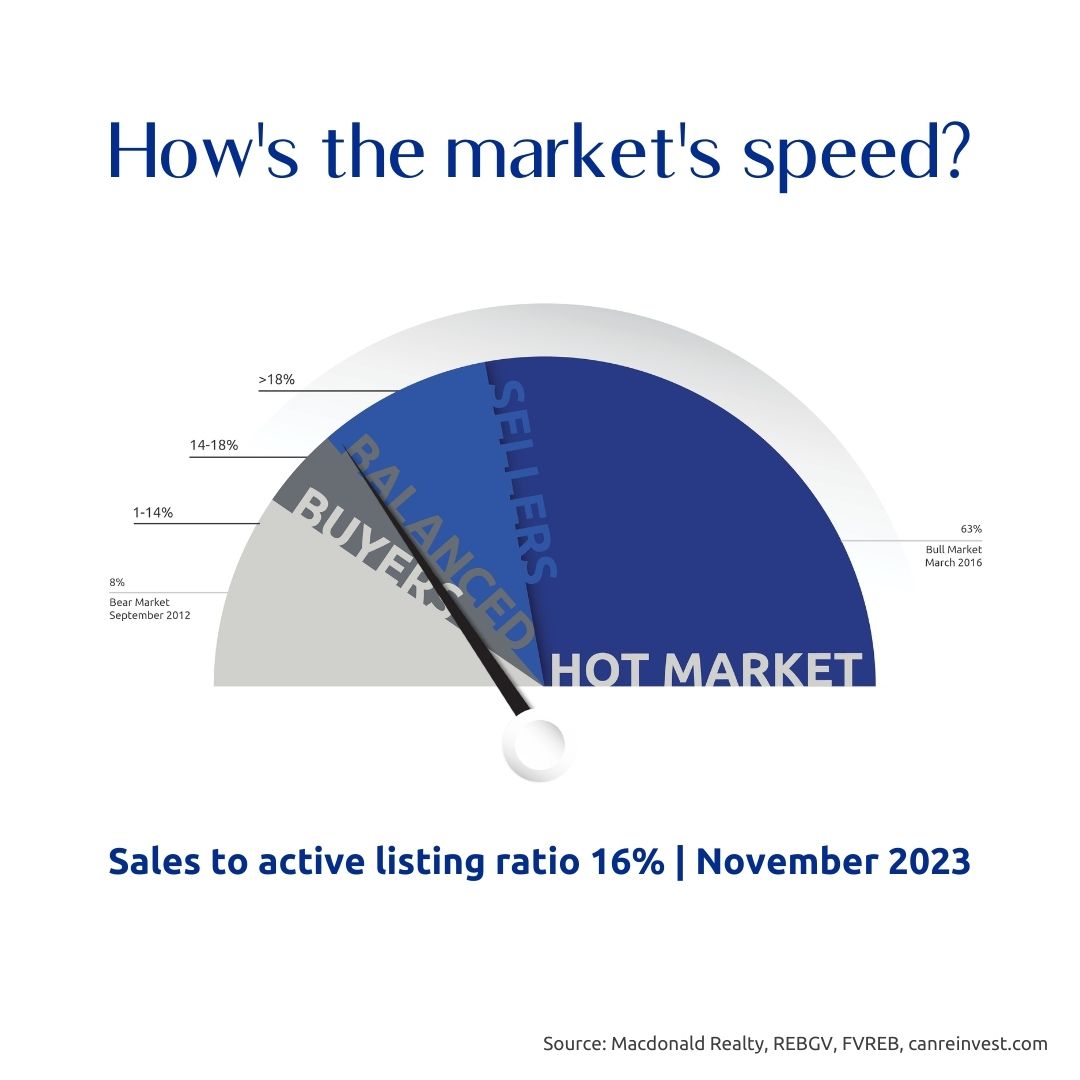
by Macrealty Marketing Team | Nov 2, 2023 | Market Updates
November 2023 – Lower Mainland Monthly Update
At 6.1 Months of Inventory, Prices are expected to Remain Flat.
The most reliable indicator of market prices is the Sales to Active Listings Ratio (SAL). This is the ratio between the number of sales in a given month and the number of active listings at month-end.
In hotter markets in BC, a long-term analysis has shown that prices will usually act in the following ways:
- 7+ Months of Inventory (Under 14% SAL): Prices will likely DECLINE
- 5 – 7 Months of Inventory (14% – 18% SAL): Prices will likely be STABLE
- Less than 5.5 Months of Inventory (Over 18% SAL): Prices will likely RISE
Visit this link to learn more about house prices and inventory.
Sales
Sales (2,966) were 5% higher than a year ago (2,804), and were 30% below the 10-year average (4,082).
Cumulative Year-to-date Sales
2023 continues to be slower as sales (36,163) remain below the 10-year average (45,215).
Inventory
Inventory (18,179 active listings) increased slightly from the previous month, and are now above the 10-year average for the first time since Nov 2020 (19,041 average).


Sales to Active Listings
Low sales but modest inventory kept the Sales to Active Listing Ratio at 16%, indicating flat prices.
Months of Inventory
Similarly, Months of Inventory rose to 6.1 MOI, indicating a balanced market and flat prices.
Want to learn more about these stats or discuss your move to Macdonald Realty?
Check out careersinbcrealestate.com to connect today!