by Macrealty Marketing Team | Feb 8, 2023 | Market Updates
Here are the latest real estate market statistics from Macdonald Realty on Okanagan listings and sales in January 2023.
Find the infographics by visiting the
Facebook Album.
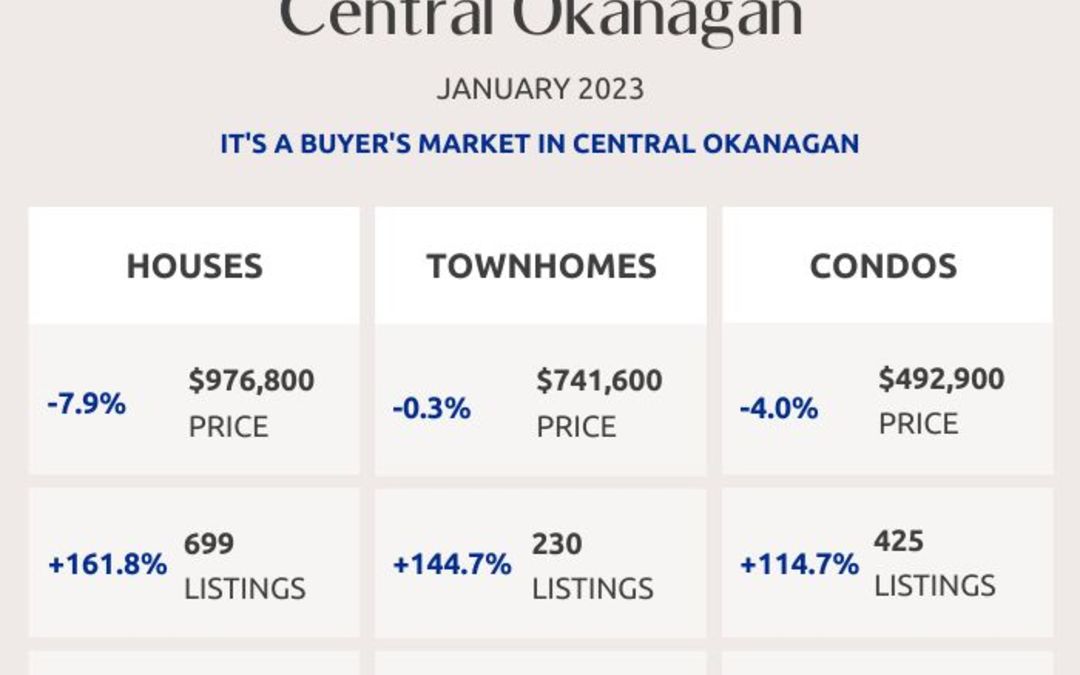
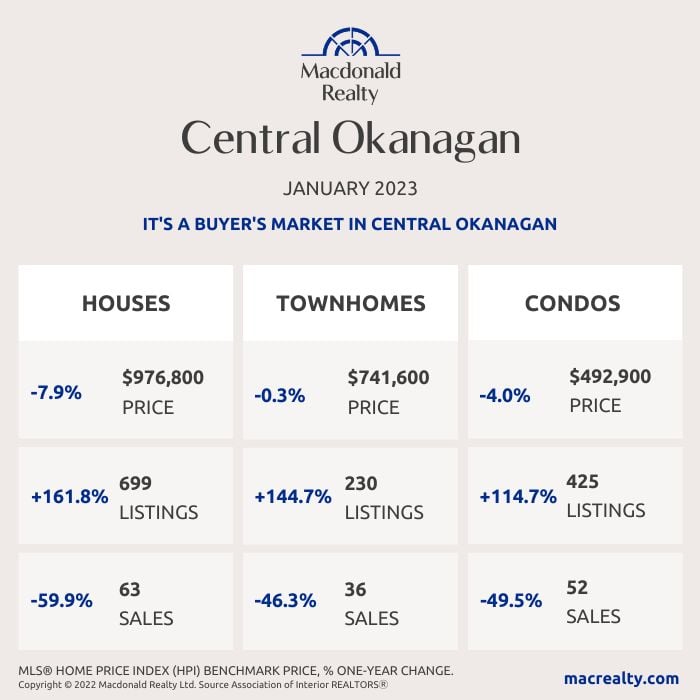
Central Okanagan: Kelowna and Lake Country
There were 63 sales, 699 active listings, and $976,800 average sale price for detached homes in the Central Okanagan market, including Kelowna and Lake Country. The condo market featured 52 sales and 425 active listings at the end of the month. The average sale price was $492,900. Townhome sales were 36, active listings were 230 and the average sale price was $741,600. It’s a buyer’s market in Central Okanagan.
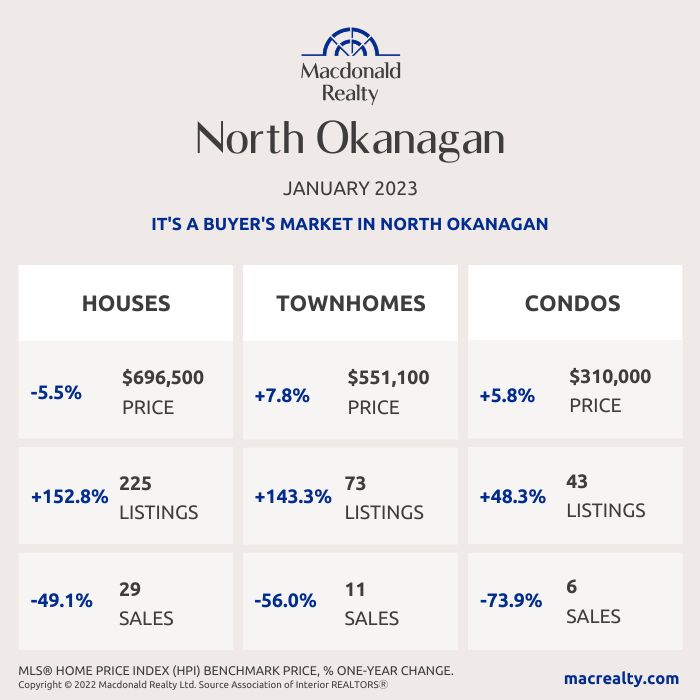
North Okanagan: Vernon and surrounding area
In North Okanagan, including Vernon and the surrounding area and the average detached home sale price was $696,500. At the end of the month, there were 29 sales and 225 active listings. There were 6 sales and 43 active listings for condos. The average sale price was $310,000. In comparison, townhomes featured 11 sales, 73 active listings and a $551,100 average sale price. It’s a buyer’s market in North Okanagan.
South Okanagan
There were 24 sales, 289 active listings, and $656,500 average sale price for detached homes in the South Okanagan market.
The condo market featured 15 sales and 162 active listings at the end of the month. The average sale price was $389,300. Townhome sales were 11, active listings were 70 and the average sale price was $545,100. It’s a buyer’s market in South Okanagan.

Looking for more information about the real estate market in specific neighbourhoods in Okanagan?
Macdonald Realty has offices in Kelowna and across BC. Please email [email protected] or call 1-877-278-3888 to be matched with a REALTOR® working in your area.
This blog post is based on market data provided by the Association Of Interior REALTORS® https://www.interiorrealtors.ca/.
by Macrealty Marketing Team | Feb 8, 2023 | Market Updates
Here are the latest real estate market statistics from Macdonald Realty on Greater Victoria, Saanich Peninsula, Parksville/Qualicum, and Nanaimo listings and sales in January 2023. Find all the infographics related to the January Market Statistics by visiting the Facebook Album.
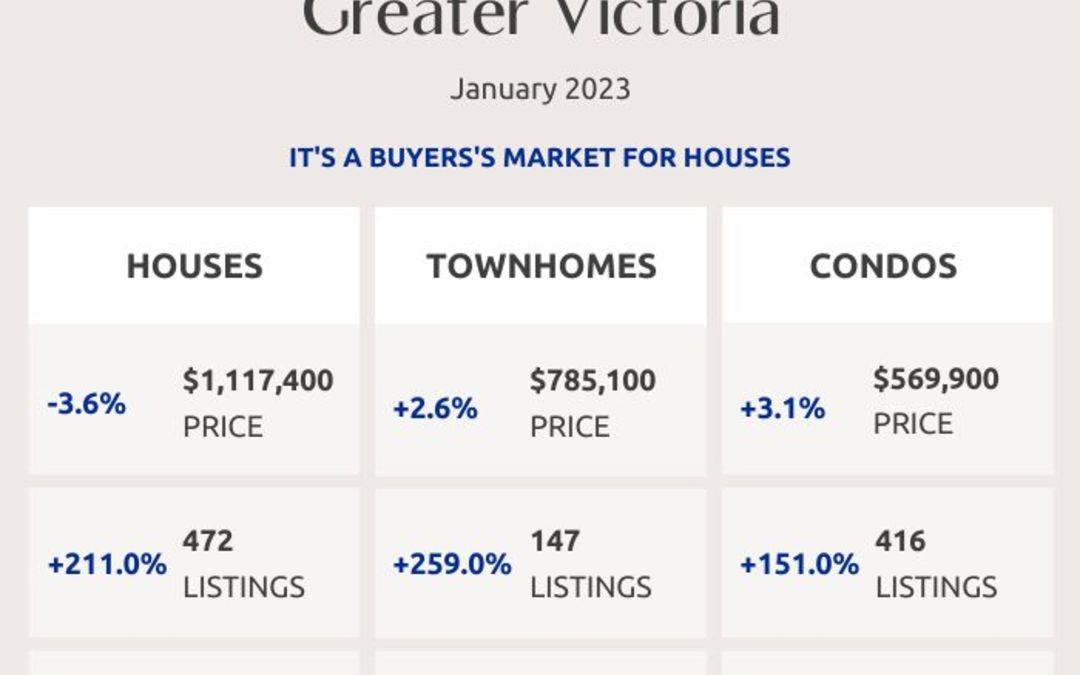
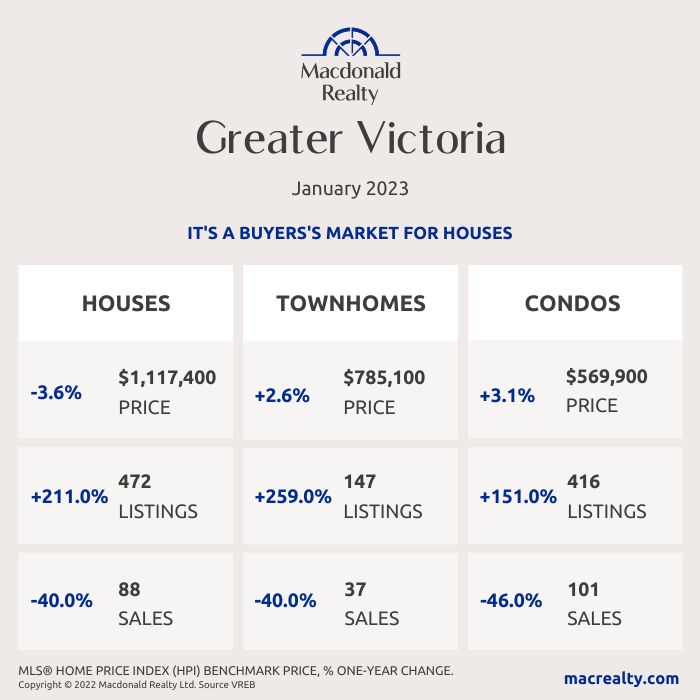
A total of 278 properties sold in the Victoria Real Estate Board region this January, 41.4 per cent fewer than the 474 properties sold in January 2022 and a 13.1 per cent decrease from December 2022. Sales of condominiums were down 46.3 per cent from January 2022 with 101 units sold. Sales of single family homes decreased 33 per cent from January 2022 with 120 sold.
“If you’re looking at the statistics, this January was one of the slowest we’ve seen on record,” says 2023 Victoria Real Estate Board Chair Graden Sol. “However, we did see a mid-month surge in activity as buyers seemed to regain confidence after the rapid interest rate increases of last year. It may be that consumers are moving past the market shock of the rate increases and economic uncertainty and that our market is regaining its equilibrium. What the data doesn’t show is the optimism that many of our REALTOR® members are noting from their buyers and sellers, who remain active viewing homes and making offers. Interest rates, continued low inventory and the greater economic situation in our area will determine what our early spring market will look like.”
There were 1,739 active listings for sale on the Victoria Real Estate Board Multiple Listing Service® at the end of January 2022, an increase of 3 per cent compared to the previous month of December and a 133.7 per cent increase from the 744 active listings for sale at the end of January 2021.
“Despite the slower start to the market in January, and our constrained inventory levels, some consumers still found themselves in multiple offer situations, particularly on the types of properties that represent the crucial missing middle segment of our market. The Victoria City Council voting to move forward with their missing middle housing program is a great step in the right direction when we are considering how low inventory has impacted the attainability of housing in the CRD,” adds Sol. “But this is one step in a marathon of work to be done to increase housing opportunities to meet our community’s short- and long-term needs. Each municipality must keep their focus on adding gentle density where they can so that we do not face another swift increase in values when our market demand increases again.”
Greater Victoria
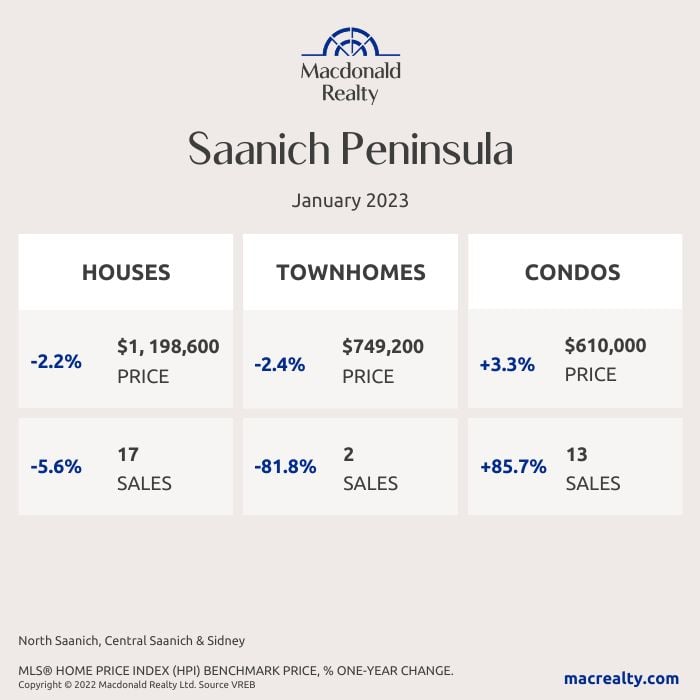
Saanich Peninsula
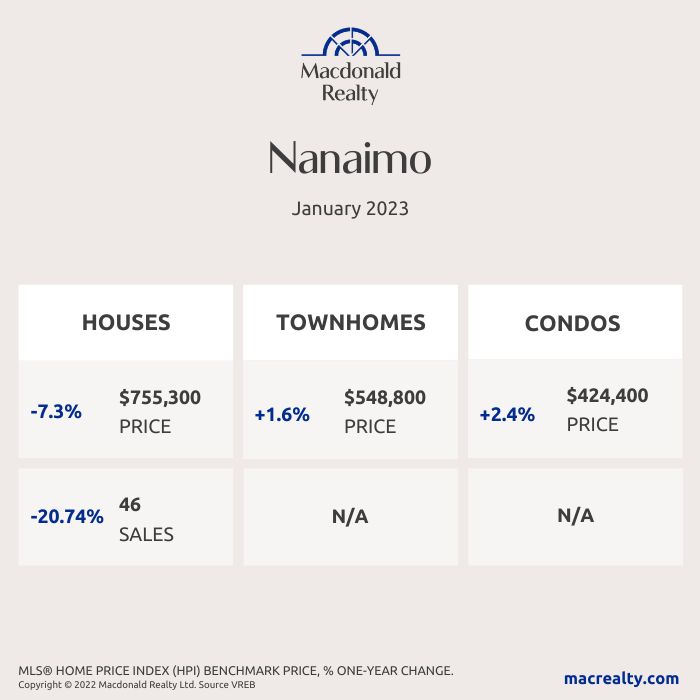
Nanaimo
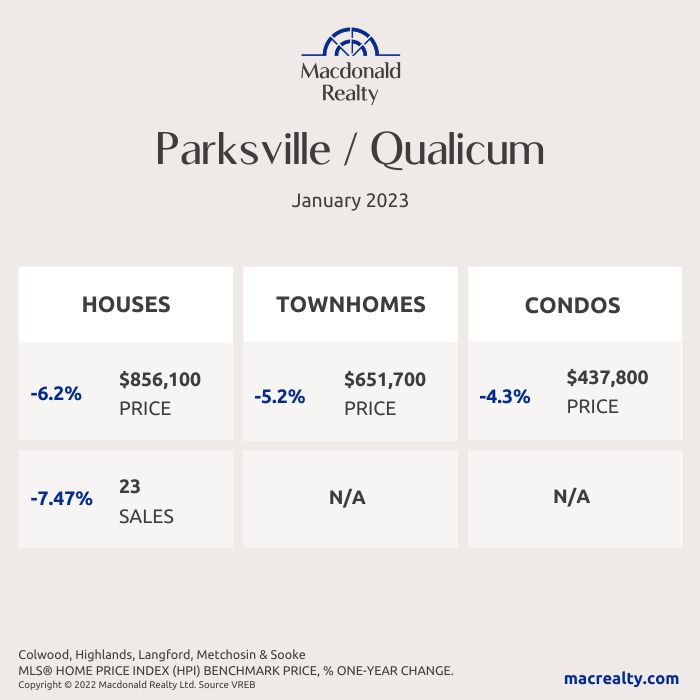
Parksville / Qualicum
Looking for more information about the real estate market in specific neighbourhoods in Victoria, Saanich Peninsula, Parksville, Nanaimo, Vancouver Island and the Gulf Islands?
Macdonald Realty has offices in downtown Victoria, Sidney, Parksville and Salt Spring Island. Please email [email protected] or call 1-877-278-3888 to be matched with a REALTOR® working in your area.
MLS® Home Price Index (HPI) Benchmark Price
Average and median home prices are often misinterpreted, are affected by change in the mix of homes sold, and can swing dramatically from month to month (based on the types and prices of properties that sold in a given month). The MLS® HPI overcomes these shortcomings and uses the concept of a benchmark home, a notional home with common attributes of typical homes in a defined area. Visit www.housepriceindex.ca for more information.
This blog post is based on market data provided by the Victoria Real Estate Board (VREB) www.vreb.org and the Vancouver Island Real Estate Board (VIREB) www.vireb.com. Market data from the VIREB includes listings and sales in Campbell River, Comox Valley, Cowichan Valley Nanaimo, Parksville/Qualicum, Port Alberni/West, North Island, and the Islands.
by Macrealty Marketing Team | Feb 7, 2023 | Market Updates
According to the Fraser Valley Real Estate Board, the downward trend in Fraser Valley real estate sales continued in January as further interest rate hikes kept buyers sidelined.
With 626 transactions processed on the MLS®, sales were off by 12.6 per cent compared to last month and down by 52.2 per cent compared to this time last year. The last time January sales were this low was in 2013 at 617 sales.
“Buyers are understandably cautious, which explains the slow start to the year,” said Sandra Benz, President of the
Fraser Valley Real Estate Board. “That said, the pent-up demand that has been building since the last quarter of
2022 will likely give rise to a sales uptick, especially if rate hikes subside, which we expect will be the case.”
Although new listings saw an increase of 128.3 per cent over last month to 1,833, they are at the lowest level of
new supply for January since 1984. Active listings rose slightly up 5 per cent to 4,118 over December 2022 and up
by 76.6 per cent compared to this time last year.
“We also expect inventory to start increasing over the coming months as sellers act on decisions that have been on
hold, waiting for rates to peak” added Benz. “As we start to see greater selection across all property categories, we
should see demand pick up.”
At $942,200, the composite Benchmark home price continued to edge downward, slipping by 1.4 per cent from
December and off by 15.1 per cent compared to January 2022.
“After a market slowdown for the past several months, the Board is expecting a return to seasonal activity leading
into spring,” said FVREB CEO Baldev Gill. “With rates still elevated, however, buyers and sellers would be welladvised
to seek out the guidance of a professional REALTOR® to determine the best strategy and timing to take
advantage of the anticipated market upswing.”
Across Fraser Valley in January, the average number of days to sell a single-family detached home was 48, and a
townhome was 40 days. Apartments took, on average, 41 days to sell.
Find all the infographics related to the November Market Statistics by visiting the Facebook Album.
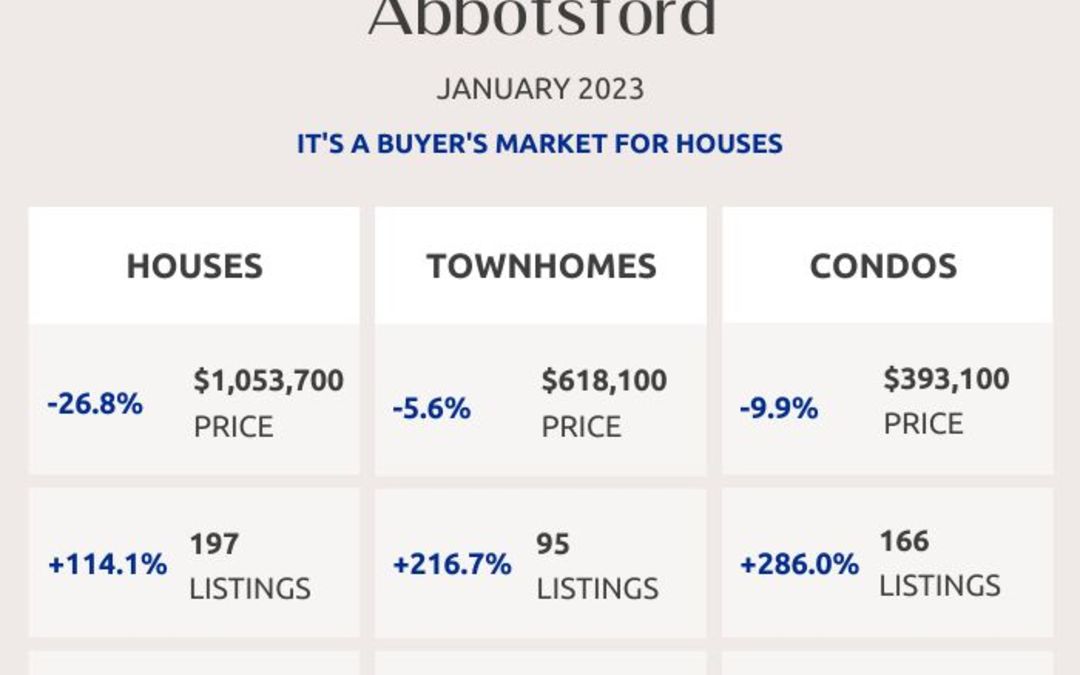
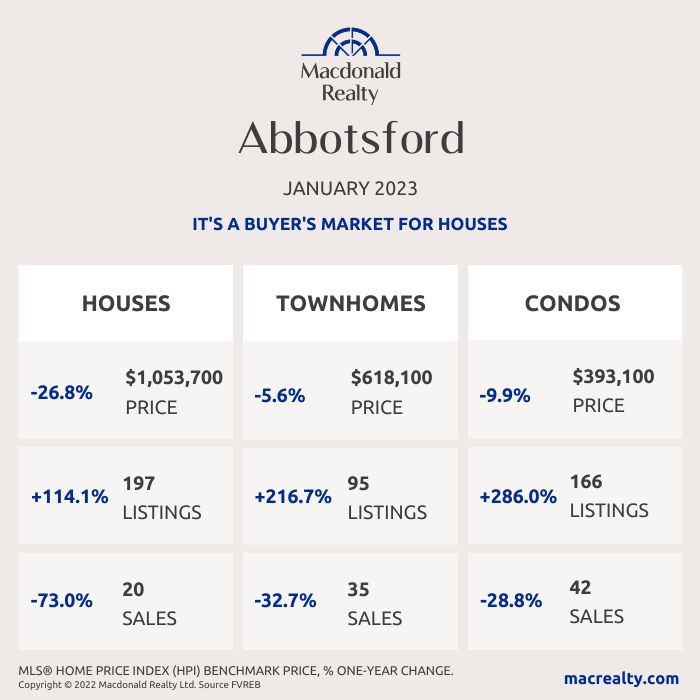
Abbotsford
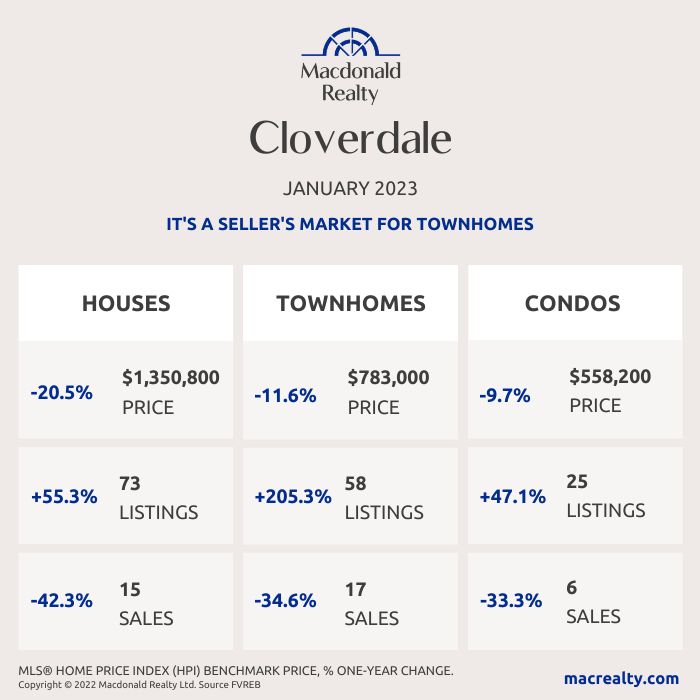
Cloverdale
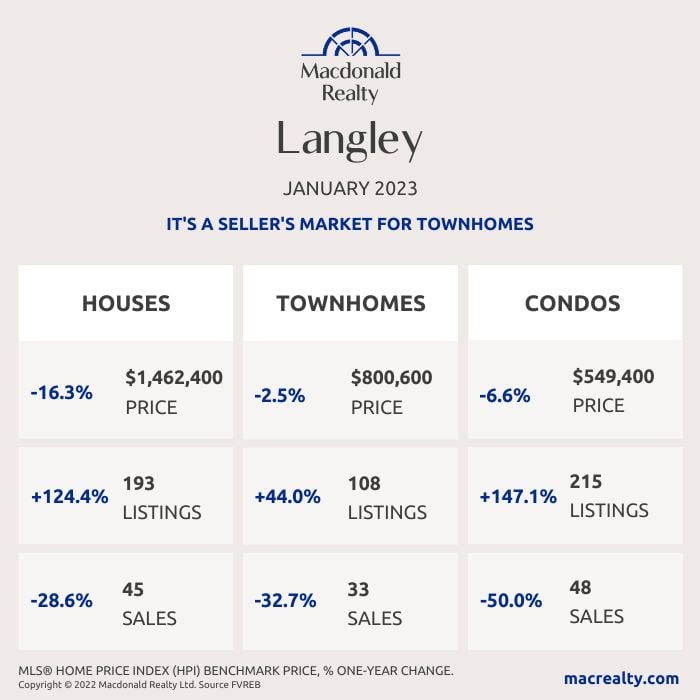
Langley
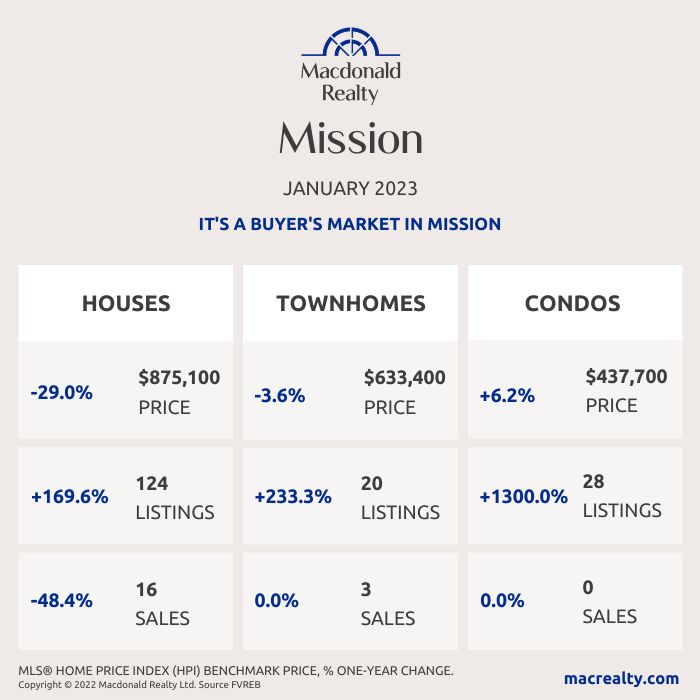
Mission
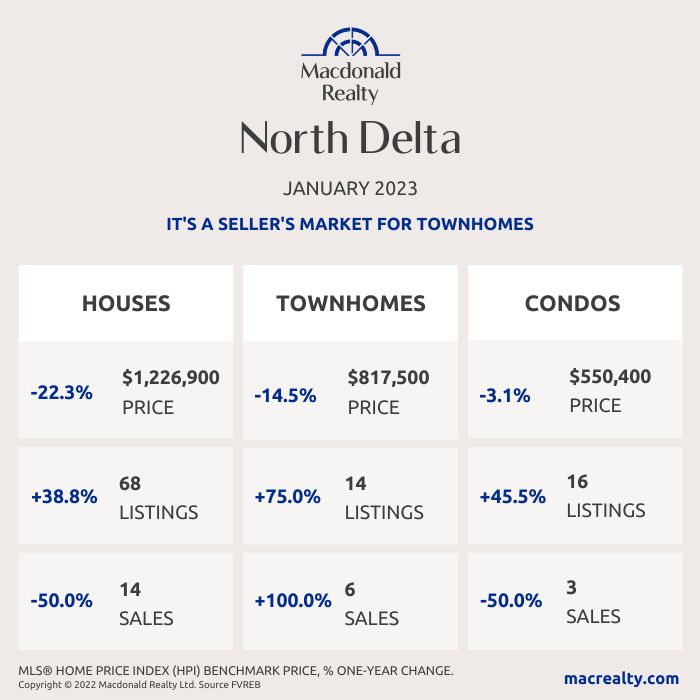
North Delta
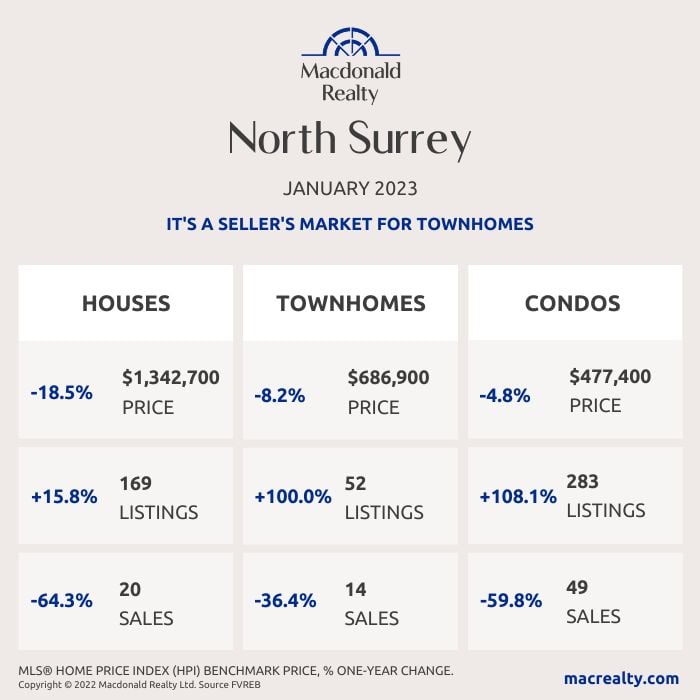
North Surrey
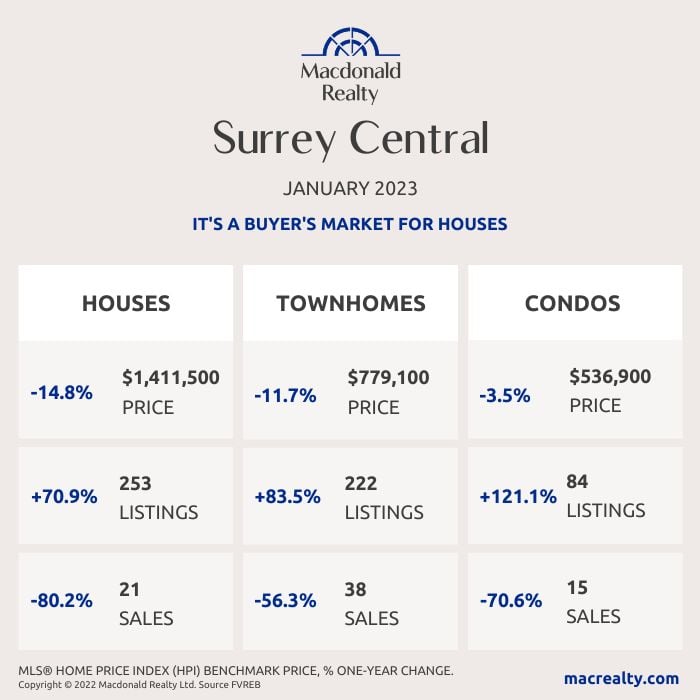
Surrey Central
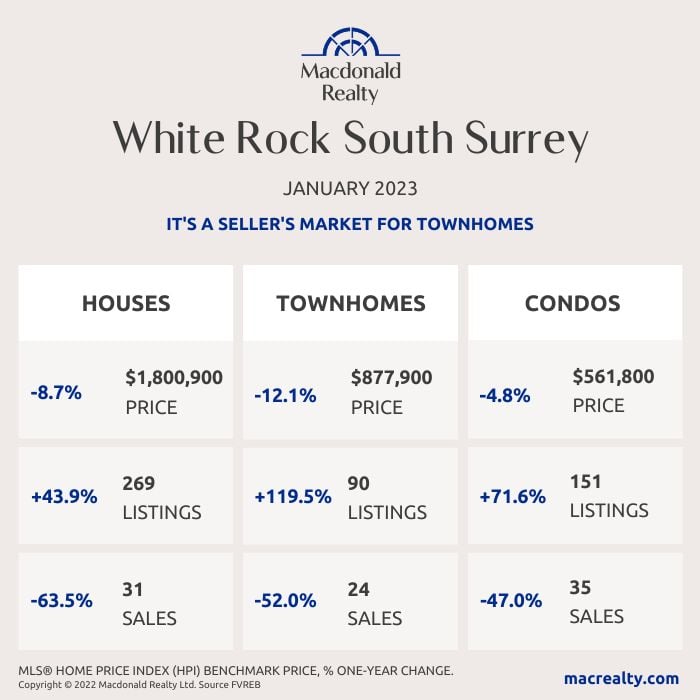
White Rock / South Surrey
Looking for more information about the real estate market in specific neighbourhoods in Surrey, Langley and Fraser Valley?
Macdonald Realty has offices in North Delta, White Rock/South Surrey, and Langley. Please email [email protected] or call 1-877-278-3888 to be matched with a REALTOR® working in your area.
MLS® Home Price Index (HPI) Benchmark Price
Average and median home prices are often misinterpreted, are affected by change in the mix of homes sold, and can swing dramatically from month to month (based on the types and prices of properties that sold in a given month). The MLS® HPI overcomes these shortcomings and uses the concept of a benchmark home, a notional home with common attributes of typical homes in a defined area. Visit www.housepriceindex.ca for more information.
This blog post is based on market data provided by the Fraser Valley Real Estate Board (FVREB) www.fvreb.bc.ca
by Macrealty Marketing Team | Feb 7, 2023 | Market Updates
Here are the latest real estate market statistics from Macdonald Realty on the Greater Vancouver listings and sales in January 2023. Find all the infographics by visiting the Facebook Album.
Inventory remains low in Metro Vancouver while home sales dipped well below monthly historical averages in January.
The Real Estate Board of Greater Vancouver (REBGV) reports that residential home sales in the region totalled 1,022 in January 2023, a 55.3 per cent decrease from the 2,285 sales recorded in January 2022, and a 21.1 per cent decrease from the 1,295 homes sold in December 2022.
Last month’s sales were 42.9 per cent below the 10-year January sales average.
“Due to seasonality, market activity is quieter in January. With mortgage rates having risen so rapidly over the last year, we anticipated sales this month would be among the lowest in recent history,” said Andrew Lis, REBGV’s director, economics and data analytics. “Looking forward, however, the Bank of Canada has said that it will pause further rate increases as long as the incoming economic data continues to support this policy stance. This should provide more certainty for home buyers and sellers in the market.”
There were 3,297 detached, attached and apartment properties newly listed for sale on the Multiple Listing Service® (MLS®) in Metro Vancouver in January 2023. This represents a 20.9 per cent decrease compared to the 4,170 homes listed in January 2022 and a 173.4 per cent increase compared to December 2022 when 1,206 homes were listed.
The total number of homes currently listed for sale on the MLS® system in Metro Vancouver is 7,478, a 32.1 per cent increase compared to January 2022 (5,663) and a 1.3 per cent increase compared to December 2022 (7,384).
For all property types, the sales-to-active listings ratio for January 2023 is 13.7 per cent. By property type, the ratio is 10.2 per cent for detached homes, 13.4 per cent for townhomes, and 16.7 per cent for apartments.
Generally, analysts say downward pressure on home prices occurs when the ratio dips below 12 per cent for a sustained period, while home prices often experience upward pressure when it surpasses 20 per cent over several months.
“We know the peak for prices in our market occurred last spring. Over the coming months, year-over-year data comparisons will show larger price declines than we’ve been reporting up to now,” said Lis. “It’s important to understand that year-over-year calculations are backward-looking. These price declines already happened, and what we are seeing today is that prices may have found a footing, even if it’s an awkward one sandwiched between low inventory and higher borrowing costs.”
*Areas covered by the Real Estate Board of Greater Vancouver include Burnaby, Coquitlam, Maple Ridge, New Westminster, North Vancouver, Pitt Meadows, Port Coquitlam, Port Moody, Richmond, South Delta, Squamish, Sunshine Coast, Vancouver, West Vancouver, and Whistler. Check out the infographics of Squamish, Sunshine Coast and Whistler, HERE.
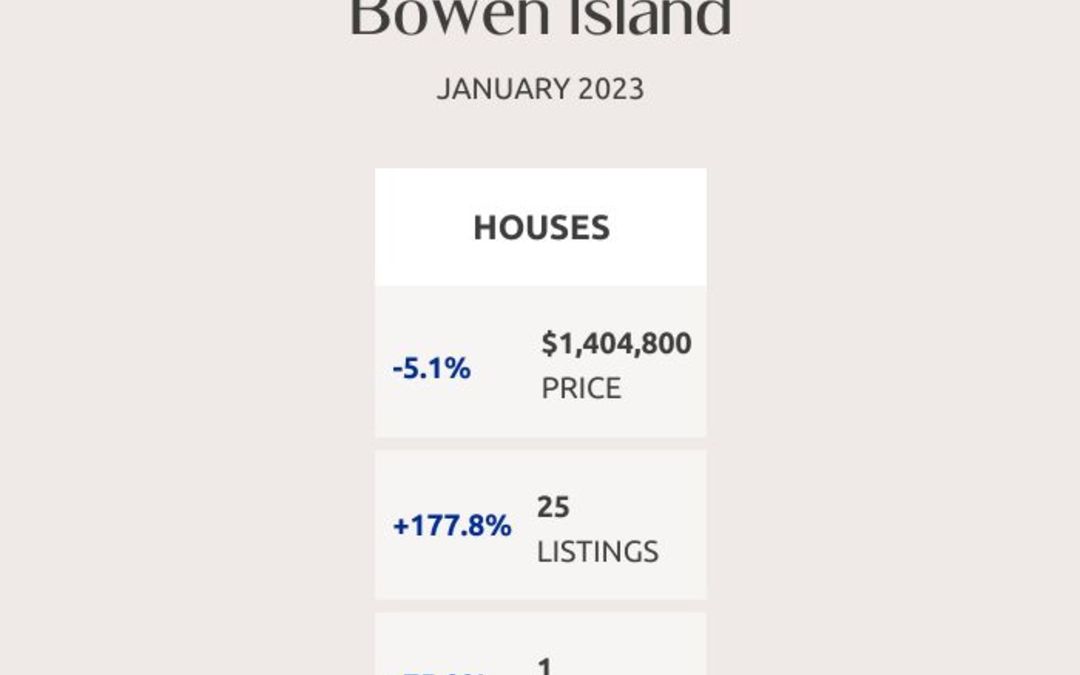
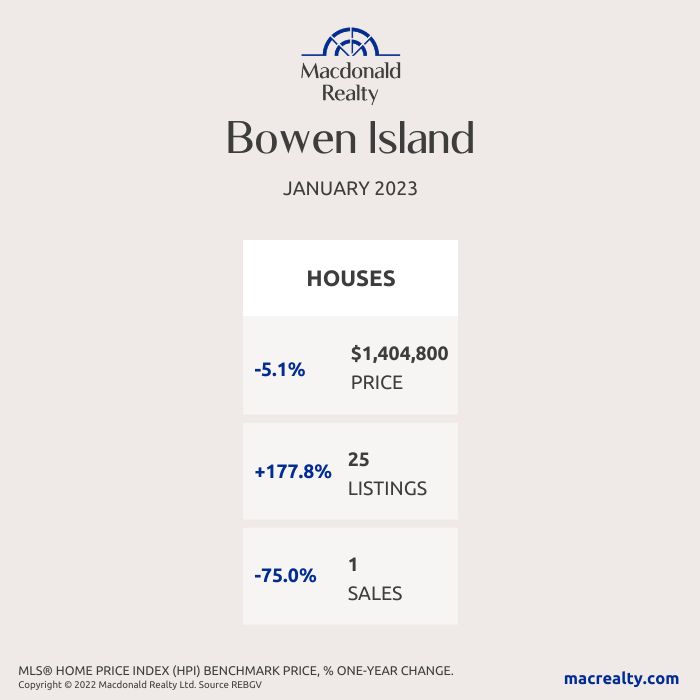
Bowen Island
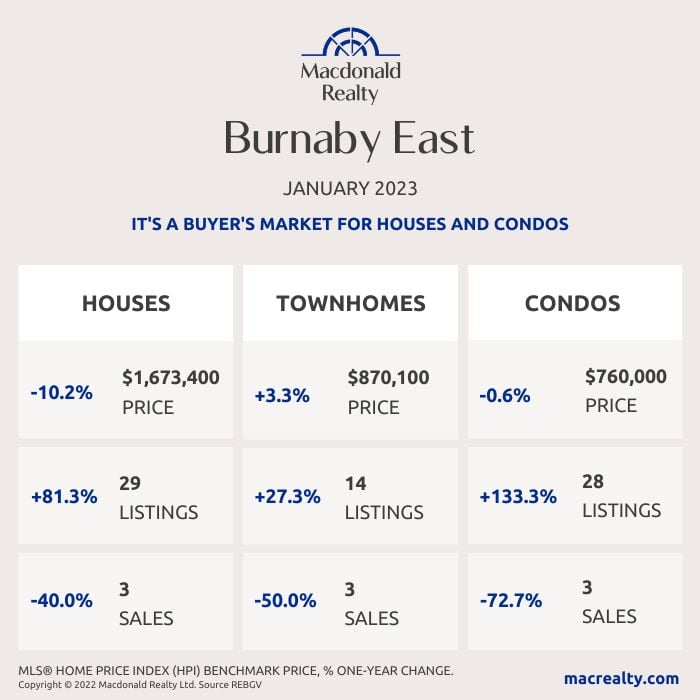
Burnaby East
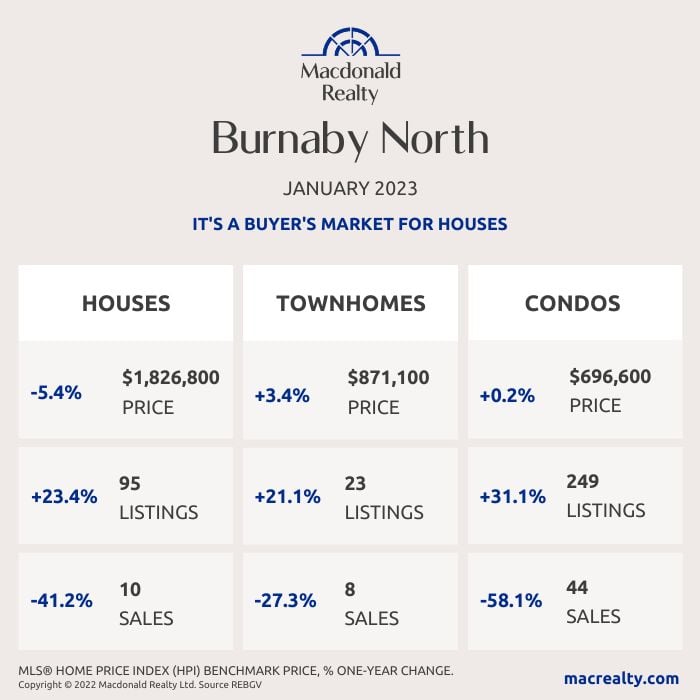
Burnaby North
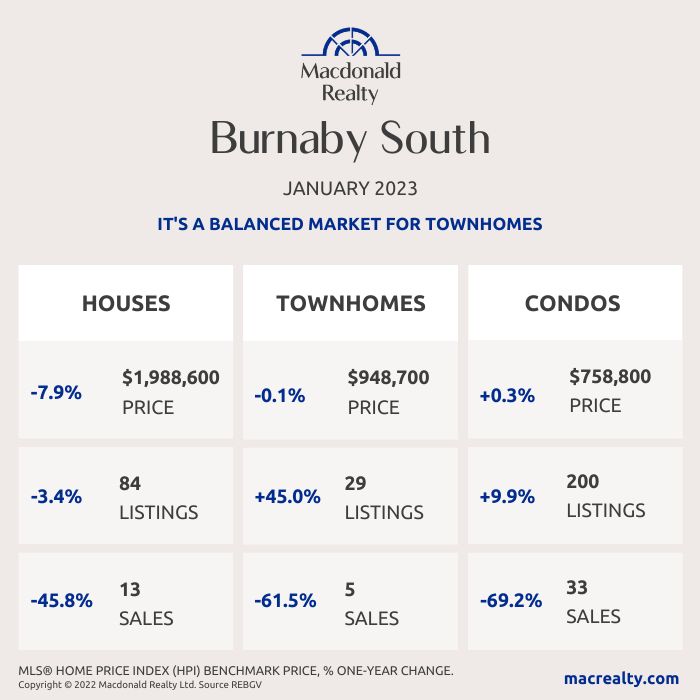
Burnaby South
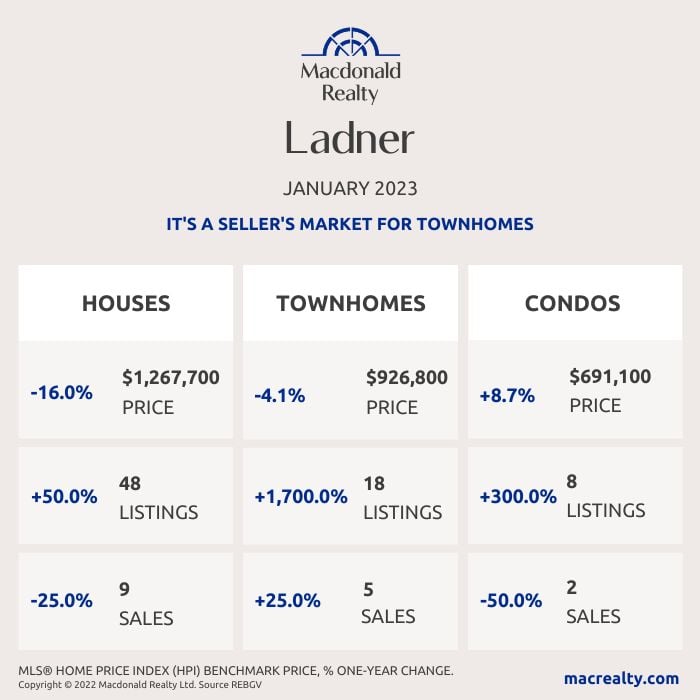
Ladner
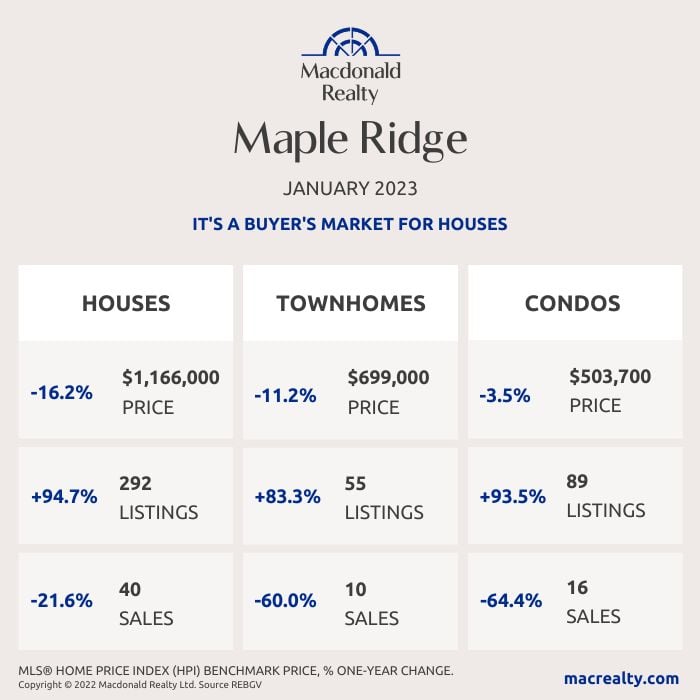
Maple Ridge
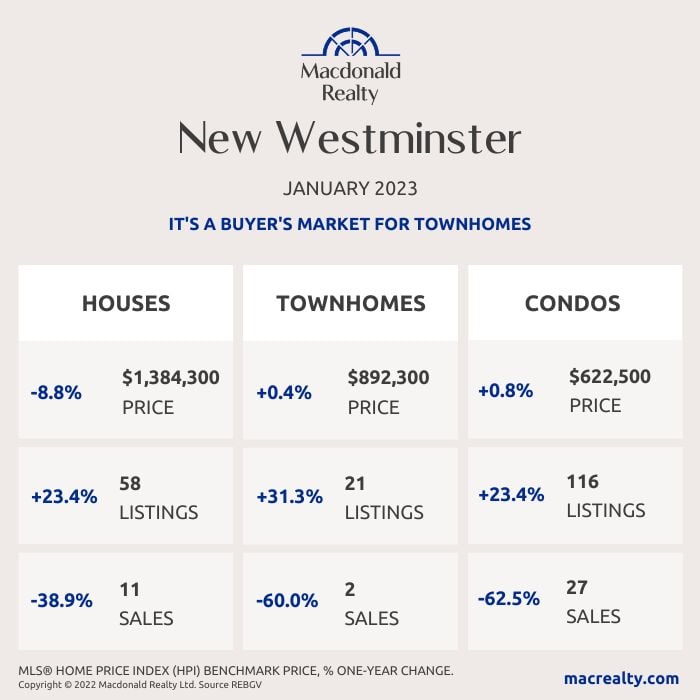
New Westminster
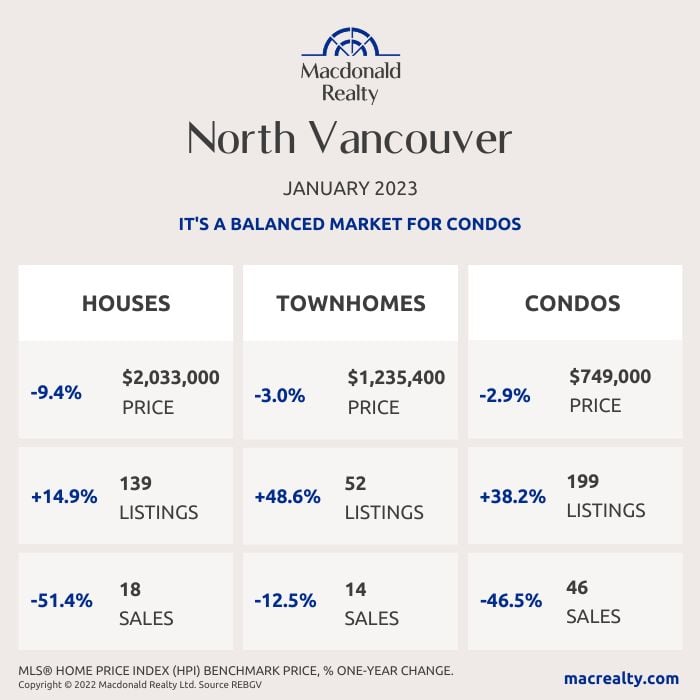
North Vancouver
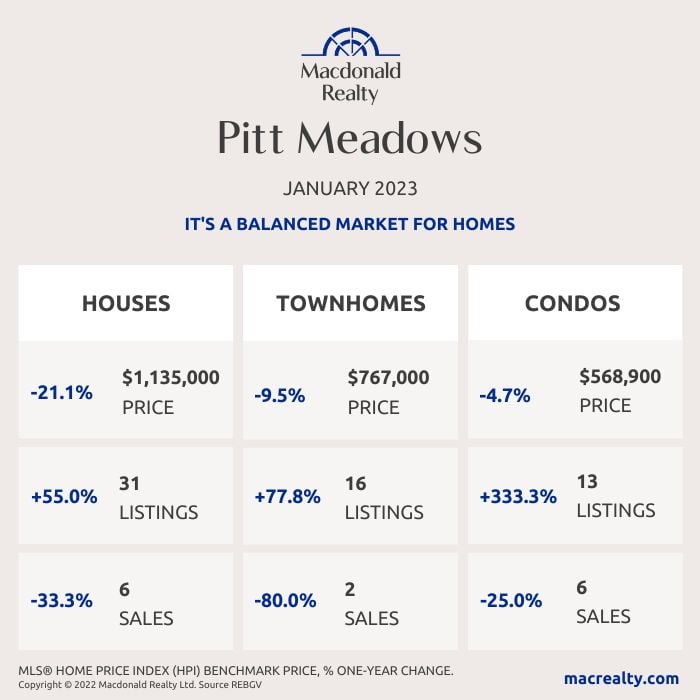
Pitt Meadows
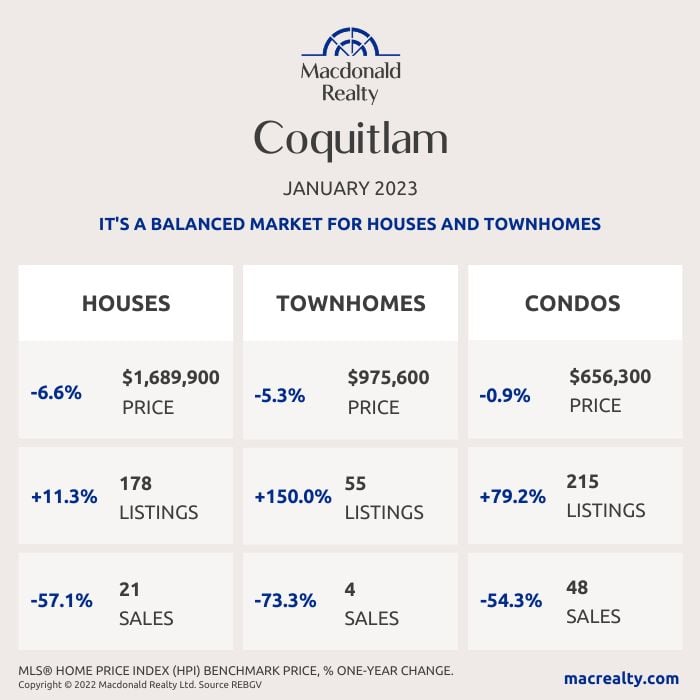
Coquitlam
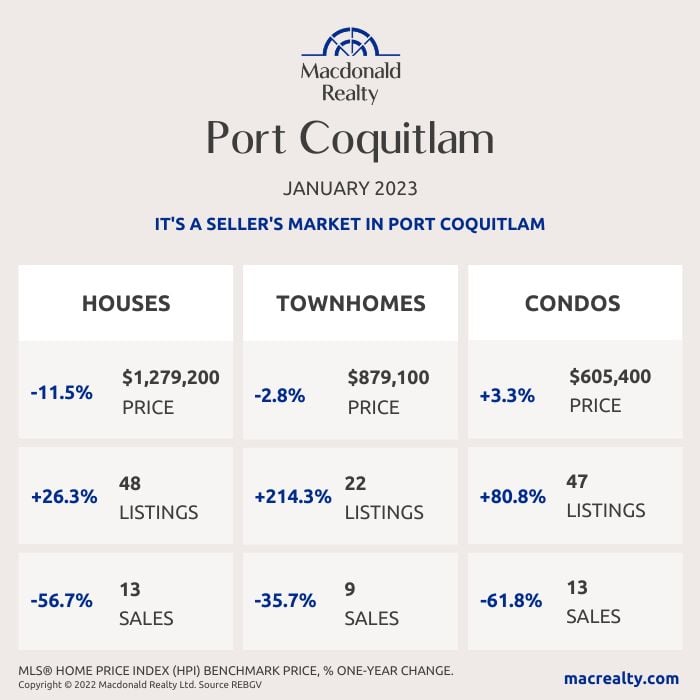
Port Coquitlam
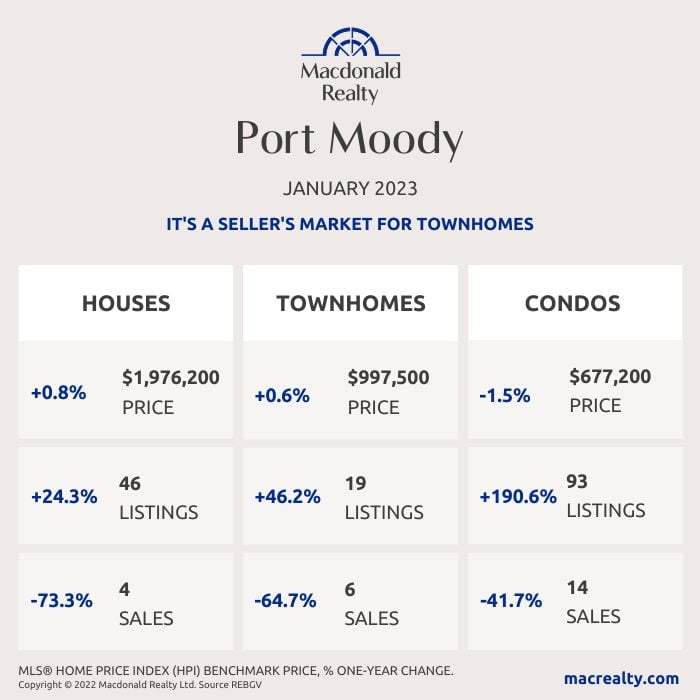
Port Moody
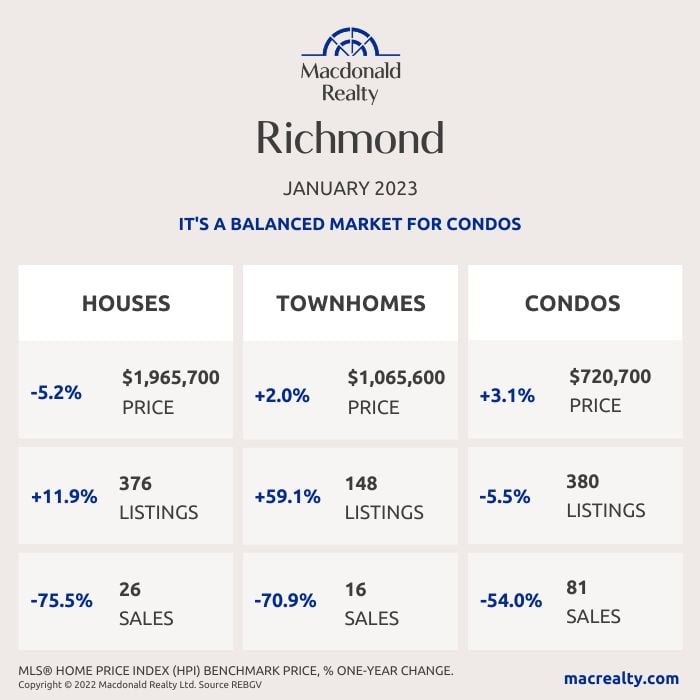
Richmond
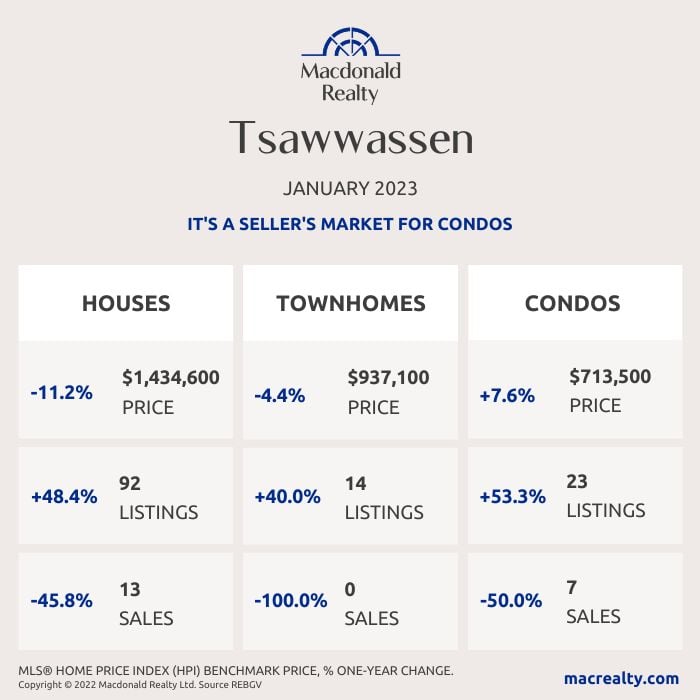
Tsawwassen
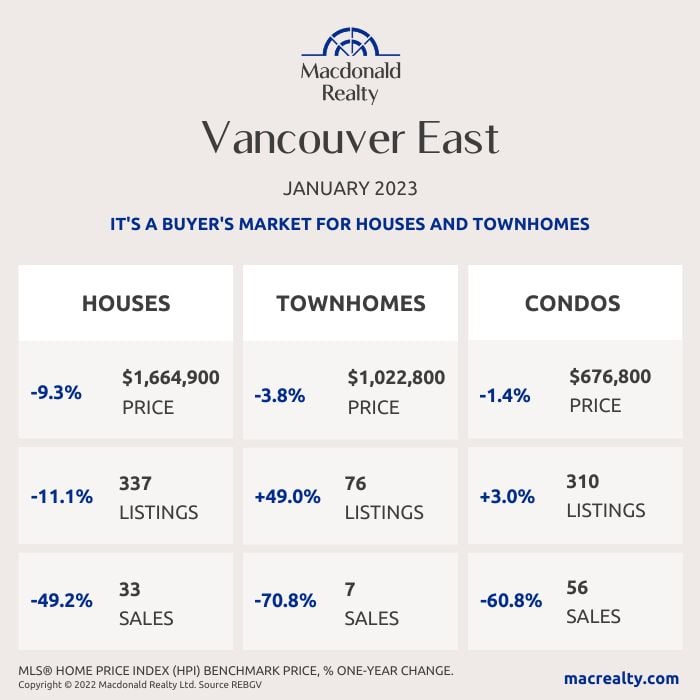
Vancouver East
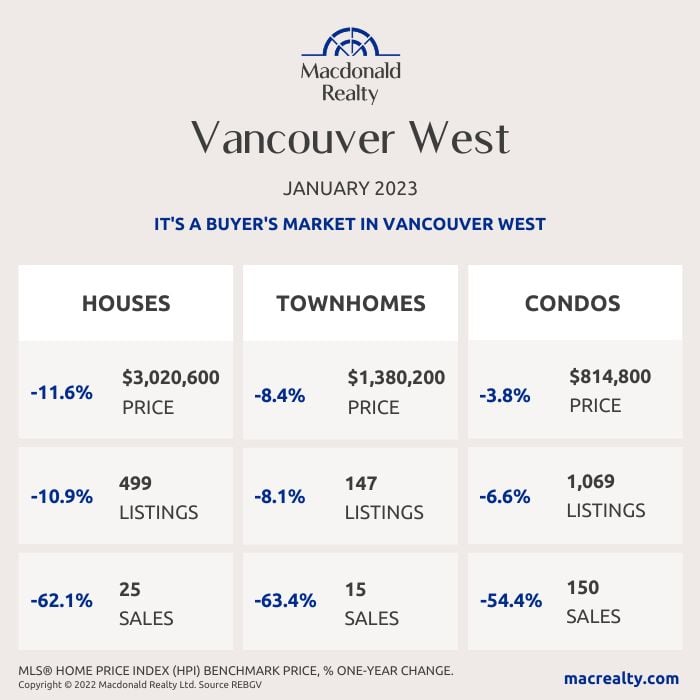
Vancouver West
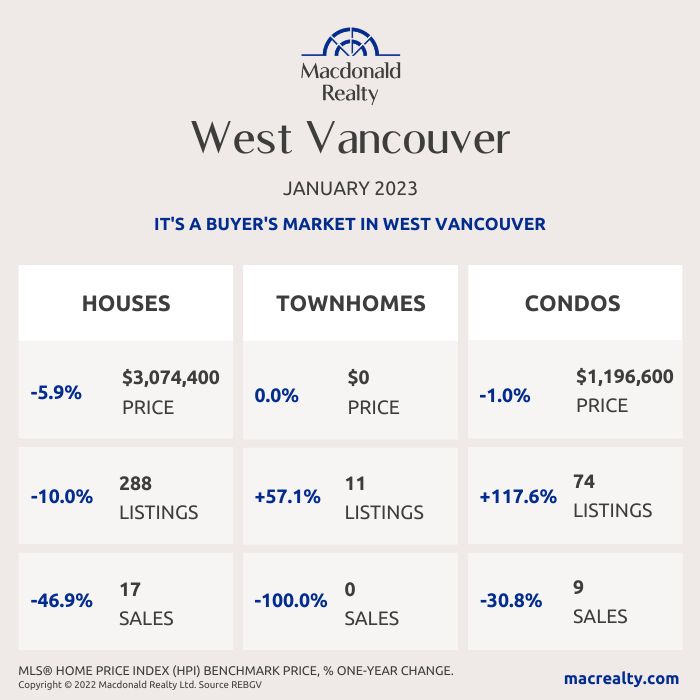
West Vancouver
Looking for more information about the real estate market in specific neighbourhoods in the Greater Vancouver?
Macdonald Realty has offices across the Greater Vancouver. Please email [email protected] or call 1-877-278-3888 to be matched with a REALTOR® working in your area.
MLS® Home Price Index (HPI) Benchmark Price
Average and median home prices are often misinterpreted, are affected by change in the mix of homes sold, and can swing dramatically from month to month (based on the types and prices of properties that sold in a given month). The MLS® HPI overcomes these shortcomings and uses the concept of a benchmark home, a notional home with common attributes of typical homes in a defined area. Visit www.housepriceindex.ca for more information.
This blog post is based on market data provided by the Real Estate Board of Greater Vancouver (REBGV) www.rebgv.org
by Macrealty Marketing Team | Feb 7, 2023 | Market Updates
Here are the latest real estate market statistics from Macdonald Realty on Squamish, Whistler, and Sunshine Coast listings and sales in January 2023.
Find all the infographics related to the December Market Statistics by visiting the Facebook Album.
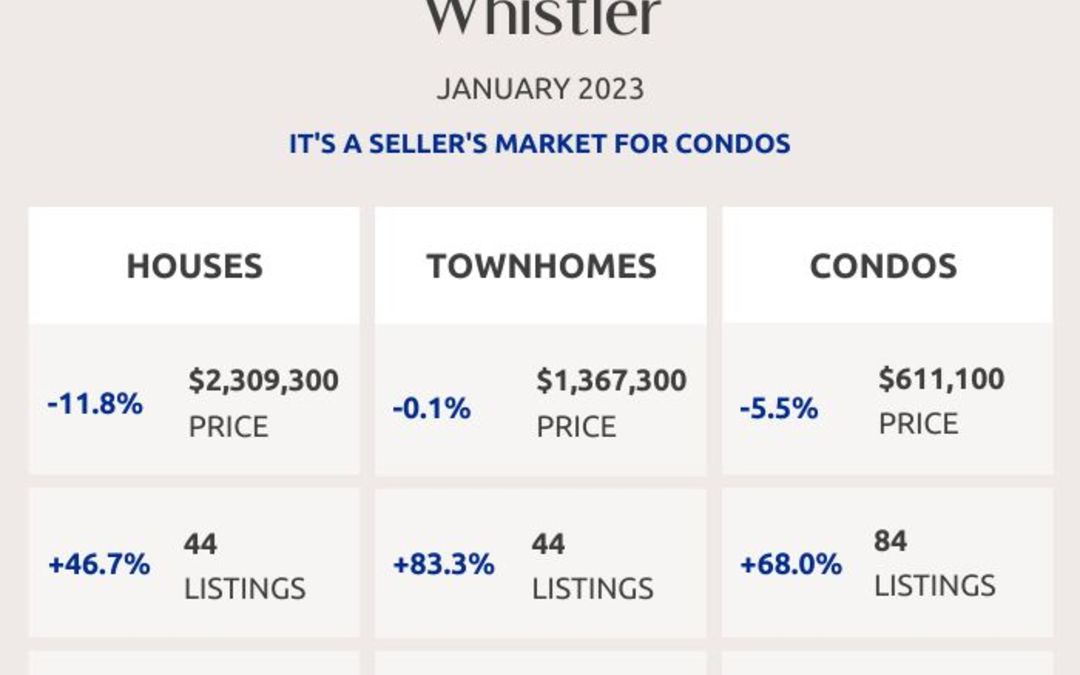
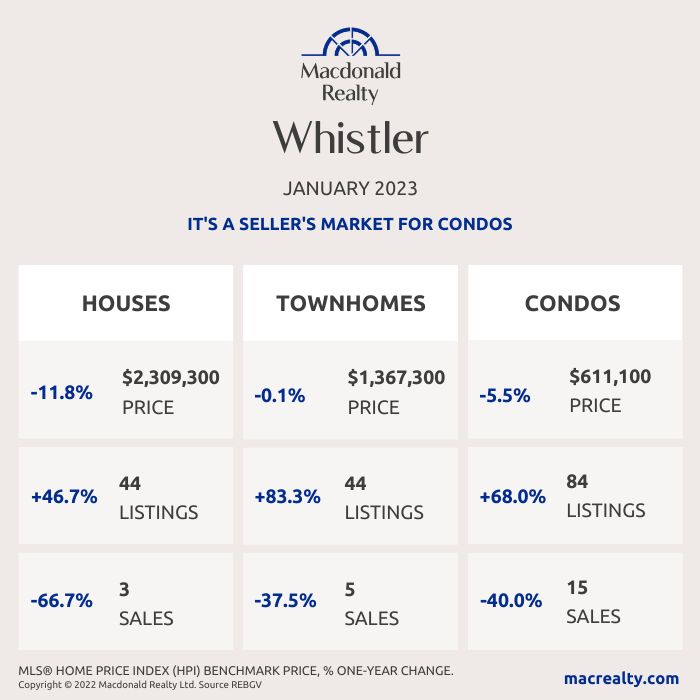
Whistler
In January 2023, there were 3 sales of detached homes and 44 active listings. The benchmark sale price was $2,309,300.
The condo market had 15 sales and 84 active listings at the end of the month. The benchmark sale price was $611,100.
The townhome market had 5 sales and the active listings were 44. The benchmark sale price was $1,367,300.
It’s a seller’s market for condos in Whistler.
Squamish
In January 2023, there were 8 sales of detached homes and 67 active listings. The benchmark sale price was $1,470,900.
The condo market had 4 sales and 26 active listings at the end of the month. The benchmark sale price was $538,800.
The townhome market had 5 sales and, the active listings were 18. The benchmark sale price was $961,600.
It’s a seller’s market for condos in Squamish.

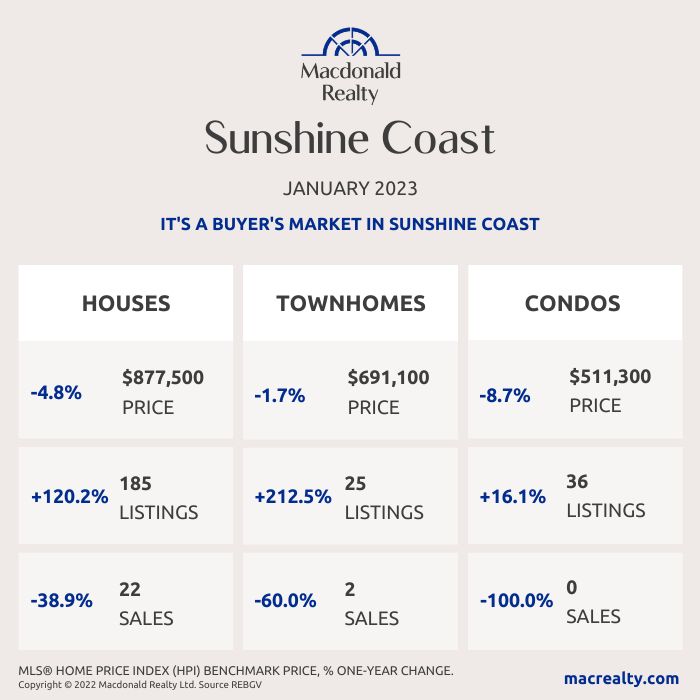
Sunshine Coast
In January 2023, there were 22 sales of detached homes and 185 active listings. The benchmark sale price was $877,500.
The condo market had zero sales and 36 active listings at the end of the month.
The townhome market had 2 sales and, the active listings were 25.
It’s a buyer’s market in Sunshine Coast.
Looking for more information about the real estate market in specific neighbourhoods in Squamish, Whistler, and Sunshine Coast? Macdonald Realty has offices in Squamish, Whistler, and Sunshine Coast. Please email [email protected] or call 1-877-278-3888 to be matched with a REALTOR® working in your area.
MLS® Home Price Index (HPI) Benchmark Price
Average and median home prices are often misinterpreted, are affected by change in the mix of homes sold, and can swing dramatically from month to month (based on the types and prices of properties that sold in a given month). The MLS® HPI overcomes these shortcomings and uses the concept of a benchmark home, a notional home with common attributes of typical homes in a defined area. Visit www.housepriceindex.ca for more information.
This blog post is based on market data provided by the Real Estate Board of Greater Vancouver (REBGV) www.rebgv.org
by Macrealty Marketing Team | Feb 6, 2023 | Market Updates
February 2023 – Lower Mainland Monthly Update (REBGV & FVREB)
Metro Vancouver & Fraser Valley sales in January fell to their lowest level in over 10 years
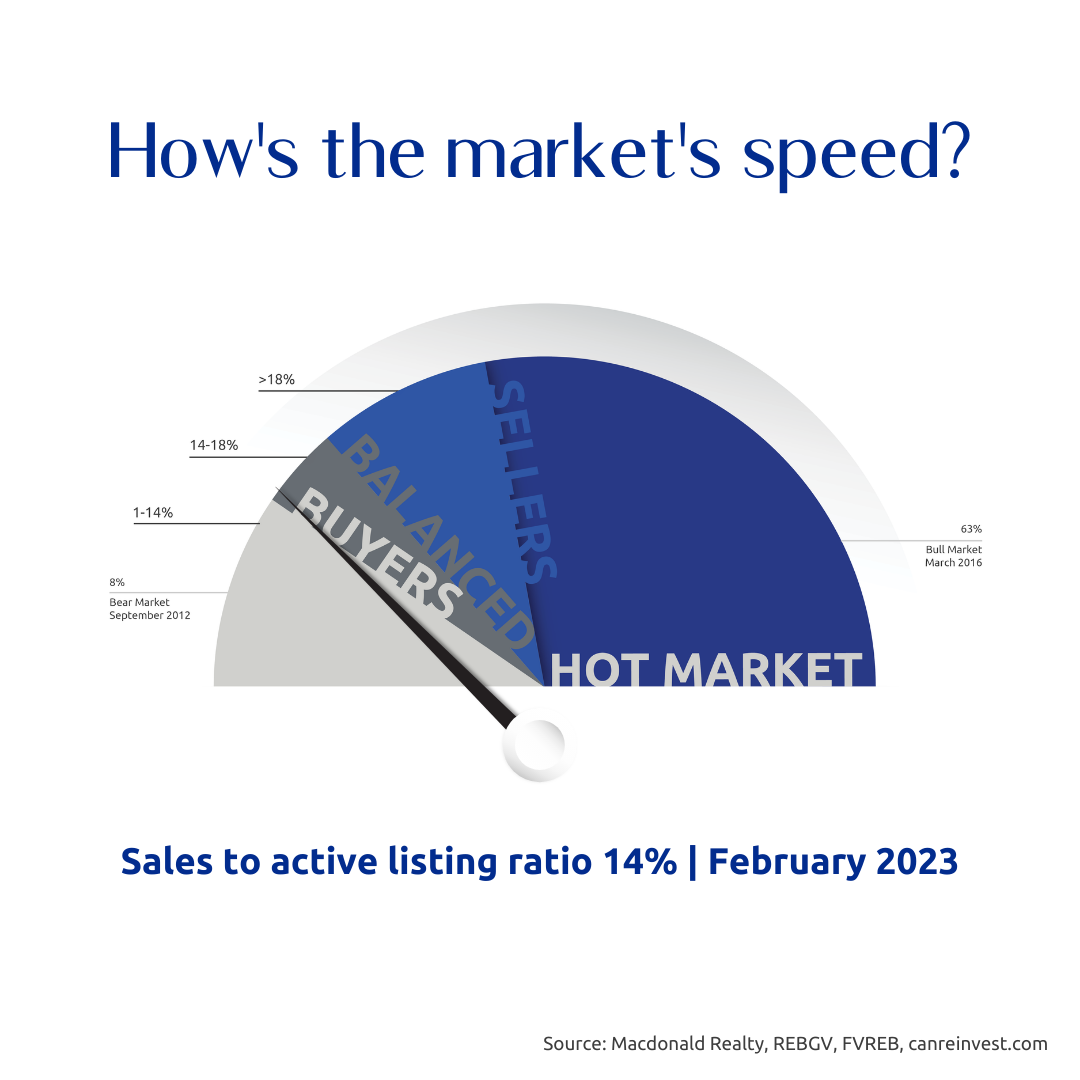
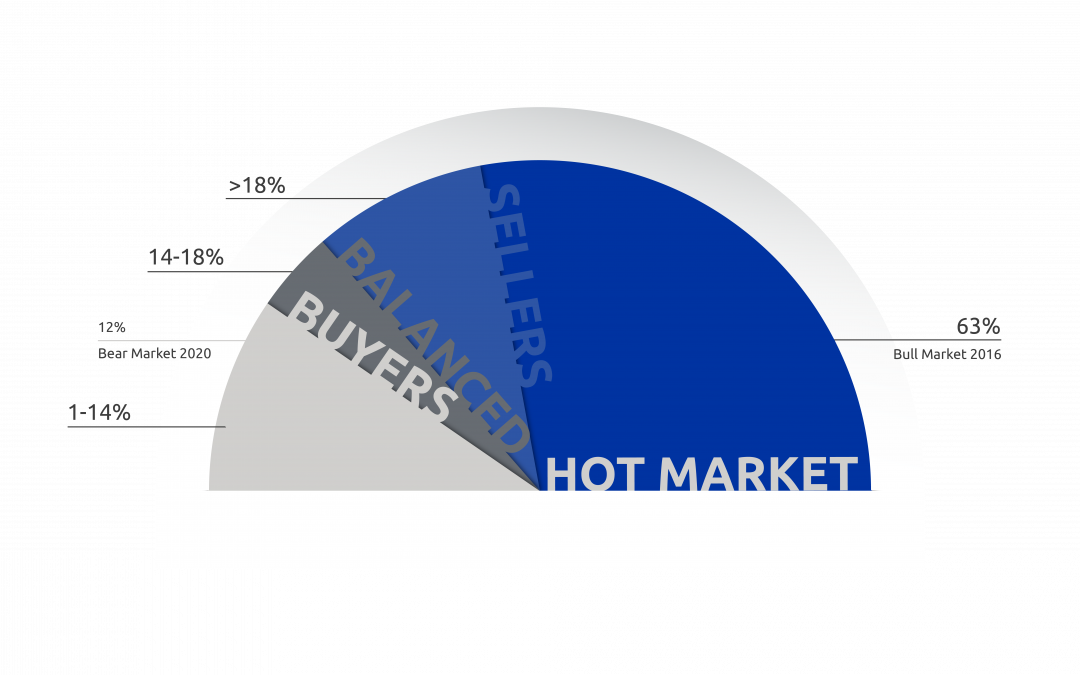
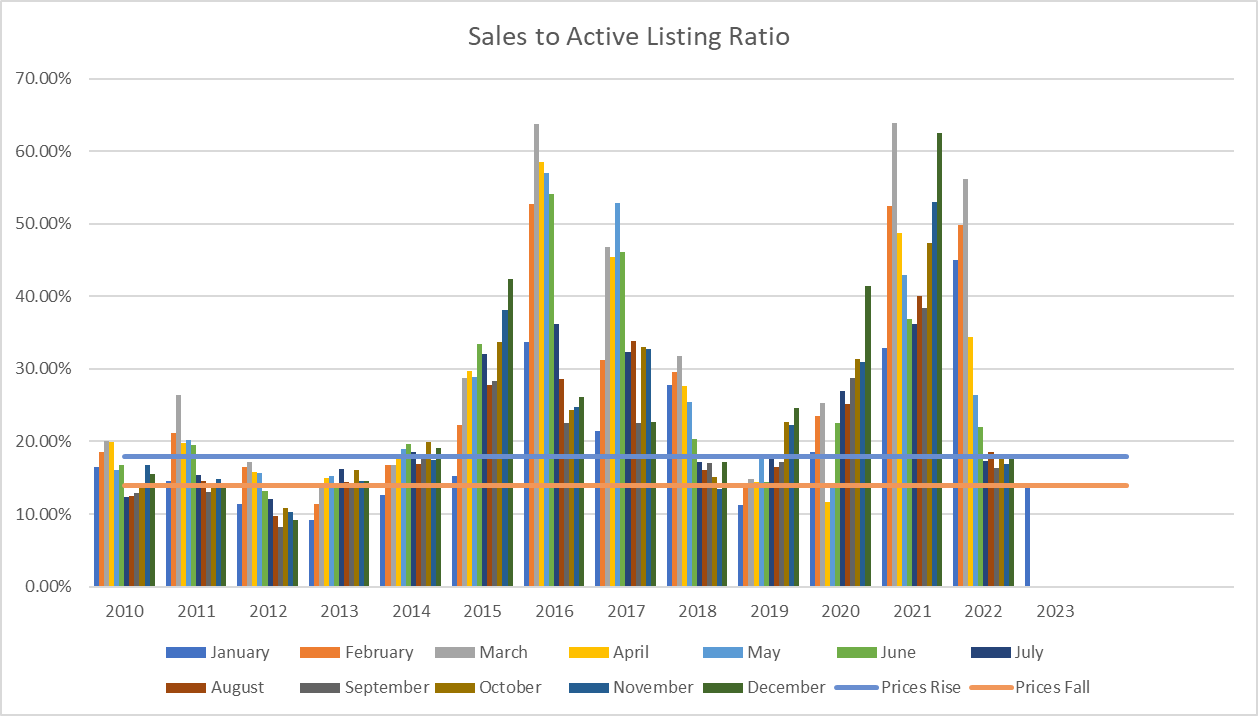
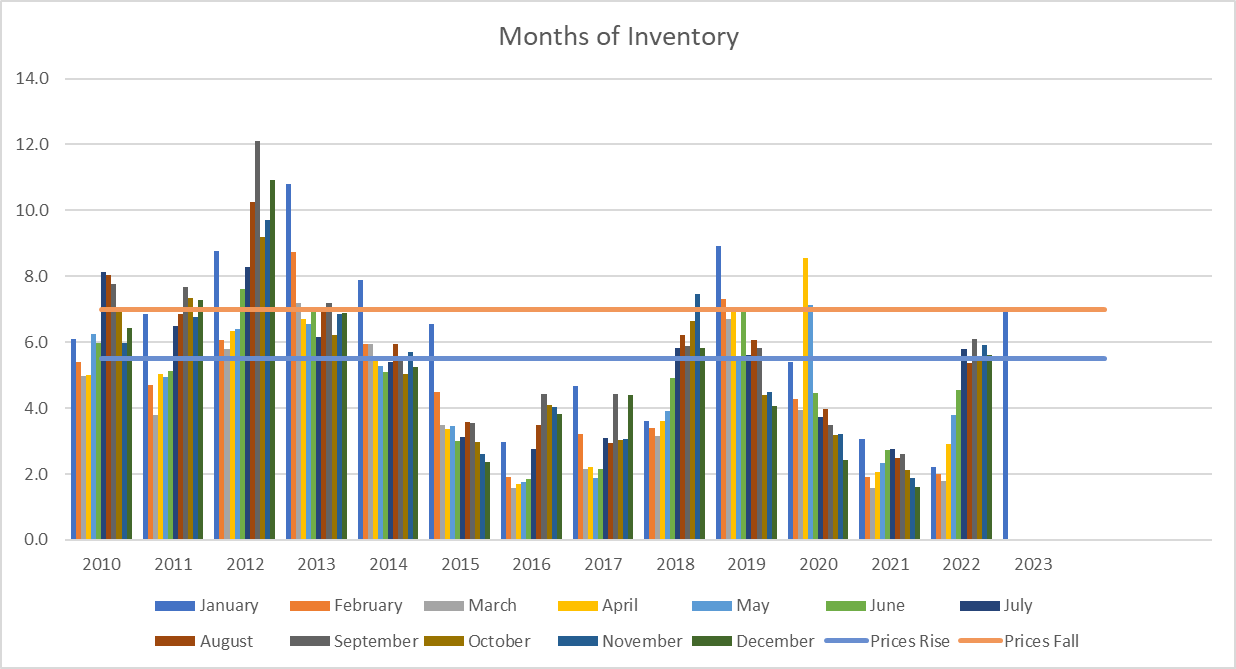
The most reliable indicator of market prices is the Sales to Active Listings Ratio (SAL). This is the ratio between the number of sales in a given month and the number of active listings at month-end.
In hotter markets in BC, a long-term analysis has shown that prices will usually act in the following ways:
- 7+ Months of Inventory (Under 14% SAL): Prices will likely DECLINE
- 5 – 7 Months of Inventory (14% – 18% SAL): Prices will likely be STABLE
- Less than 5.5 Months of Inventory (Over 18% SAL): Prices will likely RISE
Visit this link to learn more about house prices and inventory.
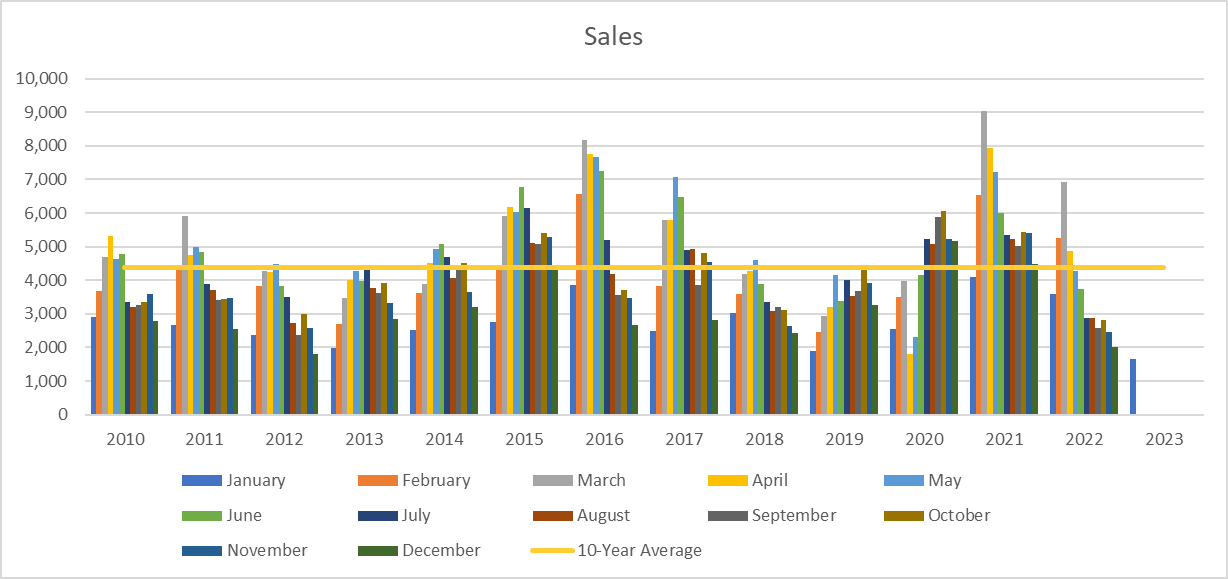
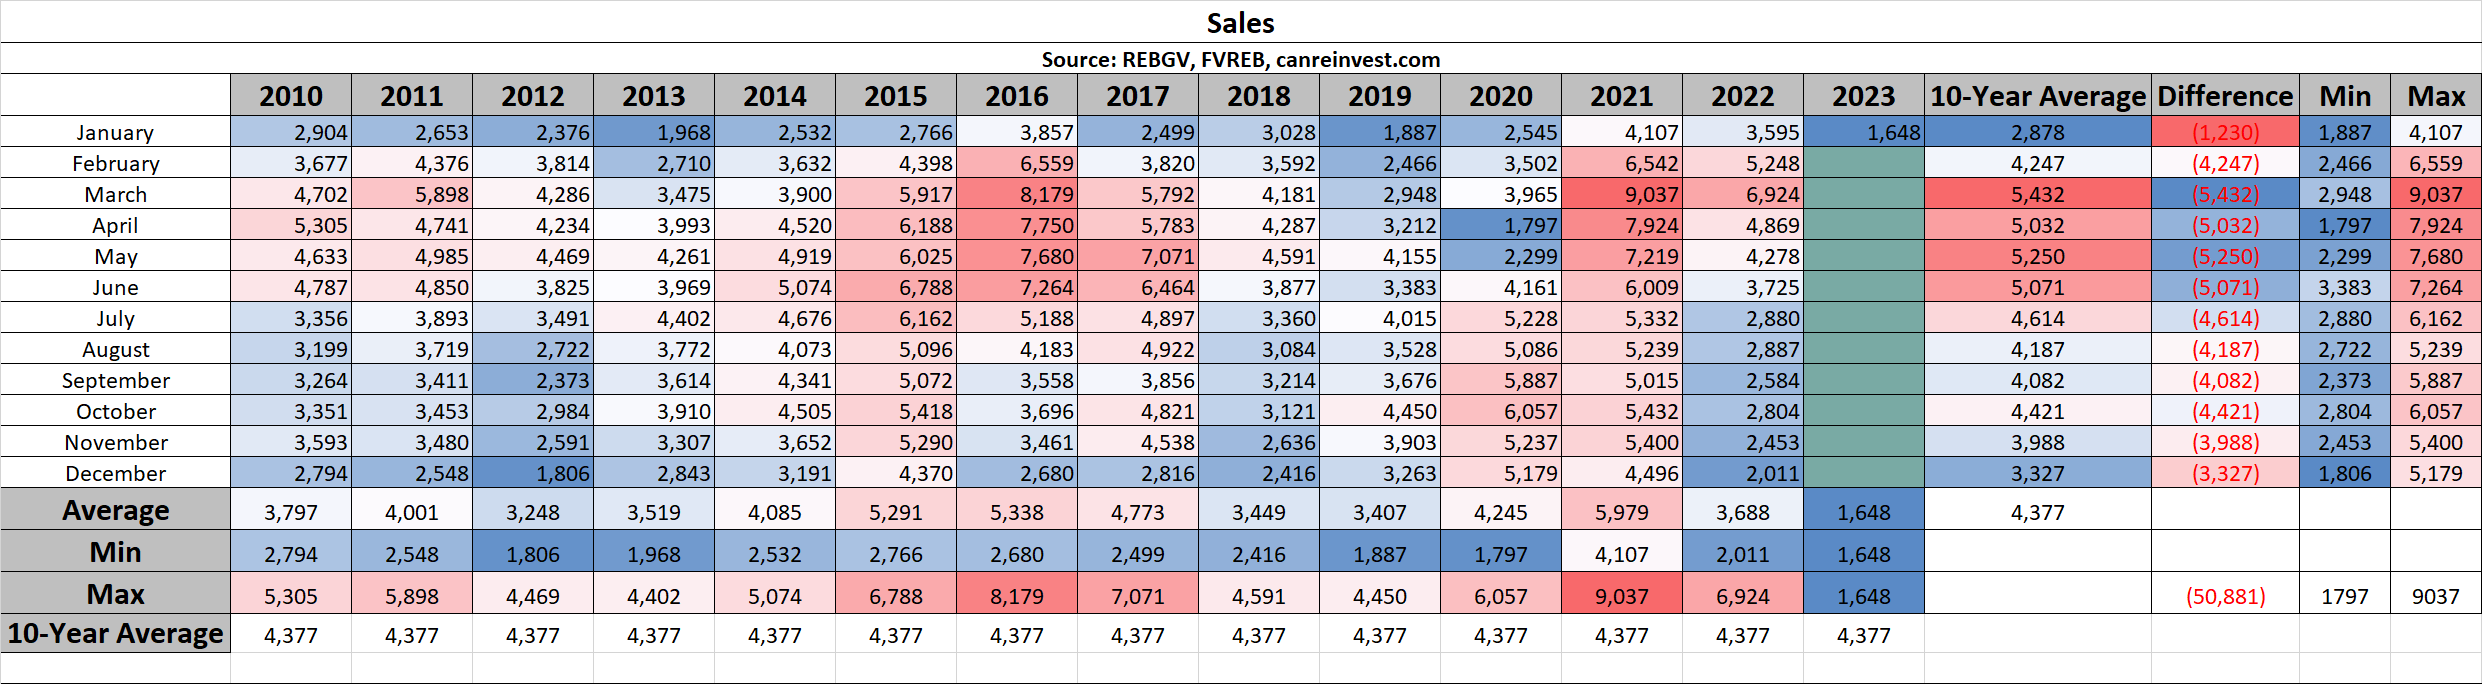
Sales
Sales in January fell to their lowest level in over 10 years, as buyers continued to take a breather to adjust to the new interest rate environment.
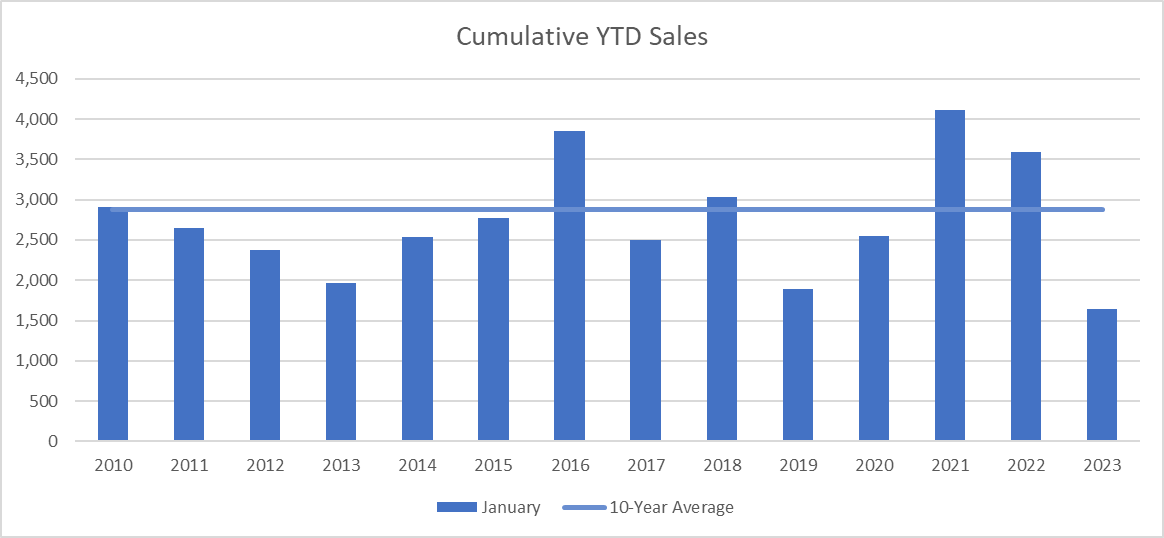
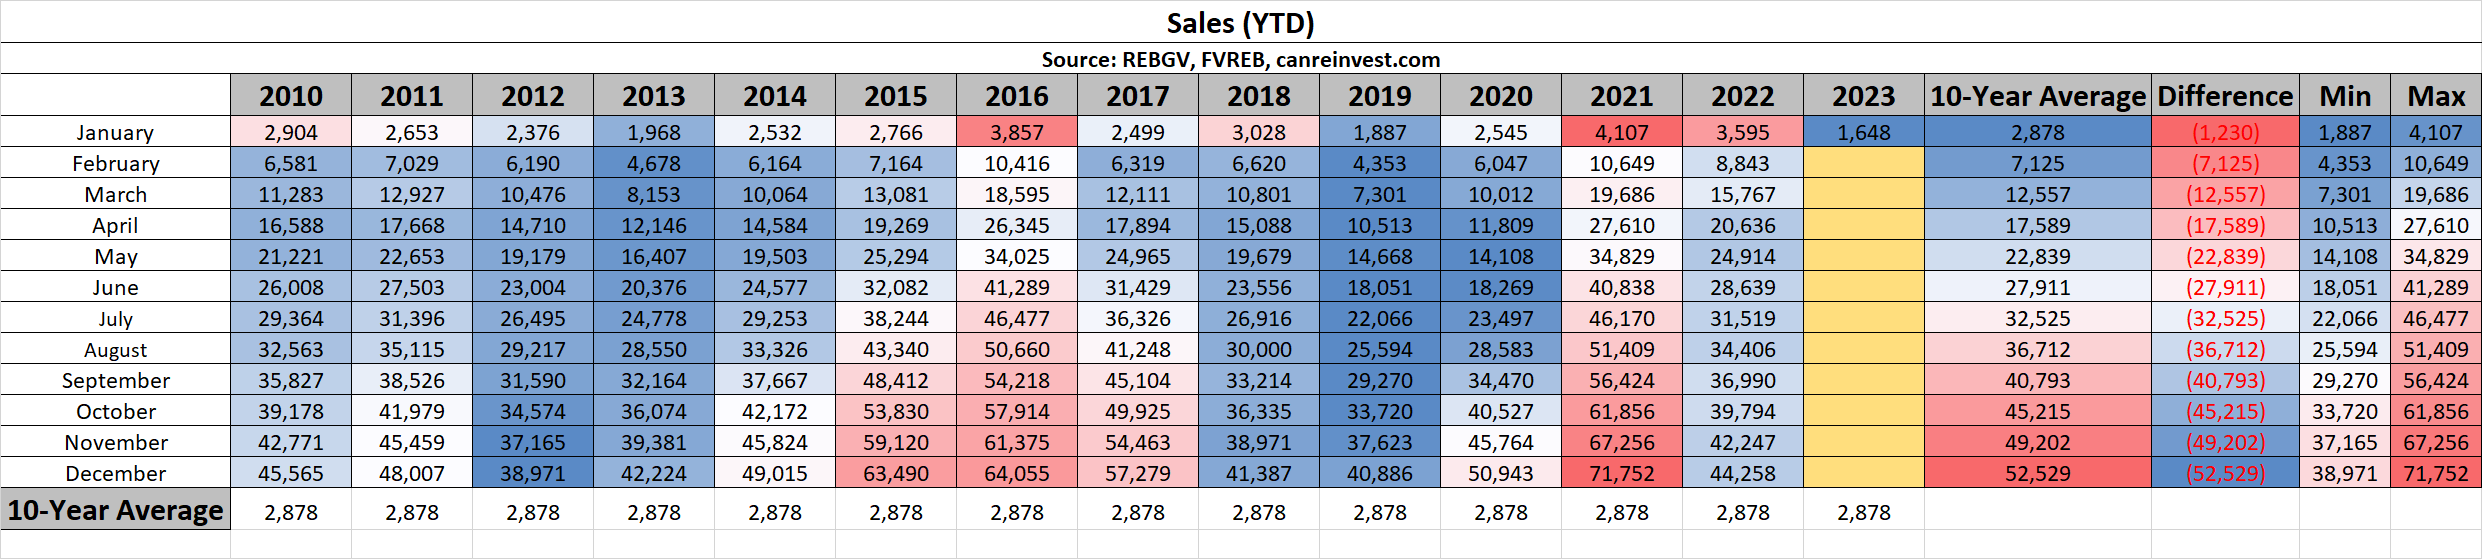
Cumulative Year-to-date Sales
2023 starts off where 2022 ended, with sales (1,648) 40% below the 10-year average (2,878).
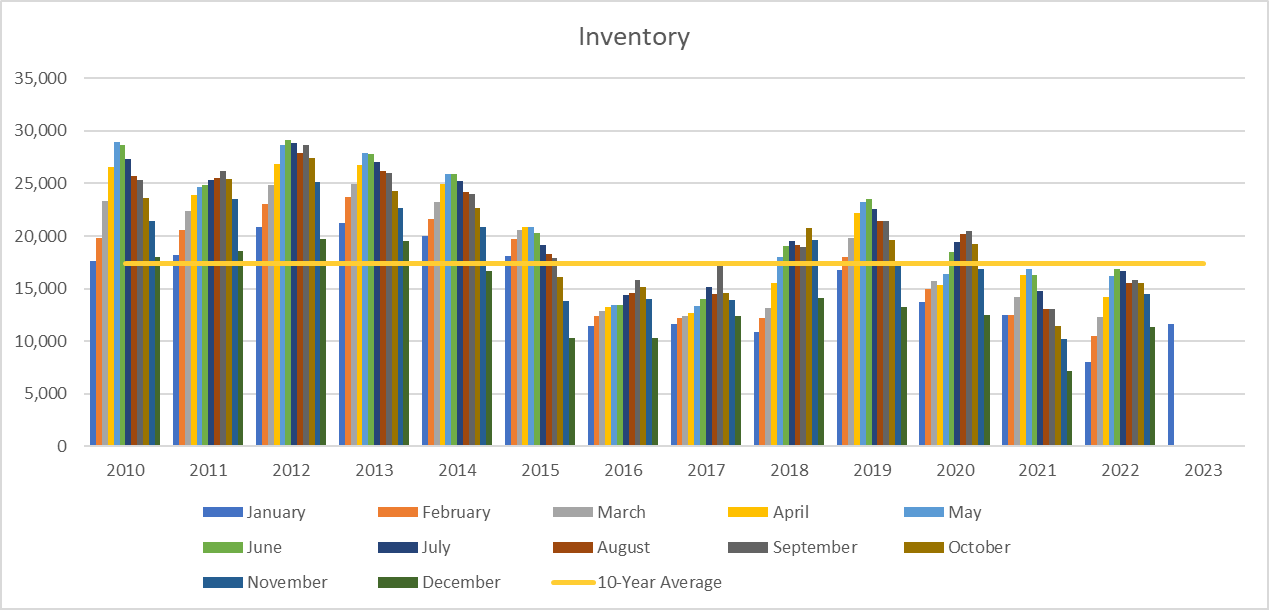
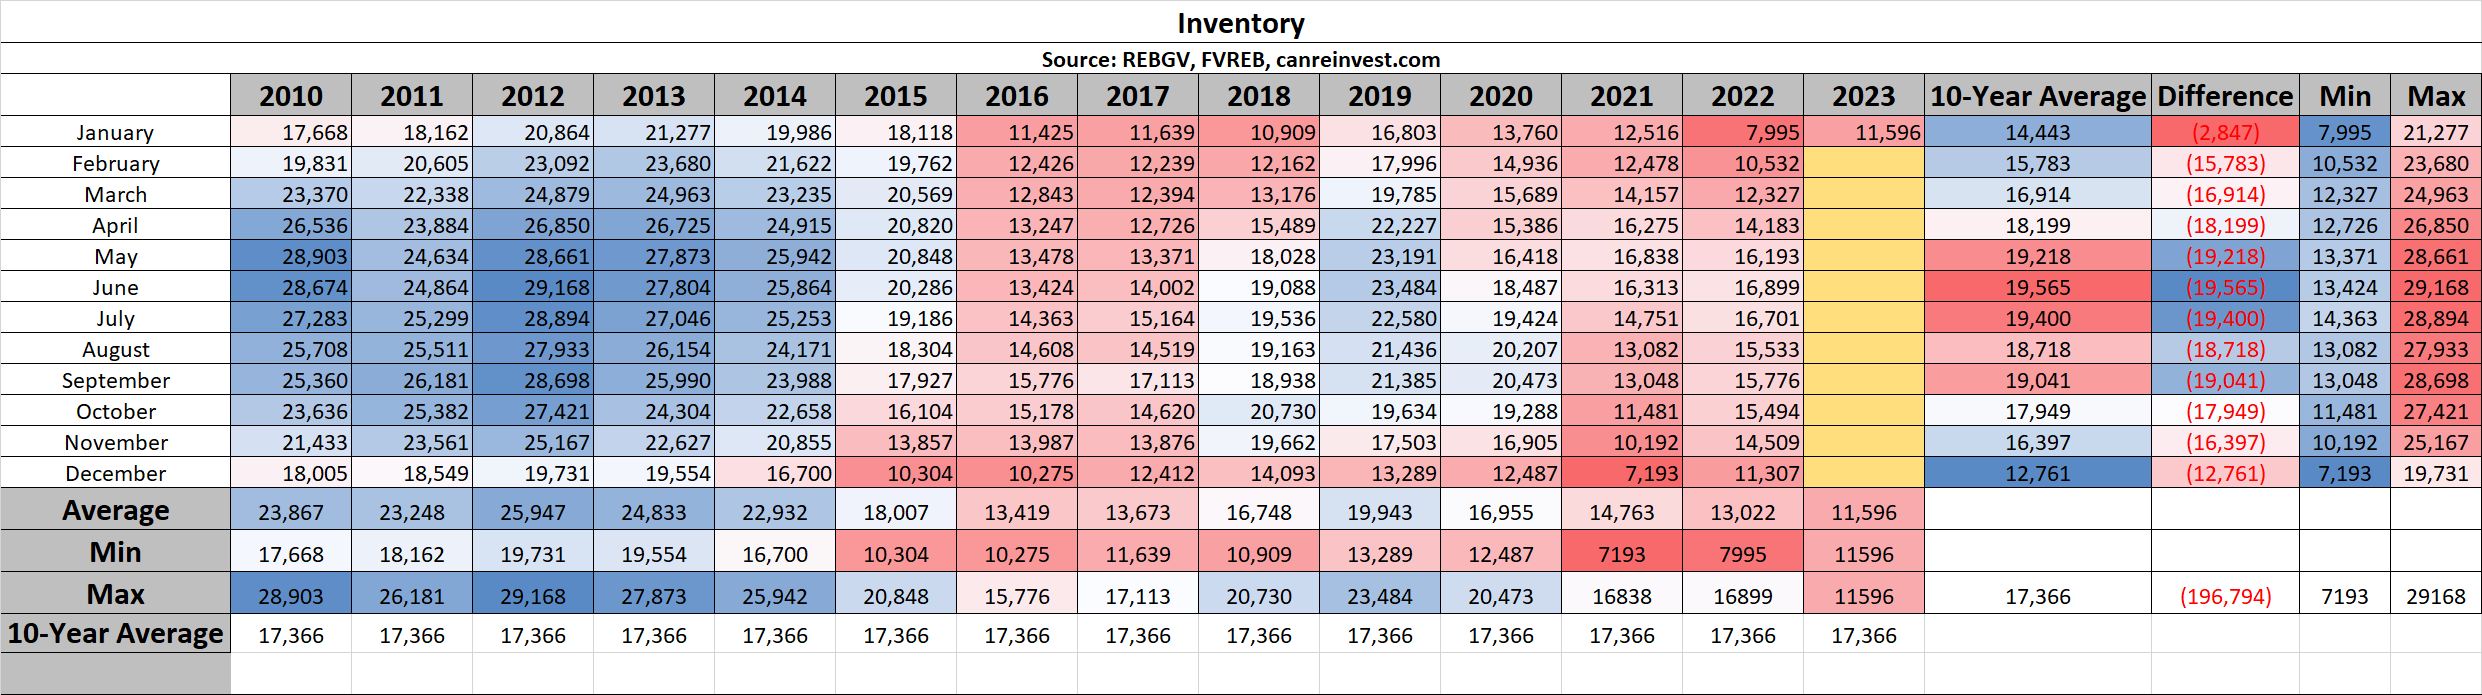
Inventory
January inventory (11,596 active listings) increased only slightly from the previous month, and are 20% below the 10-year average (14,443 average).
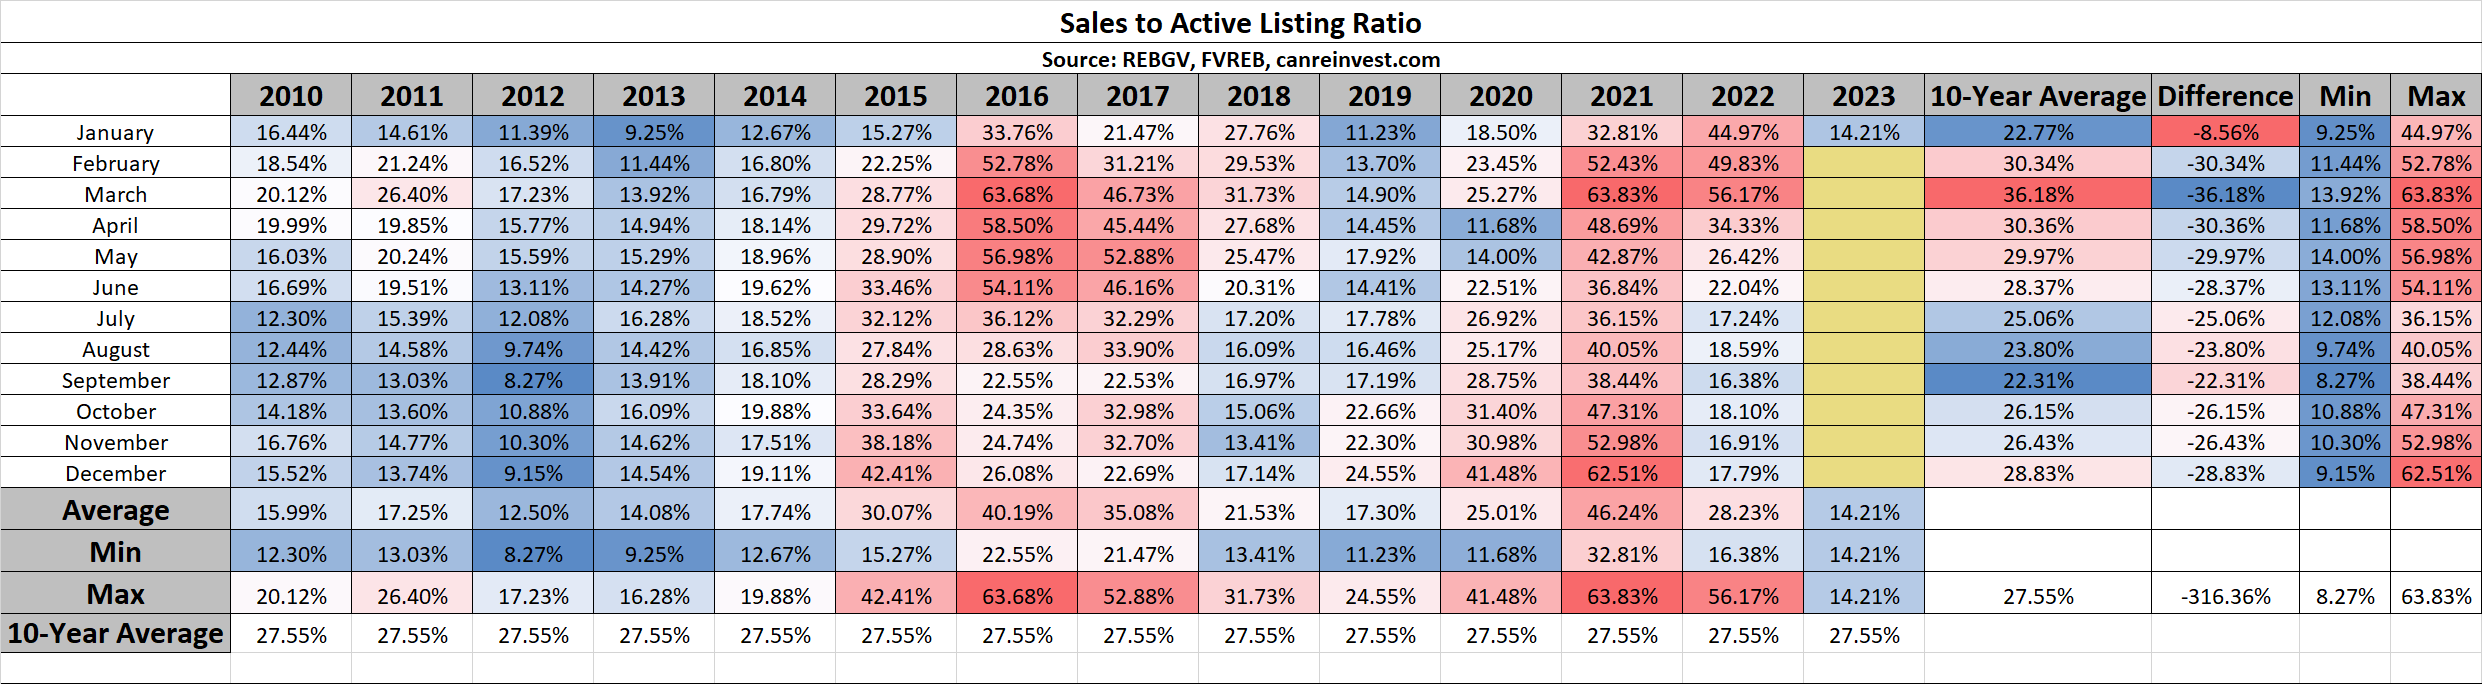
Sales to Active Listings
Despite the low sales, low inventory kept the Sales to Active Listing Ratio above 14%, indicating stabilizing prices.
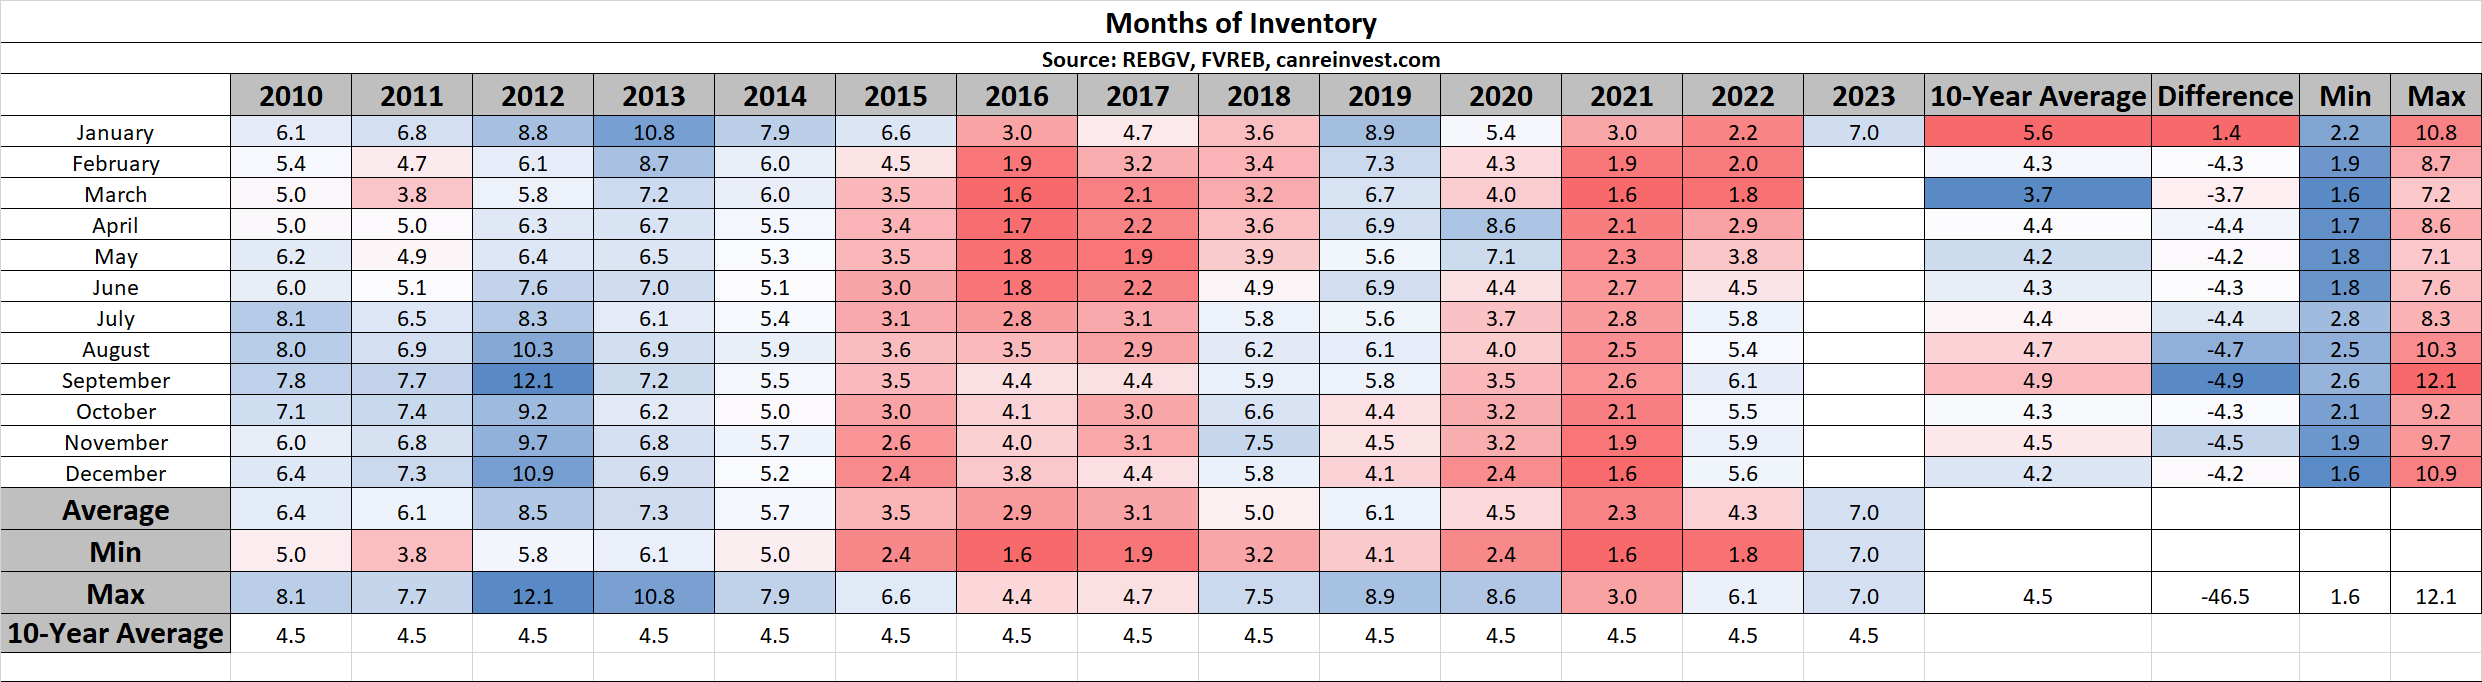
Months of Inventory
Similarly, Months of Inventory rose to 7.0 MOI, indicating a slight buyers’ market.
Want to learn more about these stats or discuss your move to Macdonald Realty?
Check out careersinbcrealestate.com to connect today!