by Macrealty Marketing Team | Dec 7, 2022 | Market Updates
Here are the latest real estate market statistics from Macdonald Realty on Greater Victoria, Saanich Peninsula, Parksville/Qualicum, and Nanaimo listings and sales in November 2022. Find all the infographics related to the November Market Statistics by visiting the Facebook Album.
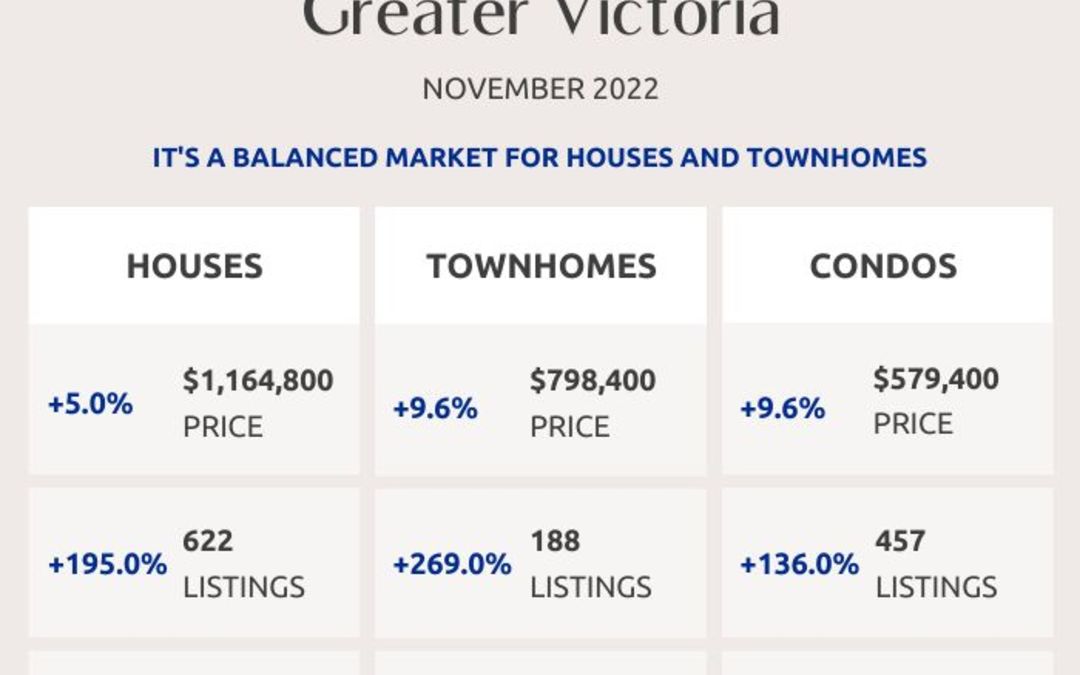
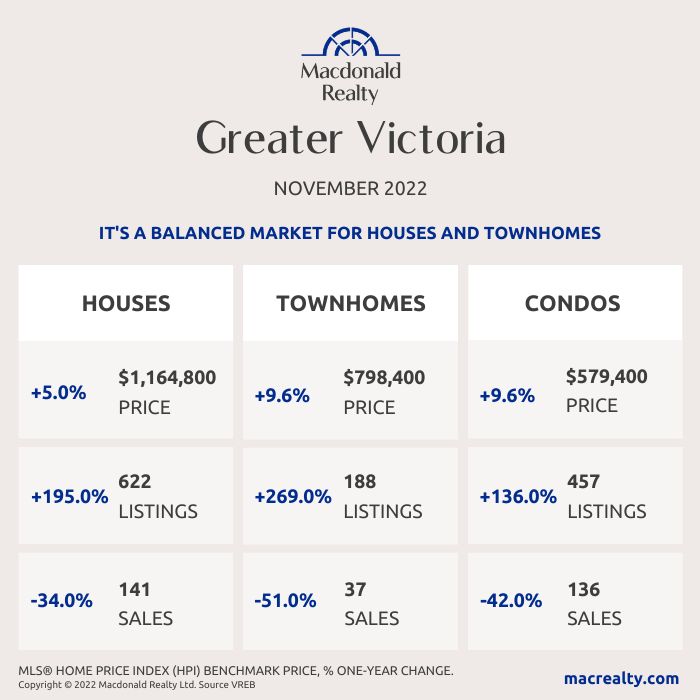
A total of 384 properties sold in the Victoria Real Estate Board region this November, 41.2 per cent fewer than the 653 properties sold in November 2021 and 20 per cent fewer than in October 2022. Sales of condominiums were down 42.4 per cent from November 2021 with 136 units sold. Sales of single family homes decreased 34.1 per cent from November 2021 with 182 sold.
“November saw a significant decrease from last year in the number of home sales recorded, but this was expected as the market continues to settle after the record setting pace of 2021,” says Victoria Real Estate Board President Karen Dinnie-Smyth. “With a small month over month decrease in price, the autumn market has returned to its traditional rhythm as we approach the holiday season. Inventory levels dipped slightly but remain well above this time last year, which is providing buyers with more options.”
There were 2,111 active listings for sale on the Victoria Real Estate Board Multiple Listing Service® at the end of November 2022, a decrease of 3.7 per cent compared to the previous month of October but a 138 per cent increase from the 887 active listings for sale at the end of November 2021.
“Premier Eby’s rapid introduction of changes to the Strata Property Act which remove rental restrictions and age restrictions other than 55 and older from strata developments is raising questions within strata communities. It remains to be seen what effect this may have on the strata market,” adds President Dinnie-Smyth. “It is an open question whether these changes will bring any additional rental stock to the market – with BC’s complex Residential Tenancy Act not all homeowners of vacant strata homes have a desire to become landlords and current interest rates are less attractive to investors who may want to purchase strata rental properties. It is also possible that these measures will contribute further to eroding housing affordability as older stratas with rental restrictions were generally valued lower than their rentable counterparts.”
Greater Victoria
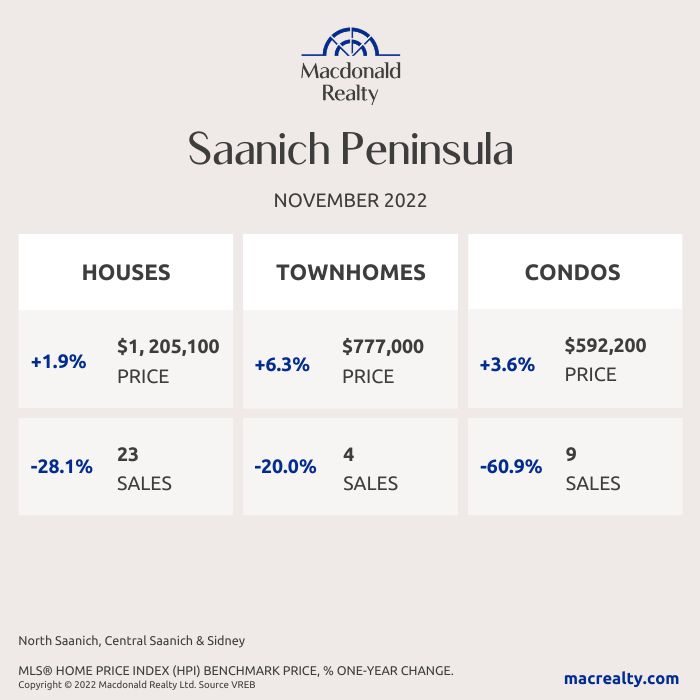
Saanich Peninsula
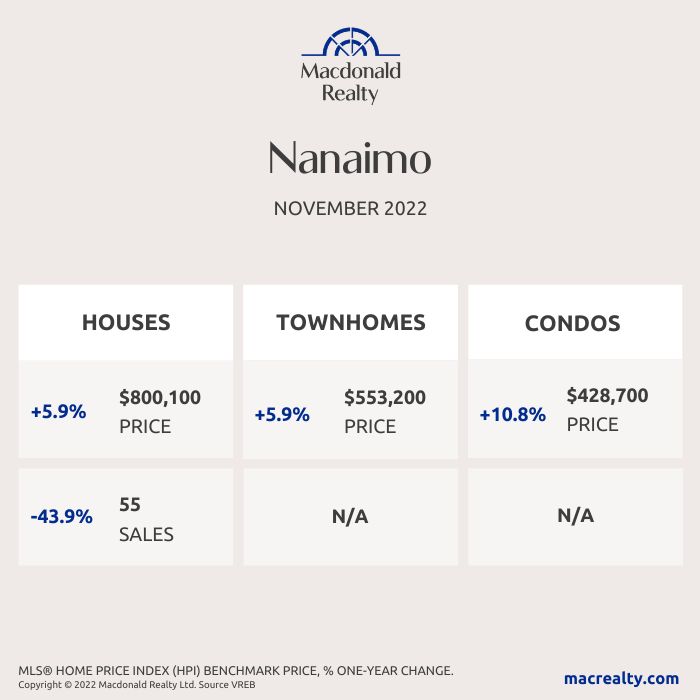
Nanaimo
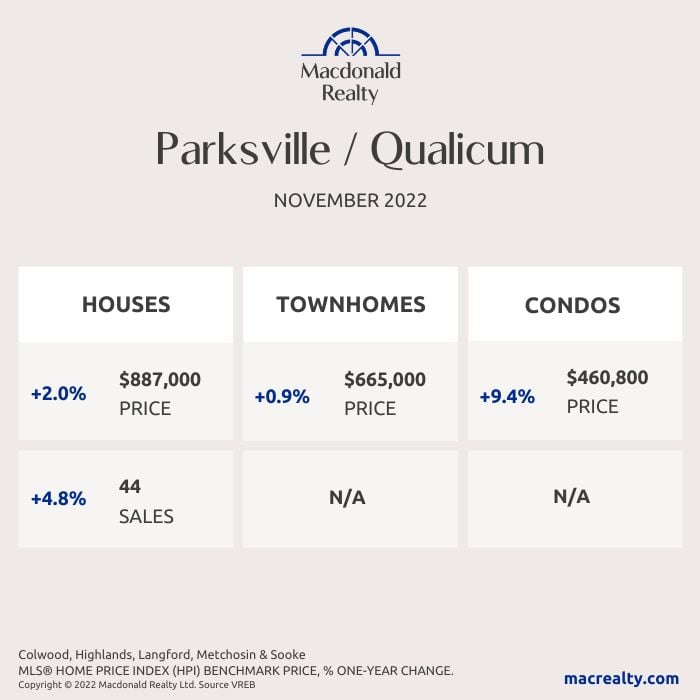
Parksville / Qualicum
Looking for more information about the real estate market in specific neighbourhoods in Victoria, Saanich Peninsula, Parksville, Nanaimo, Vancouver Island and the Gulf Islands?
Macdonald Realty has offices in downtown Victoria, Sidney, Parksville and Salt Spring Island. Please email [email protected] or call 1-877-278-3888 to be matched with a REALTOR® working in your area.
MLS® Home Price Index (HPI) Benchmark Price
Average and median home prices are often misinterpreted, are affected by change in the mix of homes sold, and can swing dramatically from month to month (based on the types and prices of properties that sold in a given month). The MLS® HPI overcomes these shortcomings and uses the concept of a benchmark home, a notional home with common attributes of typical homes in a defined area. Visit www.housepriceindex.ca for more information.
This blog post is based on market data provided by the Victoria Real Estate Board (VREB) www.vreb.org and the Vancouver Island Real Estate Board (VIREB) www.vireb.com. Market data from the VIREB includes listings and sales in Campbell River, Comox Valley, Cowichan Valley Nanaimo, Parksville/Qualicum, Port Alberni/West, North Island, and the Islands.
by Macrealty Marketing Team | Dec 7, 2022 | Market Updates
Here are the latest real estate market statistics from Macdonald Realty on Okanagan listings and sales in November 2022.
Find the infographics by visiting the Facebook Album.
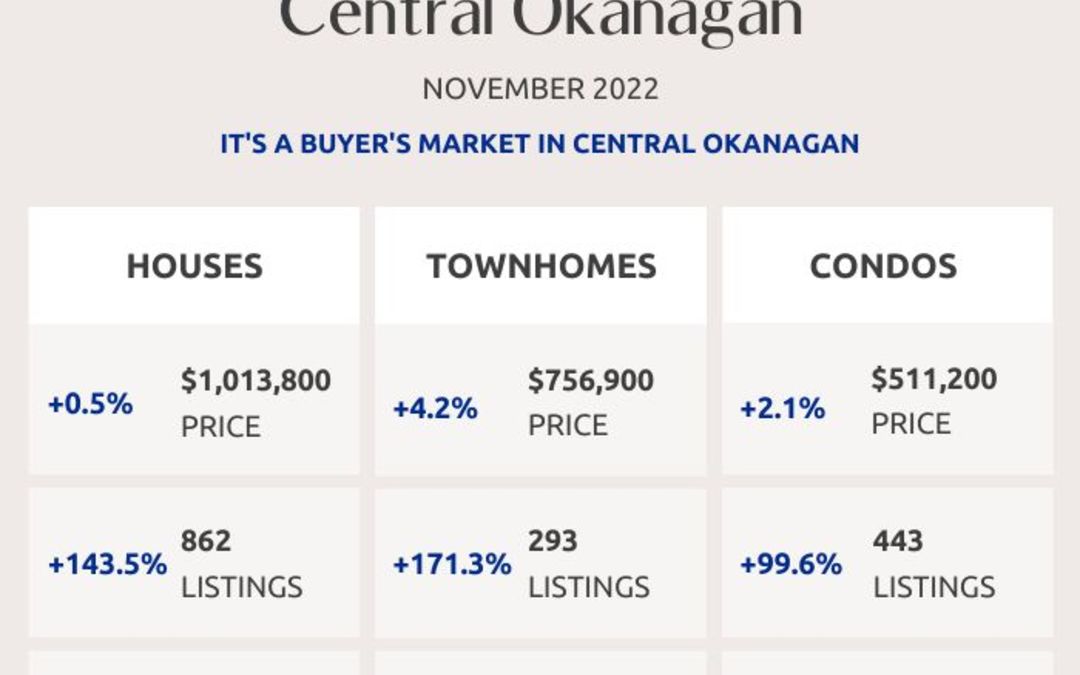
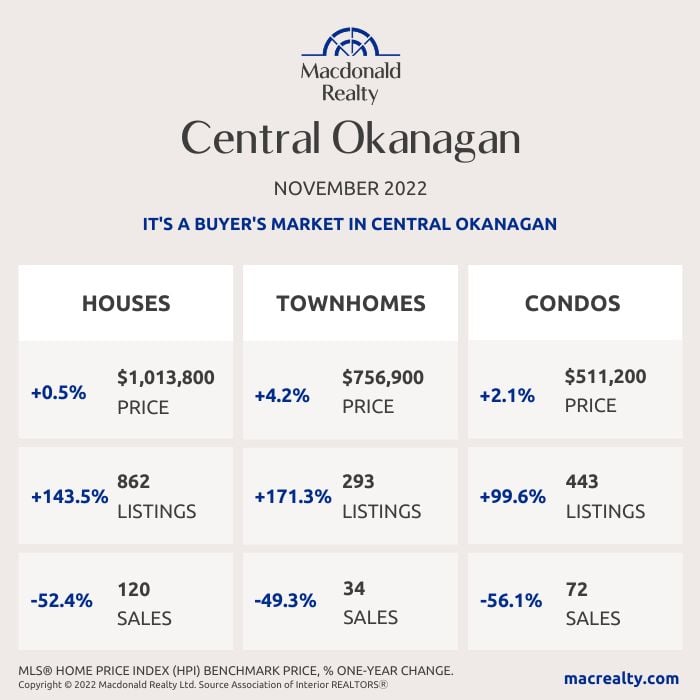
Central Okanagan: Kelowna and Lake Country
There were 120 sales, 862 active listings, and $1,013,800 average sale price for detached homes in the Central Okanagan market, including Kelowna and Lake Country. The condo market featured 72 sales and 443 active listings at the end of the month. The average sale price was $511,200. Townhome sales were 34, active listings were 293 and the average sale price was $756,900. It’s a buyer’s market in Central Okanagan.
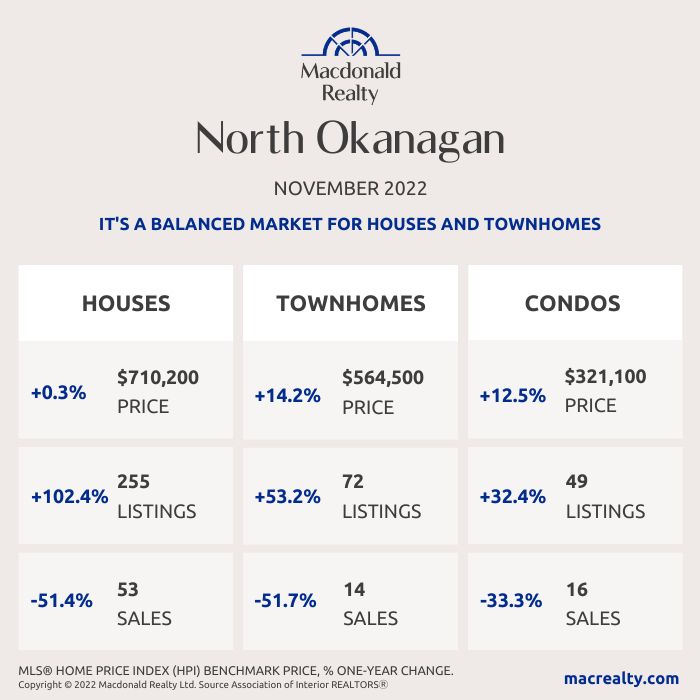
North Okanagan: Vernon and surrounding area
In North Okanagan, including Vernon and the surrounding area and the average detached home sale price was $710,200. At the end of the month, there were 53 sales and 255 active listings. There were 16 sales and 49 active listings for condos. The average sale price was $321,100. In comparison, townhomes featured 14 sales, 72 active listings and a $564,500 average sale price. It’s a balanced market for houses and townhomes in North Okanagan.
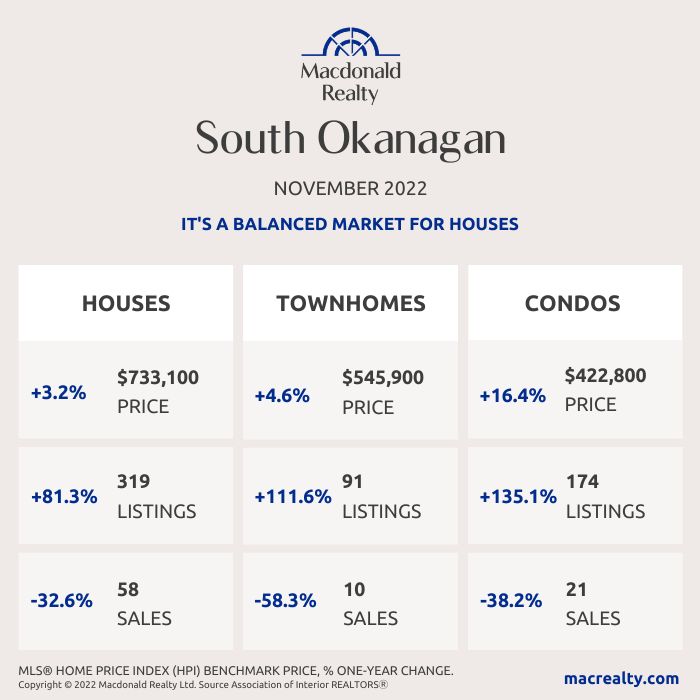
South Okanagan
There were 58 sales, 319 active listings, and $733,100 average sale price for detached homes in the South Okanagan market.
The condo market featured 21 sales and 174 active listings at the end of the month. The average sale price was $422,800. Townhome sales were 10, active listings were 91 and the average sale price was $545,900. It’s a balanced market for houses in South Okanagan.
Looking for more information about the real estate market in specific neighbourhoods in Okanagan?
Macdonald Realty has offices in Kelowna and across BC. Please email [email protected] or call 1-877-278-3888 to be matched with a REALTOR® working in your area.
This blog post is based on market data provided by the Association Of Interior REALTORS® https://www.interiorrealtors.ca/.
by Macrealty Marketing Team | Dec 7, 2022 | Market Updates
According to the Fraser Valley Real Estate Board, new listings lag as Fraser Valley real estate market sees third month of declining sales.
With sales down almost seven per cent from October, and new listings off by more than 20 per cent, the Fraser Valley housing market continues its slowing trend heading into the holiday season. Despite the market slowdown, opportunities are available, as evidenced by brisk turnover time frames.
In November, the Fraser Valley Real Estate Board (FVREB) processed 839 sales on its Multiple Listing Service® (MLS®), a 6.9 per cent decrease compared to October and a decrease of 57.5 per cent compared to November 2021.
“The trends we’ve seen over the past several months will likely continue through to year-end,” said Sandra Benz, President of the Fraser Valley Real Estate Board. “While rate hikes have effectively put many buyers and sellers in a holding pattern, we’re still seeing relatively quick turnover for all housing categories, indicating robust opportunities for properties that are strategically priced.”
The Board received 1,703 new listings in November, a decrease of 22.1 per cent compared to October 2022 and a decrease of 18.8 per cent compared to last year. The month ended with a total active inventory of 5,330, a 5.5 per cent decrease compared to October, and 74.9 per cent more than November of last year.
“The market continues to tighten in response to rising interest rates,” said Board CEO Baldev Gill. “As a result, individuals are facing additional levels of uncertainty regarding the decision to buy or sell a home, underscoring the importance of seeking advice and guidance from a local REALTOR® to mitigate the risks involved.”
Across Fraser Valley in November, the average number of days to sell a single-family detached home was 34 days and a townhome was 28 days. Apartments took, on average, 27 days to sell.
Find all the infographics related to the November Market Statistics by visiting the Facebook Album.
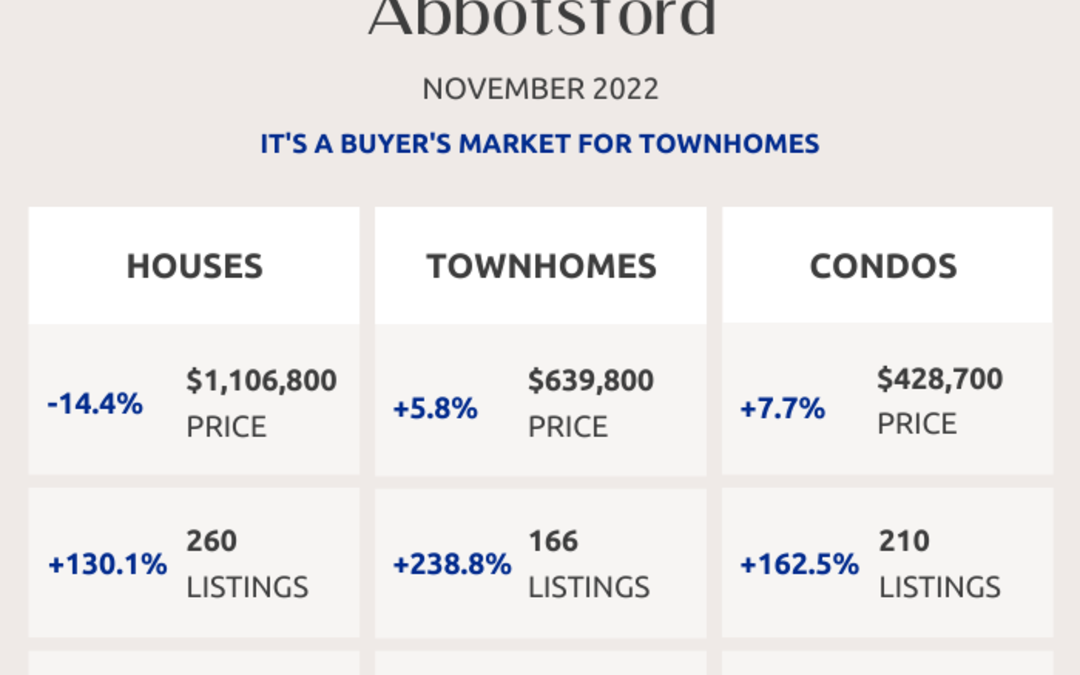
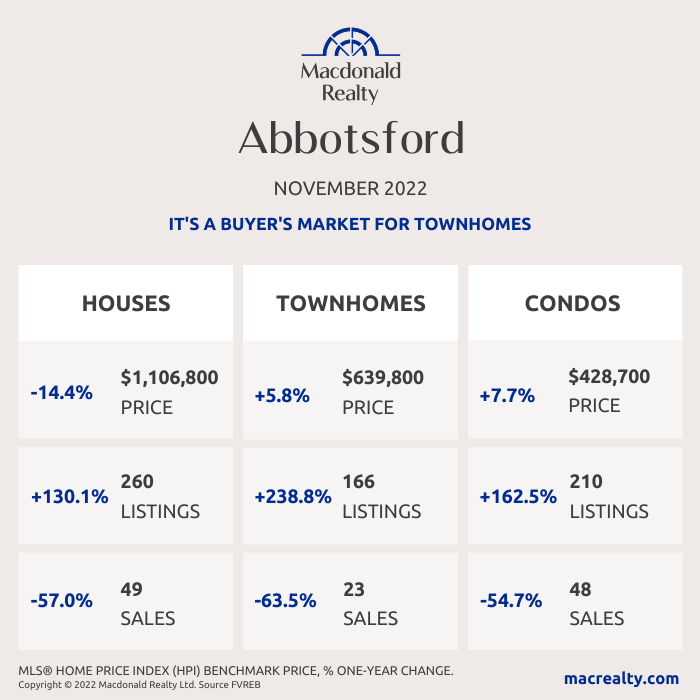
Abbotsford
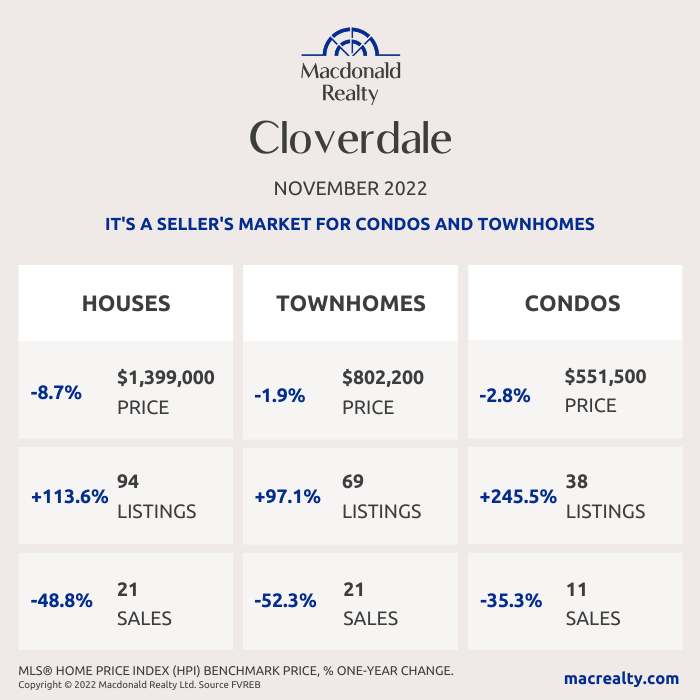
Cloverdale
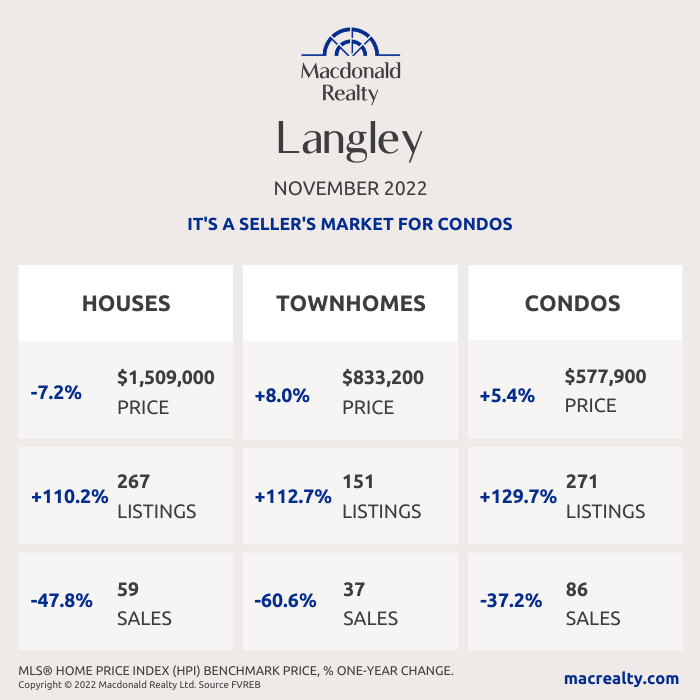
Langley
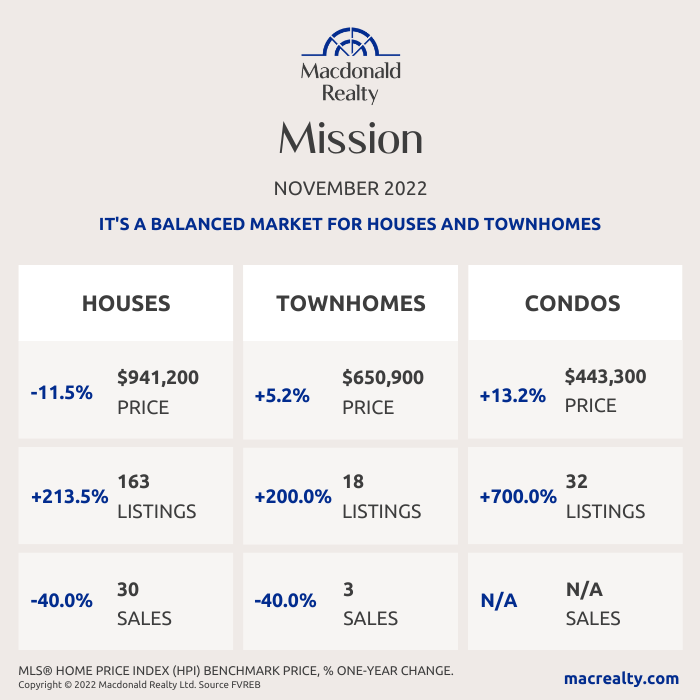
Mission
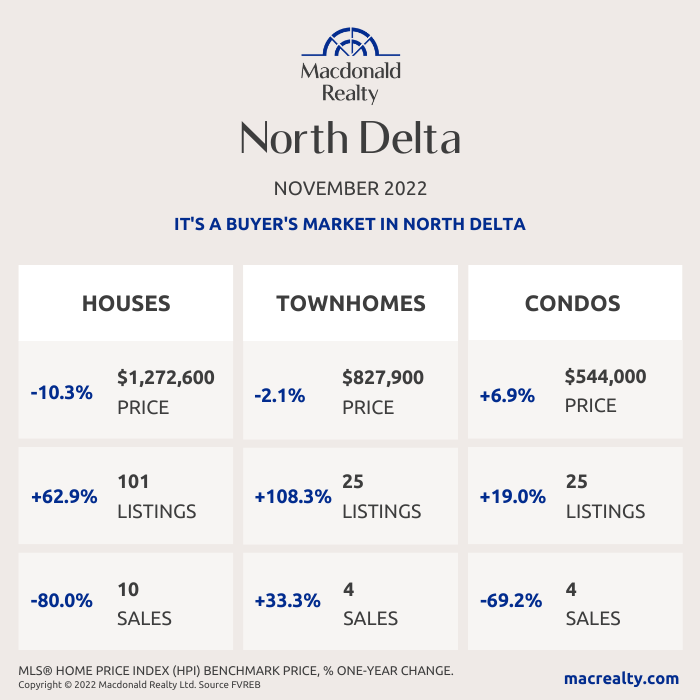
North Delta
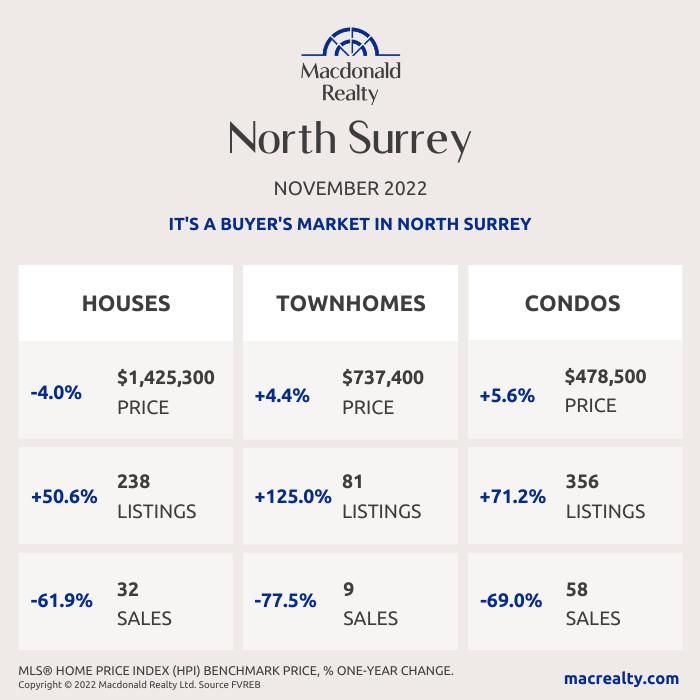
North Surrey
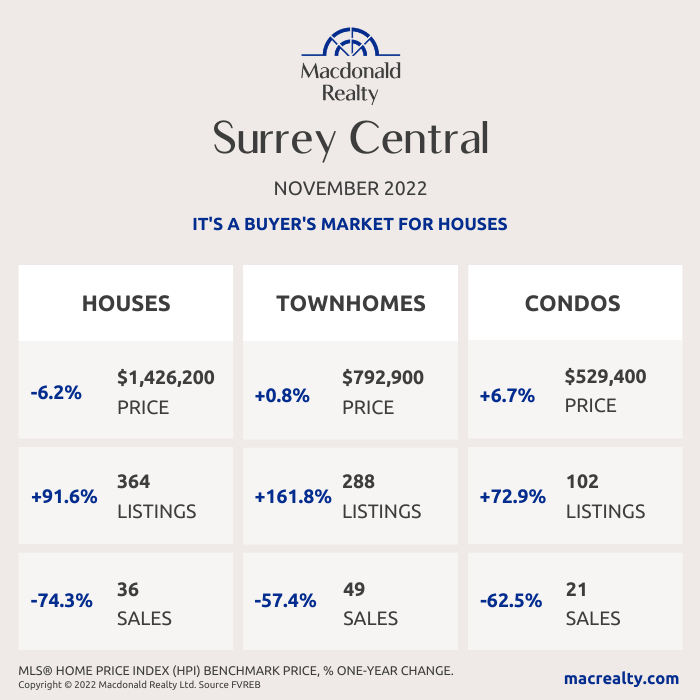
Surrey Central
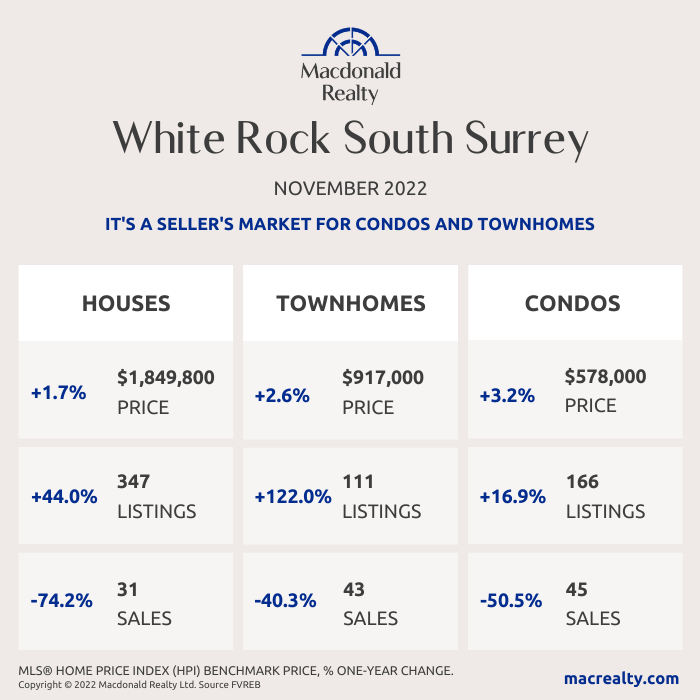
White Rock / South Surrey
Looking for more information about the real estate market in specific neighbourhoods in Surrey, Langley and Fraser Valley?
Macdonald Realty has offices in North Delta, White Rock/South Surrey, and Langley. Please email [email protected] or call 1-877-278-3888 to be matched with a REALTOR® working in your area.
MLS® Home Price Index (HPI) Benchmark Price
Average and median home prices are often misinterpreted, are affected by change in the mix of homes sold, and can swing dramatically from month to month (based on the types and prices of properties that sold in a given month). The MLS® HPI overcomes these shortcomings and uses the concept of a benchmark home, a notional home with common attributes of typical homes in a defined area. Visit www.housepriceindex.ca for more information.
This blog post is based on market data provided by the Fraser Valley Real Estate Board (FVREB) www.fvreb.bc.ca
by Macrealty Marketing Team | Dec 7, 2022 | Market Updates
Here are the latest real estate market statistics from Macdonald Realty on Squamish, Whistler, and Sunshine Coast listings and sales in November 2022.
Find all the infographics related to the November Market Statistics by visiting the Facebook Album.
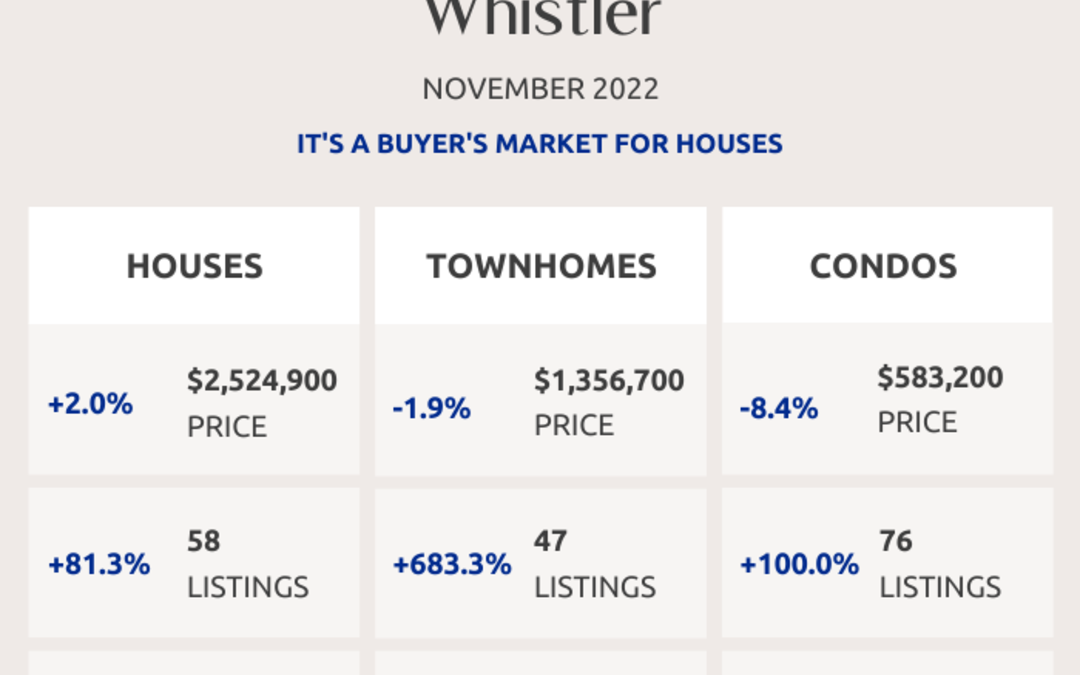
Whistler
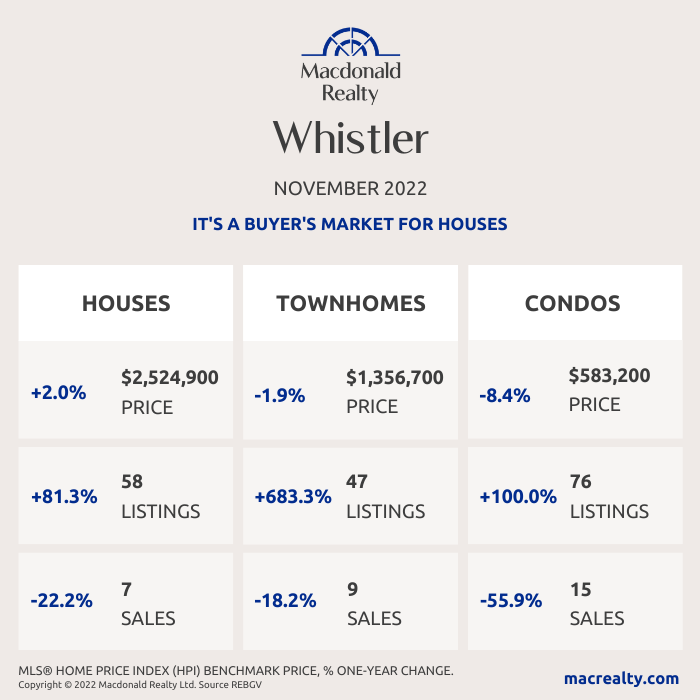
In November 2022, there were 7 sales of detached homes and 58 active listings. The benchmark sale price was $2,524,900.
The condo market had 15 sales and 76 active listings at the end of the month. The benchmark sale price was $583,200.
The townhome market had 9 sales and the active listings were 47. The benchmark sale price was $1,356,700.
It’s a buyer’s market for houses in Whistler.
Squamish
In November 2022, there were 11 sales of detached homes and 94 active listings. The benchmark sale price was $1,619,900.
The condo market had 11 sales and 39 active listings at the end of the month. The benchmark sale price was $516,300.
The townhome market had 8 sales and, the active listings were 24. The benchmark sale price was $957,200.
It’s a seller’s market for condos and townhomes in Squamish.

Sunshine Coast
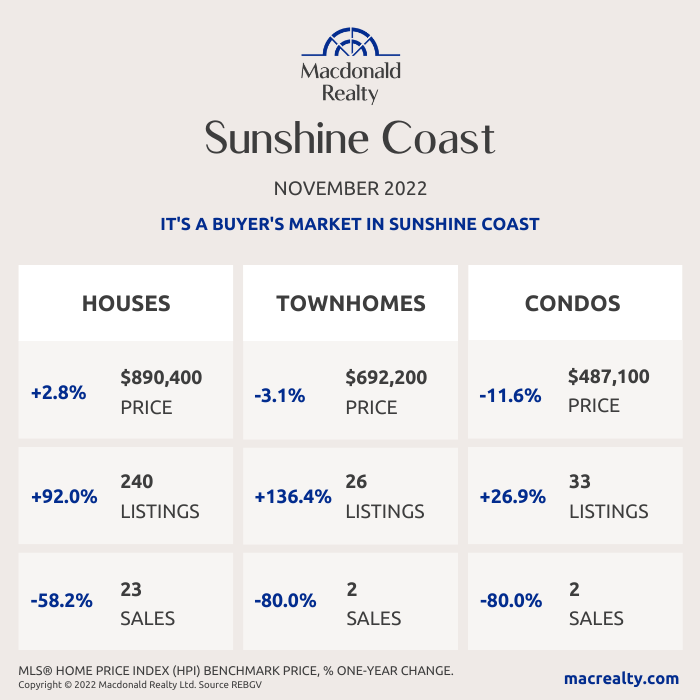
In November 2022, there were 23 sales of detached homes and 240 active listings. The benchmark sale price was $890,400.
The condo market had 2 sales and 33 active listings at the end of the month.
The townhome market had 2 sales and, the active listings were 26.
It’s a buyer’s market in Sunshine Coast.
Looking for more information about the real estate market in specific neighbourhoods in Squamish, Whistler, and Sunshine Coast? Macdonald Realty has offices in Squamish, Whistler, and Sunshine Coast. Please email [email protected] or call 1-877-278-3888 to be matched with a REALTOR® working in your area.
MLS® Home Price Index (HPI) Benchmark Price
Average and median home prices are often misinterpreted, are affected by change in the mix of homes sold, and can swing dramatically from month to month (based on the types and prices of properties that sold in a given month). The MLS® HPI overcomes these shortcomings and uses the concept of a benchmark home, a notional home with common attributes of typical homes in a defined area. Visit www.housepriceindex.ca for more information.
This blog post is based on market data provided by the Real Estate Board of Greater Vancouver (REBGV) www.rebgv.org
by Macrealty Marketing Team | Dec 7, 2022 | Market Updates
Here are the latest real estate market statistics from Macdonald Realty on the Greater Vancouver listings and sales in November 2022. Find all the infographics by visiting the Facebook Album.
While typically a quiet month of market activity based on seasonal patterns, November home sale and listing totals lagged below the region’s long-term averages.
The Real Estate Board of Greater Vancouver (REBGV) reports that residential home sales in the region totalled 1,614 in November 2022, a 52.9 per cent decrease from the 3,428 sales recorded in November 2021, and a 15.2 per cent decrease from the 1,903 homes sold in October 2022.
Last month’s sales were 36.9 per cent below the 10-year November sales average.
“With the most recent core inflation metrics showing a stubborn reluctance to respond significantly to the furious pace of rate increases, the Bank of Canada may choose to act more forcefully to bring inflation back toward target levels.” Andrew Lis, REBGV’s director, economics and data analytics said. “While it’s always difficult to predict what the bank will do with certainty, this persistent inflationary backdrop sets up the December 7* rate announcement to be yet another increase, making holiday-season home purchases something many people may end up foregoing this year.”
There were 3,055 detached, attached and apartment properties newly listed for sale on the Multiple Listing Service® (MLS®) in Metro Vancouver in November 2022. This represents a 22.9 per cent decrease compared to the 3,964 homes listed in November 2021 and a 24.2 per cent decrease compared to October 2022 when sellers listed 4,033 homes.
The total number of homes currently listed for sale on the MLS® system in Metro Vancouver is 9,179, a 28.5 per cent increase compared to November 2021 (7,144) and a 6.8 per cent decrease compared to October 2022 (9,852).
*Areas covered by the Real Estate Board of Greater Vancouver include Burnaby, Coquitlam, Maple Ridge, New Westminster, North Vancouver, Pitt Meadows, Port Coquitlam, Port Moody, Richmond, South Delta, Squamish, Sunshine Coast, Vancouver, West Vancouver, and Whistler. Check out the infographics of Squamish, Sunshine Coast and Whistler, HERE.
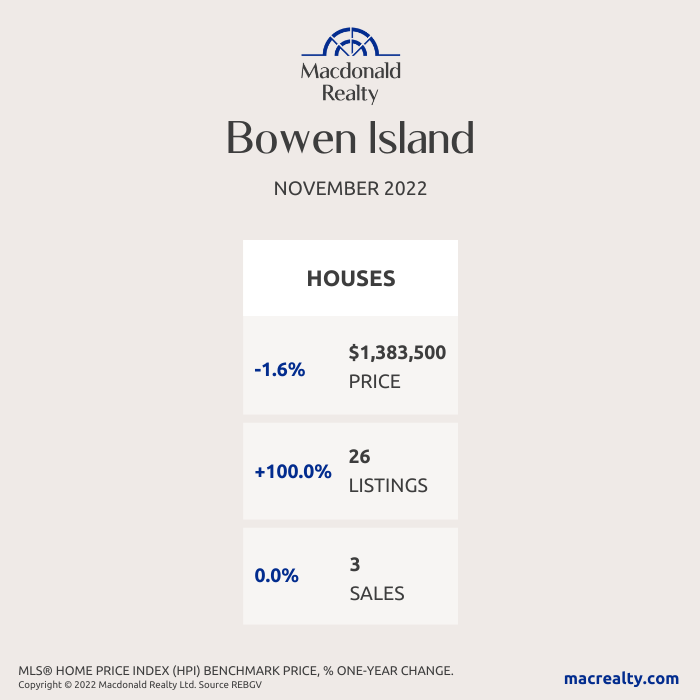
Bowen Island
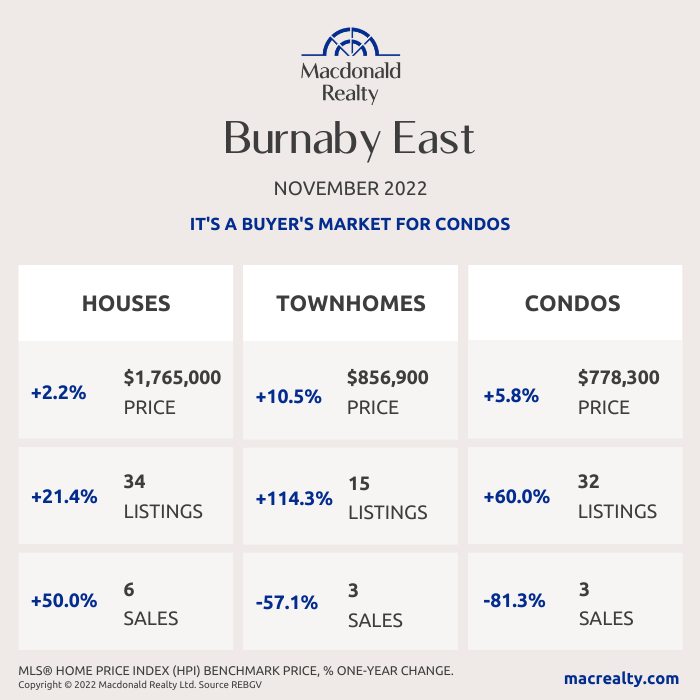
Burnaby East
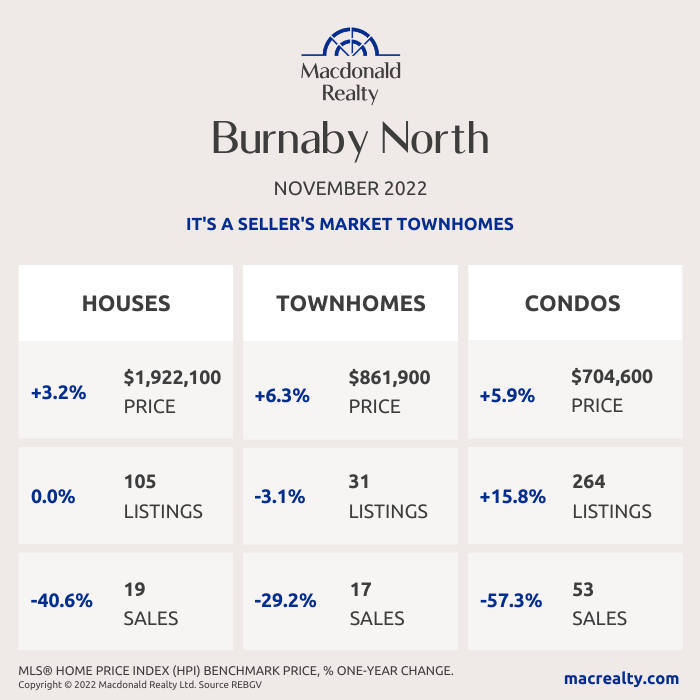
Burnaby North
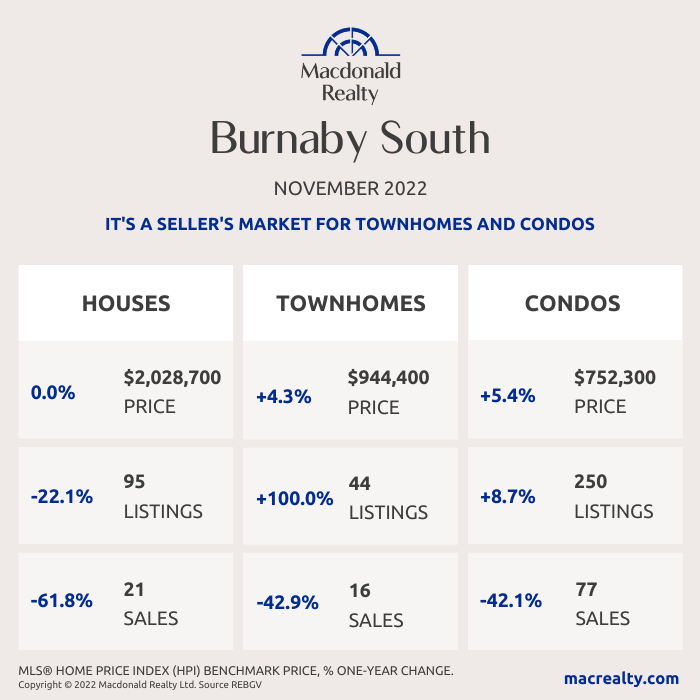
Burnaby South
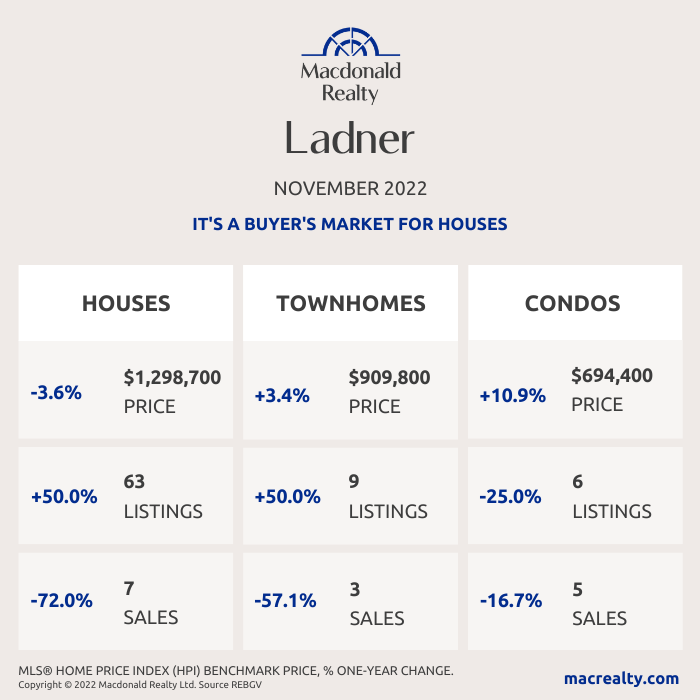
Ladner
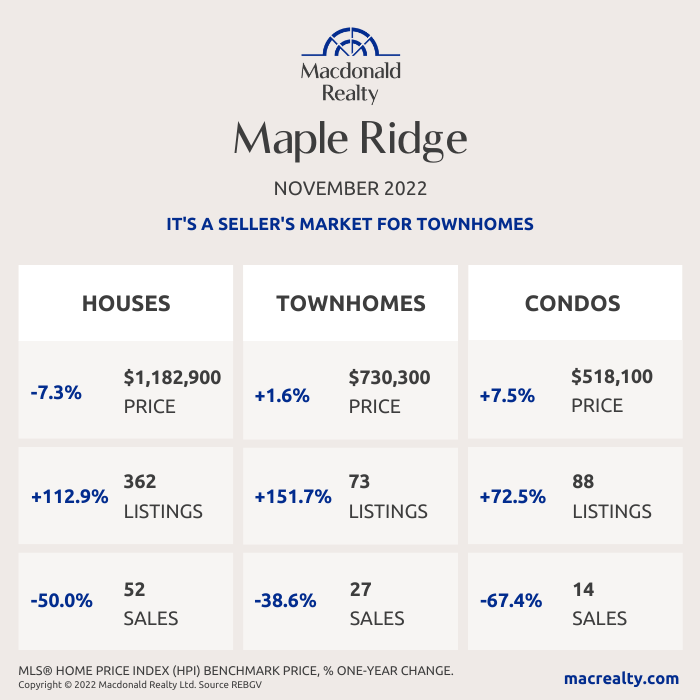
Maple Ridge
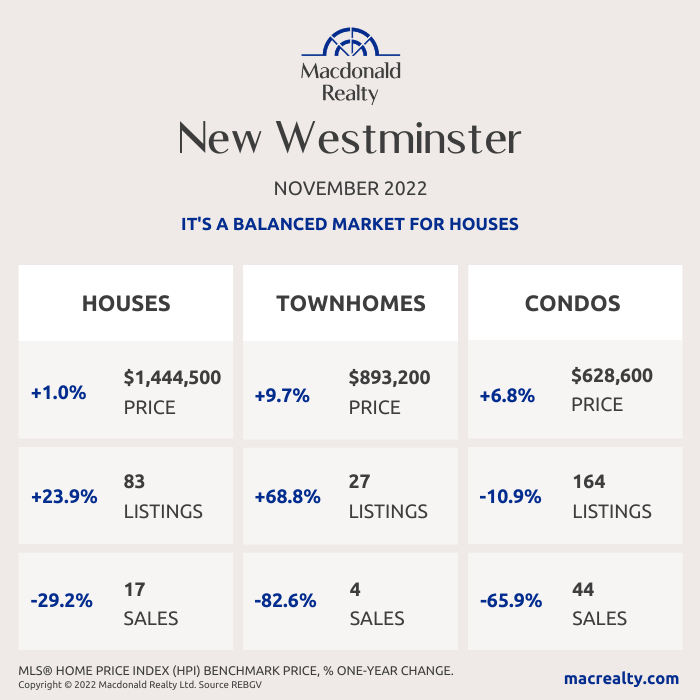
New Westminster
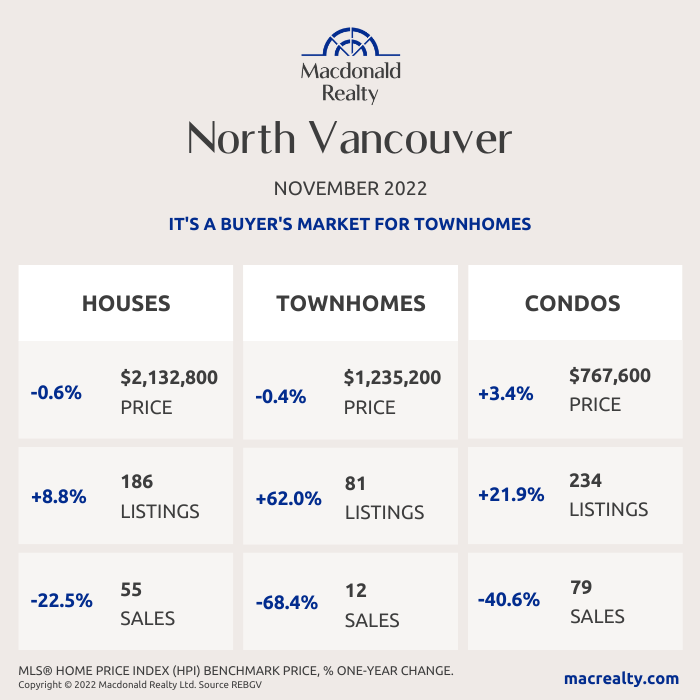
North Vancouver
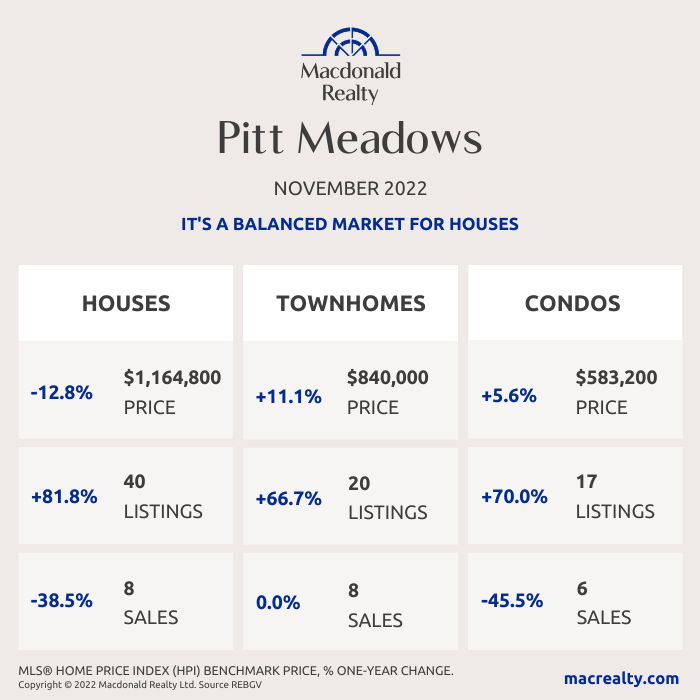
Pitt Meadows
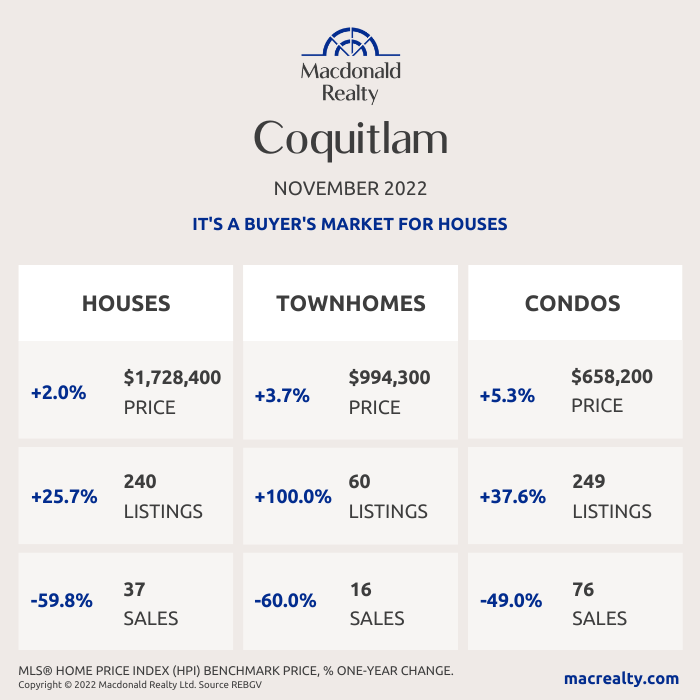
Coquitlam
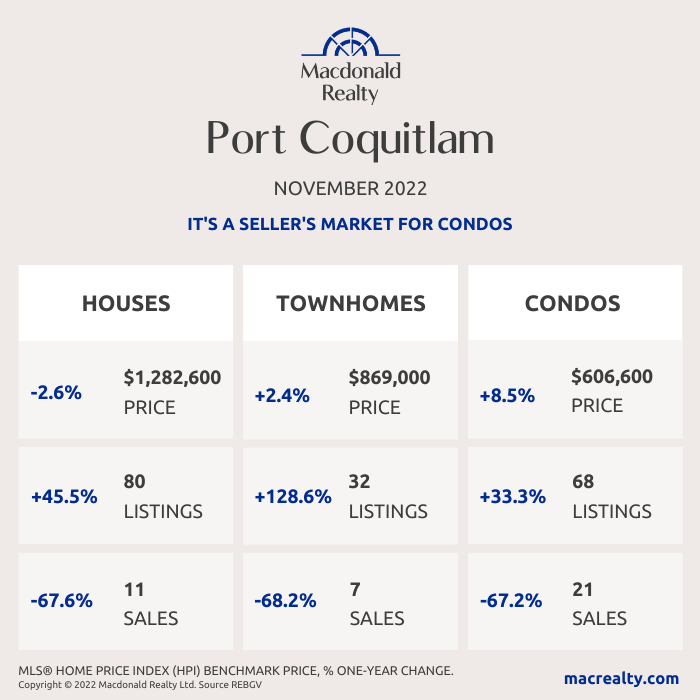
Port Coquitlam
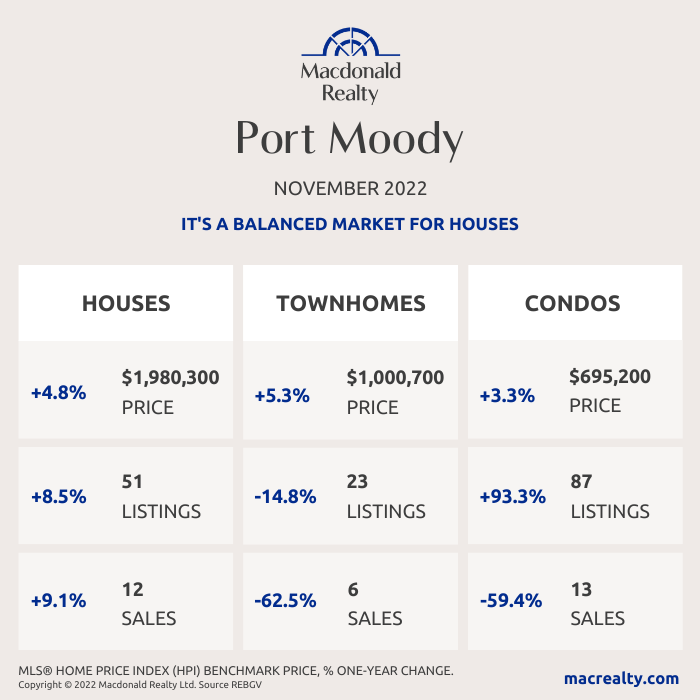
Port Moody
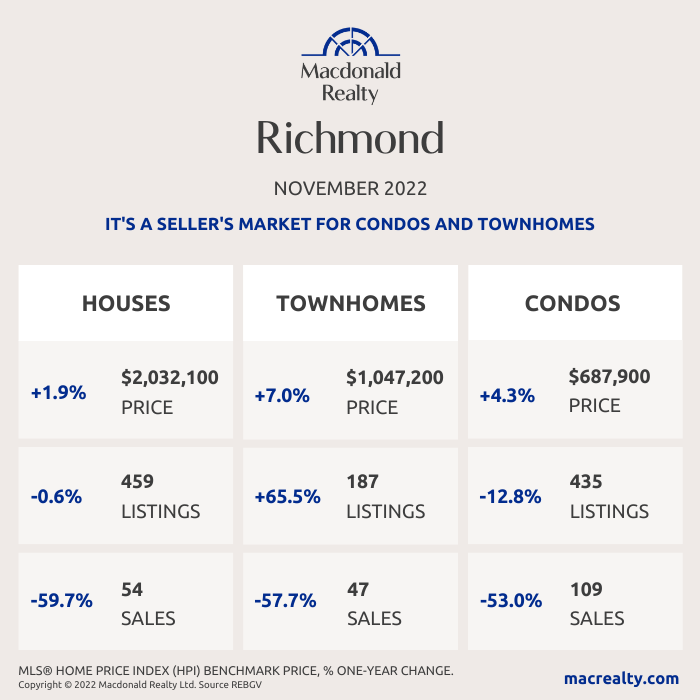
Richmond
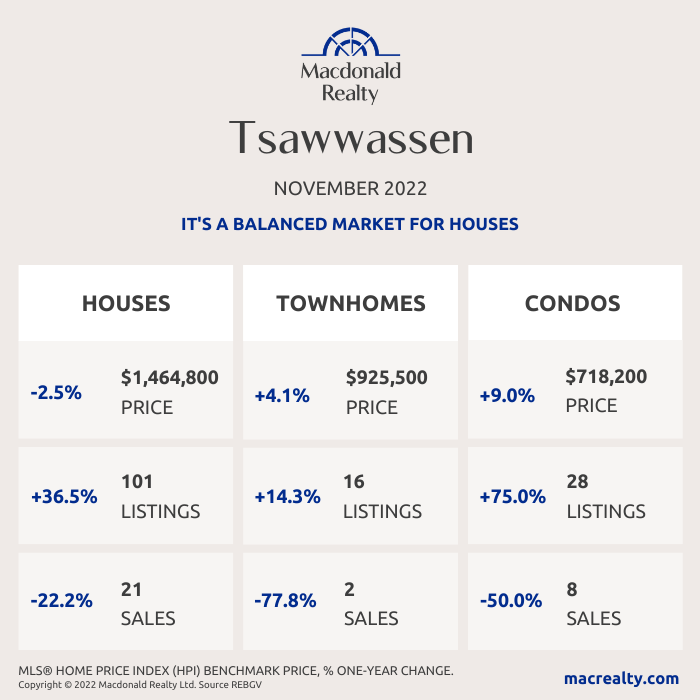
Tsawwassen
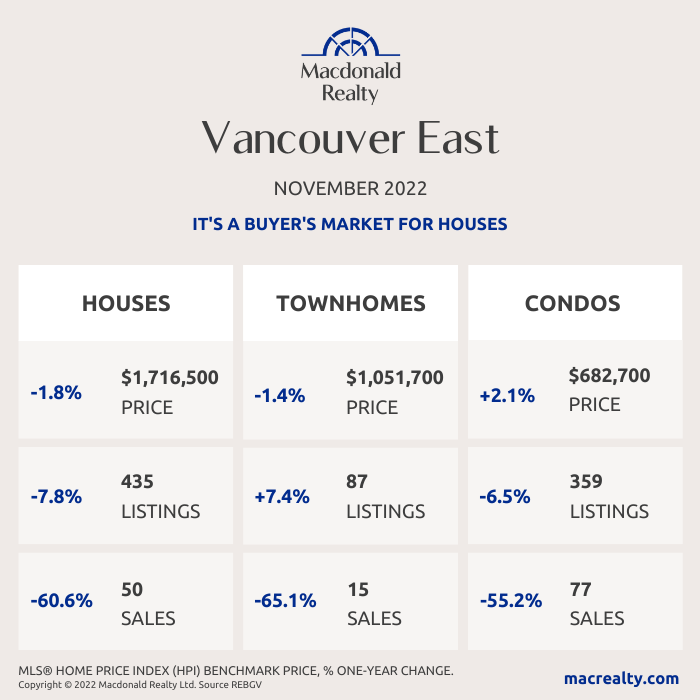
Vancouver East
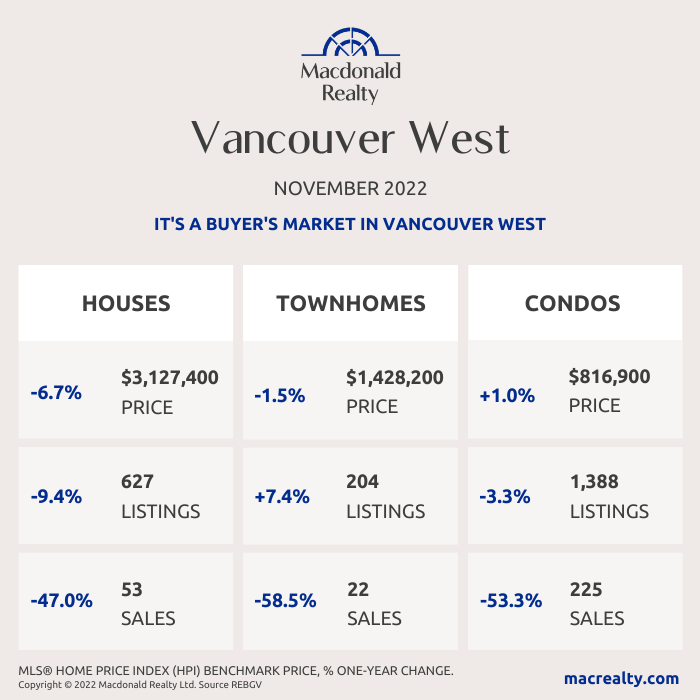
Vancouver West
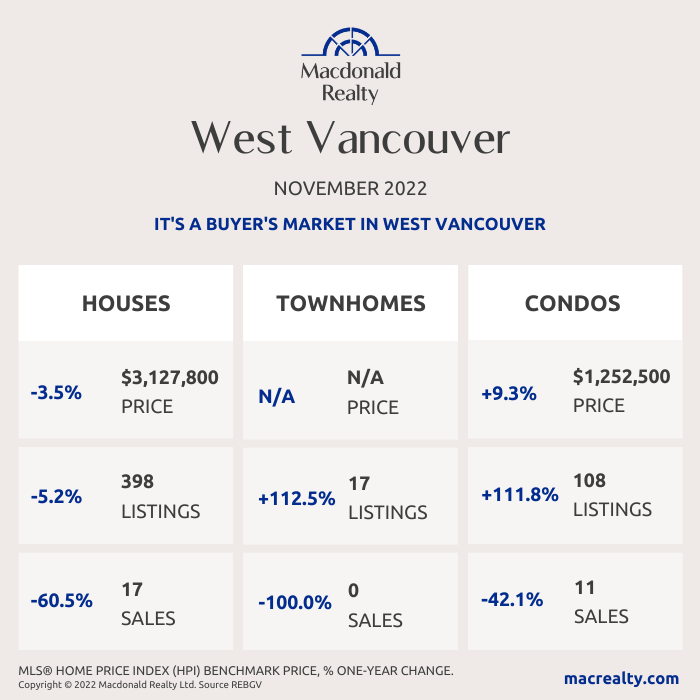
West Vancouver
Looking for more information about the real estate market in specific neighbourhoods in the Greater Vancouver?
Macdonald Realty has offices across the Greater Vancouver. Please email [email protected] or call 1-877-278-3888 to be matched with a REALTOR® working in your area.
MLS® Home Price Index (HPI) Benchmark Price
Average and median home prices are often misinterpreted, are affected by change in the mix of homes sold, and can swing dramatically from month to month (based on the types and prices of properties that sold in a given month). The MLS® HPI overcomes these shortcomings and uses the concept of a benchmark home, a notional home with common attributes of typical homes in a defined area. Visit www.housepriceindex.ca for more information.
This blog post is based on market data provided by the Real Estate Board of Greater Vancouver (REBGV) www.rebgv.org
by Macrealty Marketing Team | Dec 6, 2022 | Market Updates
December 2022 – Lower Mainland Monthly Update (REBGV & FVREB)
Metro Vancouver & Fraser Valley sales are at their lowest in over 10 years.
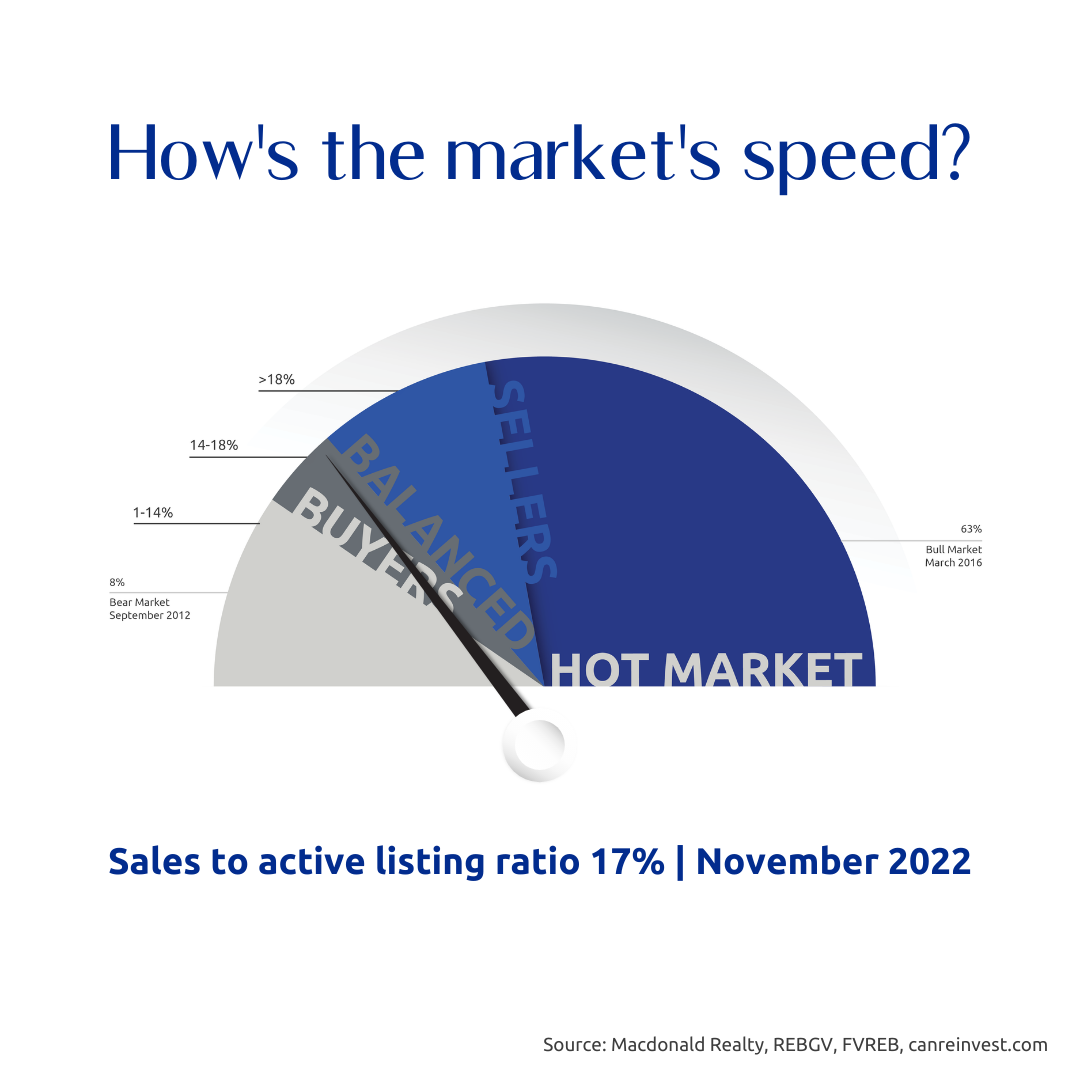
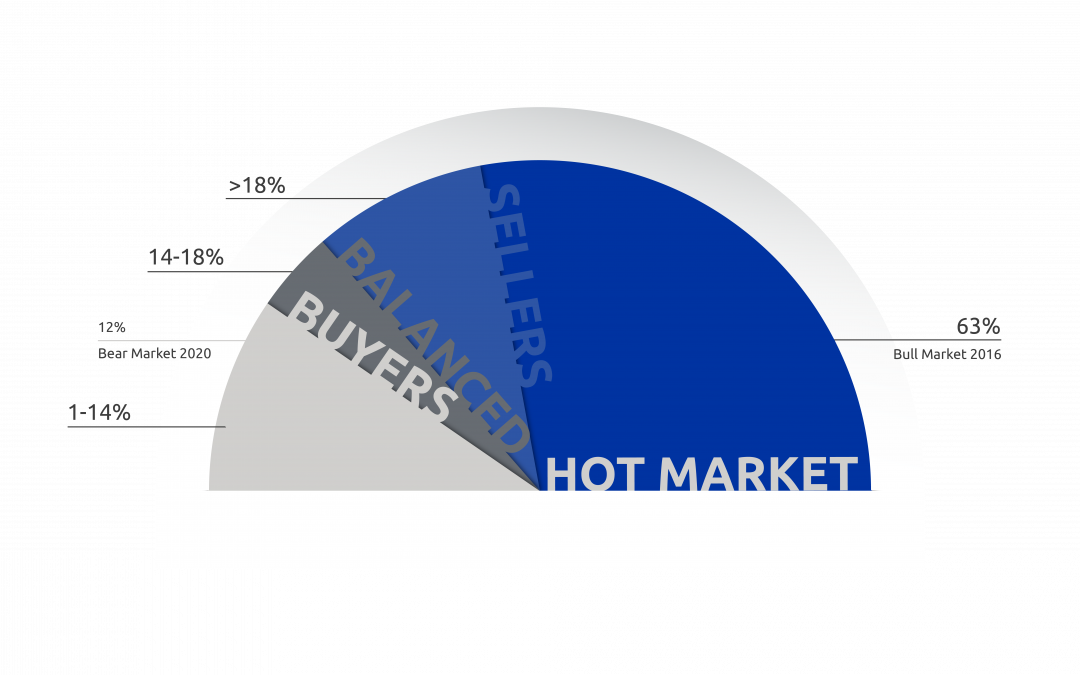
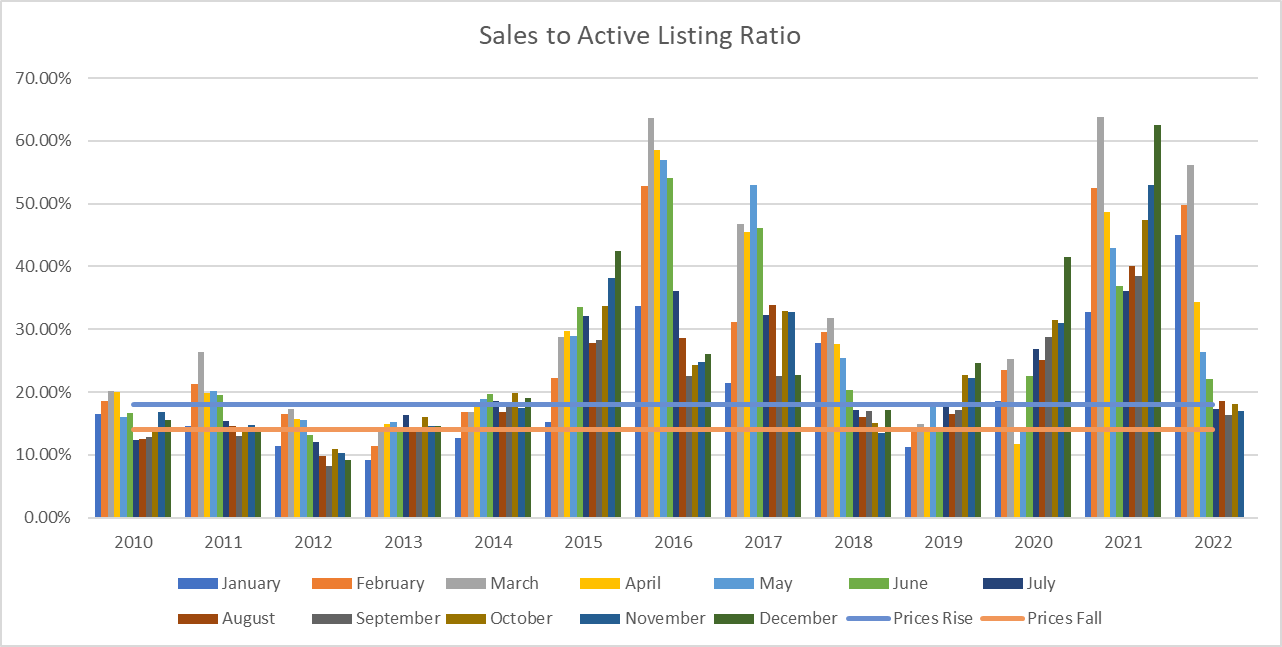
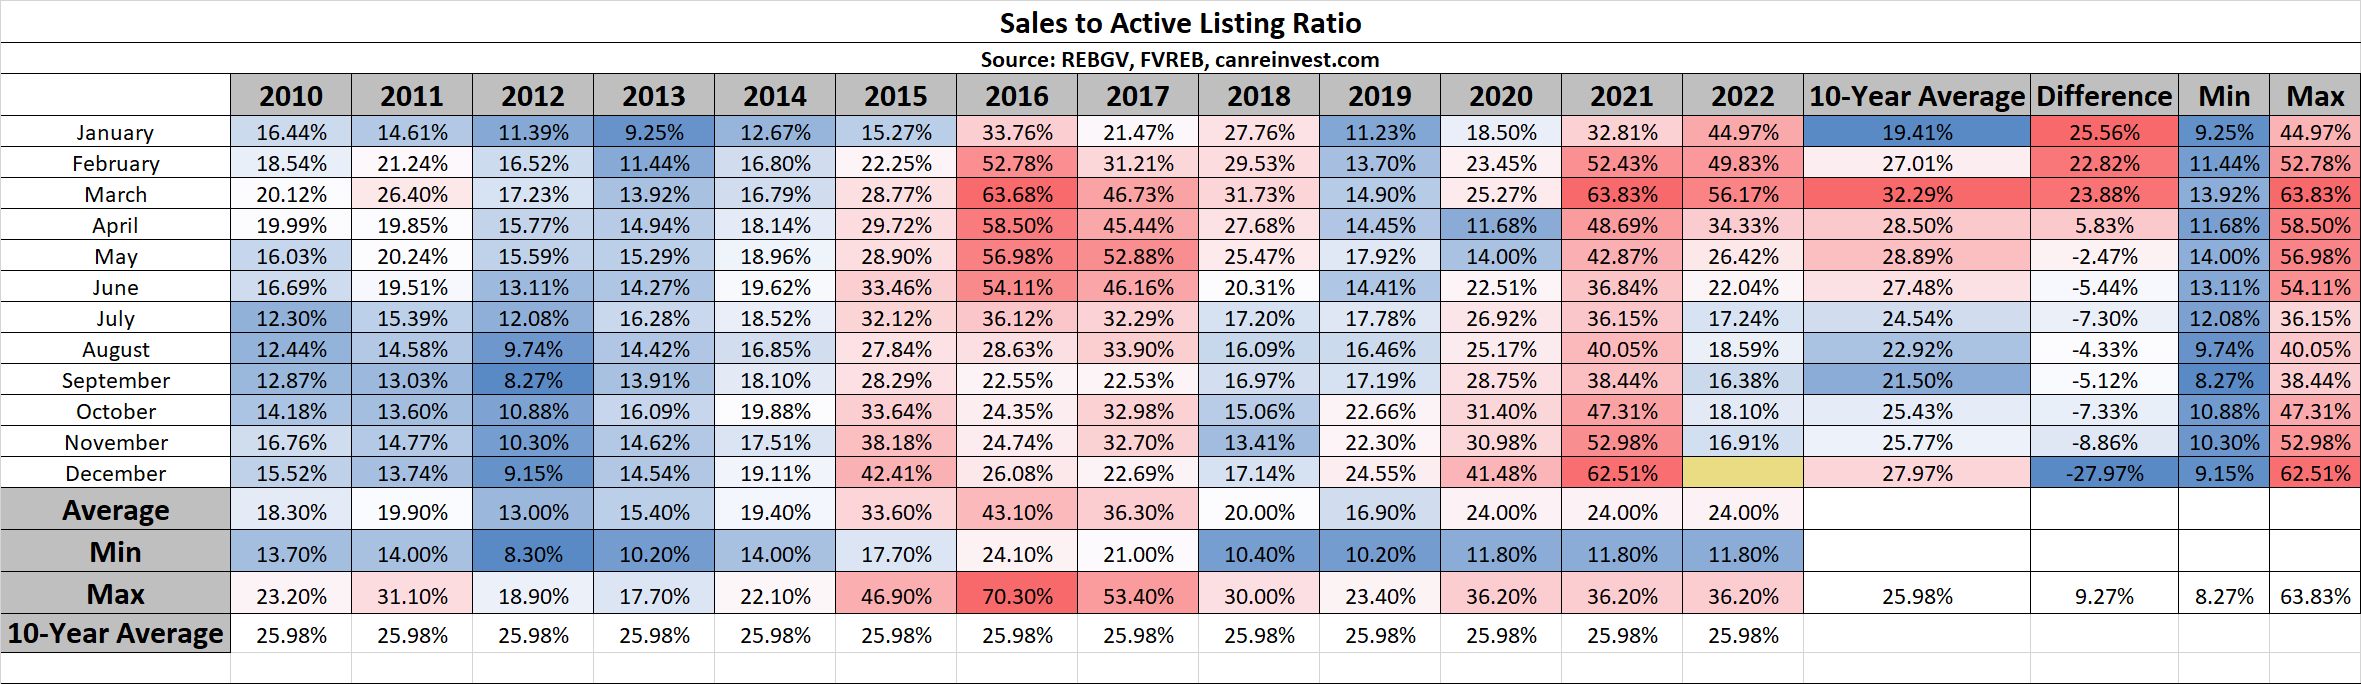
The most reliable indicator of market prices is the Sales to Active Listings Ratio (SAL). This is the ratio between the number of sales in a given month and the number of active listings at month-end.
In hotter markets in BC, a long-term analysis has shown that prices will usually act in the following ways:
- 7+ Months of Inventory (Under 14% SAL): Prices will likely DECLINE
- 5 – 7 Months of Inventory (14% – 18% SAL): Prices will likely be STABLE
- Less than 5.5 Months of Inventory (Over 18% SAL): Prices will likely RISE
Visit this link to learn more about house prices and inventory.
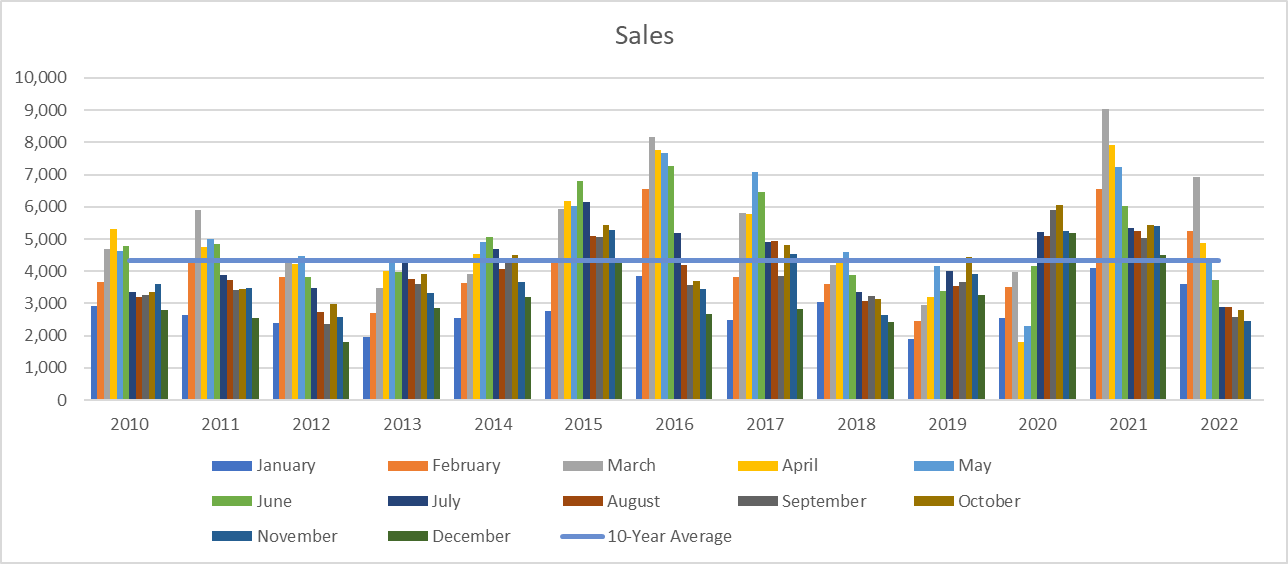
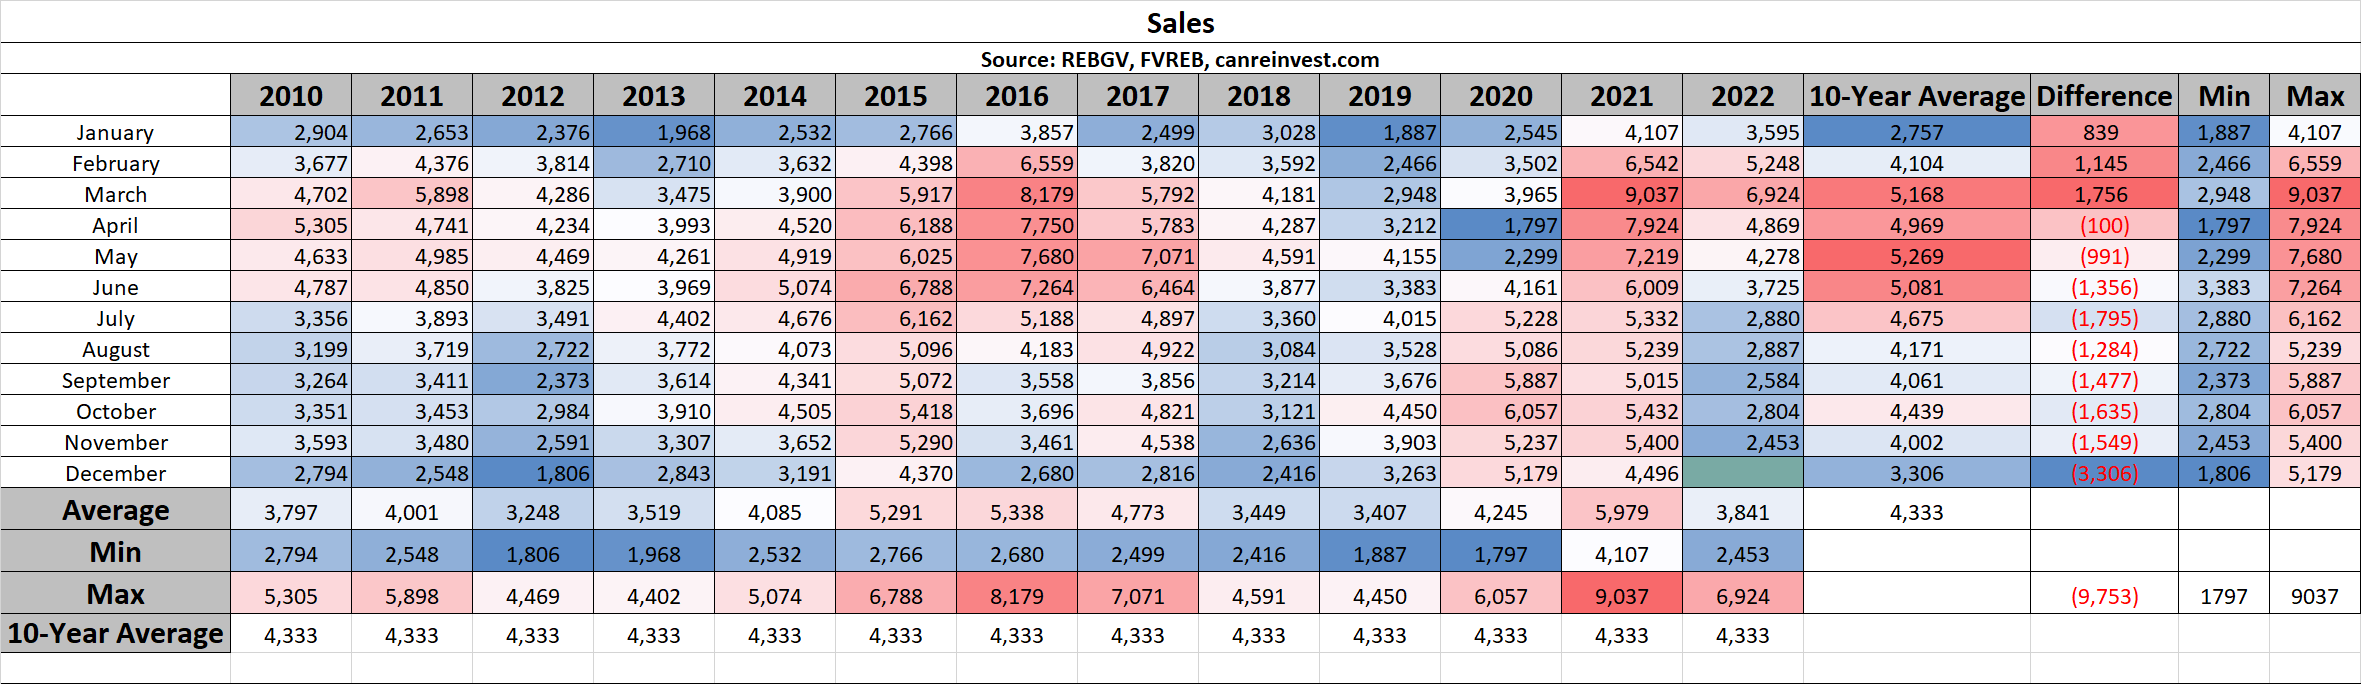
Sales
Sales in November fell to their lowest level in over 10 years, as buyers continued to take a breather to adjust to the new interest rate environment.
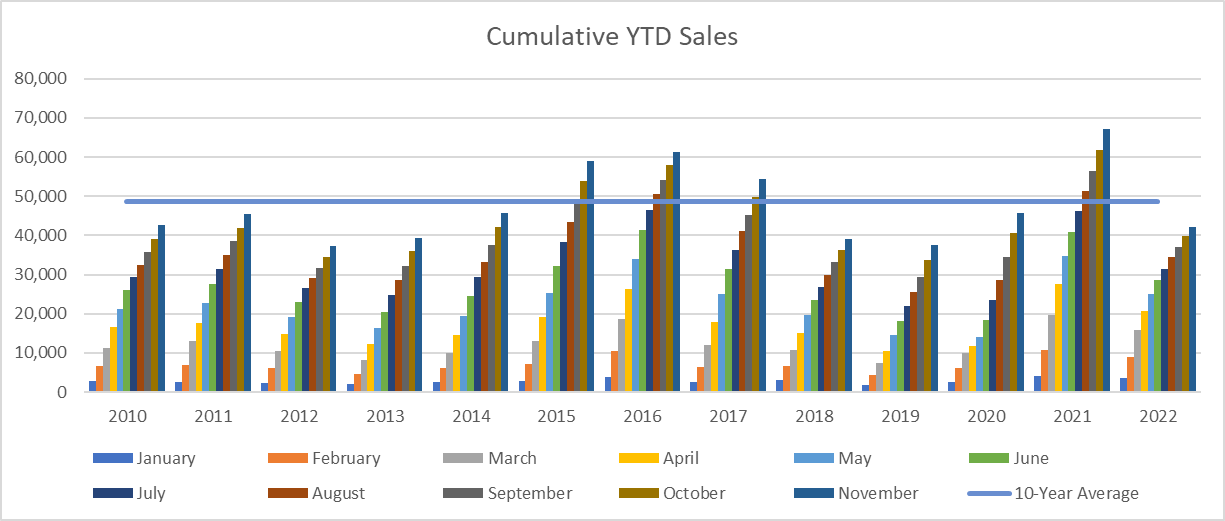
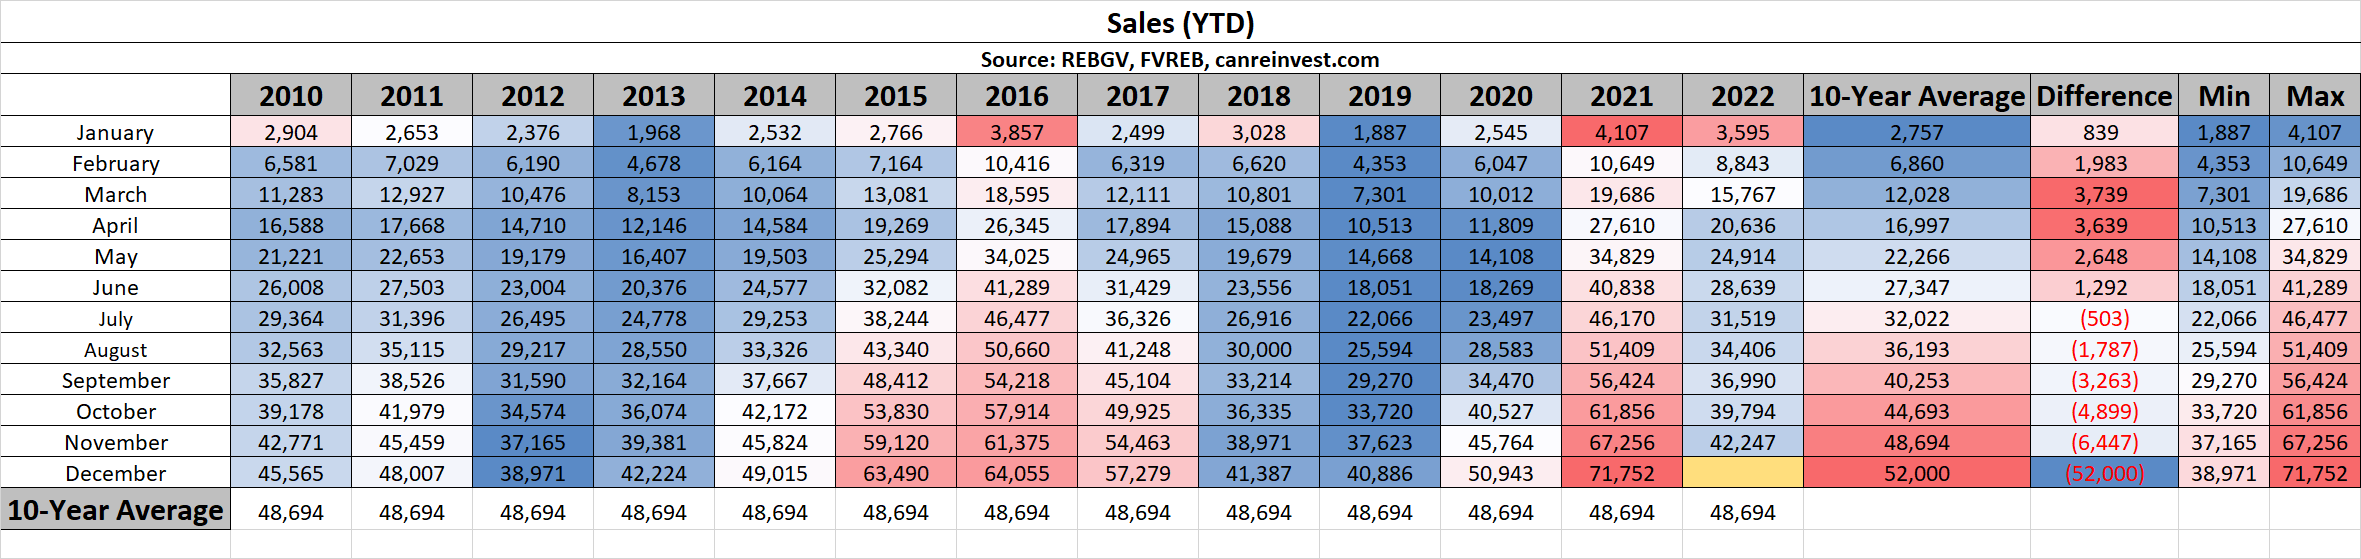
Cumulative Year-to-date Sales
Despite the strong start to the year, 2022 YTD sales (42,247) are now 20% below the 10-year average (48,694)
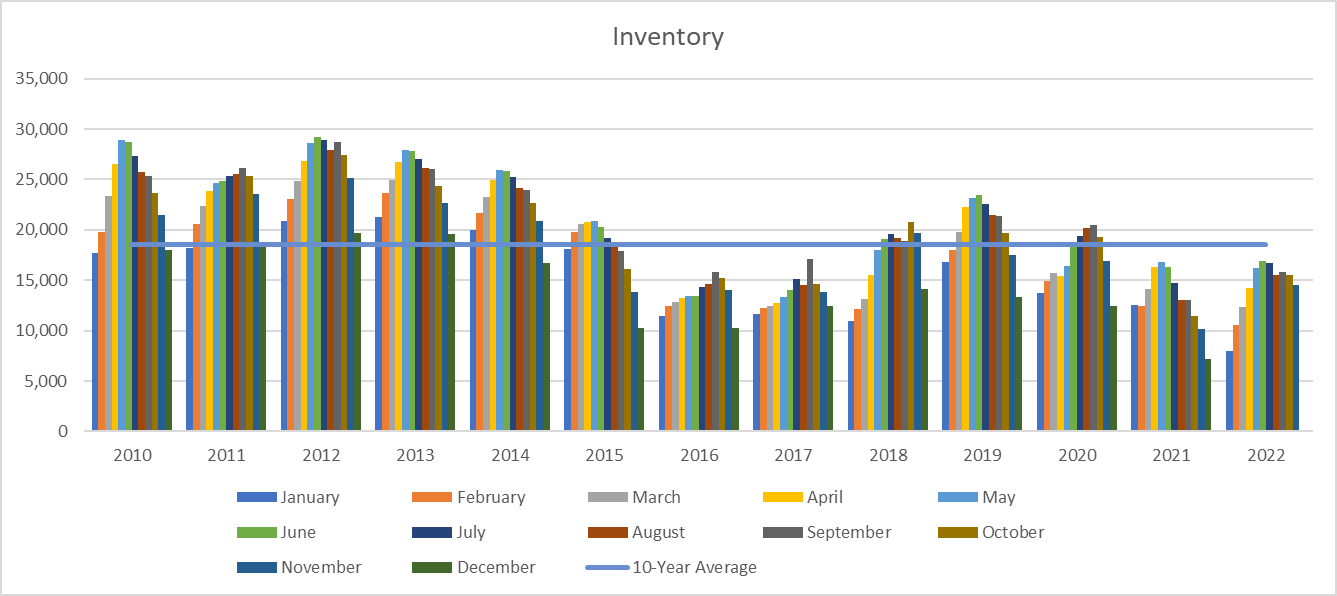
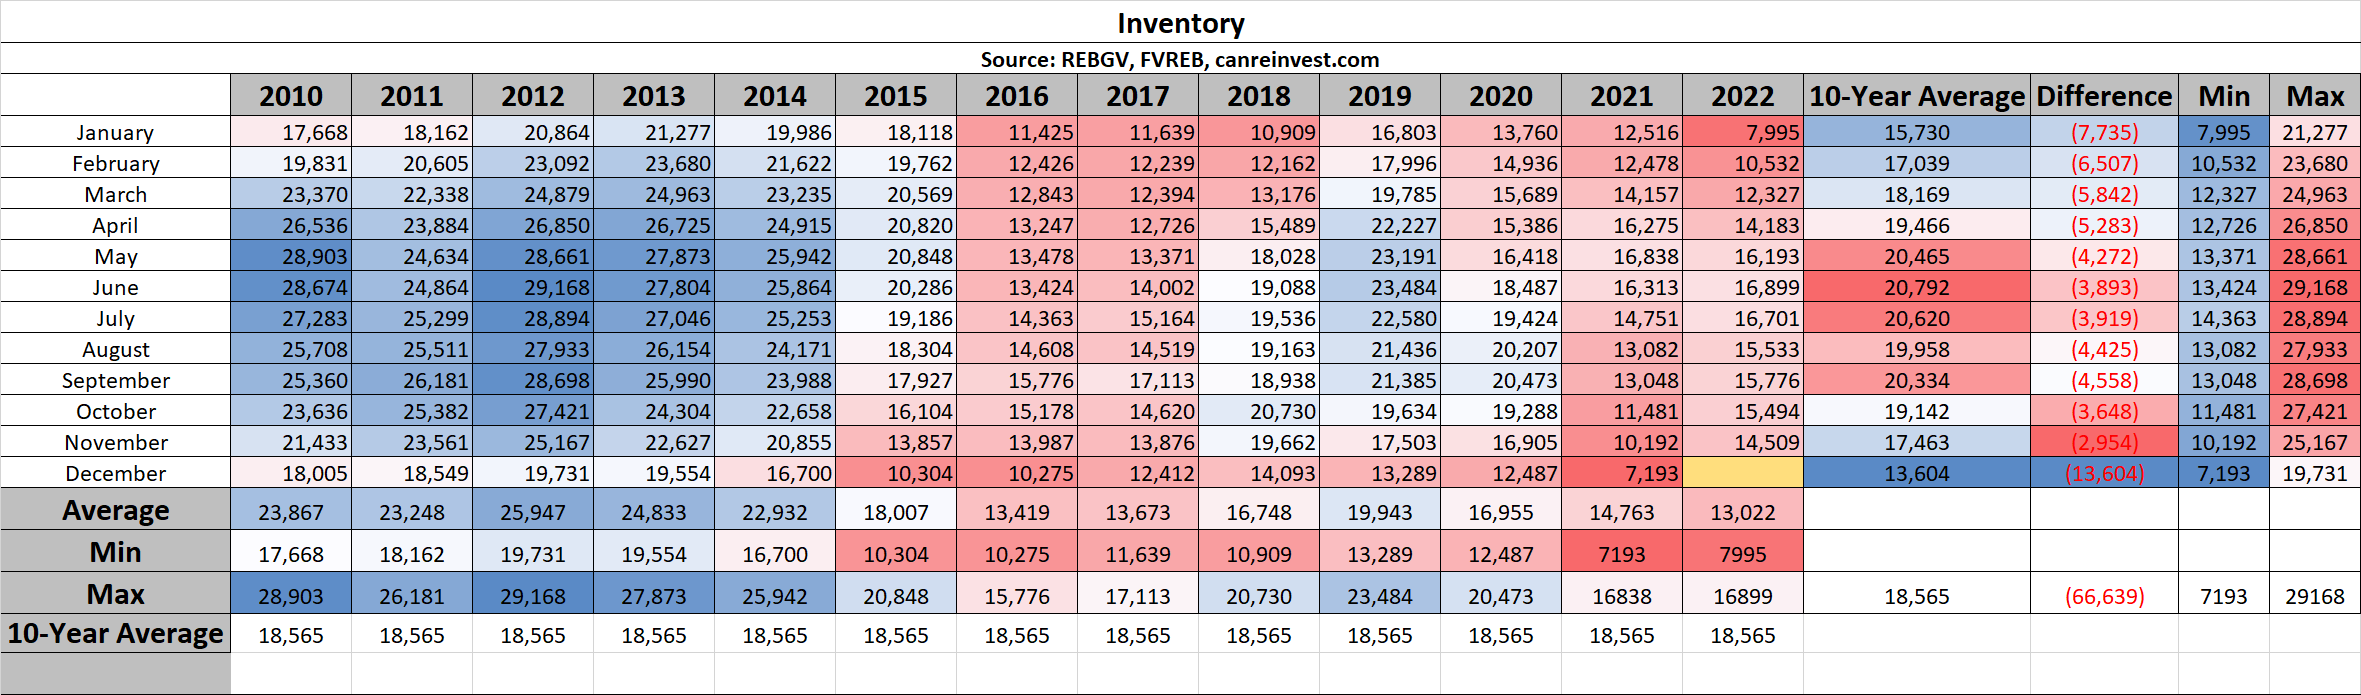
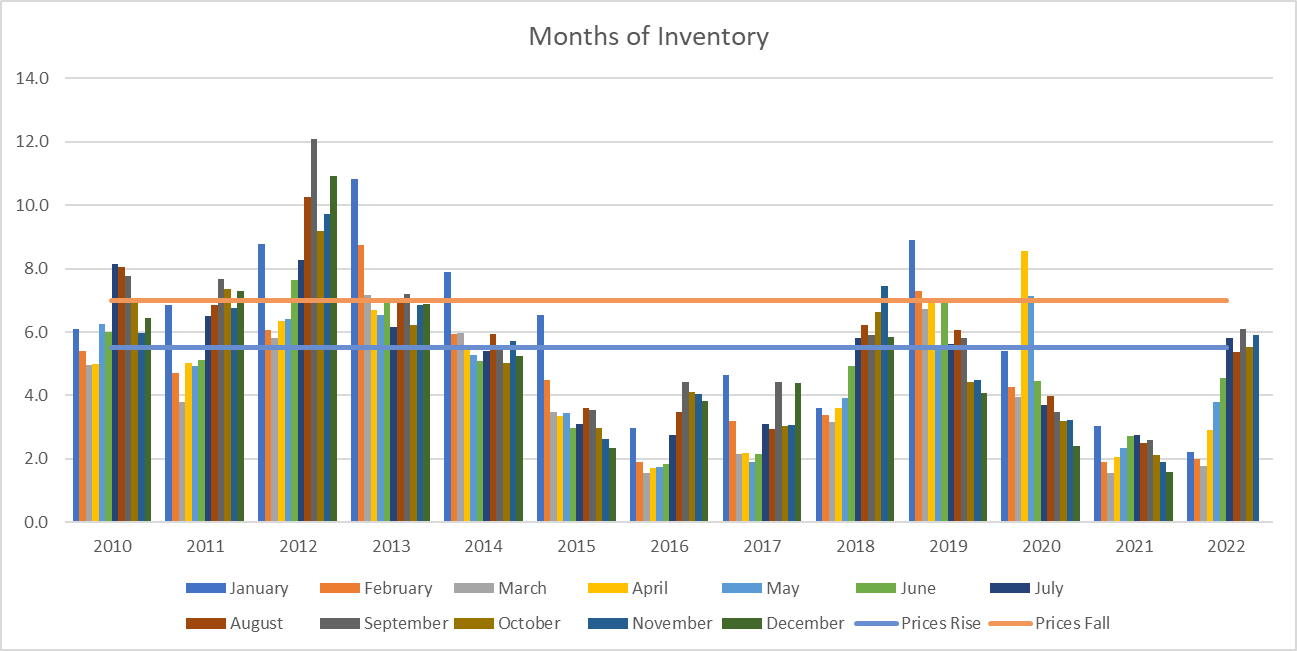
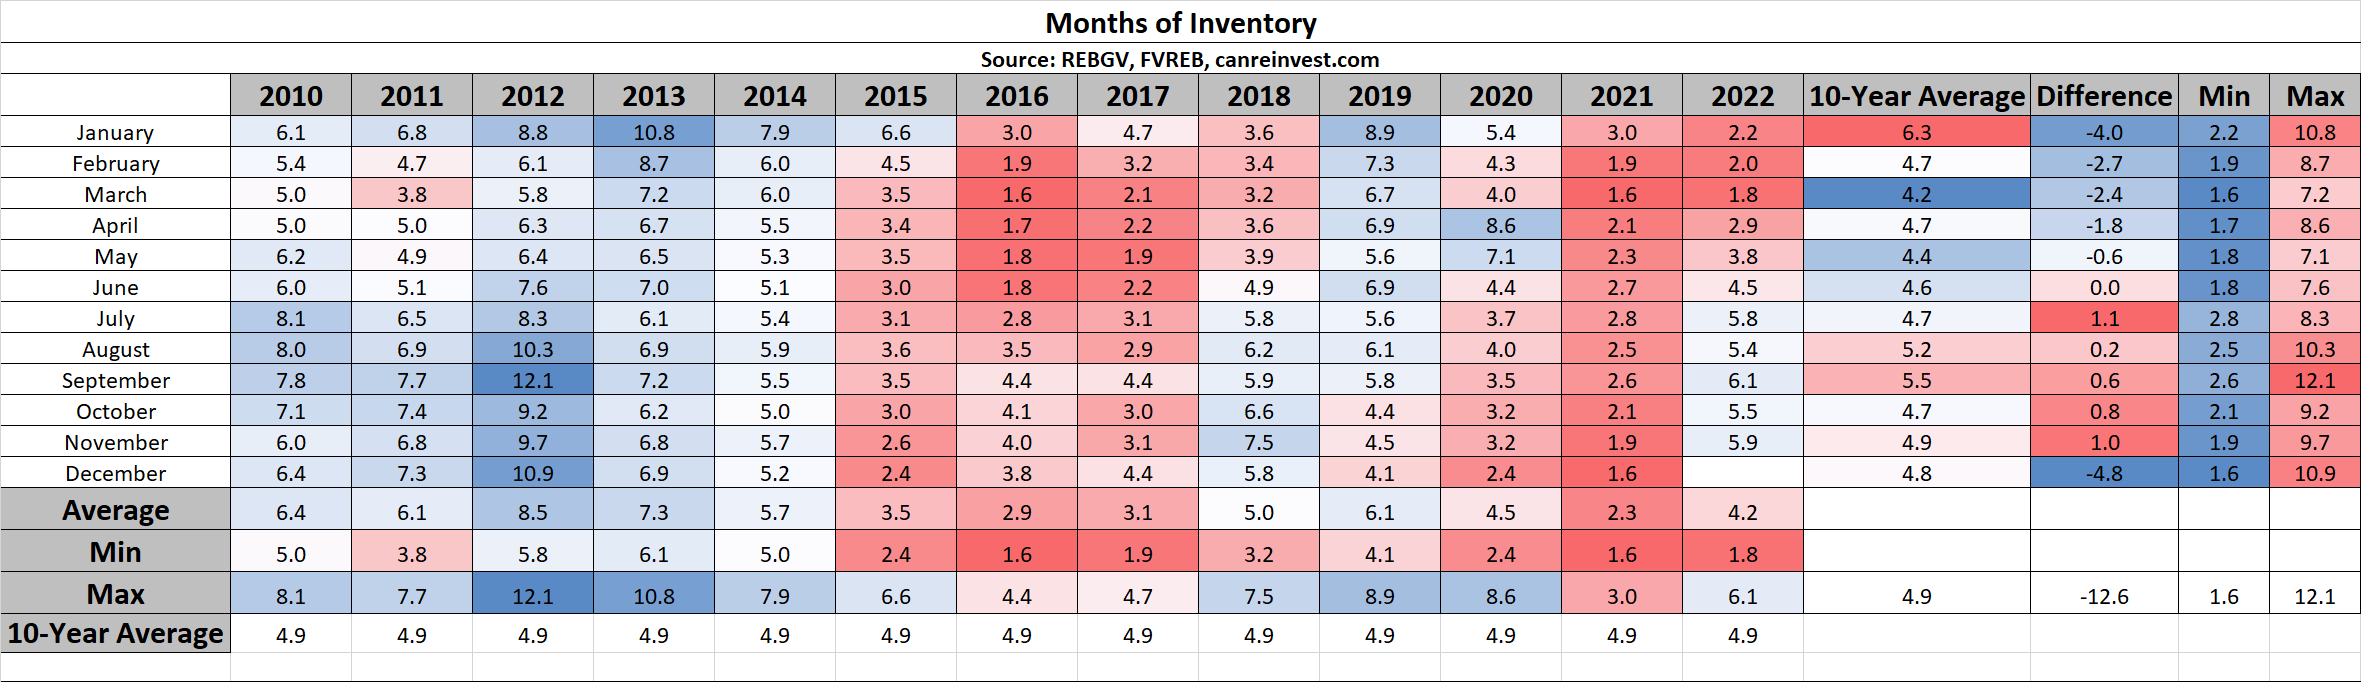
Inventory
November inventory (14,509 active listings) decreased from the previous month, and remain 17% below the 10-year average (17,463 average).
Sales to Active Listings
Despite the low sales, low inventory kept the Sales to Active Listing Ratio at 17%, indicating stabilizing prices.
Months of Inventory
Similarly, Months of Inventory rose to 5.9 MOI, indicating a balanced market.
Want to learn more about these stats or discuss your move to Macdonald Realty?
Check out careersinbcrealestate.com to connect today!