by Macrealty Marketing Team | Oct 7, 2022 | Market Updates
Here are the latest real estate market statistics from Macdonald Realty on Okanagan listings and sales in September 2022.
Find the infographics by visiting the Facebook Album.
Central Okanagan: Kelowna and Lake Country
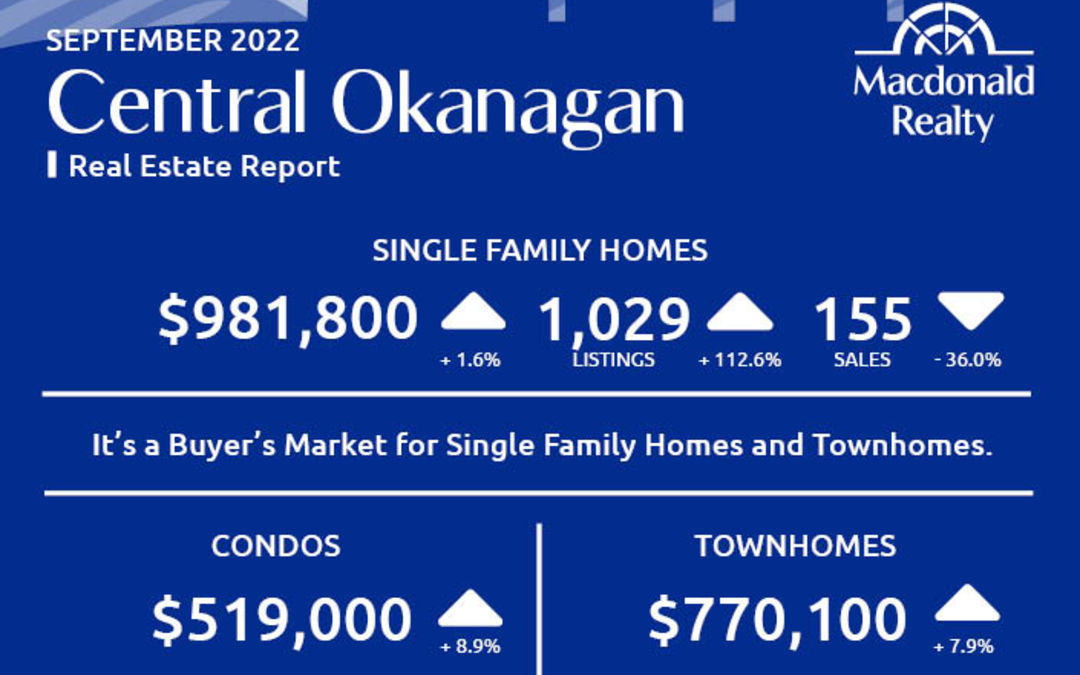
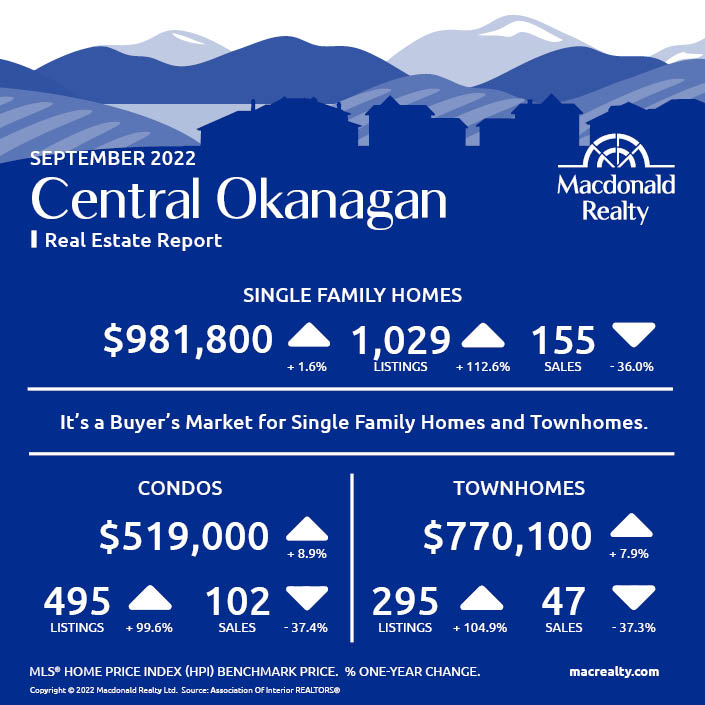
There were 155 sales, 1,029 active listings, and $981,800 average sale price for detached homes in the Central Okanagan market, including Kelowna and Lake Country.
The condo market featured 102 sales and 495 active listings at the end of the month. The average sale price was $519,000. Townhome sales were 47, active listings were 295 and the average sale price was $770,100. It’s a buyer’s market for single family homes and townhomes in Central Okanagan.
North Okanagan: Vernon and surrounding area
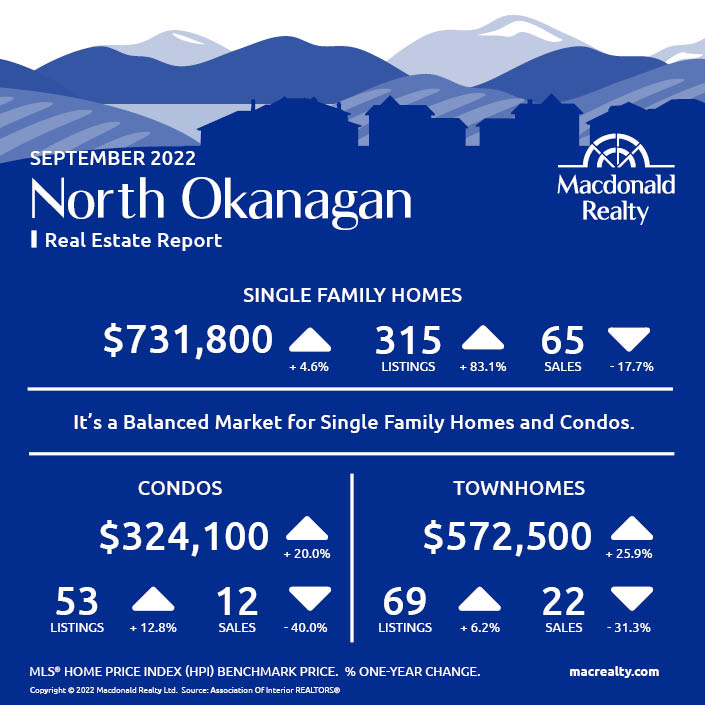
In North Okanagan, including Vernon and the surrounding area and the average sale price was $731,800. At the end of the month, there were 65 sales and 315 active listings. There were 12 sales and 53 active listings for condos. The average sale price was $324,100. In comparison, townhomes featured 22 sales, 69 active listings and a $572,500 average sale price. It’s a balanced market for single family homes and condos in North Okanagan.
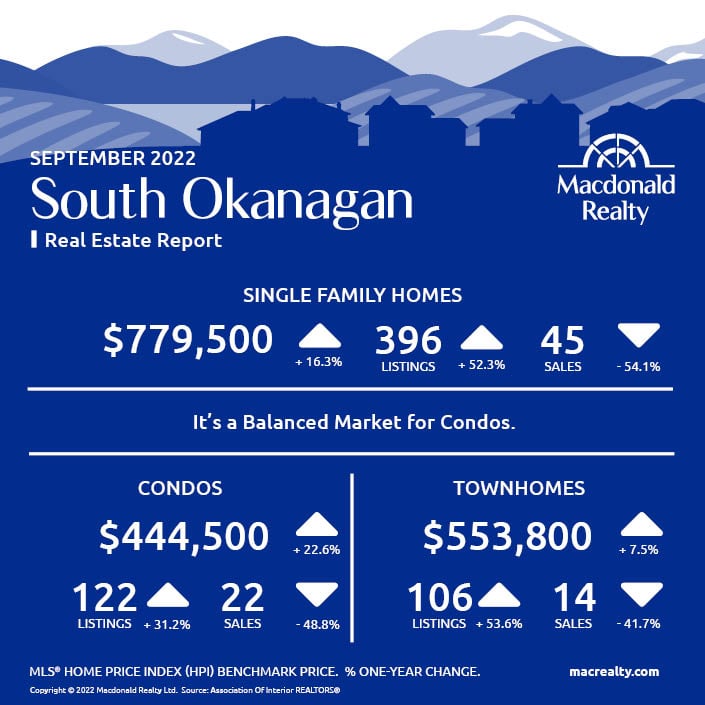
South Okanagan
There were 45 sales, 396 active listings, and $779,500 average sale price for detached homes in the South Okanagan market.
The condo market featured 22 sales and 122 active listings at the end of the month. The average sale price was $444,500. Townhome sales were 14, active listings were 106 and the average sale price was $553,800. It’s a balanced market for condos in South Okanagan.
Looking for more information about the real estate market in specific neighbourhoods in Okanagan?
Macdonald Realty has offices in Kelowna and across BC. Please email [email protected] or call 1-877-278-3888 to be matched with a REALTOR® working in your area.
This blog post is based on market data provided by the Association Of Interior REALTORS® https://www.interiorrealtors.ca/.
by Macrealty Marketing Team | Oct 7, 2022 | Market Updates
Here are the latest real estate market statistics from Macdonald Realty on Greater Victoria, Saanich Peninsula, Parksville/Qualicum, and Nanaimo listings and sales in September 2022. Find all the infographics related to the September Market Statistics by visiting the Facebook Album.
Victoria’s summer real estate market conditions push into September.
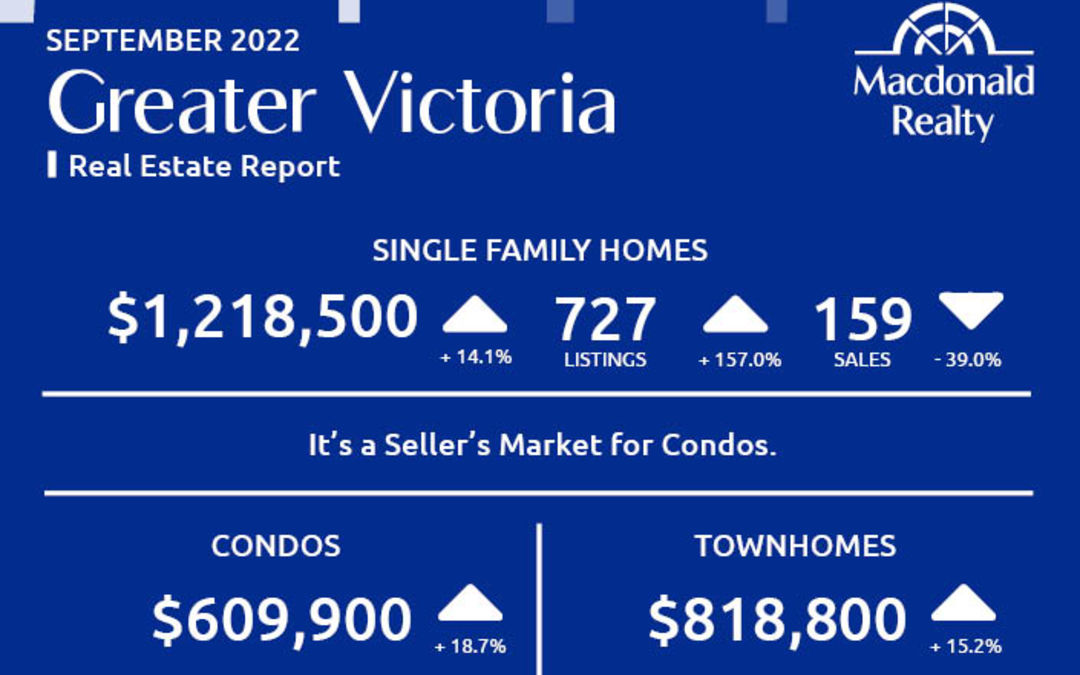
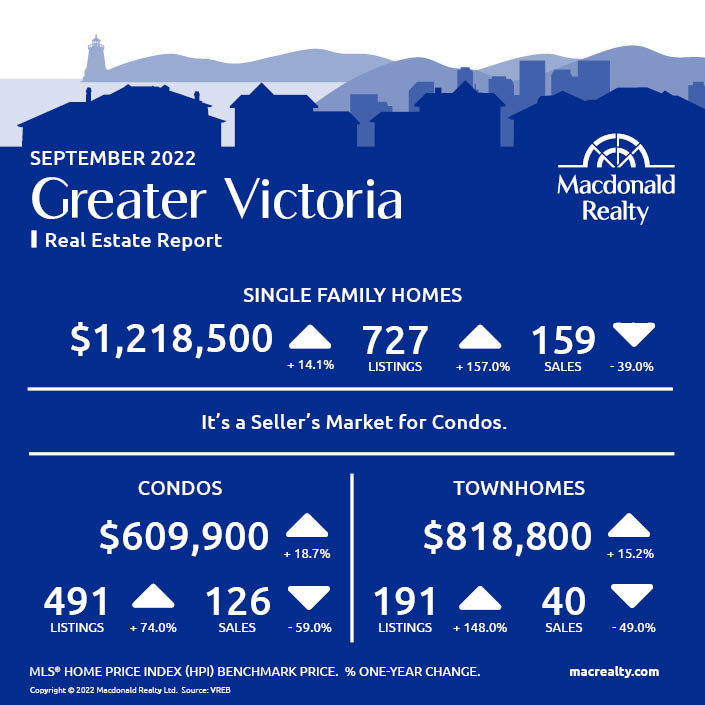
A total of 410 properties sold in the Victoria Real Estate Board region this September, 46.1 per cent fewer than the 761 properties sold in September 2021 and a 14.2 per cent decrease from August 2022. Sales of condominiums were down 58.8 per cent from September 2021 with 126 units sold. Sales of single family homes decreased 33.2 per cent from September 2021 with 221 sold.
“September heralds the start of the fall season, which traditionally brings a more active market than what we see in the summer months. October is generally the peak of the fall and winter market,” says Victoria Real Estate Board President Karen Dinnie-Smyth. “This year sales have dropped month over month since May and we saw a reluctant September with some of the lowest sales numbers for that month in decades. While the rate of decrease has slowed due in part to concerns about rising interest rates and inflation, this level of activity may not necessarily reflect the actual demand that exists in the marketplace. While overall activity is below historical norms, well-priced properties are still receiving plenty of attention. Multiple offers on these homes are still quite common, which may not be reflected in the overall statistics, but is noticeable if you are actively buying and selling.”
There were 2,300 active listings for sale on the Victoria Real Estate Board Multiple Listing Service® at the end of September 2022, an increase of 7.6 per cent compared to the previous month of August and a 104.6 per cent increase from the 1,124 active listings for sale at the end of September 2021.
“The good news is that we have seen more inventory come to market, which when combined with slower sales activity, has resulted in more balanced market conditions,” adds President Dinnie-Smyth. “In the current environment, properties that are well-priced and well-maintained continue to sell briskly. If you are thinking of making a move, a conversation with your favourite REALTOR® for an up-to-date analysis of how the housing market is performing in your area will be crucial to your success. Another consideration is to take the time to vote in your municipal elections October 15 for candidates who reflect your preferences for housing in our communities. Much of our future housing supply and the way Greater Victoria will manage housing needs will be determined by decisions made at the municipal level.”
Greater Victoria
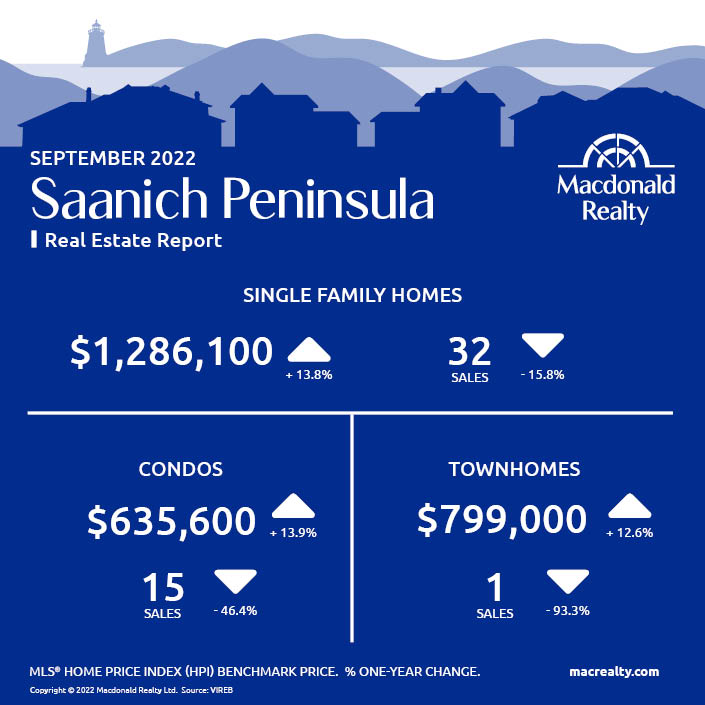
Saanich Peninsula
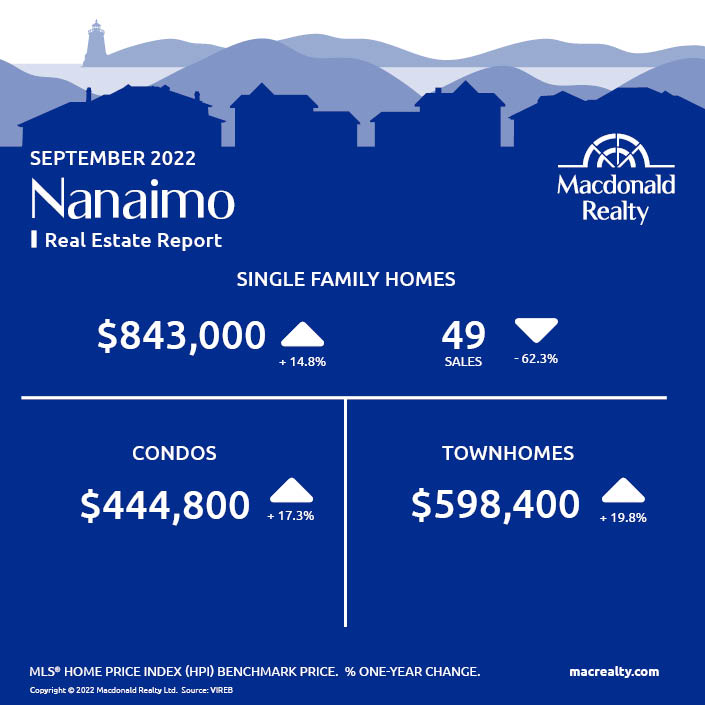
Nanaimo
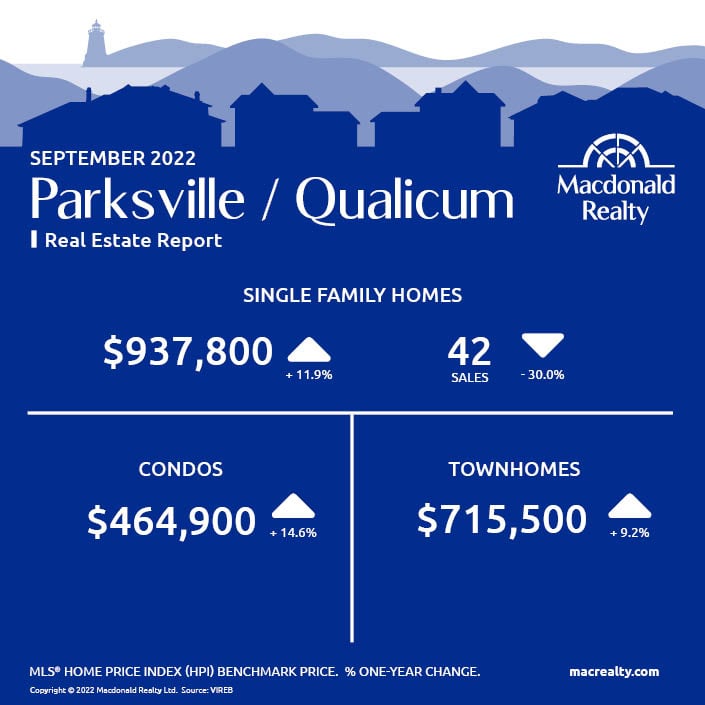
Parksville / Qualicum
Looking for more information about the real estate market in specific neighbourhoods in Victoria, Saanich Peninsula, Parksville, Nanaimo, Vancouver Island and the Gulf Islands?
Macdonald Realty has offices in downtown Victoria, Sidney, Parksville and Salt Spring Island. Please email [email protected] or call 1-877-278-3888 to be matched with a REALTOR® working in your area.
MLS® Home Price Index (HPI) Benchmark Price
Average and median home prices are often misinterpreted, are affected by change in the mix of homes sold, and can swing dramatically from month to month (based on the types and prices of properties that sold in a given month). The MLS® HPI overcomes these shortcomings and uses the concept of a benchmark home, a notional home with common attributes of typical homes in a defined area. Visit www.housepriceindex.ca for more information.
This blog post is based on market data provided by the Victoria Real Estate Board (VREB) www.vreb.org and the Vancouver Island Real Estate Board (VIREB) www.vireb.com. Market data from the VIREB includes listings and sales in Campbell River, Comox Valley, Cowichan Valley Nanaimo, Parksville/Qualicum, Port Alberni/West, North Island, and the Islands.
by Macrealty Marketing Team | Oct 7, 2022 | Market Updates
According to the Fraser Valley Real Estate Board, Fraser Valley real estate market continues to stabilize heading into fall season.
Continued slowing sales and a slight rise in inventory in September combined to bring greater stability to the Fraser Valley housing market.
In September, the Fraser Valley Real Estate Board (FVREB) processed 897 sales on its Multiple Listing Service® (MLS®), a decrease of 11.8 per cent compared to last month and a 51.9 per cent decrease compared to this time last year.
The Board received 2,273 new listings in September, an increase of 11.1 per cent compared to August, and only 2.9 per cent less than September 2021. The month ended with a total active inventory of 5,805, a decrease of 1.1 per cent from last month but up by 52.3 per cent compared to September 2021. Once again, September saw a balanced market in the Fraser Valley with an overall sales-to-active ratio of 15 per cent (the market is considered balanced when the sales-to-active ratio is between 12 per cent and 20 per cent).
“There’s no question that interest rates continue to be a primary factor in the market trends over the past six months or so,” said Sandra Benz, President of the Fraser Valley Real Estate Board. “The sales slowdown we’re seeing reflects a level of caution exercised by buyers, who are likely waiting for the market to settle further before jumping in. In the meantime, we anticipate prices may continue to decline across all categories.”
Weaker demand in the face of interest rate hikes, continued to bring downward pressure on Benchmark prices across all property categories. Prices have been falling steadily since late spring and, in the case of detached homes, are at October 2021 levels.
“It’s encouraging to see inventories start to rise in the region, however slight,” said Board CEO Baldev Gill. “Adequate supply is a key underpinning of a vibrant and equitable housing market – not just in the Fraser Valley, but throughout the province. As we meet with candidates during the upcoming municipal elections and later on this month with MPs in Ottawa, FVREB Realtors will continue to press for swift action on this fundamental issue.”
Across the Fraser Valley in September, the average number of days spent on the market before selling continued to increase: 34 days for a single-family detached, 32 for townhomes, and 30 for apartments.
Find all the infographics related to the September Market Statistics by visiting the Facebook Album.
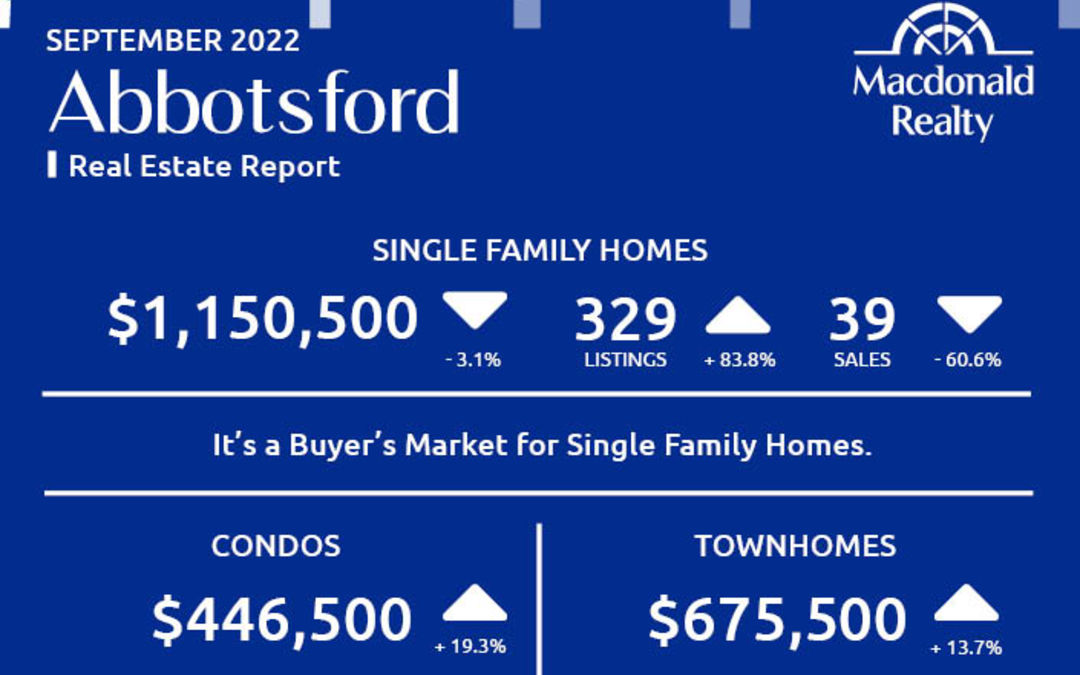
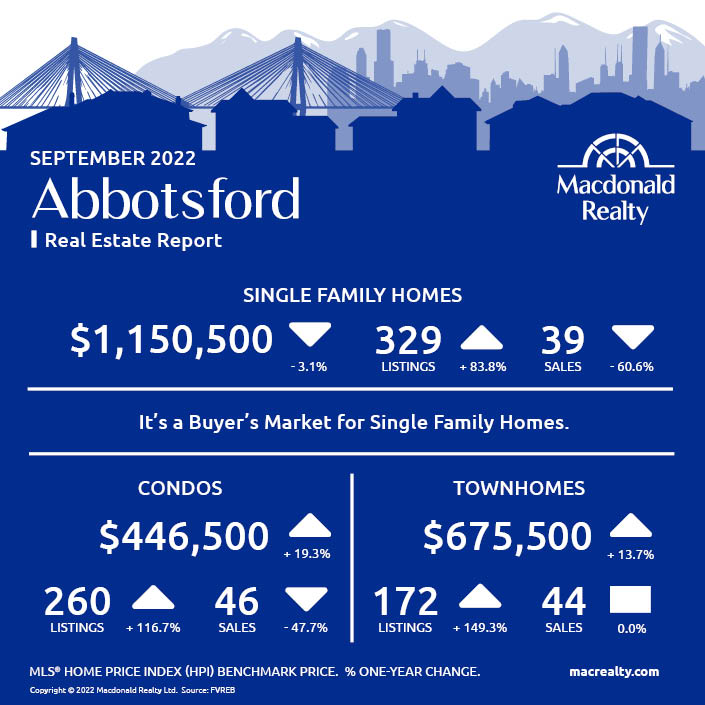
Abbotsford
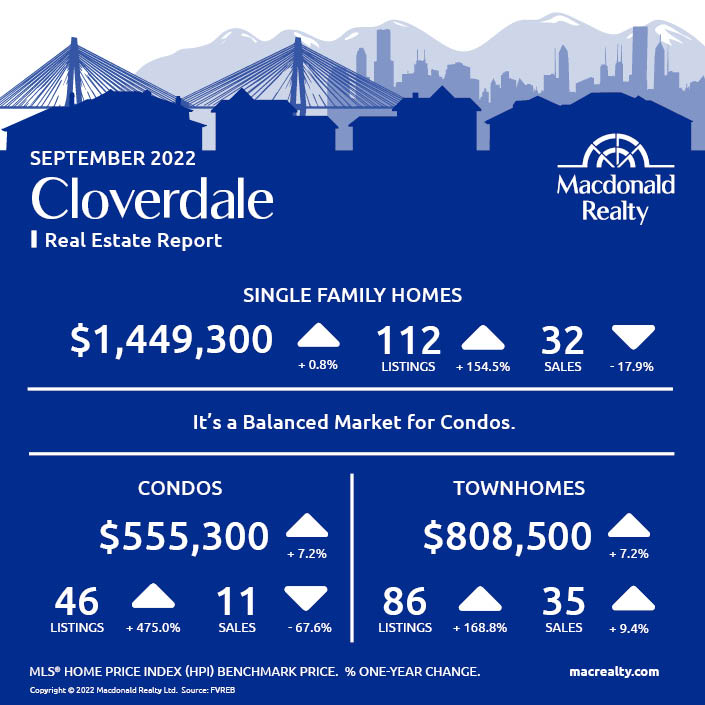
Cloverdale
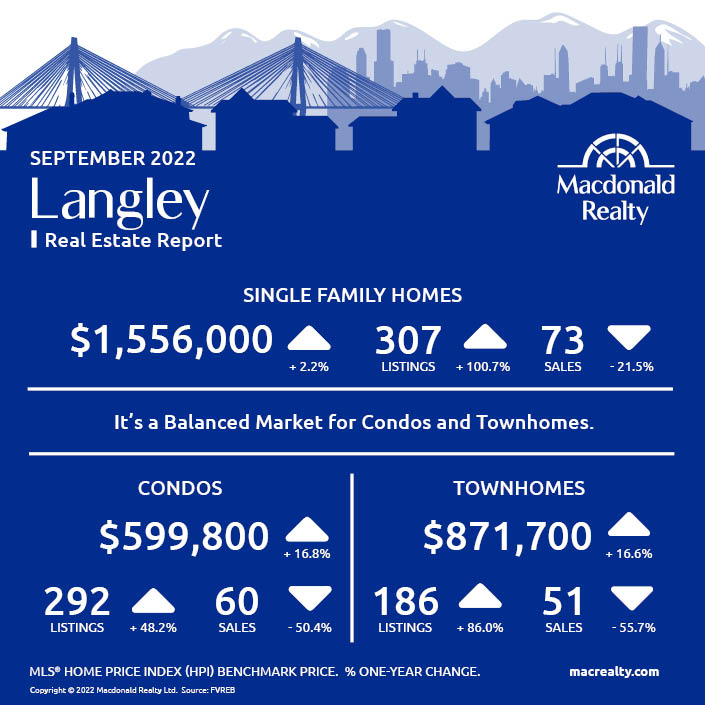
Langley
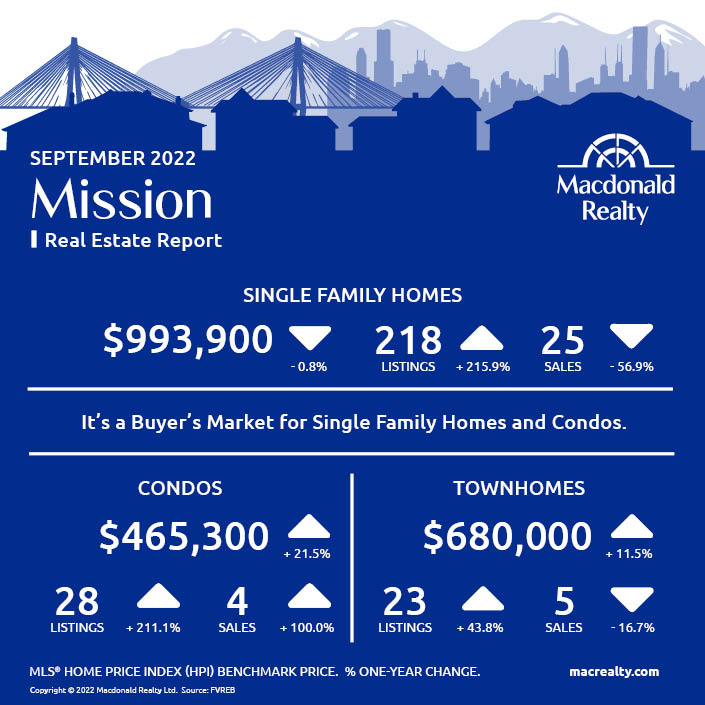
Mission
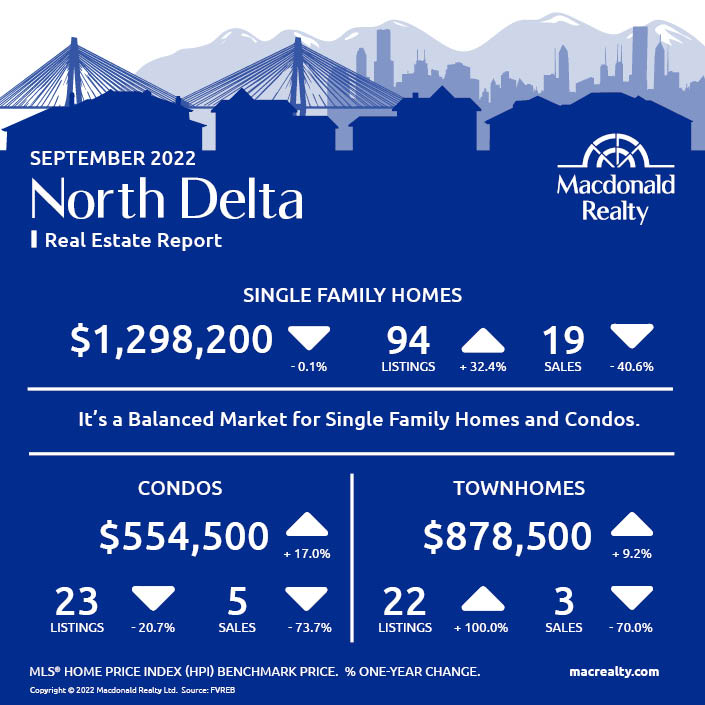
North Delta
North Surrey

Surrey Central
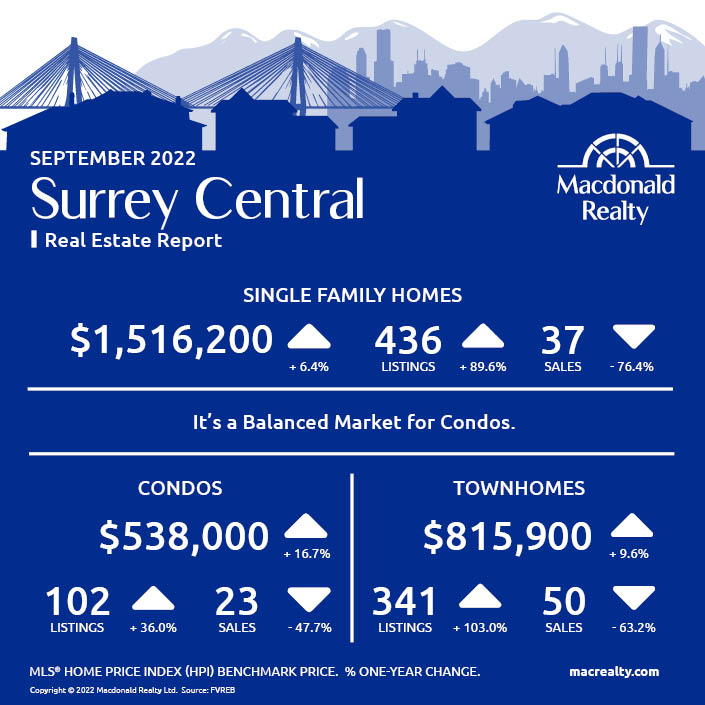
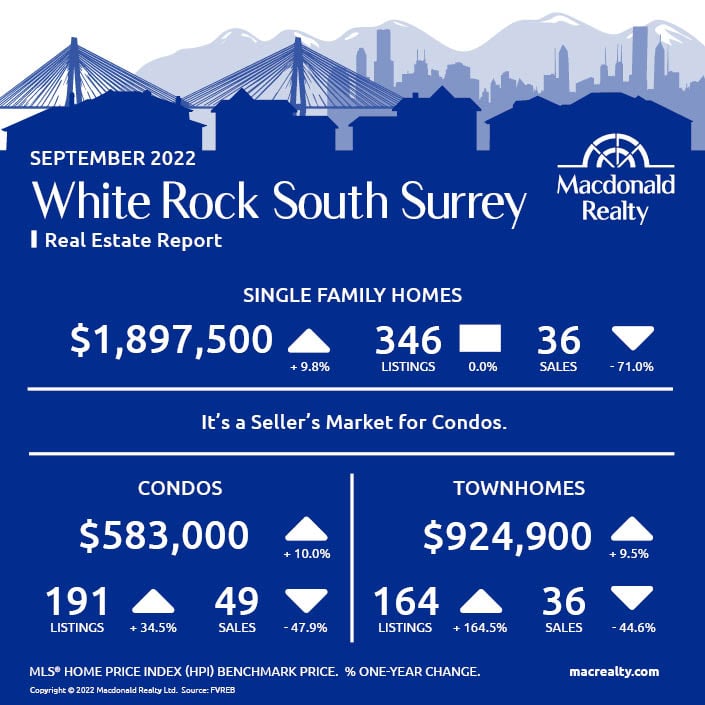
White Rock / South Surrey
Looking for more information about the real estate market in specific neighbourhoods in Surrey, Langley and Fraser Valley?
Macdonald Realty has offices in North Delta, White Rock/South Surrey, and Langley. Please email [email protected] or call 1-877-278-3888 to be matched with a REALTOR® working in your area.
MLS® Home Price Index (HPI) Benchmark Price
Average and median home prices are often misinterpreted, are affected by change in the mix of homes sold, and can swing dramatically from month to month (based on the types and prices of properties that sold in a given month). The MLS® HPI overcomes these shortcomings and uses the concept of a benchmark home, a notional home with common attributes of typical homes in a defined area. Visit www.housepriceindex.ca for more information.
This blog post is based on market data provided by the Fraser Valley Real Estate Board (FVREB) www.fvreb.bc.ca
by Macrealty Marketing Team | Oct 7, 2022 | Market Updates
Here are the latest real estate market statistics from Macdonald Realty on Squamish, Whistler, and Sunshine Coast listings and sales in September 2022.
Find all the infographics related to the September Market Statistics by visiting the Facebook Album.
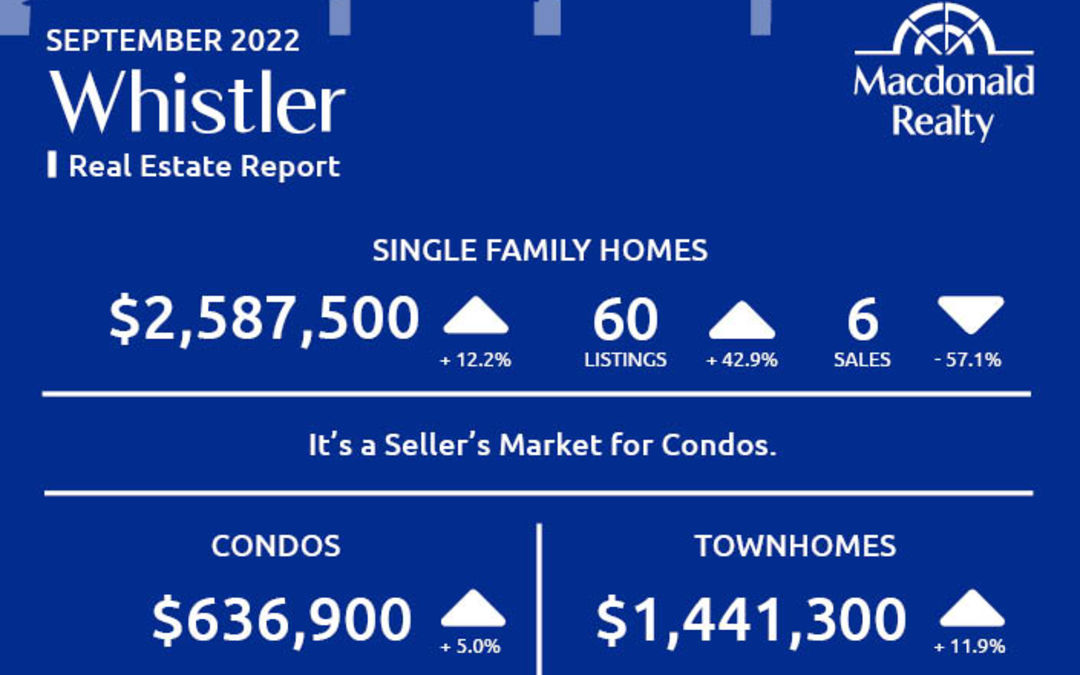
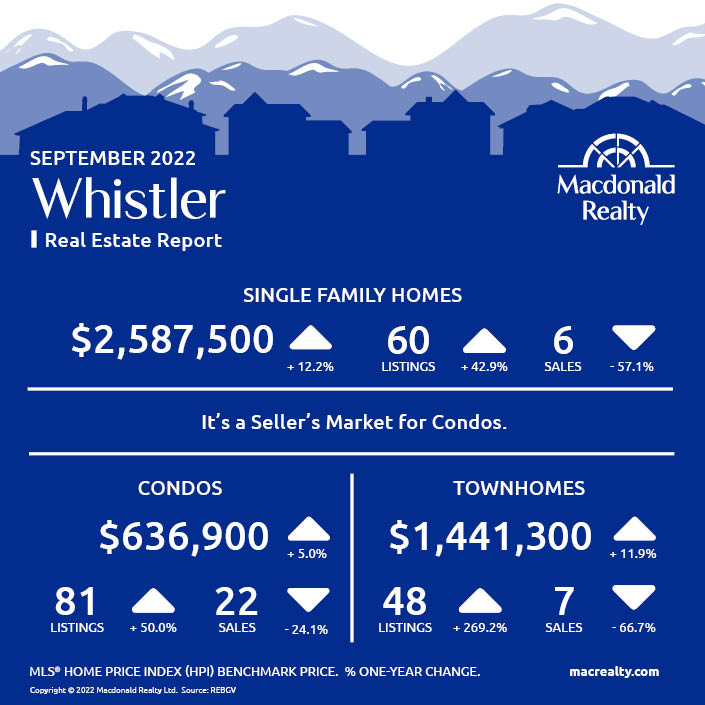
Whistler
In September 2022, there were 6 sales of detached homes and 60 active listings. The benchmark sale price was $2,587,500.
The condo market had 22 sales and 81 active listings at the end of the month. The benchmark sale price was $636,900.
The townhome market had 7 sales and the active listings were 48. The benchmark sale price was $1,441,300.
It’s a seller’s market for condos in Whistler.
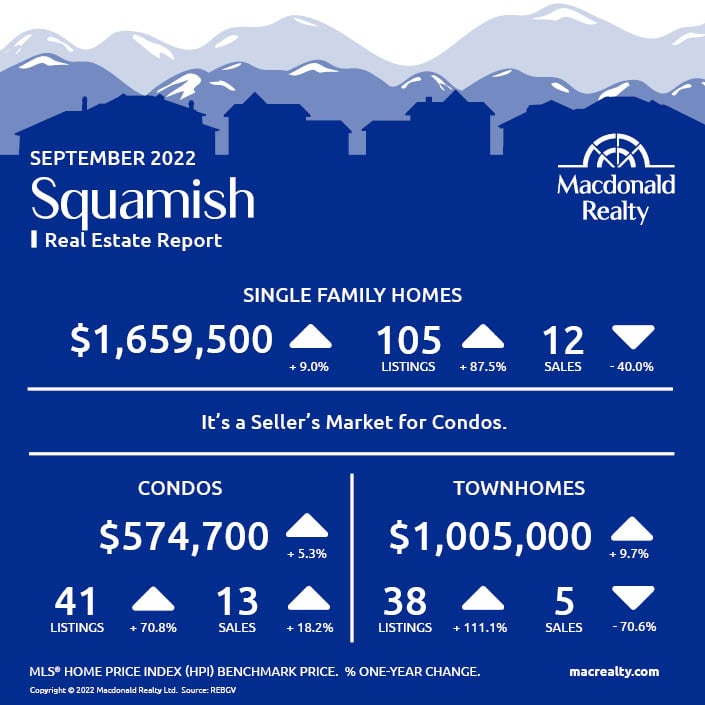
Squamish
In September 2022, there were 12 sales of detached homes and 105 active listings. The benchmark sale price was $1,659,500.
The condo market had 13 sales and 41 active listings at the end of the month. The benchmark sale price was $574,700.
The townhome market had 5 sales and, the active listings were 38. The benchmark sale price was $1,005,000.
It’s a seller’s market for condos in Squamish.
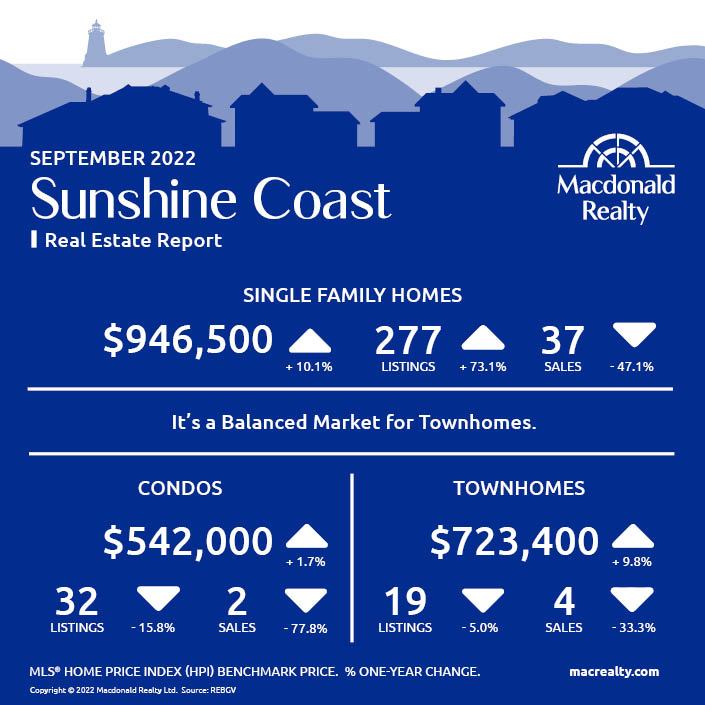
Sunshine Coast
In September 2022, there were 37 sales of detached homes and 277 active listings. The benchmark sale price was $946,500.
The condo market had 2 sales and 32 active listings at the end of the month.
The townhome market had 4 sales and, the active listings were 19.
It’s a balanced market for townhomes in Sunshine Coast.
Looking for more information about the real estate market in specific neighbourhoods in Squamish, Whistler, and Sunshine Coast? Macdonald Realty has offices in Squamish, Whistler, and Sunshine Coast. Please email [email protected] or call 1-877-278-3888 to be matched with a REALTOR® working in your area.
MLS® Home Price Index (HPI) Benchmark Price
Average and median home prices are often misinterpreted, are affected by change in the mix of homes sold, and can swing dramatically from month to month (based on the types and prices of properties that sold in a given month). The MLS® HPI overcomes these shortcomings and uses the concept of a benchmark home, a notional home with common attributes of typical homes in a defined area. Visit www.housepriceindex.ca for more information.
This blog post is based on market data provided by the Real Estate Board of Greater Vancouver (REBGV) www.rebgv.org
by Macrealty Marketing Team | Oct 7, 2022 | Market Updates
Here are the latest real estate market statistics from Macdonald Realty on the Greater Vancouver listings and sales in September 2022. Find all the infographics by visiting the Facebook Album.
Home sellers were more active in Metro Vancouver’s housing market in September while home buyer demand remained below the region’s long-term averages.
The Real Estate Board of Greater Vancouver (REBGV) reports that residential home sales in the region totalled 1,687 in September 2022, a 46.4 per cent decrease from the 3,149 sales recorded in September 2021, and a 9.8 per cent decrease from the 1,870 homes sold in August 2022.
Last month’s sales were 35.7 per cent below the 10-year September sales average.
“With the Bank of Canada and other central banks around the globe hiking rates in an effort to stamp out inflation, the cost to borrow funds has risen substantially over a short period,” said Andrew Lis, REBGV director, economics and data analytics. “This has resulted in a more challenging environment for borrowers looking to purchase a home, and home sales across the region have dropped accordingly.”
There were 4,229 detached, attached and apartment properties newly listed for sale on the Multiple Listing Service® (MLS®) in Metro Vancouver in September 2022. This represents an 18.2 per cent decrease compared to the 5,171 homes listed in September 2021 and a 27.1 per cent increase compared to August 2022 when 3,328 homes were listed.
*Areas covered by the Real Estate Board of Greater Vancouver include Burnaby, Coquitlam, Maple Ridge, New Westminster, North Vancouver, Pitt Meadows, Port Coquitlam, Port Moody, Richmond, South Delta, Squamish, Sunshine Coast, Vancouver, West Vancouver, and Whistler. Check out the infographics of Squamish, Sunshine Coast and Whistler, HERE.
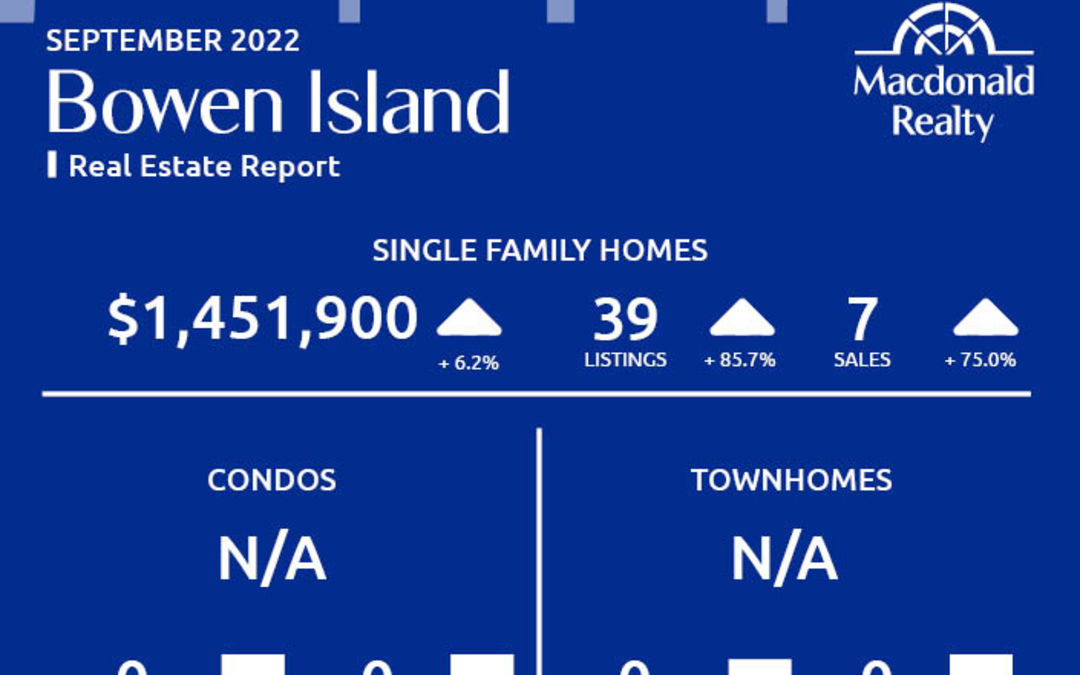
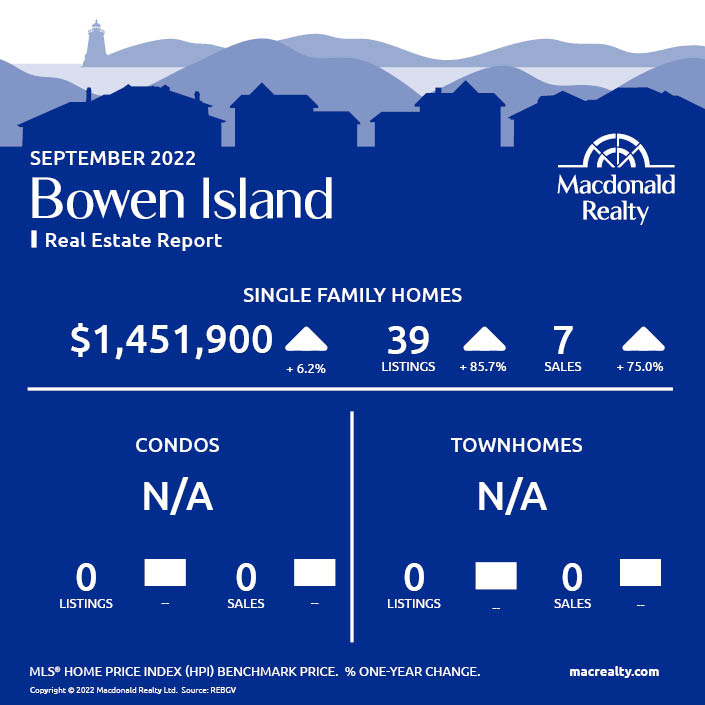
Bowen Island
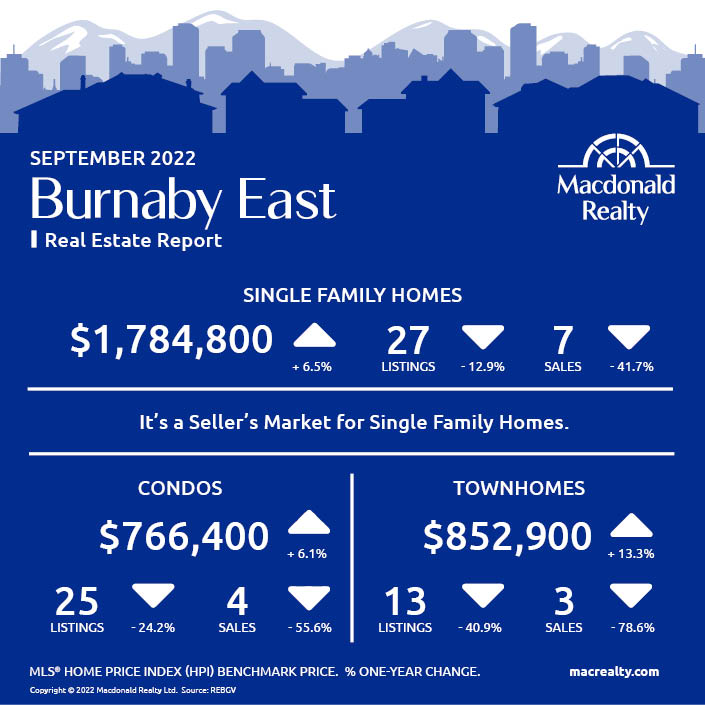
Burnaby East
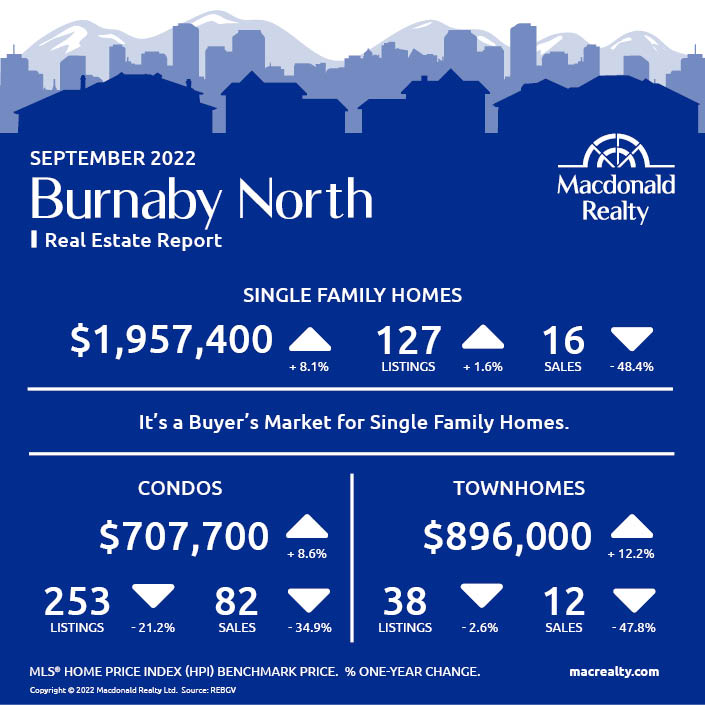
Burnaby North
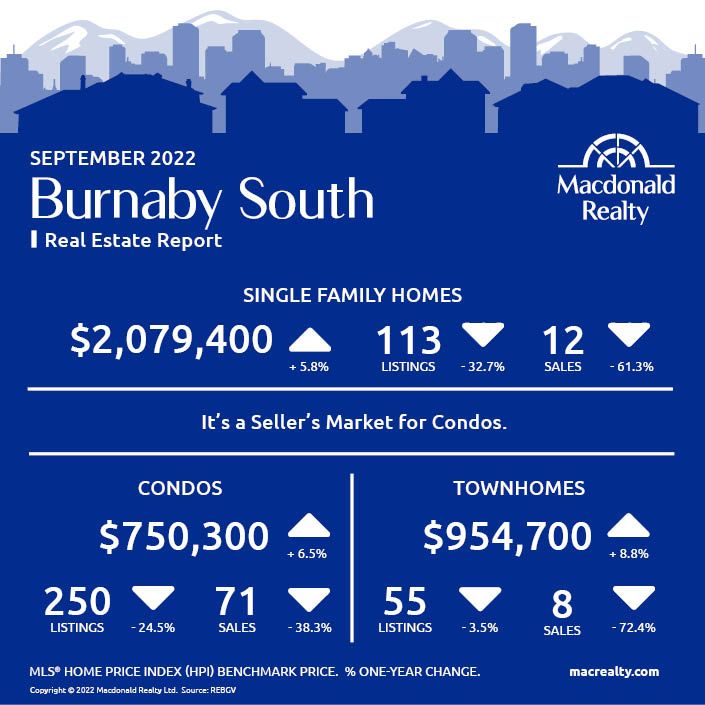
Burnaby South
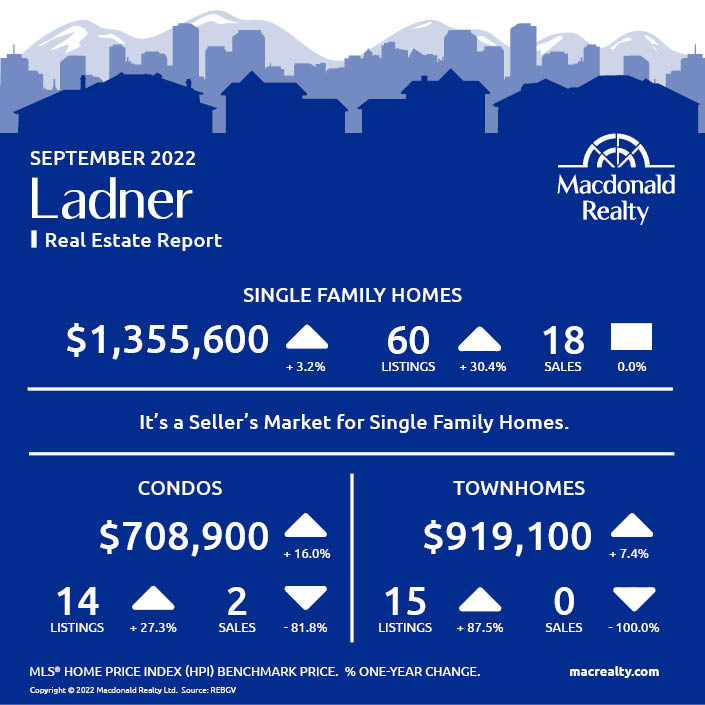
Ladner
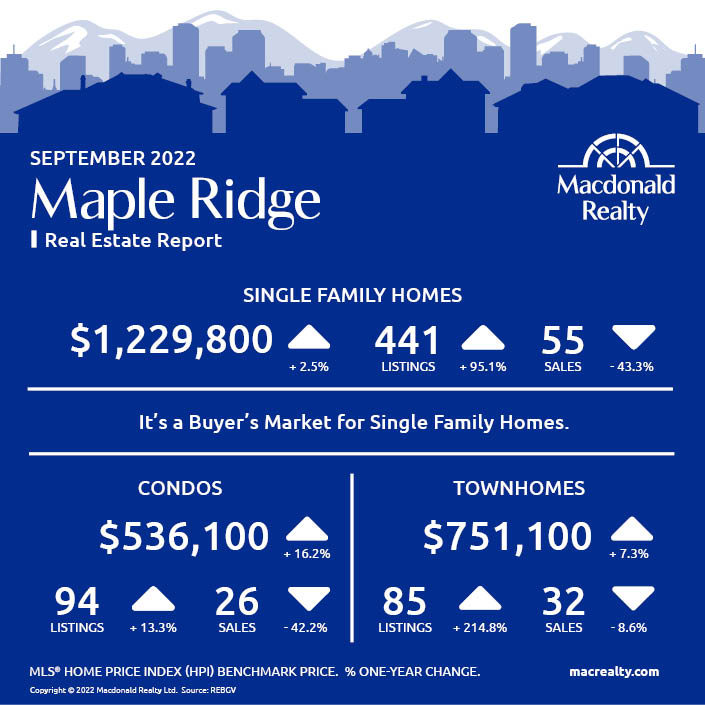
Maple Ridge
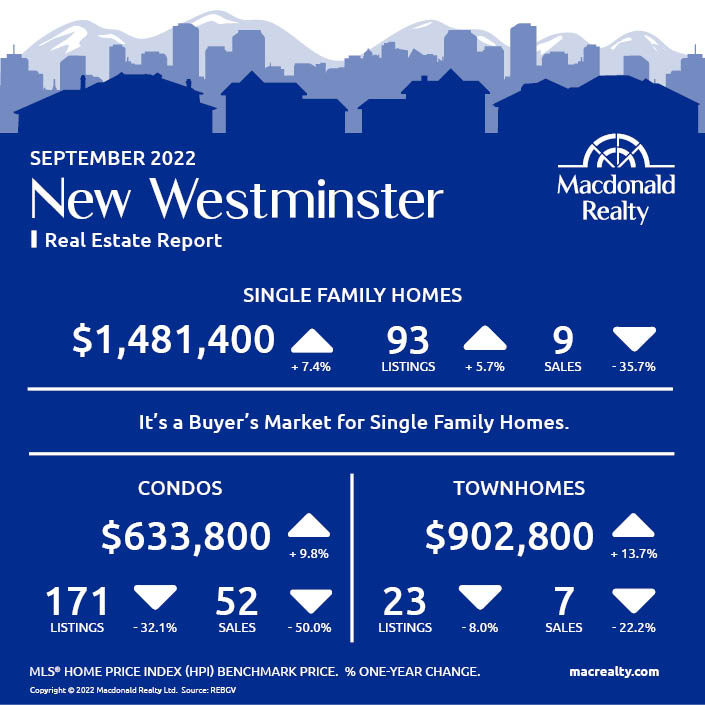
New Westminster
North Vancouver

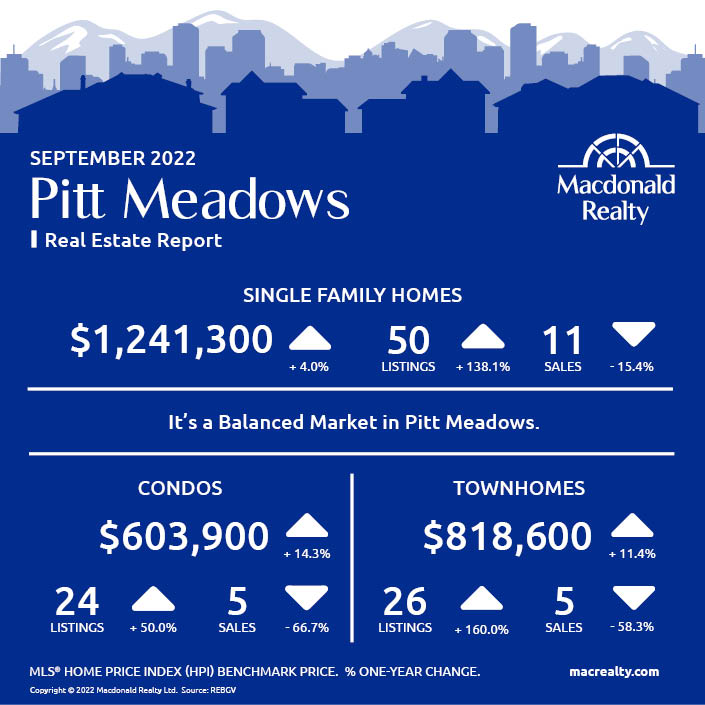
Pitt Meadows
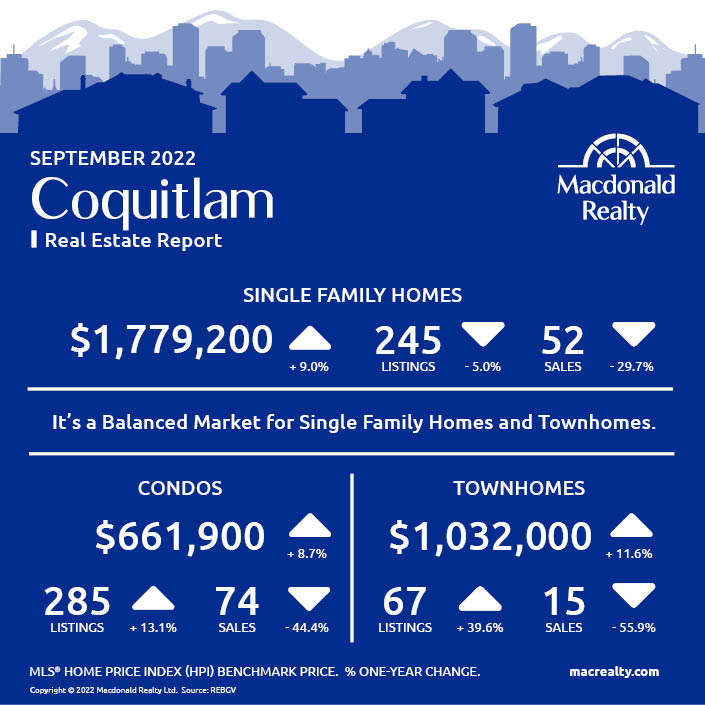
Coquitlam
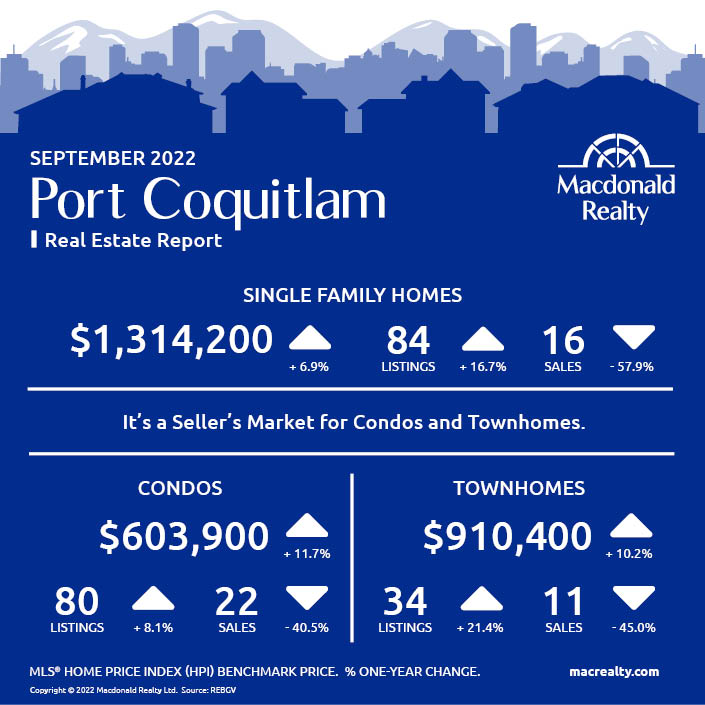
Port Coquitlam
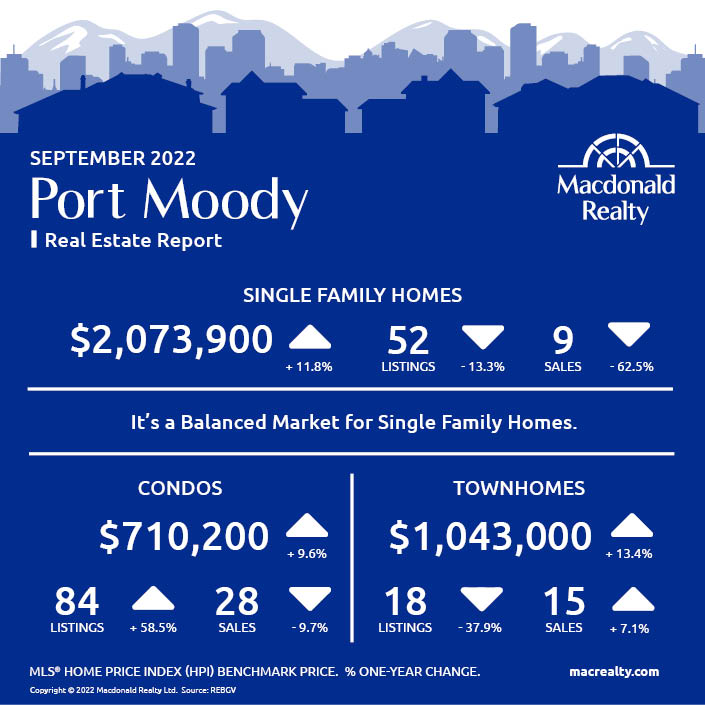
Port Moody
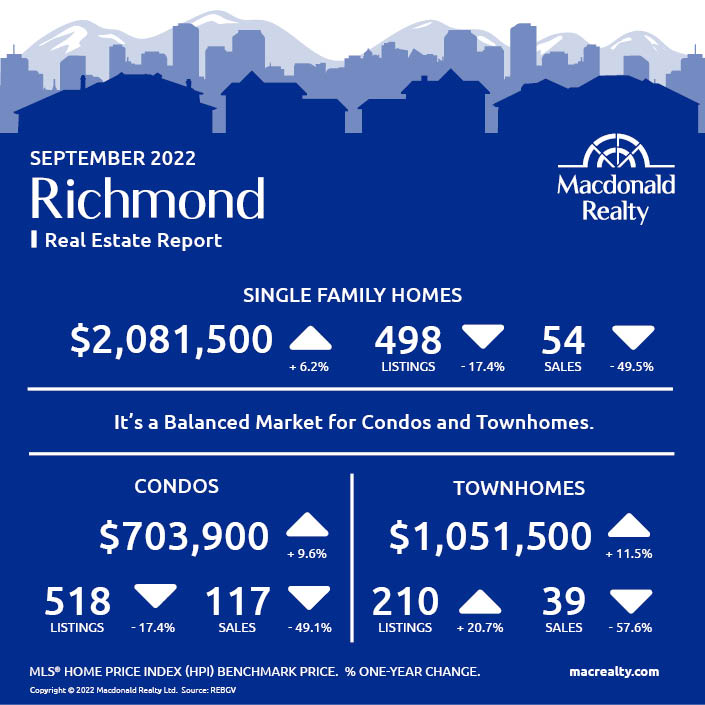
Richmond
Tsawwassen

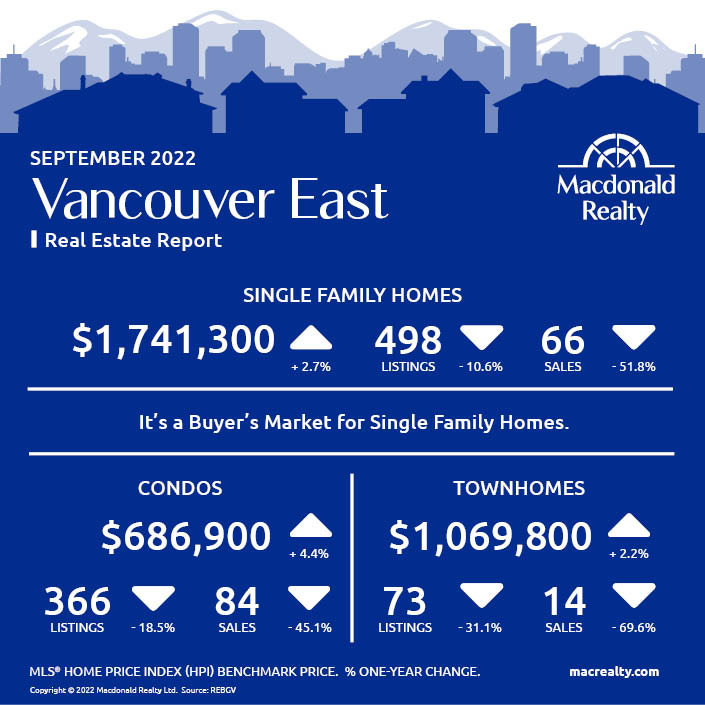
Vancouver East
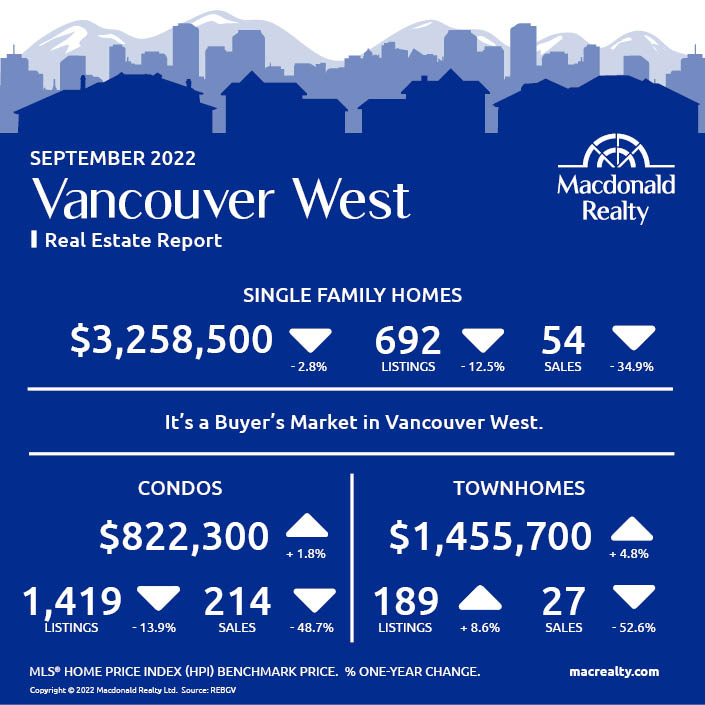
Vancouver West
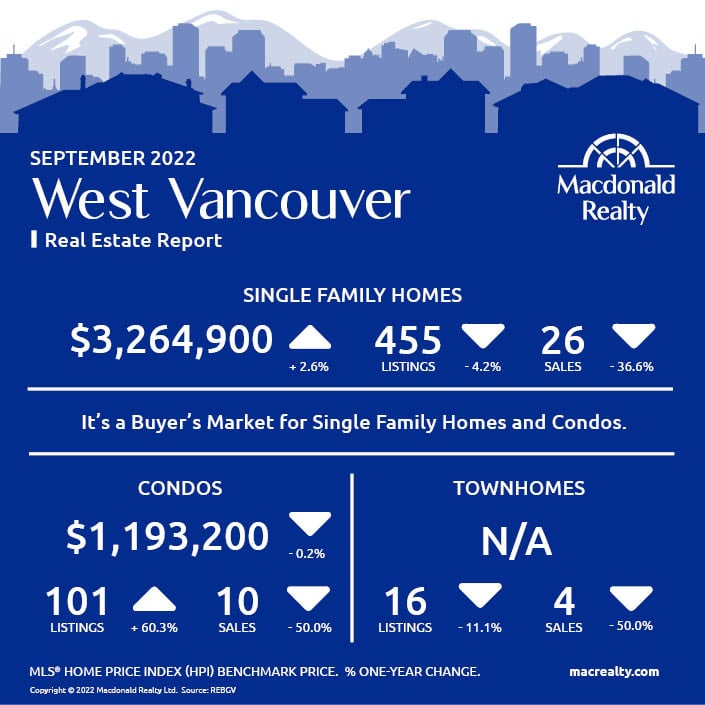
West Vancouver
Looking for more information about the real estate market in specific neighbourhoods in the Greater Vancouver?
Macdonald Realty has offices across the Greater Vancouver. Please email [email protected] or call 1-877-278-3888 to be matched with a REALTOR® working in your area.
MLS® Home Price Index (HPI) Benchmark Price
Average and median home prices are often misinterpreted, are affected by change in the mix of homes sold, and can swing dramatically from month to month (based on the types and prices of properties that sold in a given month). The MLS® HPI overcomes these shortcomings and uses the concept of a benchmark home, a notional home with common attributes of typical homes in a defined area. Visit www.housepriceindex.ca for more information.
This blog post is based on market data provided by the Real Estate Board of Greater Vancouver (REBGV) www.rebgv.org
by Macrealty Marketing Team | Oct 5, 2022 | Market Updates
October 2022 – Lower Mainland Monthly Update (REBGV & FVREB)
Metro Vancouver & Fraser Valley sales are at their lowest in over 10 years.
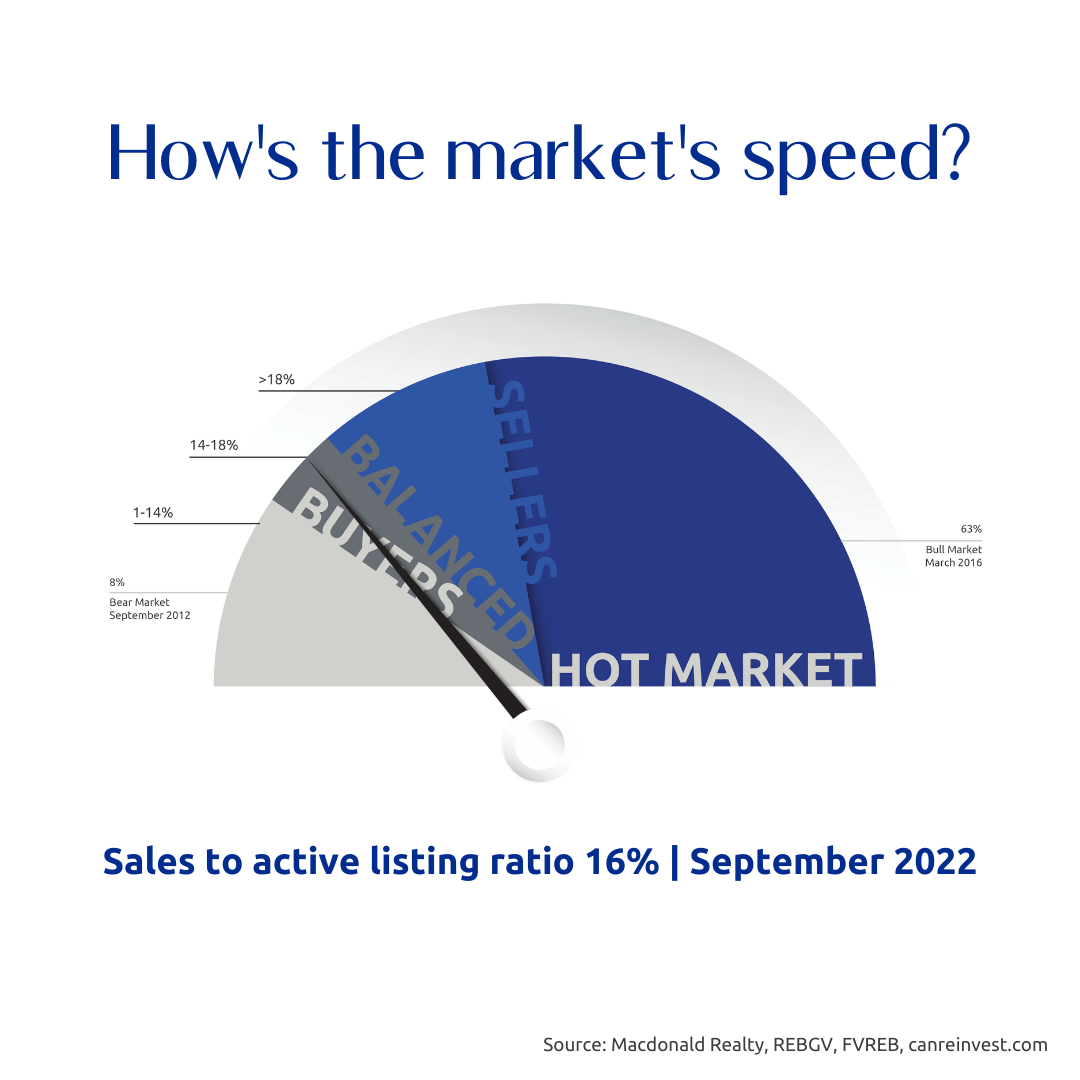
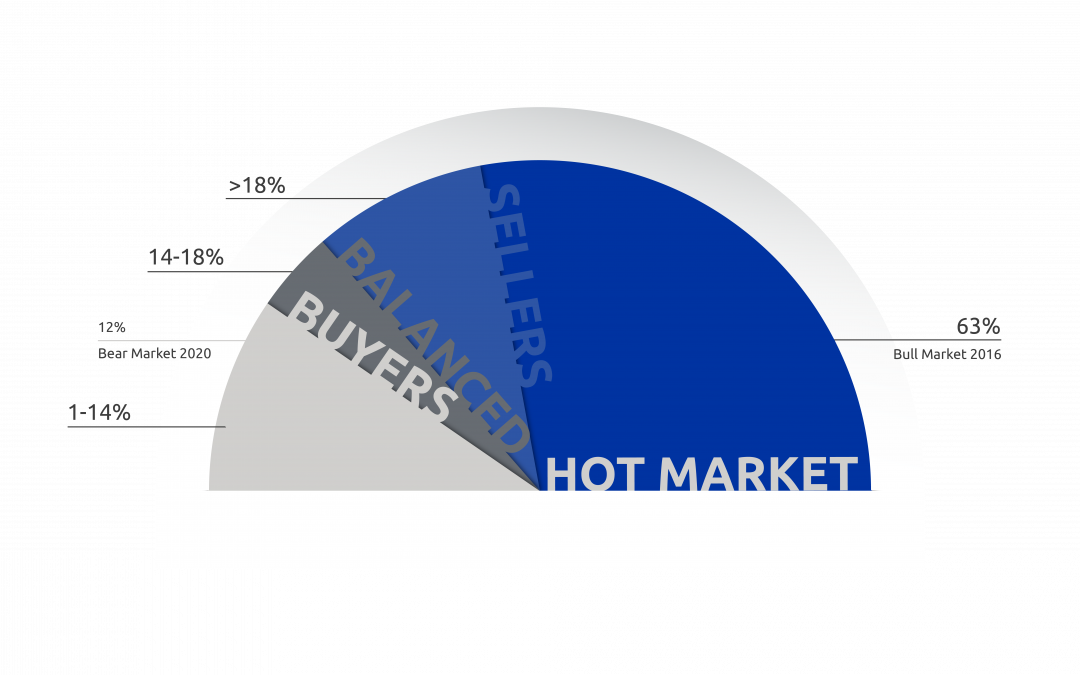
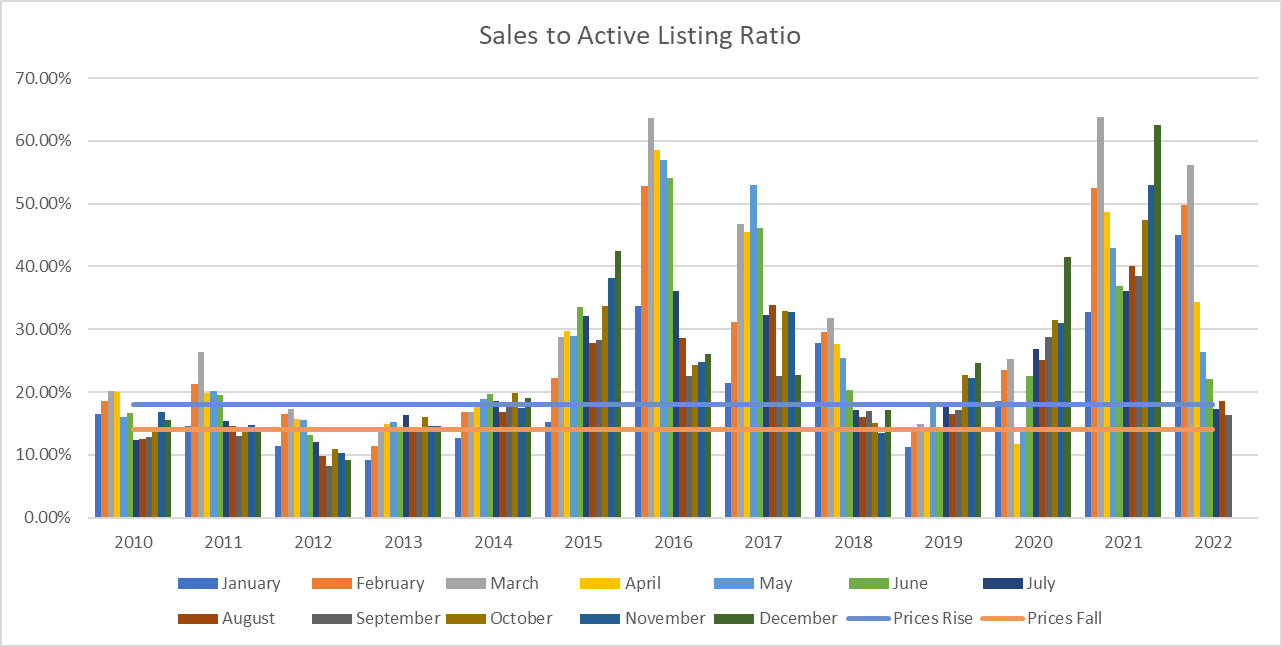
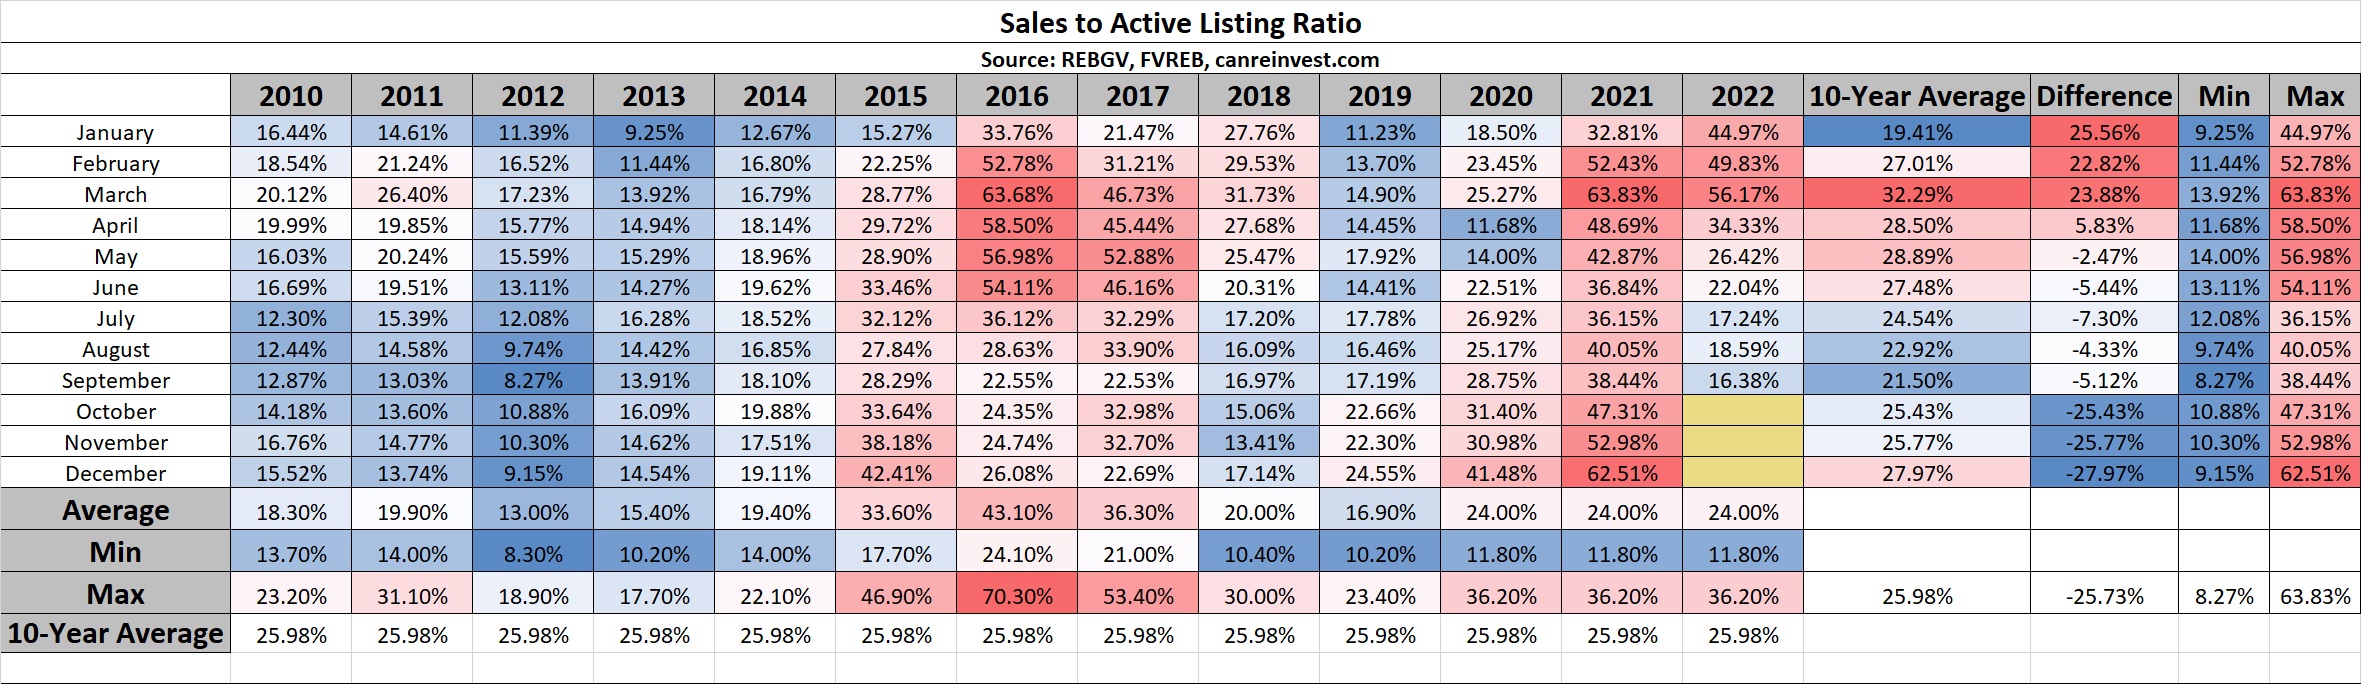
The most reliable indicator of market prices is the Sales to Active Listings Ratio (SAL). This is the ratio between the number of sales in a given month and the number of active listings at month-end.
In hotter markets in BC, a long-term analysis has shown that prices will usually act in the following ways:
- 7+ Months of Inventory (Under 14% SAL): Prices will likely DECLINE
- 5 – 7 Months of Inventory (14% – 18% SAL): Prices will likely be STABLE
- Less than 5.5 Months of Inventory (Over 18% SAL): Prices will likely RISE
Visit this link to learn more about house prices and inventory.
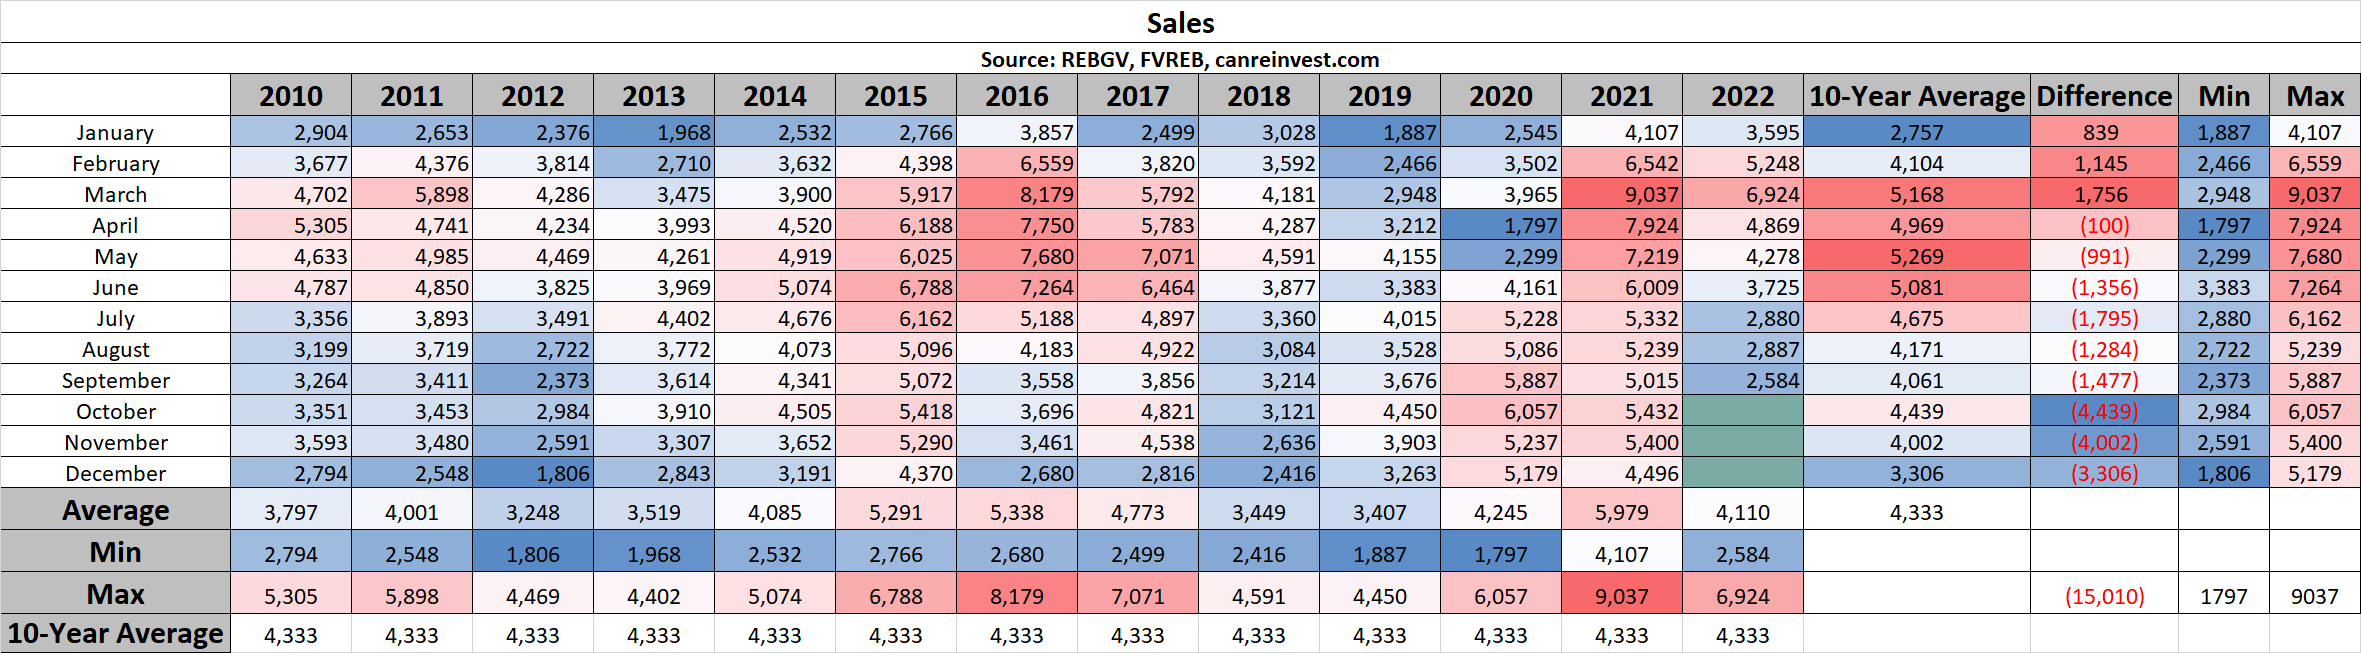
Sales
Sales in September fell to their lowest level in over 10 years, as buyers continued to take a breather to adjust to the new interest rate environment.
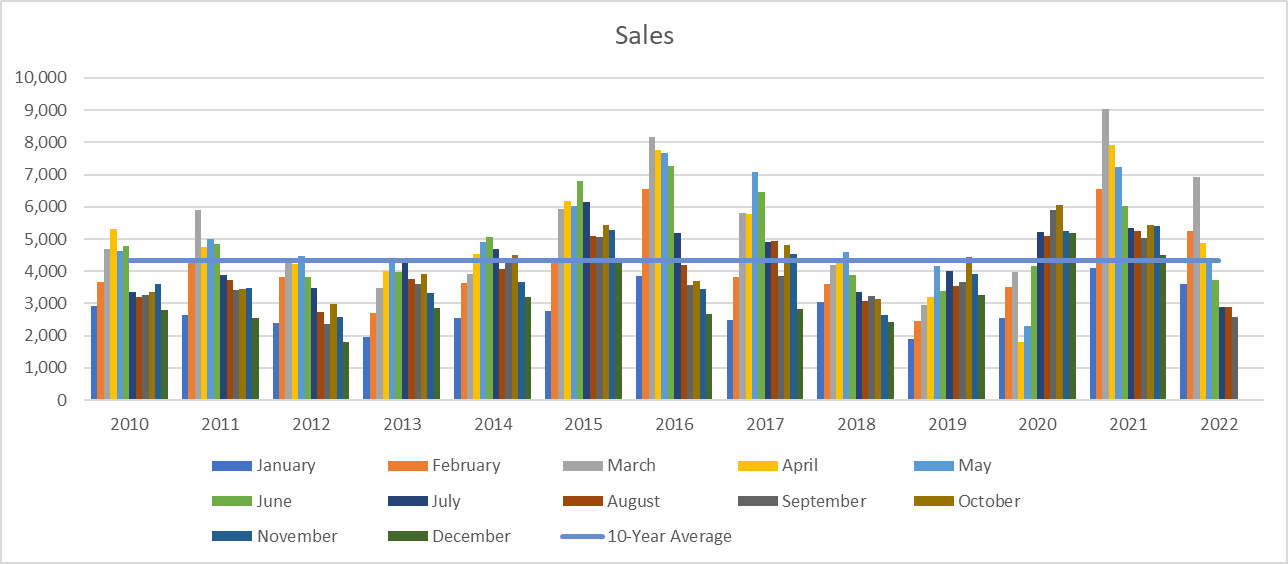
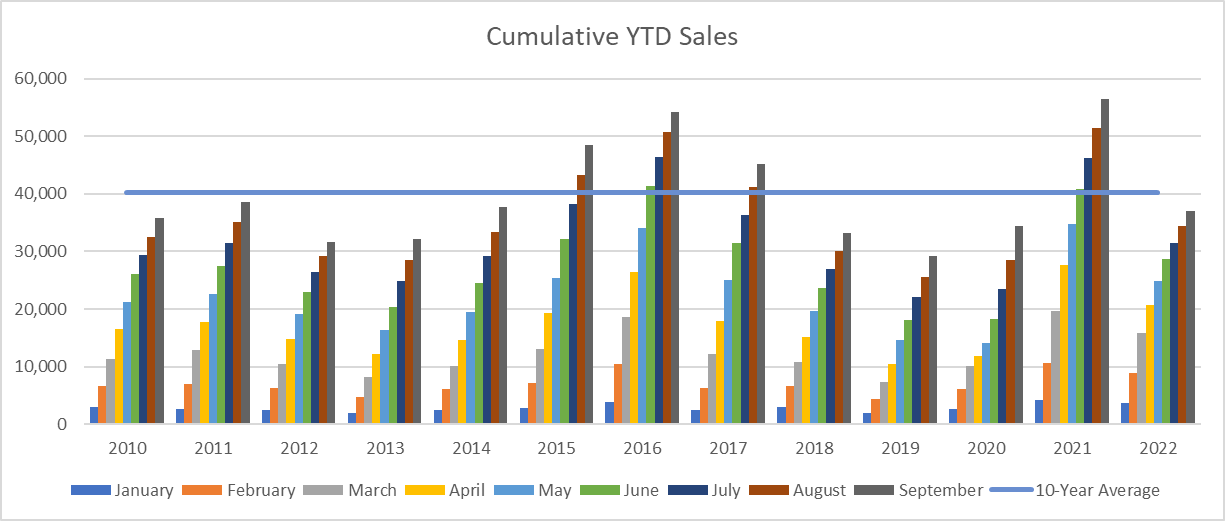
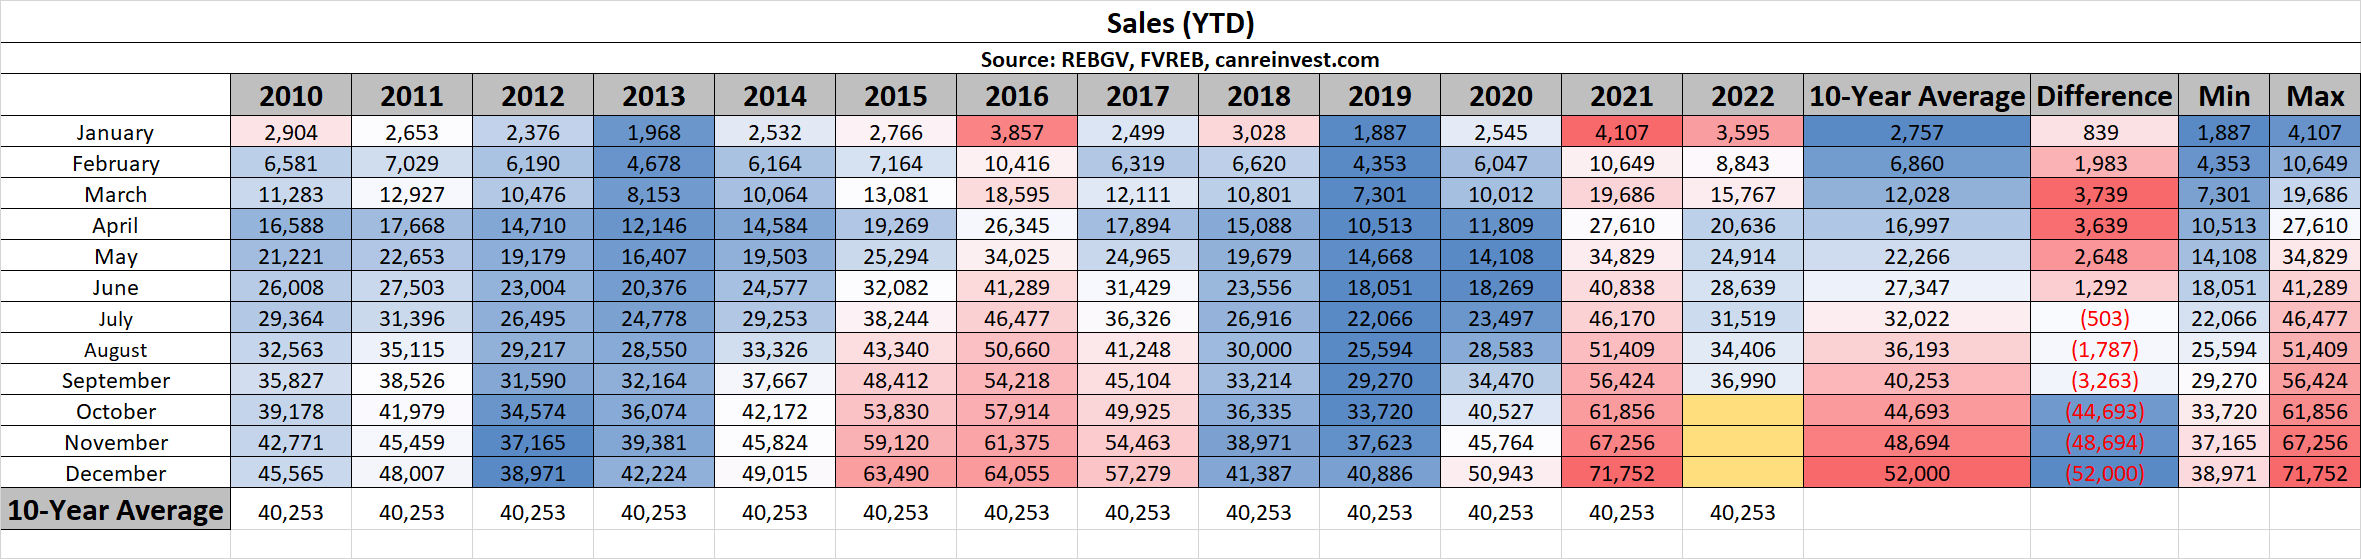
Cumulative Year-to-date Sales
Despite the strong start to the year, 2022 YTD sales (36,990) are now 10% below the 10-year average (40,253)
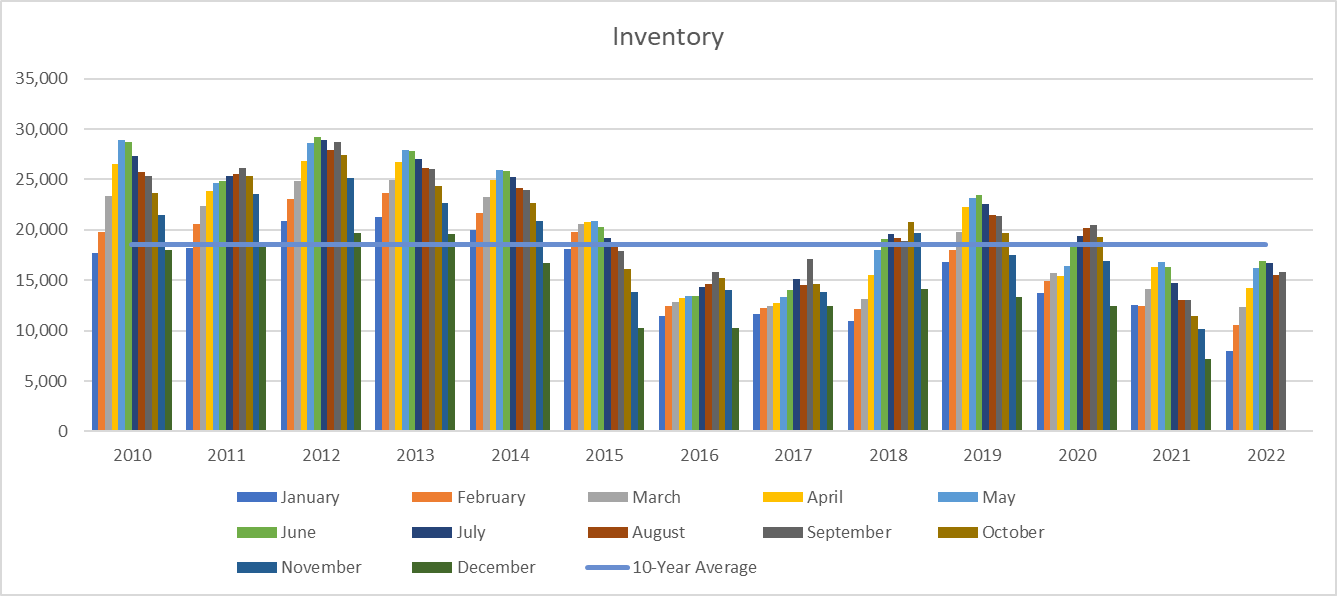
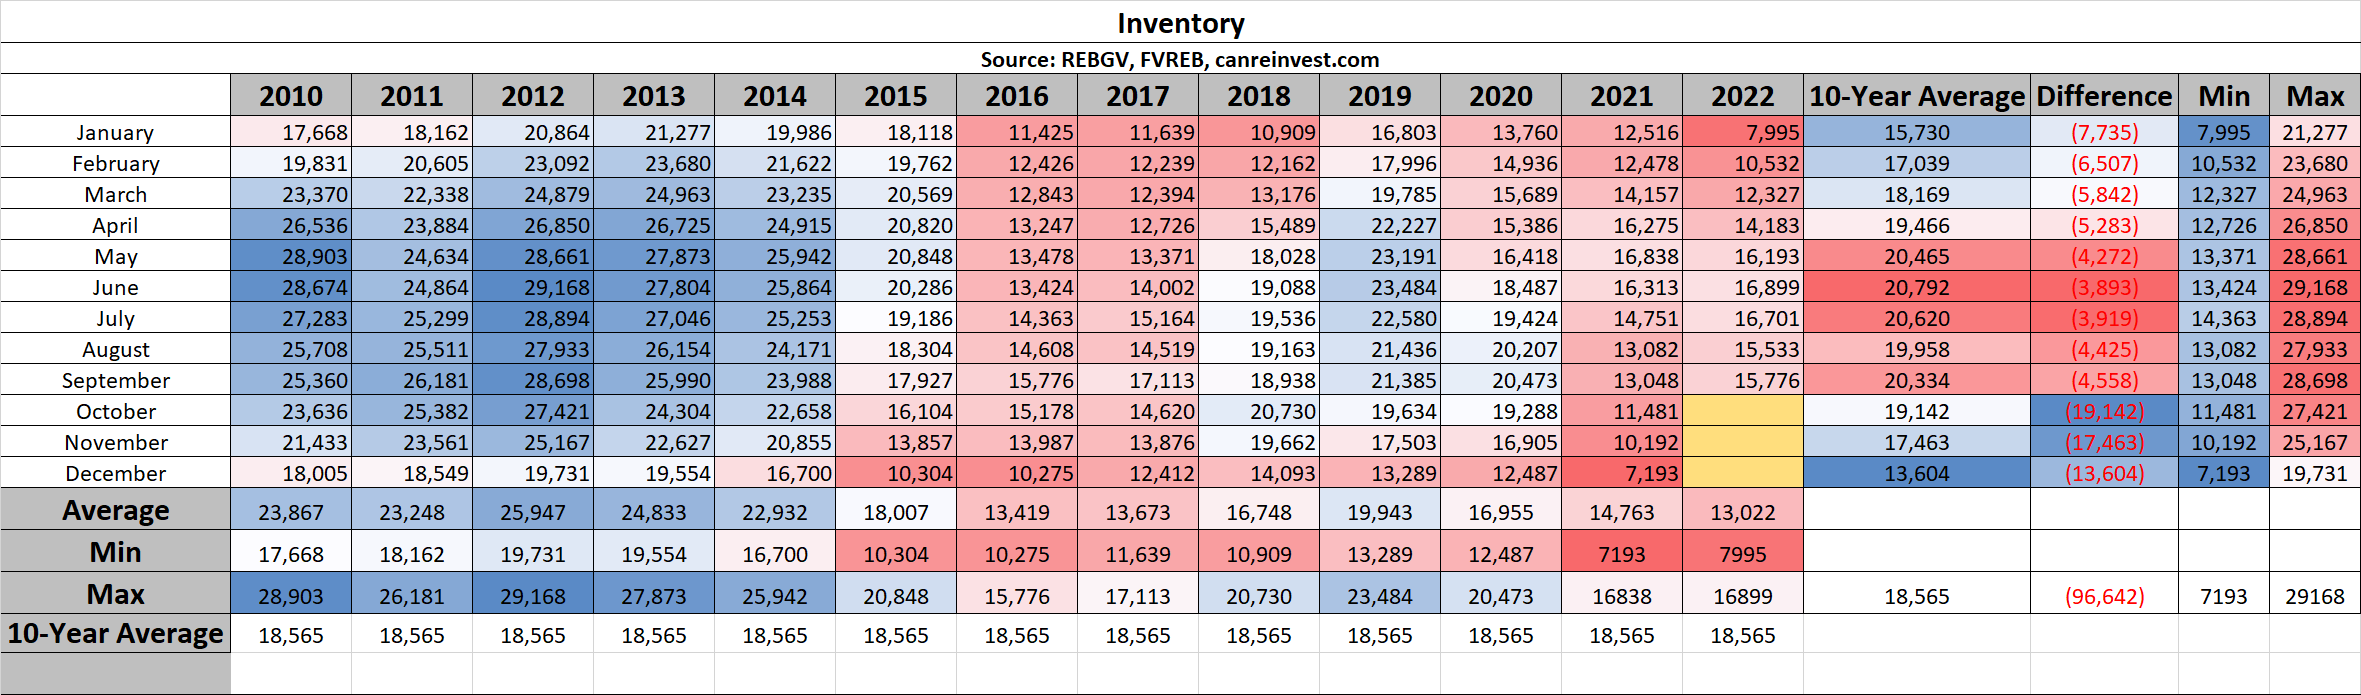
Inventory
September inventory (15,776 active listings) increased slightly from the previous month, but remain 20% below the 10-year average (20,334 average).
Sales to Active Listings
Despite the low sales, low inventory kept the Sales to Active Listing Ratio above 16%, indicating stabilizing prices.
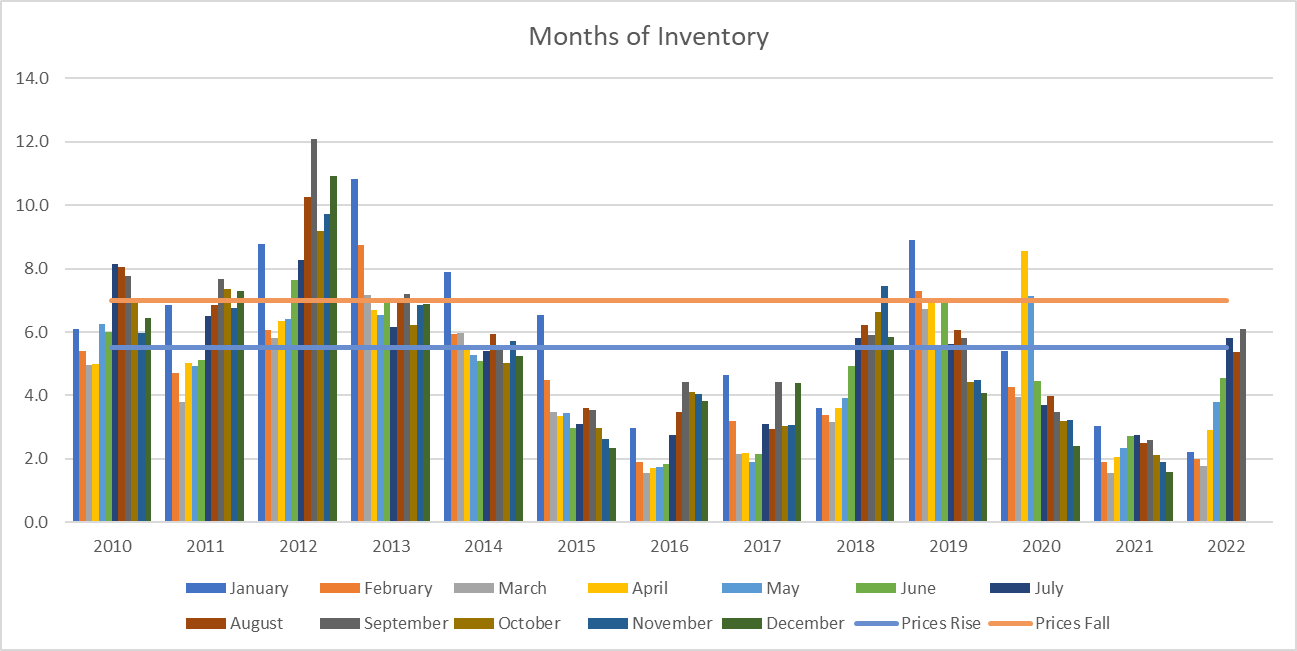
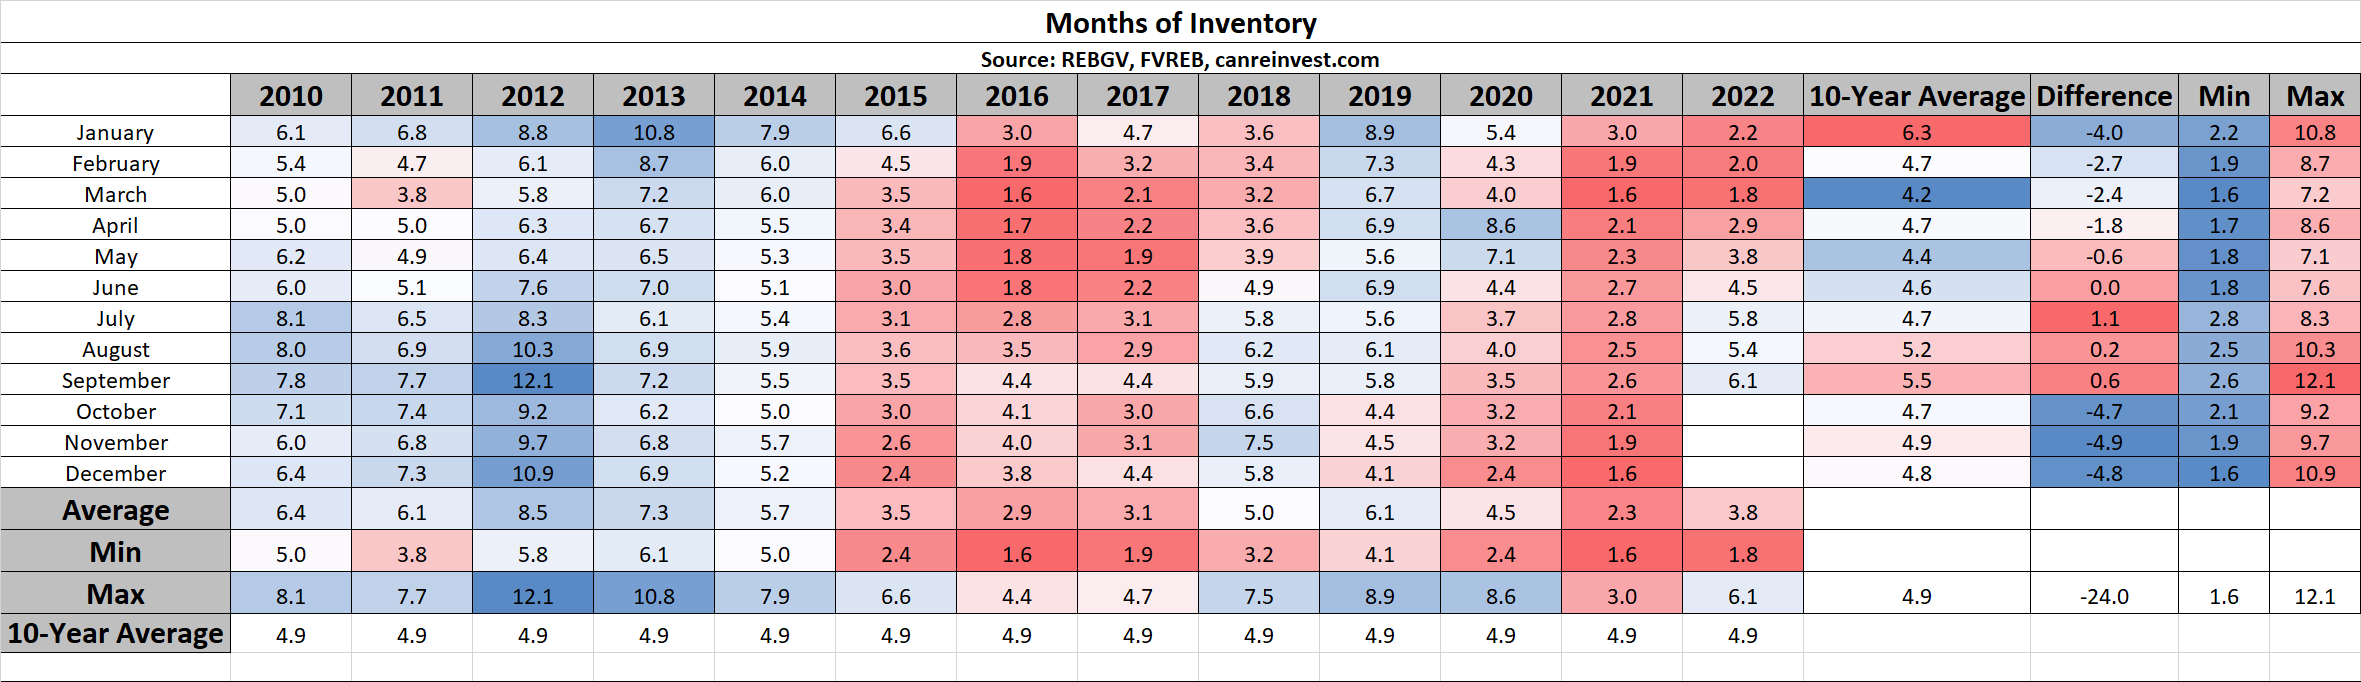
Months of Inventory
Similarly, Months of Inventory grew to 6.1 MOI, indicating a balanced market.
Want to learn more about these stats or discuss your move to Macdonald Realty?
Check out careersinbcrealestate.com to connect today!