by Macrealty Marketing Team | Nov 8, 2022 | Market Updates
November 2022 – Lower Mainland Monthly Update (REBGV & FVREB)
Metro Vancouver & Fraser Valley sales are at their lowest in over 10 years.
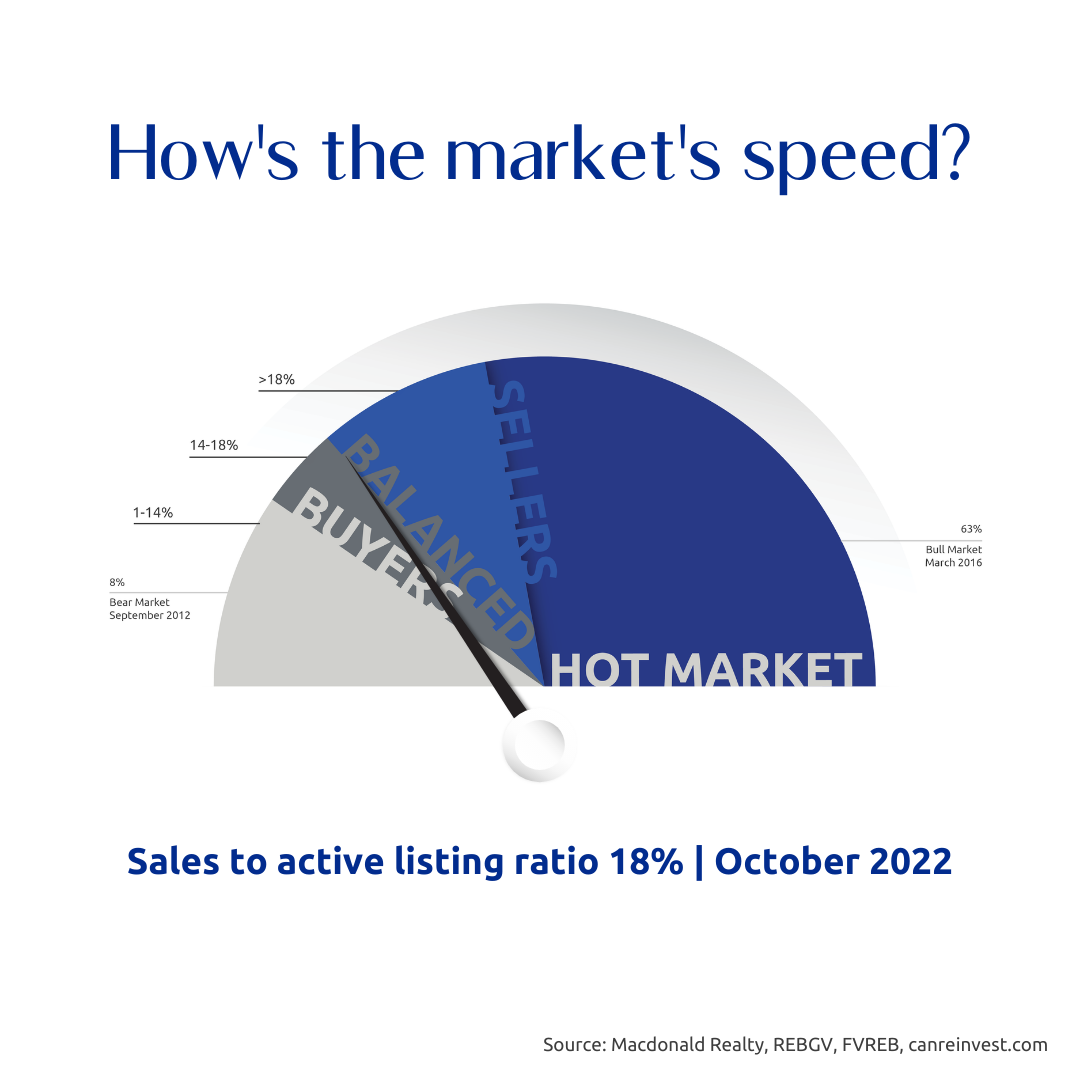
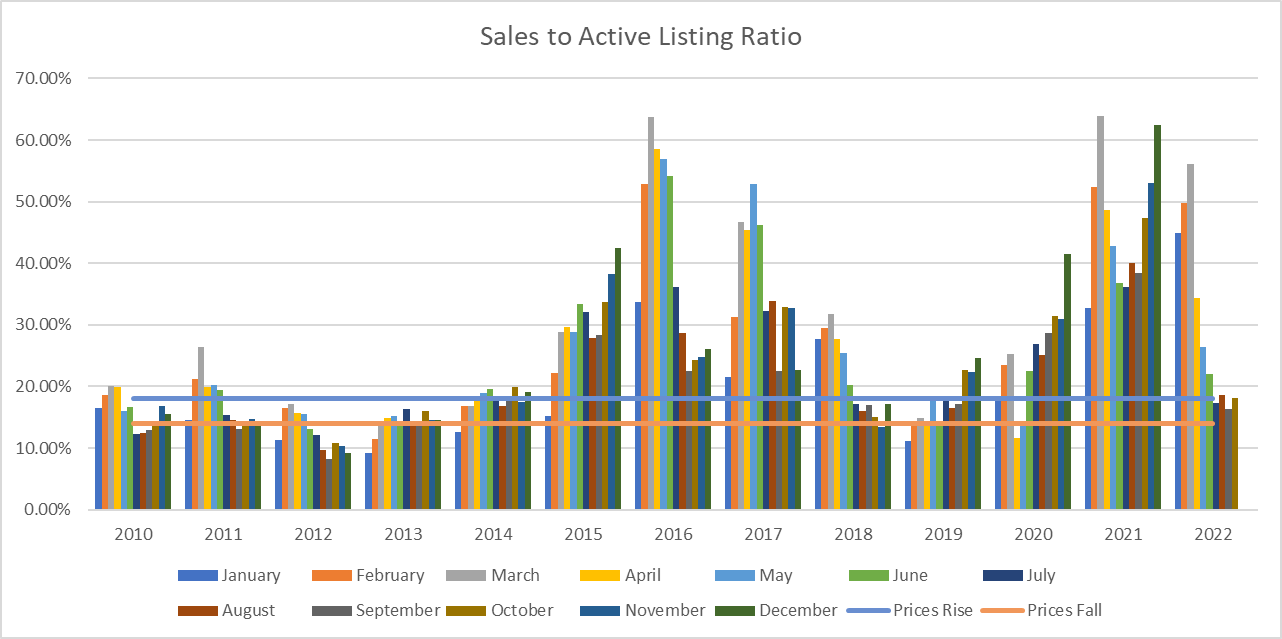
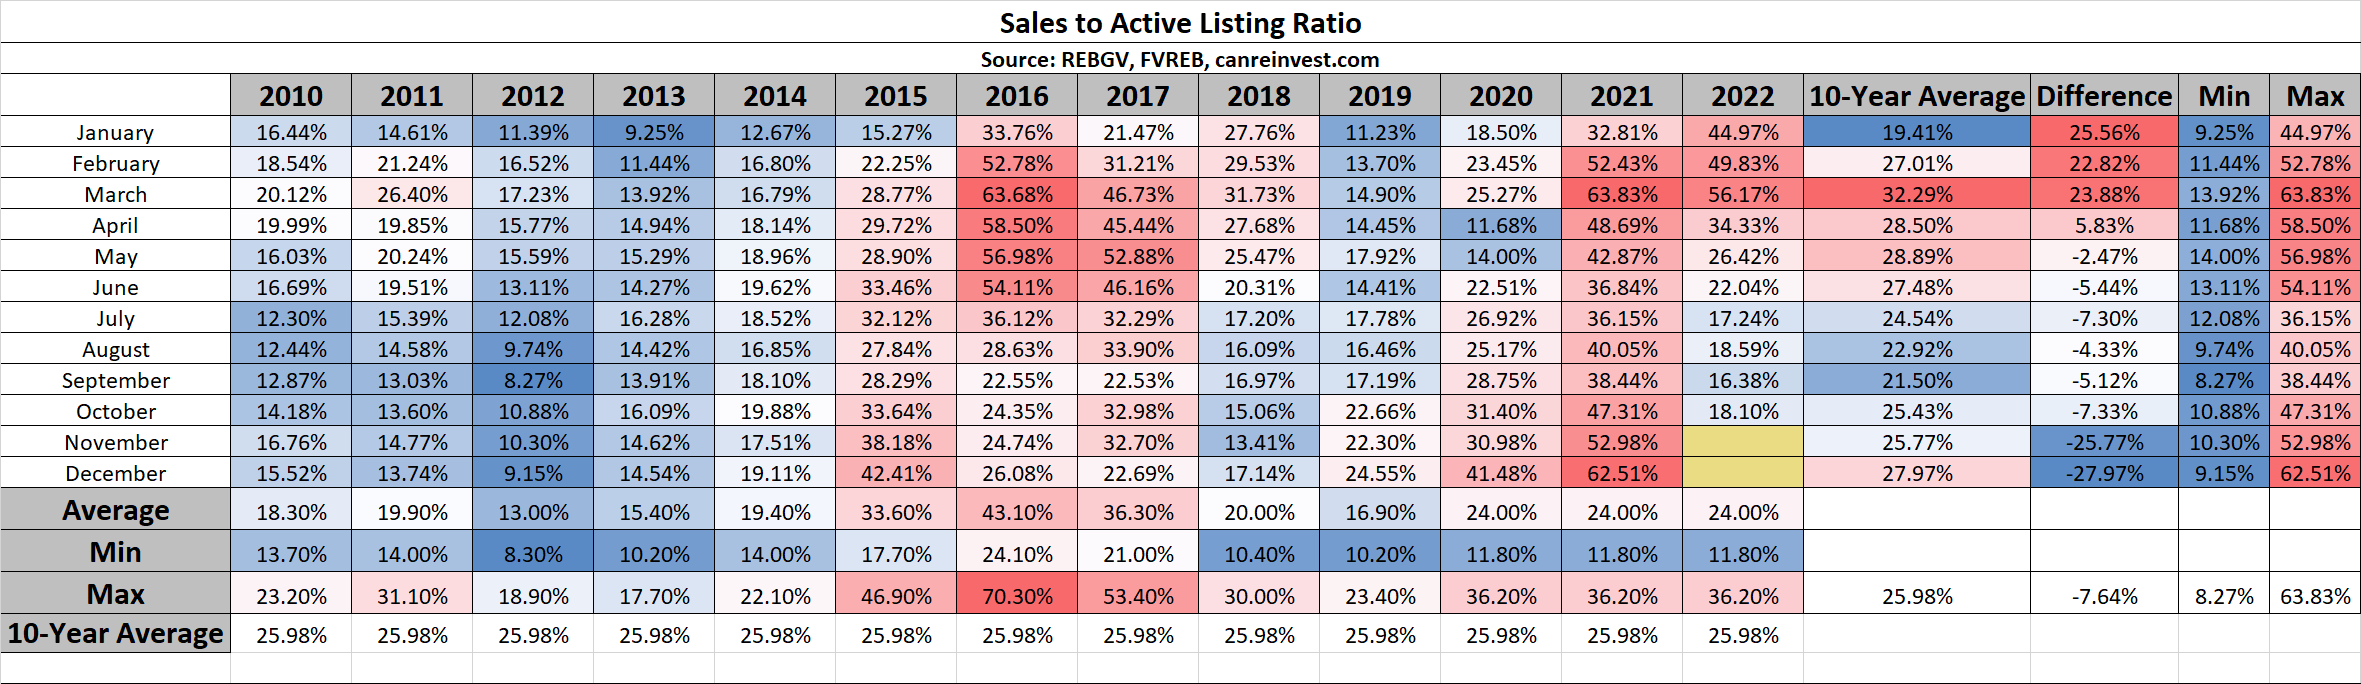
The most reliable indicator of market prices is the Sales to Active Listings Ratio (SAL). This is the ratio between the number of sales in a given month and the number of active listings at month-end.
In hotter markets in BC, a long-term analysis has shown that prices will usually act in the following ways:
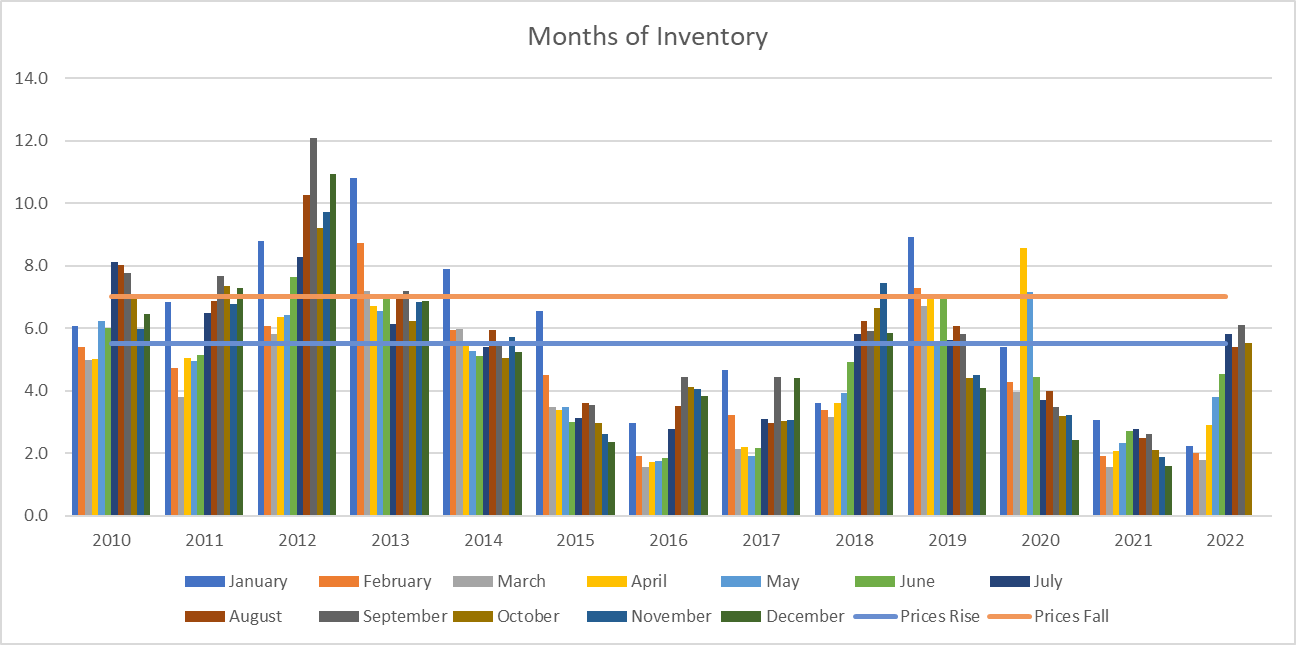
- 7+ Months of Inventory (Under 14% SAL): Prices will likely DECLINE
- 5 – 7 Months of Inventory (14% – 18% SAL): Prices will likely be STABLE
- Less than 5.5 Months of Inventory (Over 18% SAL): Prices will likely RISE
Visit this link to learn more about house prices and inventory.
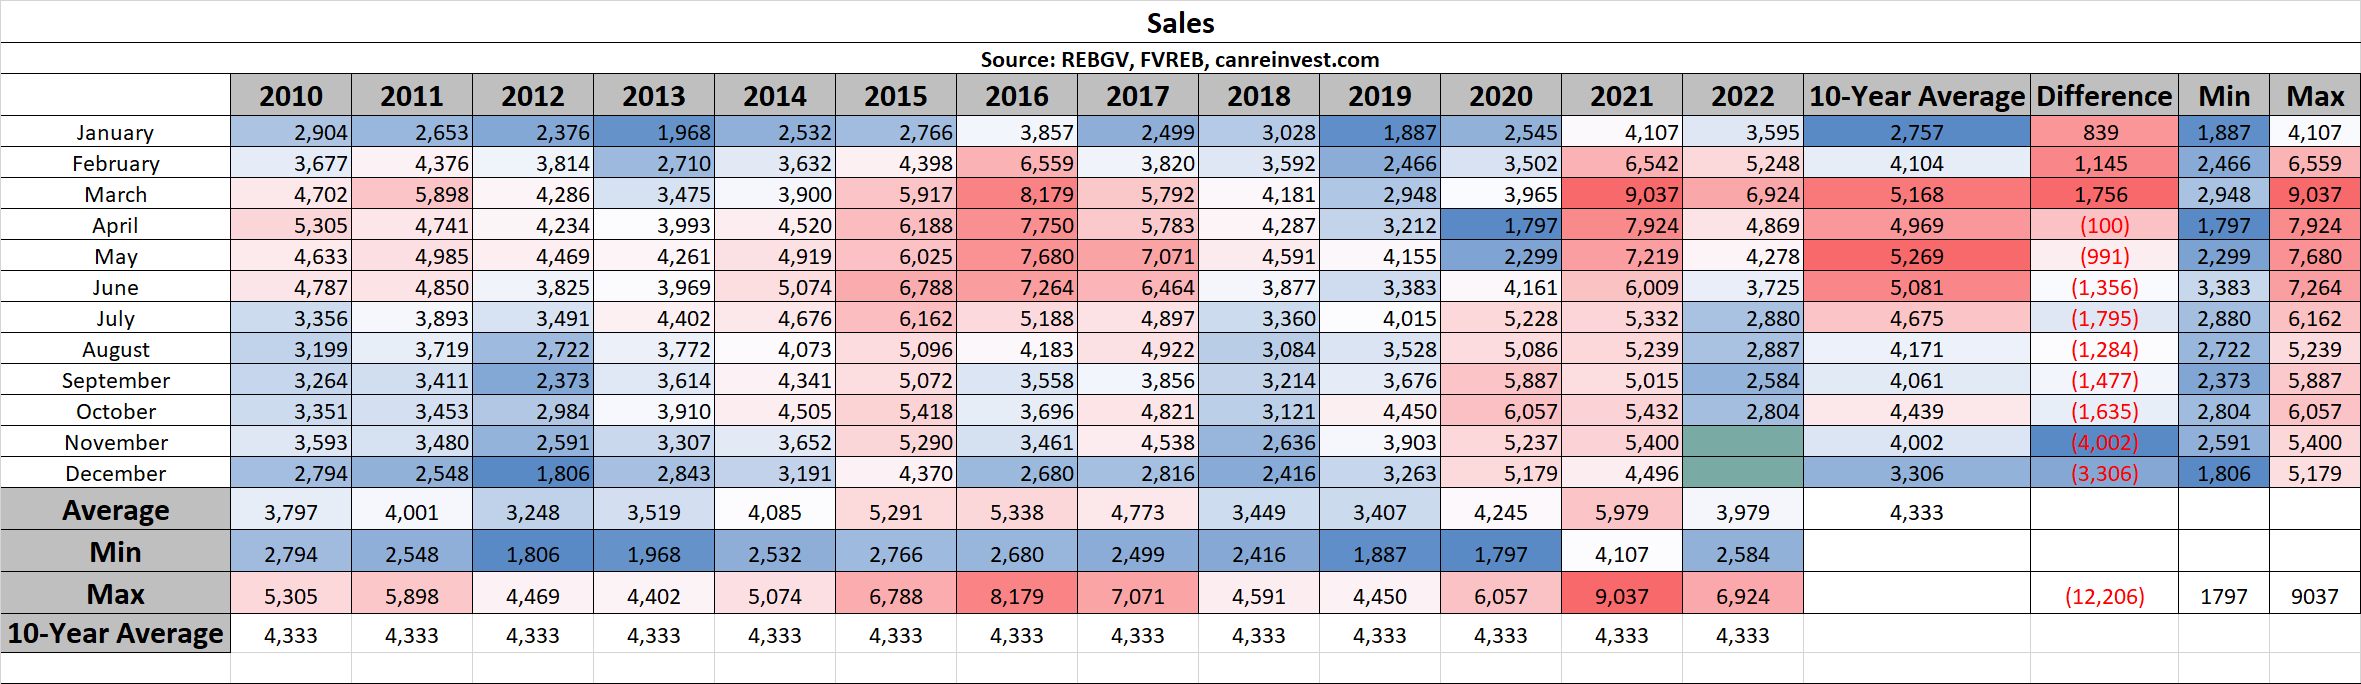
Sales
Lowest number of Sales for October (2,804) in over 10 years. The 10-Year Average for October is 4,439.
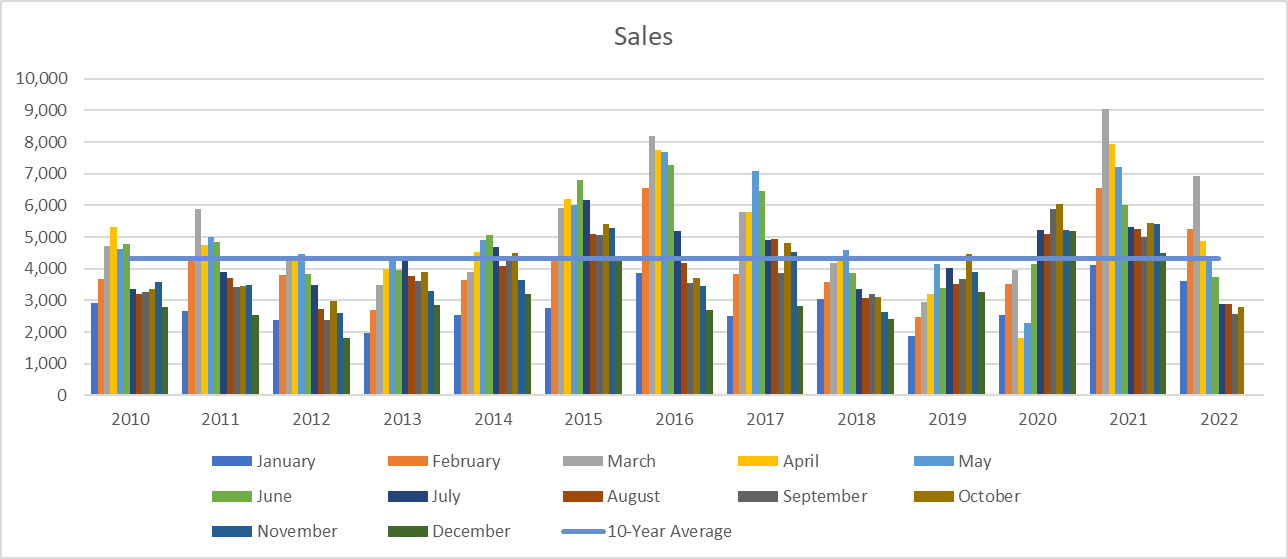
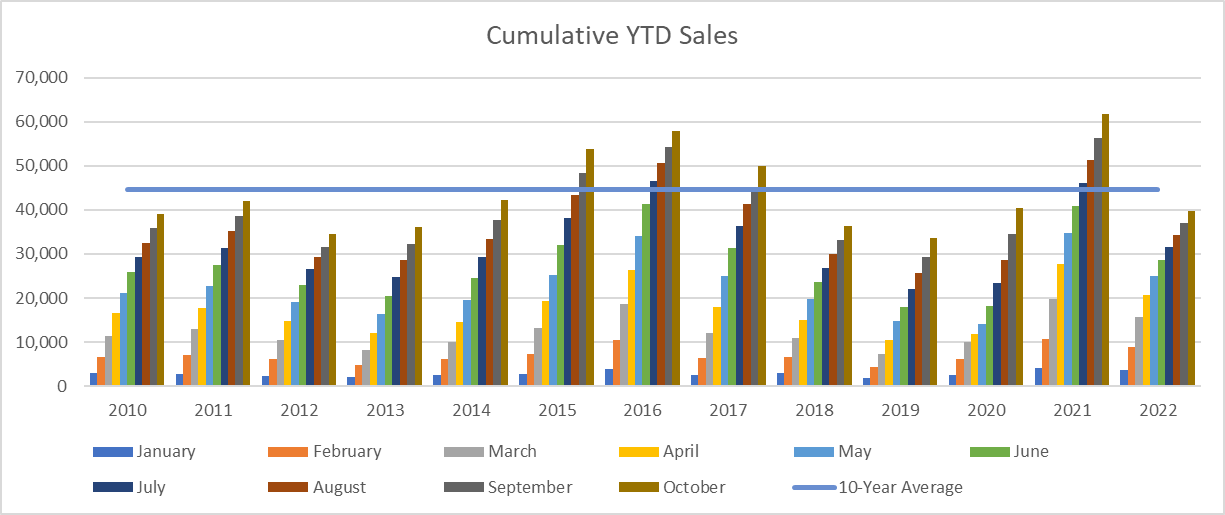
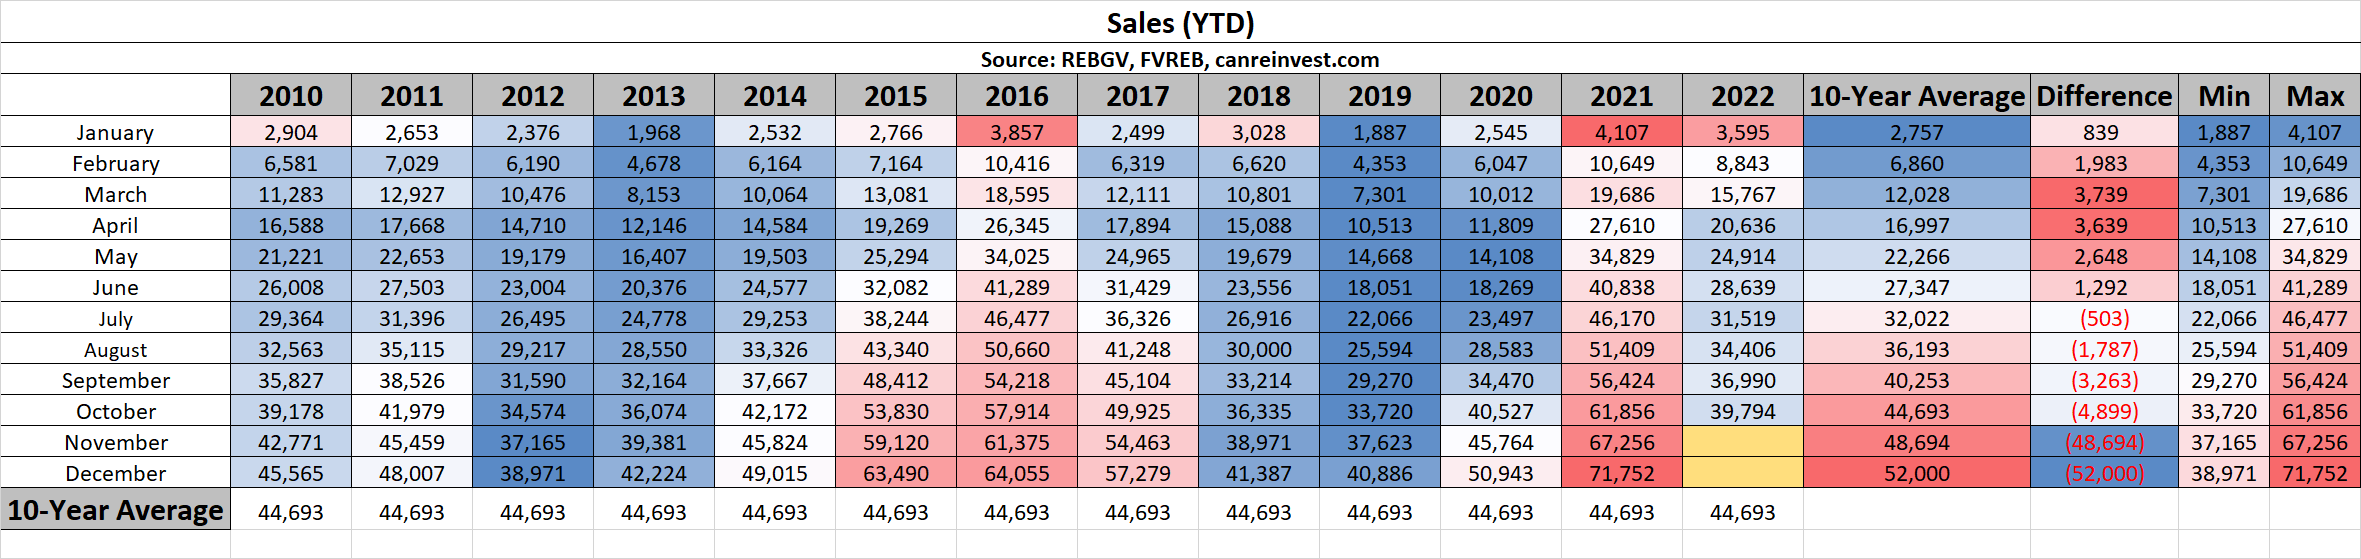
Cumulative Year-to-date Sales
Despite the strong start to the year, 2022 YTD sales (39,794) are now 10% below the 10-year average (44,693)
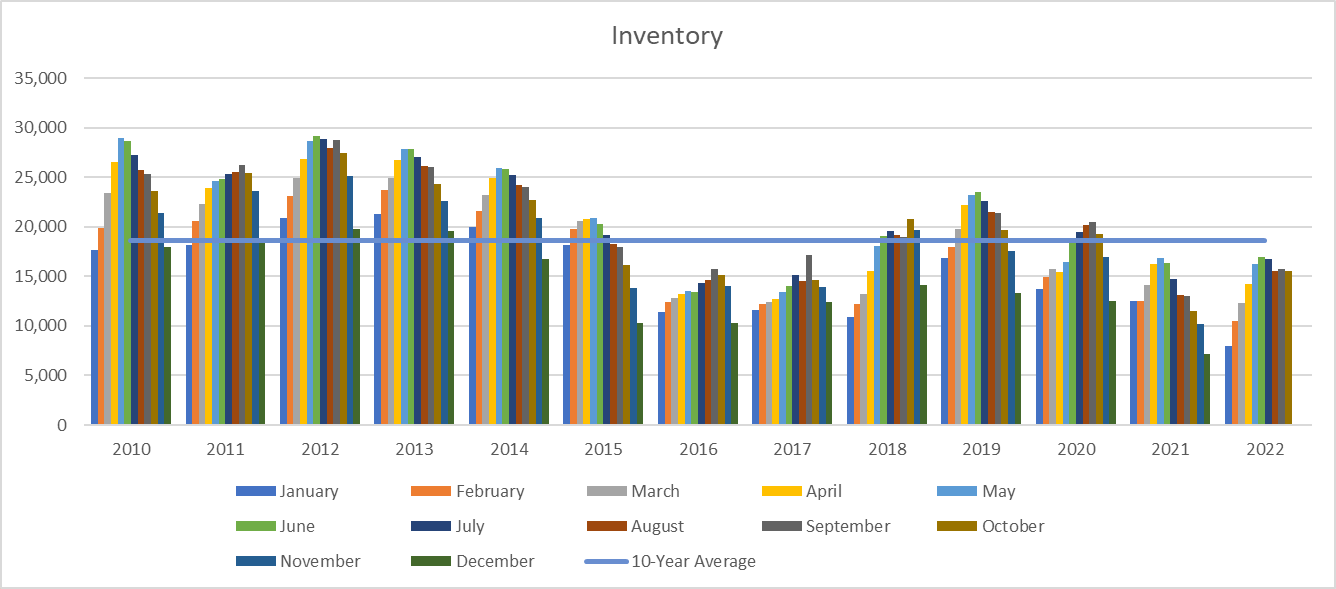
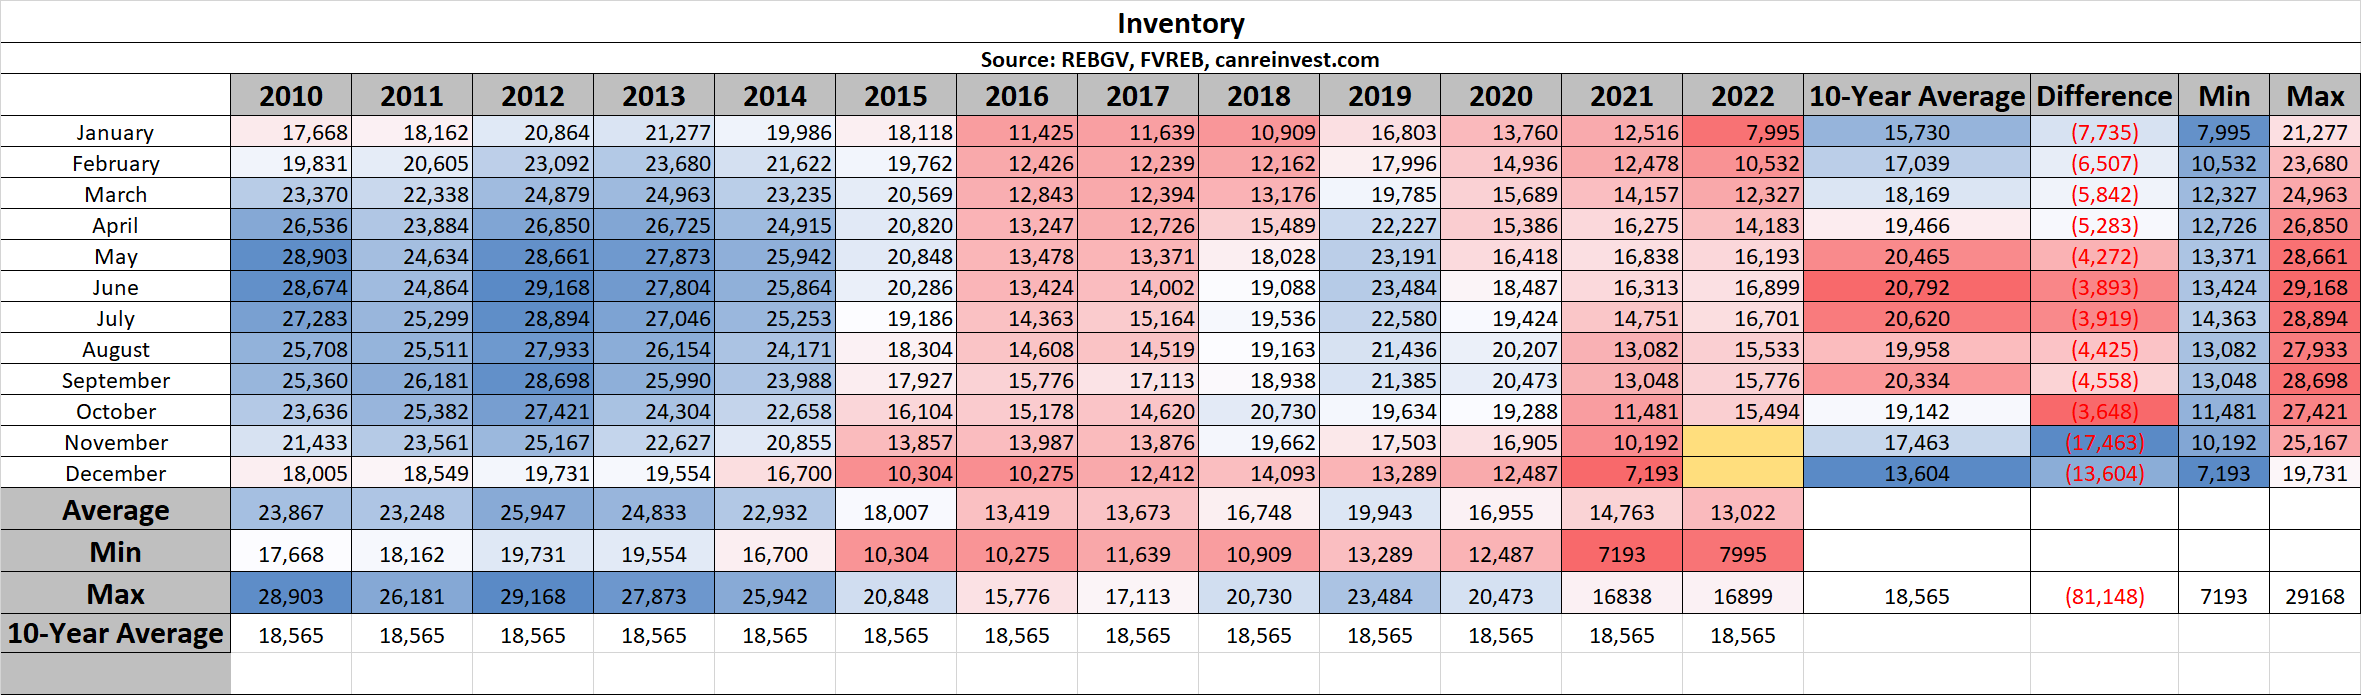
Inventory
October inventory (15,494 active listings) decreased slightly from the previous month, and remains 20% below the 10-year average (19,142 average).
Sales to Active Listings
Despite the low sales, low inventory kept the Sales to Active Listing Ratio above 18%, indicating stabilizing prices.
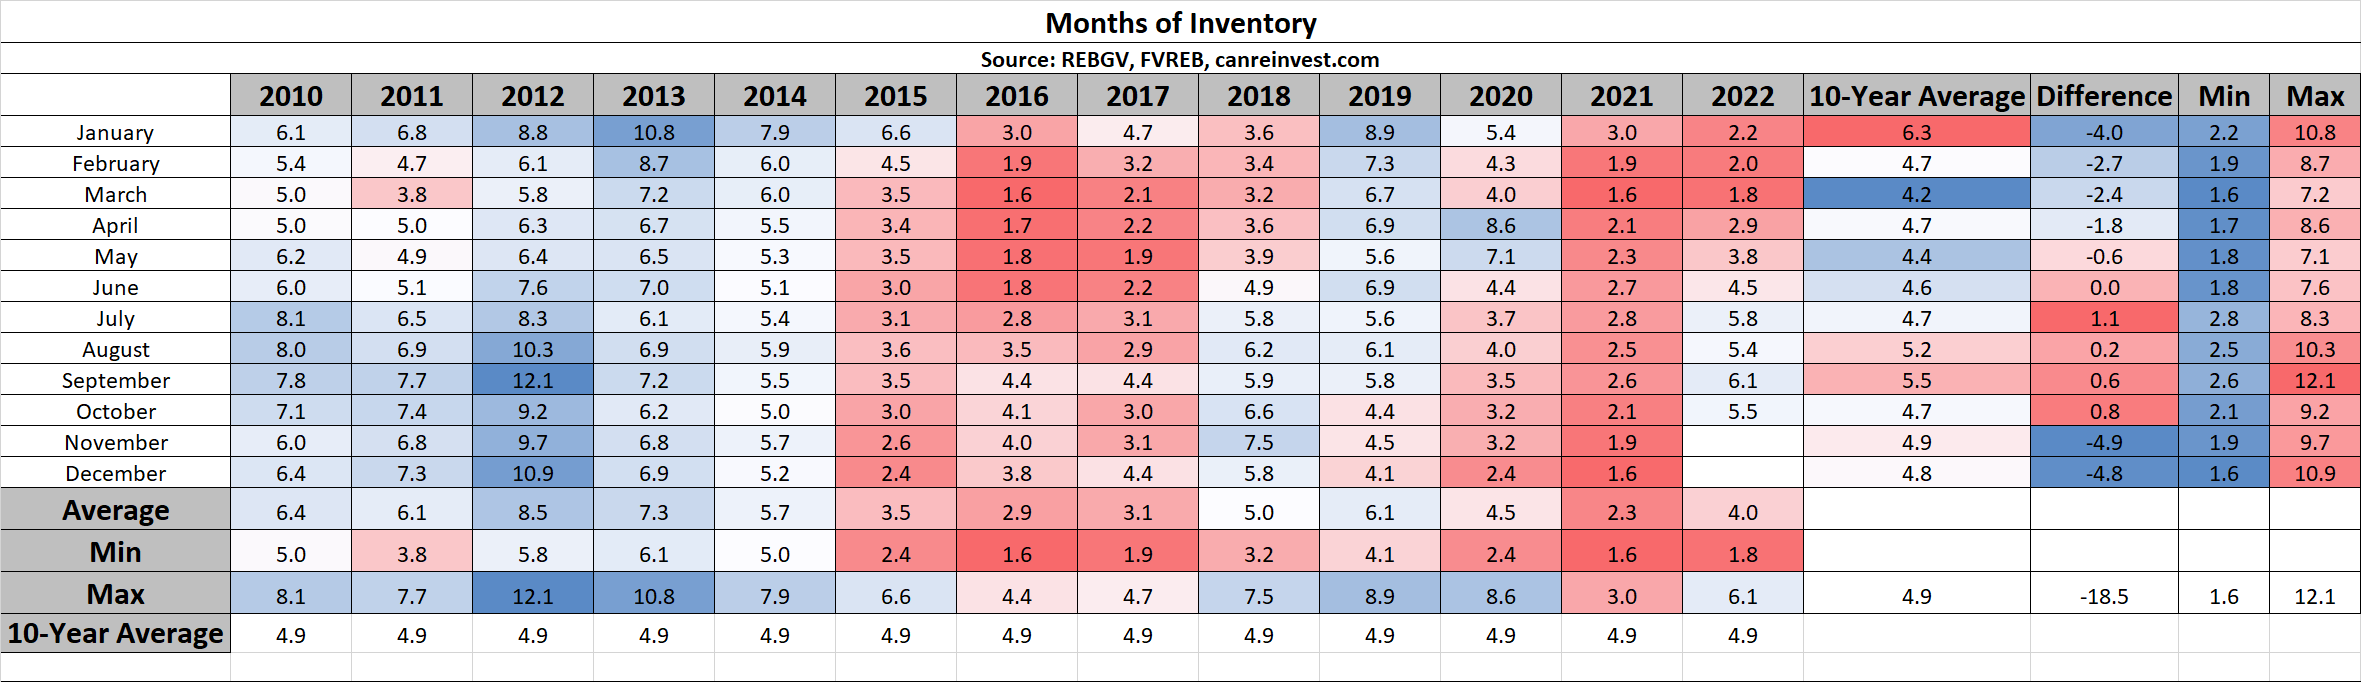
Months of Inventory
Similarly, Months of Inventory grew to 6.1 MOI, indicating a balanced market.
Want to learn more about these stats or discuss your move to Macdonald Realty?
Check out careersinbcrealestate.com to connect today!
by Macrealty Marketing Team | Nov 7, 2022 | Market Updates
Here are the latest real estate market statistics from Macdonald Realty on Okanagan listings and sales in October 2022.
Find the infographics by visiting the Facebook Album.
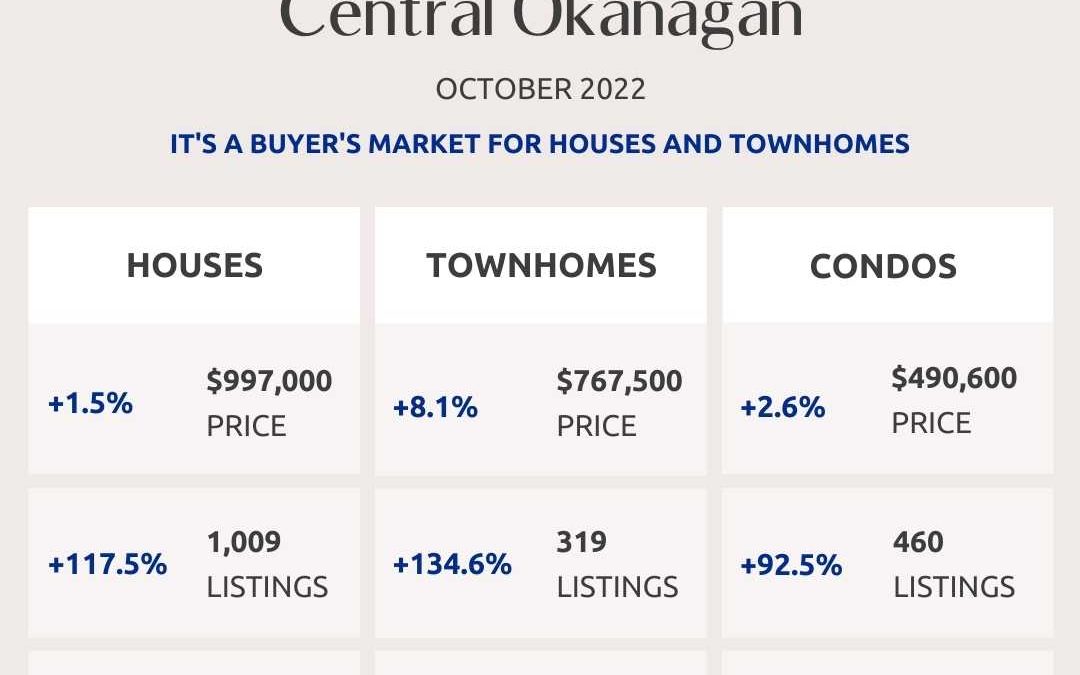
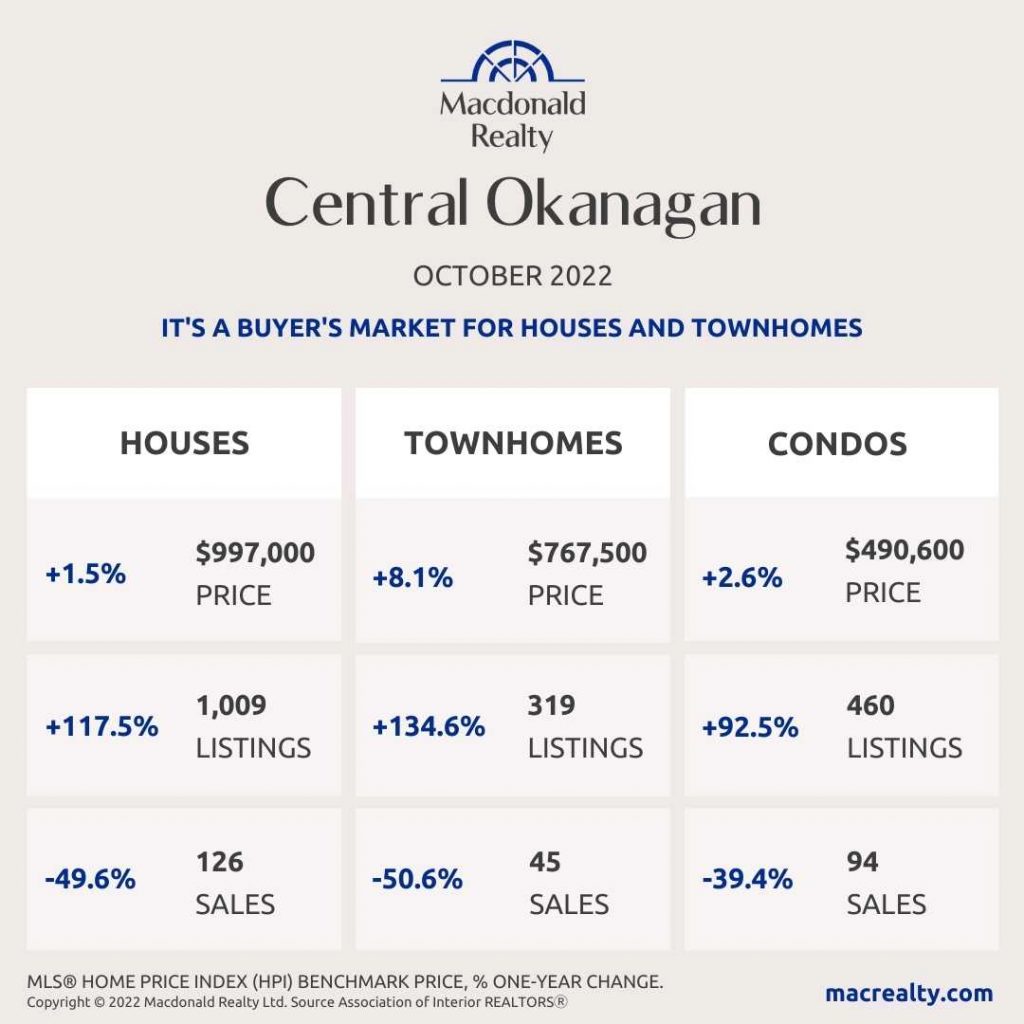
Central Okanagan: Kelowna and Lake Country
There were 126 sales, 1,009 active listings, and $997,000 average sale price for detached homes in the Central Okanagan market, including Kelowna and Lake Country. The condo market featured 94 sales and 460 active listings at the end of the month. The average sale price was $490,600. Townhome sales were 45, active listings were 319 and the average sale price was $767,500. It’s a buyer’s market for houses and townhomes in Central Okanagan.
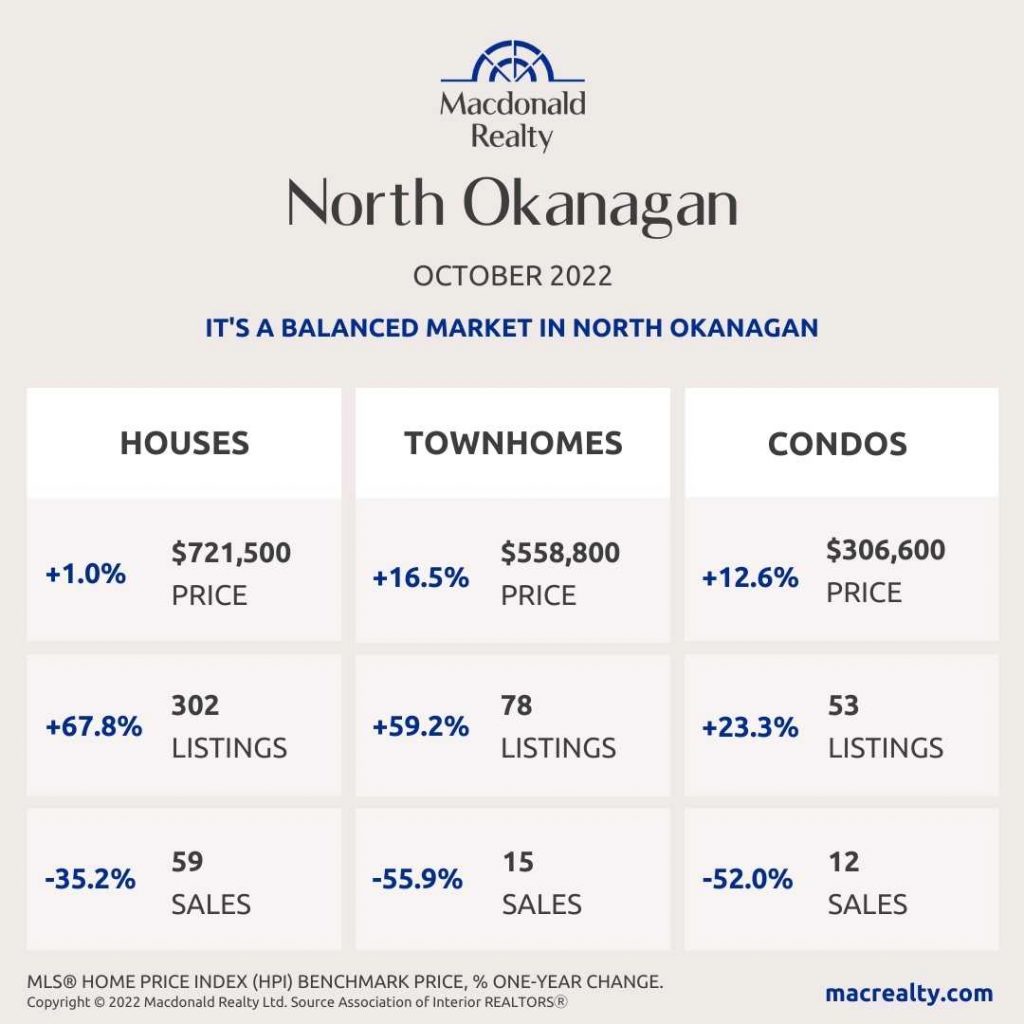
North Okanagan: Vernon and surrounding area
In North Okanagan, including Vernon and the surrounding area and the average detached home sale price was $721,500. At the end of the month, there were 59 sales and 302 active listings. There were 12 sales and 53 active listings for condos. The average sale price was $306,600. In comparison, townhomes featured 15 sales, 78 active listings and a $558,800 average sale price. It’s a balanced market in North Okanagan.
South Okanagan
There were 67 sales, 369 active listings, and $746,500 average sale price for detached homes in the South Okanagan market.
The condo market featured 28 sales and 121 active listings at the end of the month. The average sale price was $439,100. Townhome sales were 10, active listings were 96 and the average sale price was $546,600. It’s a balanced market for houses and condos in South Okanagan.

Looking for more information about the real estate market in specific neighbourhoods in Okanagan?
Macdonald Realty has offices in Kelowna and across BC. Please email [email protected] or call 1-877-278-3888 to be matched with a REALTOR® working in your area.
This blog post is based on market data provided by the Association Of Interior REALTORS® https://www.interiorrealtors.ca/.
by Macrealty Marketing Team | Nov 7, 2022 | Market Updates
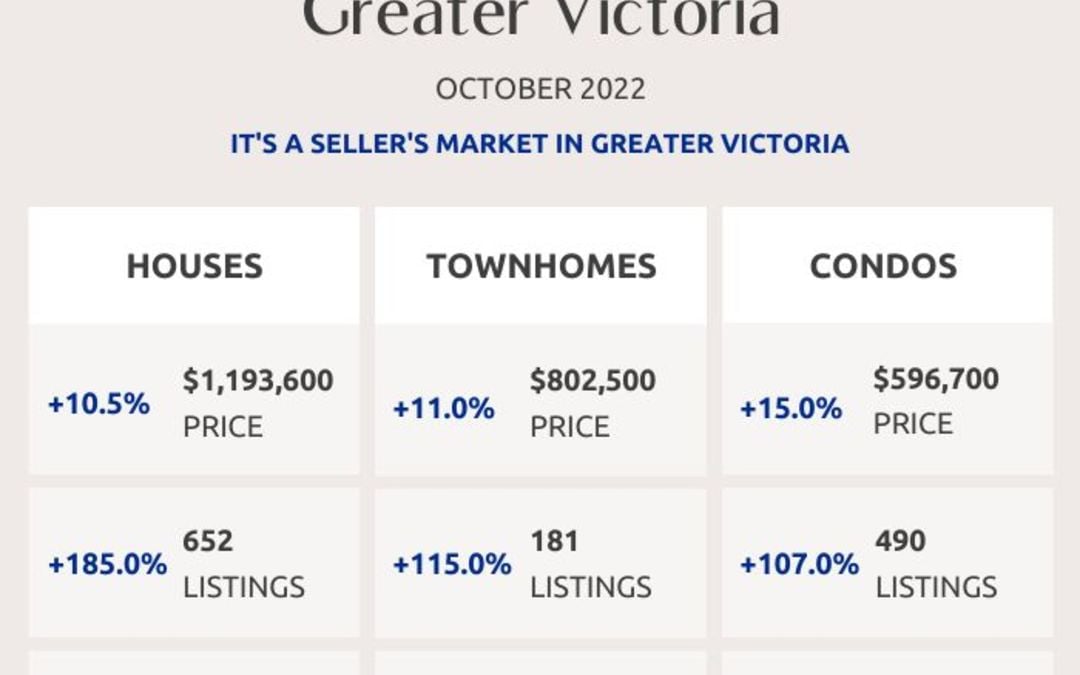
Here are the latest real estate market statistics from Macdonald Realty on Greater Victoria, Saanich Peninsula, Parksville/Qualicum, and Nanaimo listings and sales in October 2022. Find all the infographics related to the October Market Statistics by visiting the Facebook Album.
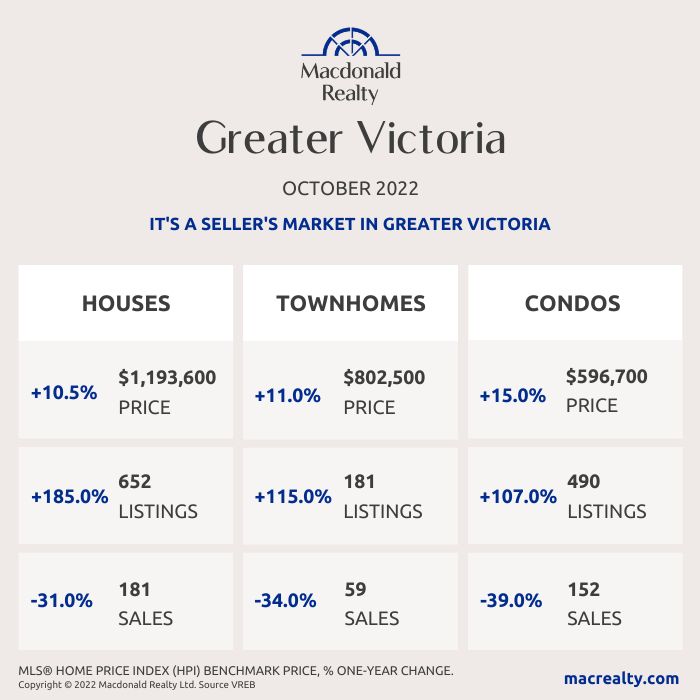
A slight uptick in sales and inventory, but Victoria market still requires commitment to homes.
A total of 480 properties sold in the Victoria Real Estate Board region this October, 35.6 per cent fewer than the 745 properties sold in October 2021 but a 17.1 per cent increase from September 2022. Sales of condominiums were down 39 per cent from October 2021 with 152 units sold. Sales of single family homes decreased 32.2 per cent from October 2021 with 230 sold.
“Inventory has remained stable this month and for the first time since May 2022, we see a slight increase in the month over month sales,” says Victoria Real Estate Board President Karen Dinnie-Smyth. “We noted last month that the number of sales for September did not necessarily reflect the on-the-ground activity in the marketplace. October sales have shown what the industry has been experiencing, an increase in activity, more sales and well-priced homes receiving plenty of attention — some receiving multiple offers. If you are considering selling a property, the continually evolving market conditions this month reinforce the need for up-to-date analysis of how to price your home during this type of market. With many micro-markets within the Greater Victoria area conversations with your local REALTOR® on how the housing market is performing in your specific area will be crucial to your success.”
There were 2,192 active listings for sale on the Victoria Real Estate Board Multiple Listing Service® at the end of October 2022, a decrease of 4.7 per cent compared to the previous month of September but a 111.6 per cent increase from the 1,036 active listings for sale at the end of October 2021.
“With new mayors and councillors heading to work in several of our municipalities, we hope to see strong commitments to positive ways to manage the current and future housing needs of our communities high on council agendas,” adds President Dinnie-Smyth. “The future cost of housing is at stake. The pressure on pricing and in the market overall will not resolve until we see material improvements in the number and types of properties available in the Greater Victoria area. Rentals, townhouses, duplexes, triplexes and beyond are all needed to help ensure that we do not face another cycle of rapid price increases due to lack of inventory in the future. We hope that all municipalities will be looking at gentle density improvements that will ensure more homes for more people in their community planning.”
Greater Victoria
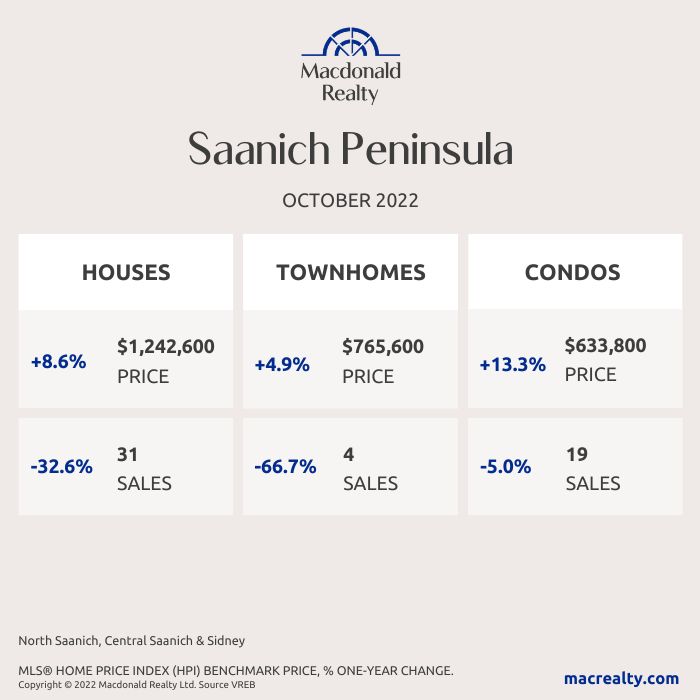
Saanich Peninsula
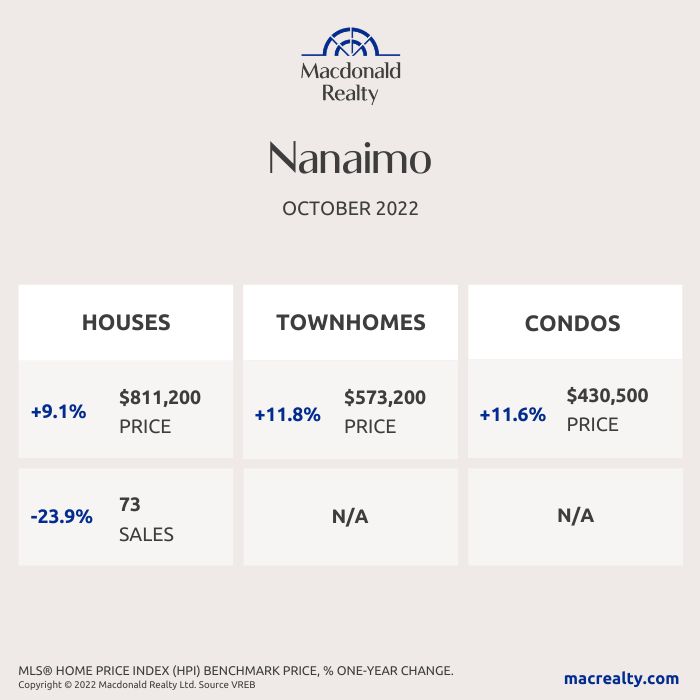
Nanaimo
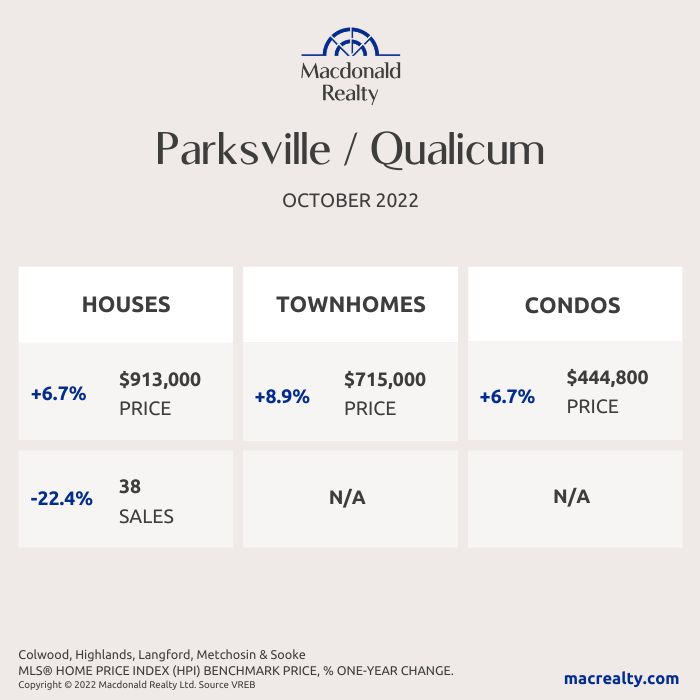
Parksville / Qualicum
Looking for more information about the real estate market in specific neighbourhoods in Victoria, Saanich Peninsula, Parksville, Nanaimo, Vancouver Island and the Gulf Islands?
Macdonald Realty has offices in downtown Victoria, Sidney, Parksville and Salt Spring Island. Please email [email protected] or call 1-877-278-3888 to be matched with a REALTOR® working in your area.
MLS® Home Price Index (HPI) Benchmark Price
Average and median home prices are often misinterpreted, are affected by change in the mix of homes sold, and can swing dramatically from month to month (based on the types and prices of properties that sold in a given month). The MLS® HPI overcomes these shortcomings and uses the concept of a benchmark home, a notional home with common attributes of typical homes in a defined area. Visit www.housepriceindex.ca for more information.
This blog post is based on market data provided by the Victoria Real Estate Board (VREB) www.vreb.org and the Vancouver Island Real Estate Board (VIREB) www.vireb.com. Market data from the VIREB includes listings and sales in Campbell River, Comox Valley, Cowichan Valley Nanaimo, Parksville/Qualicum, Port Alberni/West, North Island, and the Islands.
by Macrealty Marketing Team | Nov 7, 2022 | Market Updates
Here are the latest real estate market statistics from Macdonald Realty on the Greater Vancouver listings and sales in October 2022. Find all the infographics by visiting the Facebook Album.
Inflation, rising interest rates create caution across Metro Vancouver’s housing market.
Home sale activity across the Metro Vancouver housing market continued to trend well below historical averages in October.
The Real Estate Board of Greater Vancouver (REBGV) reports that residential home sales in the region totalled 1,903 in October 2022, a 45.5 per cent decrease from the 3,494 sales recorded in October 2021, and a 12.8 per cent increase from the 1,687 homes sold in September 2022.
Last month’s sales were 33.3 per cent below the 10-year October sales average.
“Inflation and rising interest rates continue to dominate headlines, leading many buyers and sellers to assess how these factors impact their housing options,” Andrew Lis, REBGV’s director, economics and data analytics said. “With sales remaining near historic lows, the number of active listings continues to inch upward, causing home prices to recede from the record highs set in the spring of 2022.”
There were 4,033 detached, attached and apartment properties newly listed for sale on the Multiple Listing Service® (MLS®) in Metro Vancouver in October 2022. This represents a 0.4 per cent decrease compared to the 4,049 homes listed in October 2021 and a 4.6 per cent decrease compared to September 2022 when 4,229 homes were listed.
*Areas covered by the Real Estate Board of Greater Vancouver include Burnaby, Coquitlam, Maple Ridge, New Westminster, North Vancouver, Pitt Meadows, Port Coquitlam, Port Moody, Richmond, South Delta, Squamish, Sunshine Coast, Vancouver, West Vancouver, and Whistler. Check out the infographics of Squamish, Sunshine Coast and Whistler, HERE.
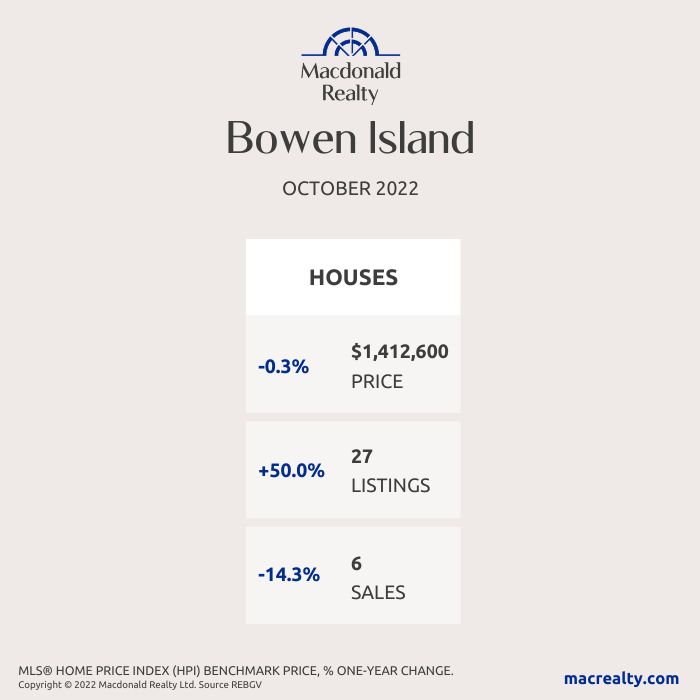
Bowen Island
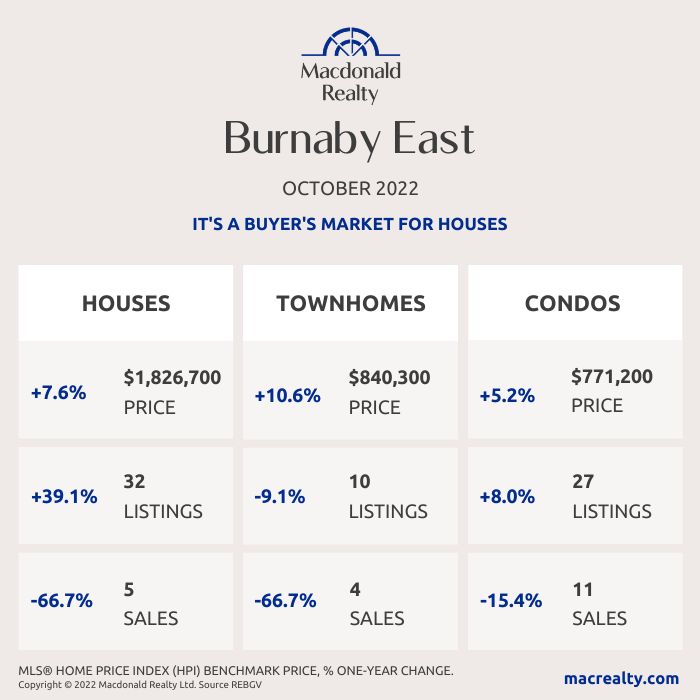
Burnaby East
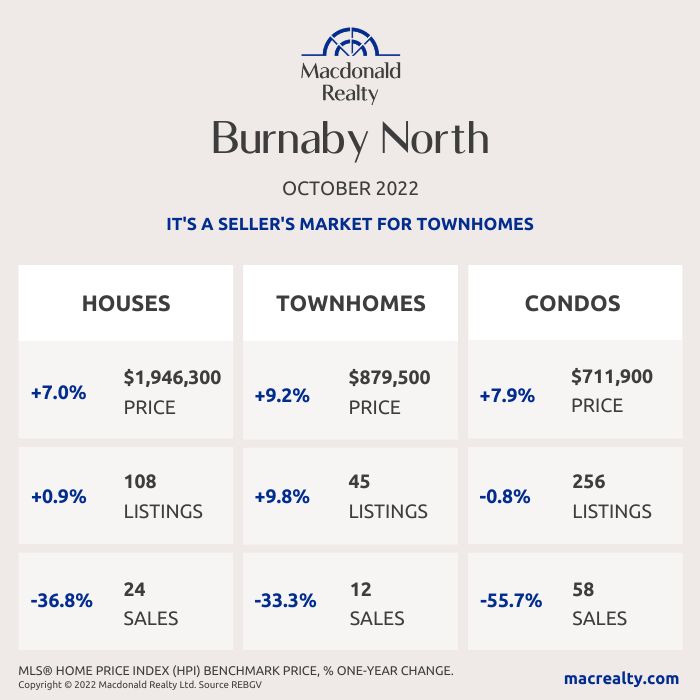
Burnaby North
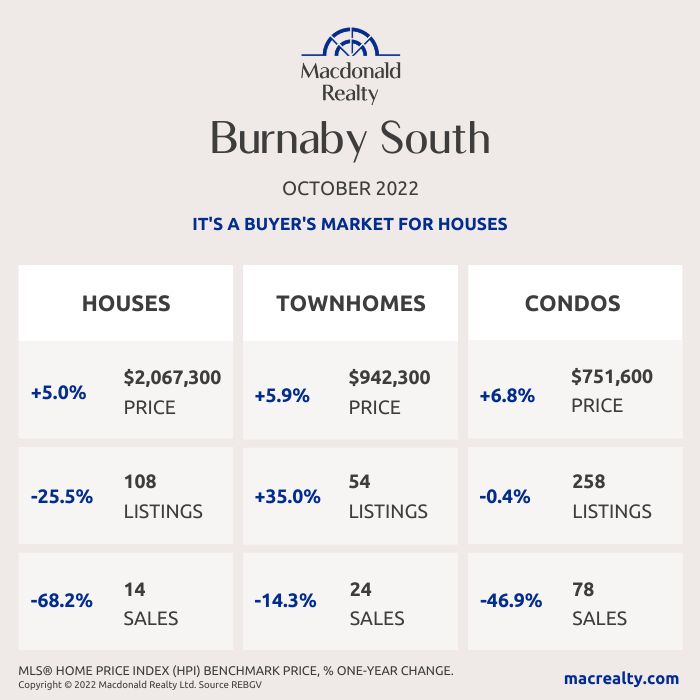
Burnaby South
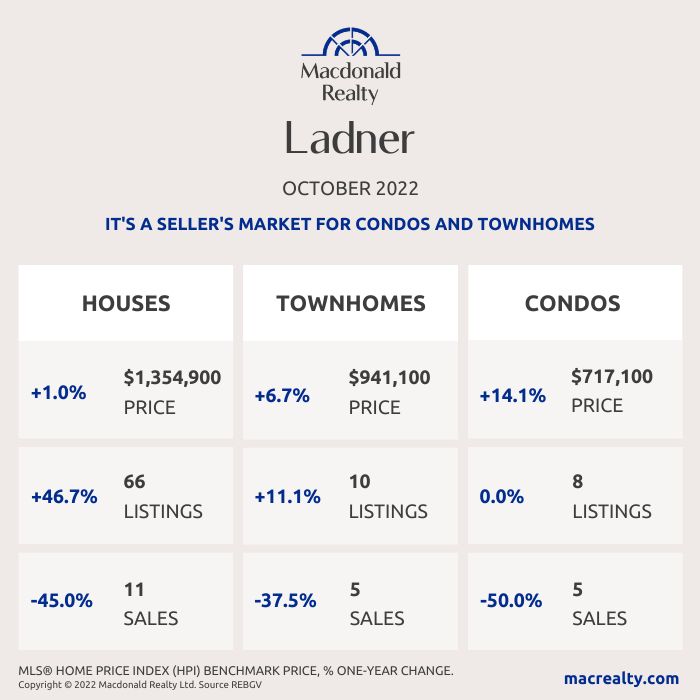
Ladner
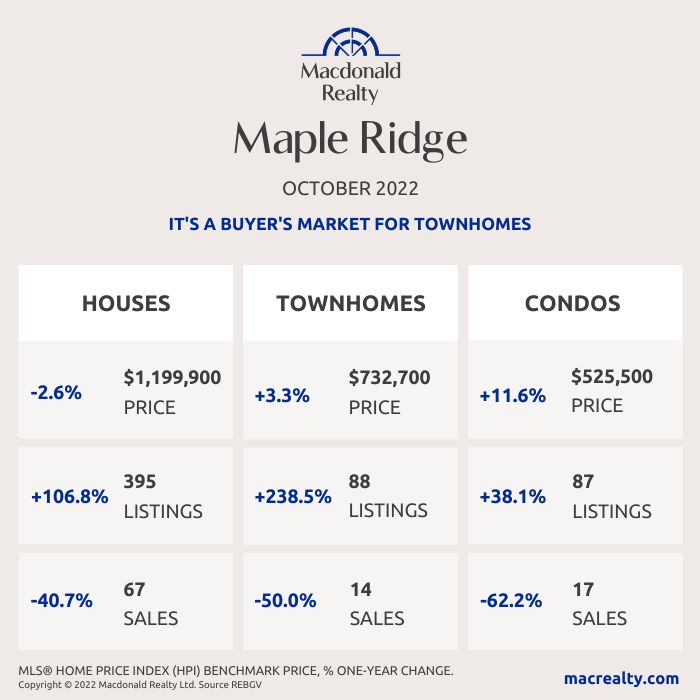
Maple Ridge
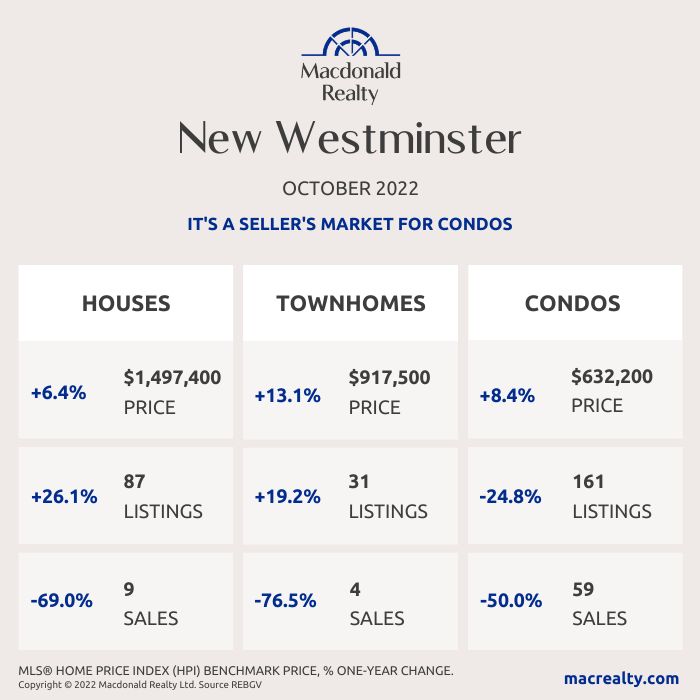
New Westminster
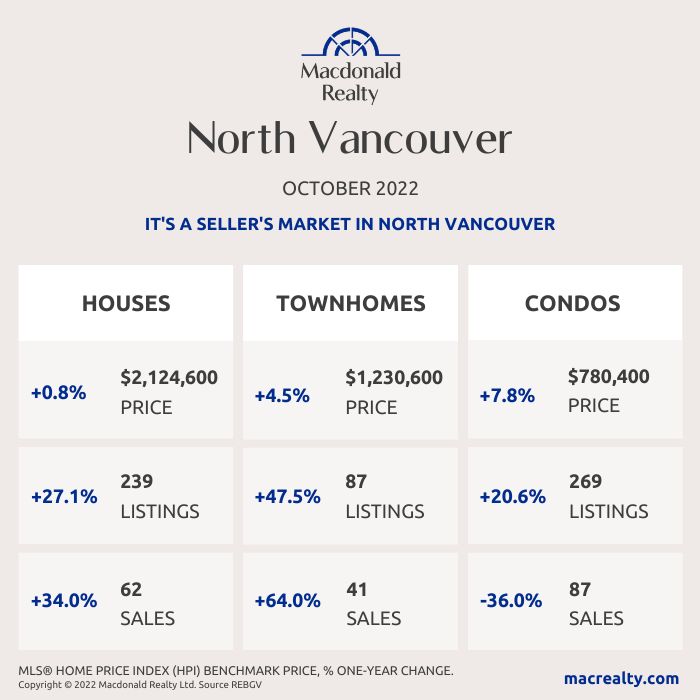
North Vancouver
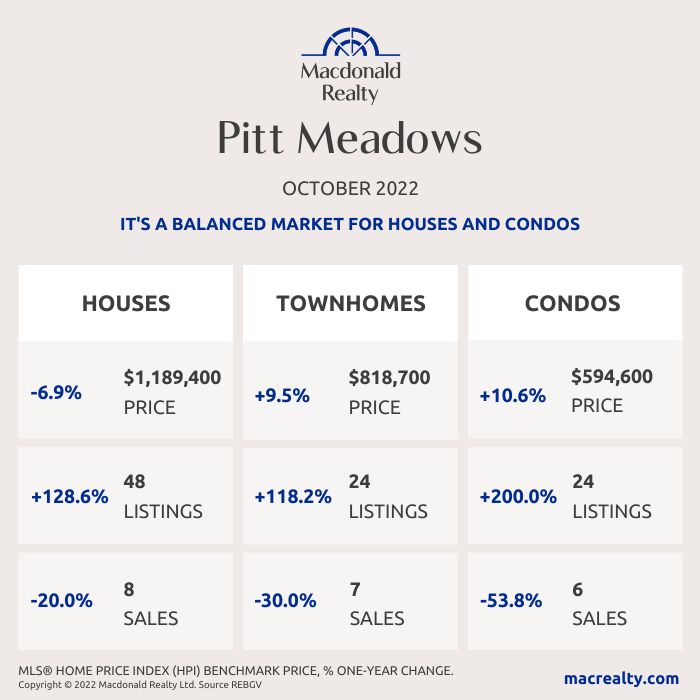
Pitt Meadows
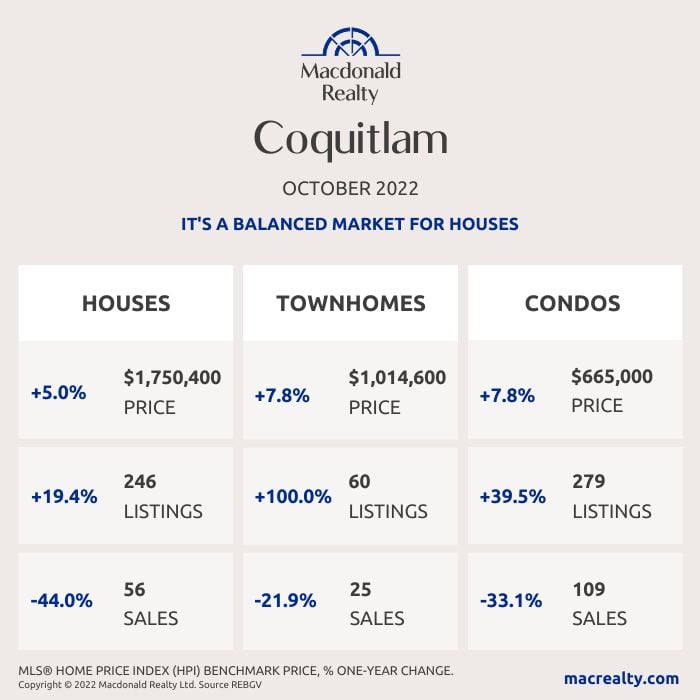
Coquitlam
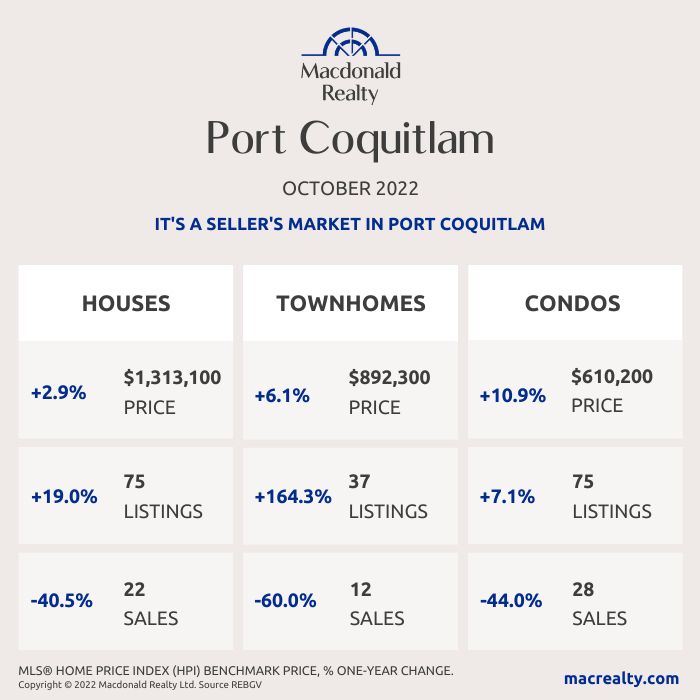
Port Coquitlam
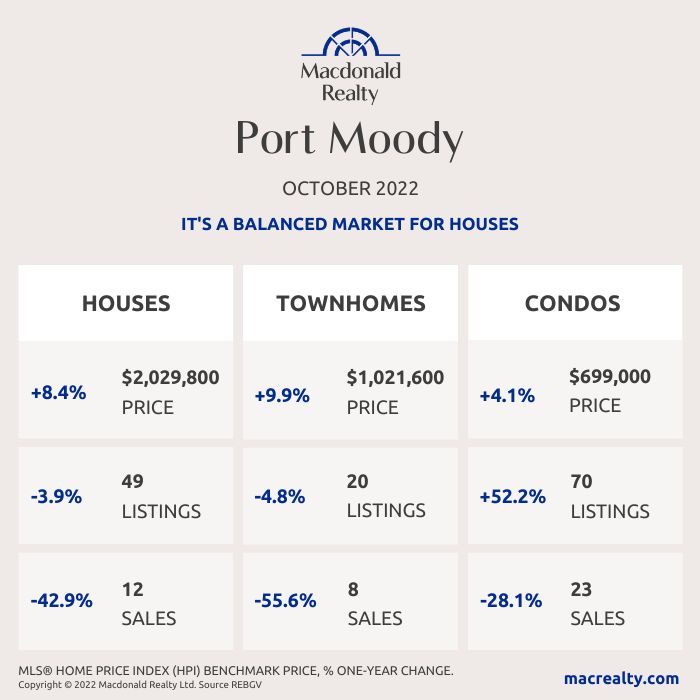
Port Moody
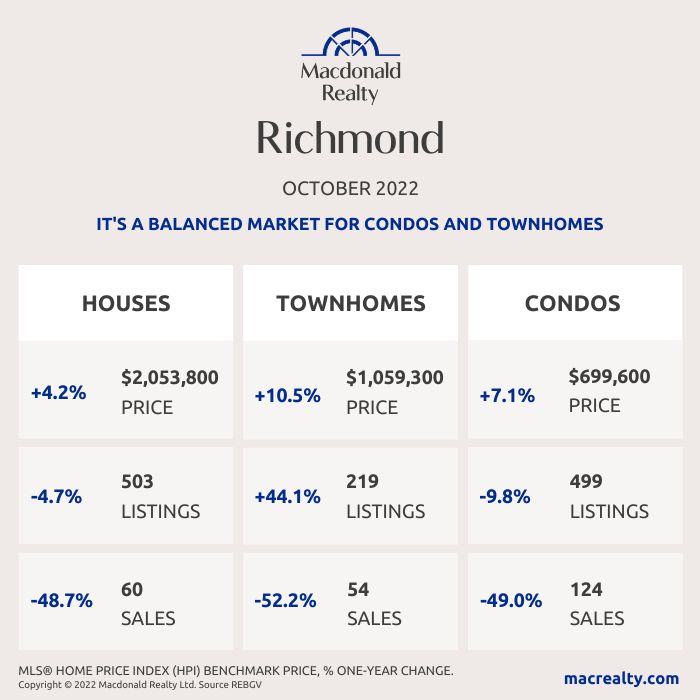
Richmond
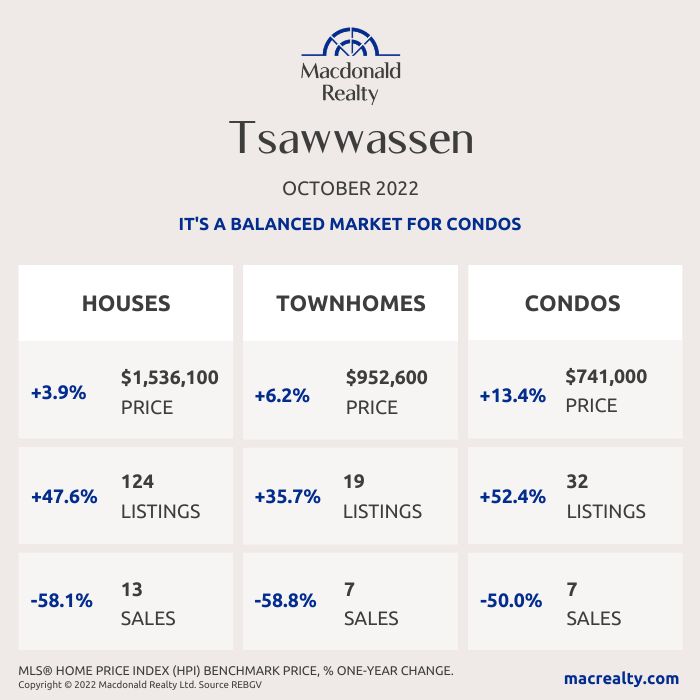
Tsawwassen
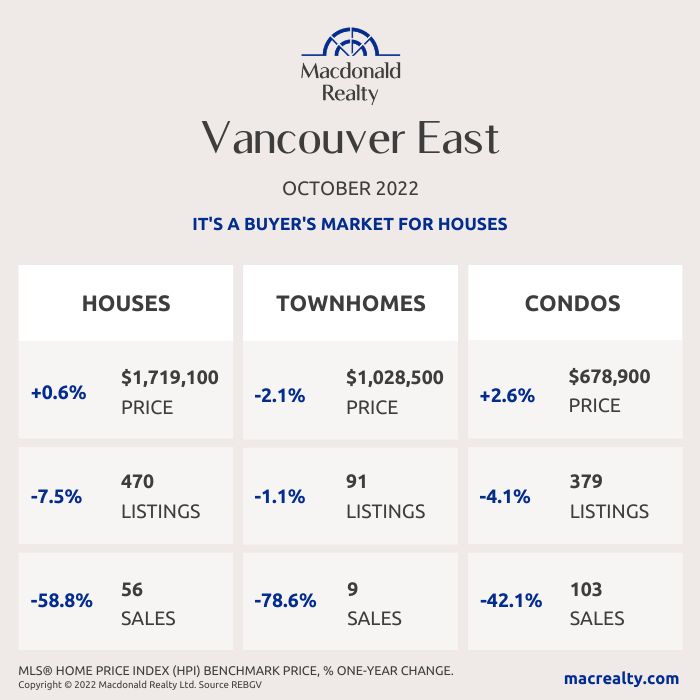
Vancouver East
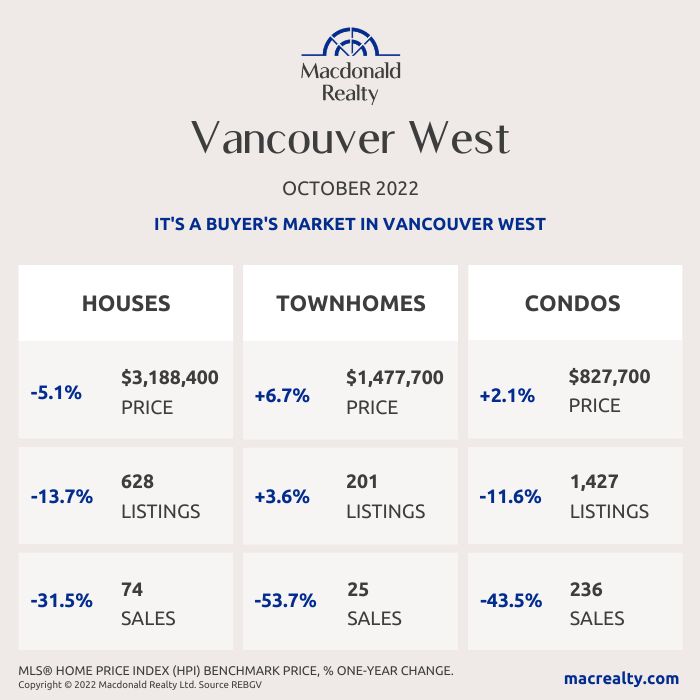
Vancouver West
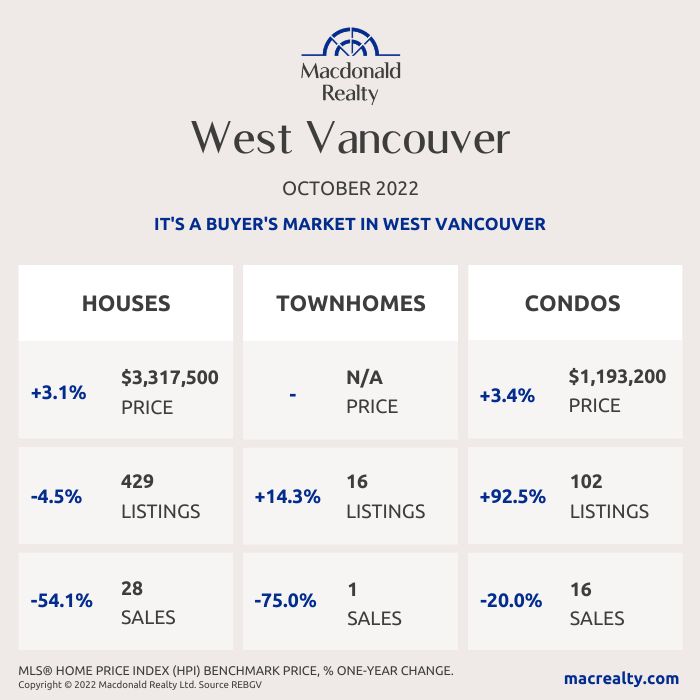
West Vancouver
Looking for more information about the real estate market in specific neighbourhoods in the Greater Vancouver?
Macdonald Realty has offices across the Greater Vancouver. Please email [email protected] or call 1-877-278-3888 to be matched with a REALTOR® working in your area.
MLS® Home Price Index (HPI) Benchmark Price
Average and median home prices are often misinterpreted, are affected by change in the mix of homes sold, and can swing dramatically from month to month (based on the types and prices of properties that sold in a given month). The MLS® HPI overcomes these shortcomings and uses the concept of a benchmark home, a notional home with common attributes of typical homes in a defined area. Visit www.housepriceindex.ca for more information.
This blog post is based on market data provided by the Real Estate Board of Greater Vancouver (REBGV) www.rebgv.org
by Macrealty Marketing Team | Nov 7, 2022 | Market Updates
Here are the latest real estate market statistics from Macdonald Realty on Squamish, Whistler, and Sunshine Coast listings and sales in October 2022.
Find all the infographics related to the October Market Statistics by visiting the Facebook Album.
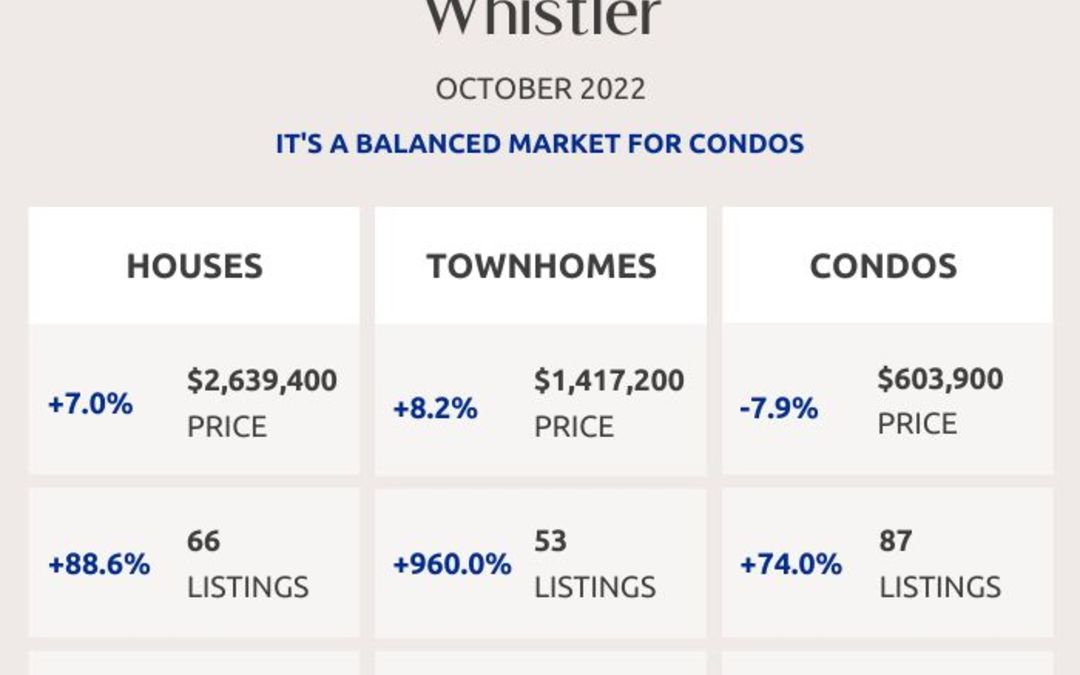
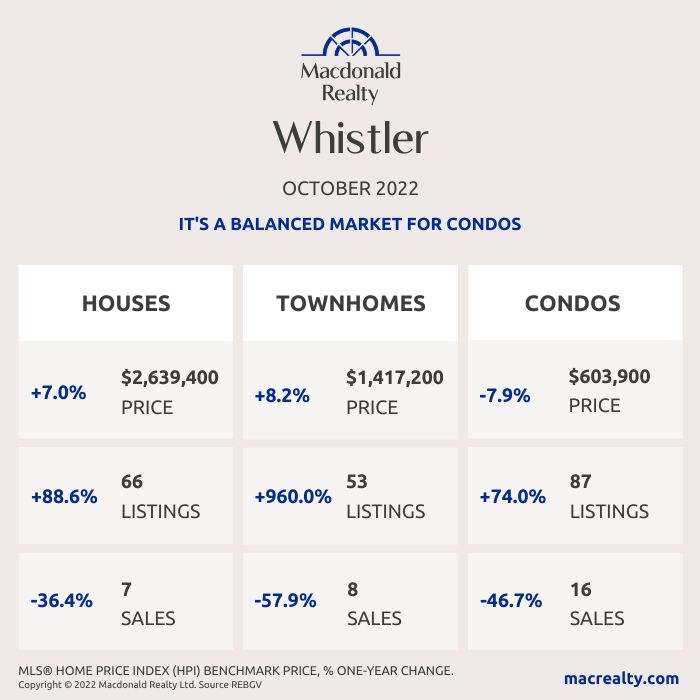
Whistler
In October 2022, there were 7 sales of detached homes and 66 active listings. The benchmark sale price was $2,639,400.
The condo market had 16 sales and 87 active listings at the end of the month. The benchmark sale price was $603,900.
The townhome market had 8 sales and the active listings were 53. The benchmark sale price was $1,417,200.
It’s a balanced market in Whistler.
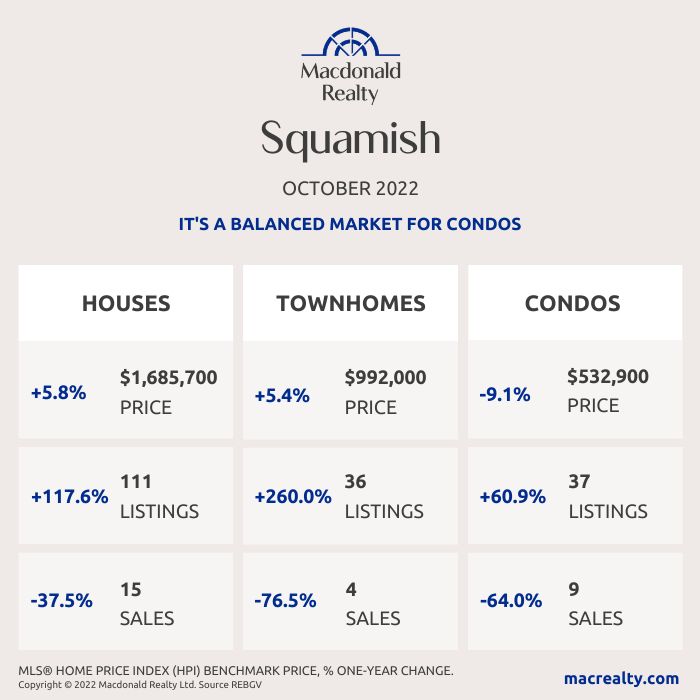
Squamish
In October 2022, there were 15 sales of detached homes and 111 active listings. The benchmark sale price was $1,685,700.
The condo market had 9 sales and 37 active listings at the end of the month. The benchmark sale price was $532,900.
The townhome market had 4 sales and, the active listings were 36. The benchmark sale price was $992,000.
It’s a balanced market for condos in Squamish.
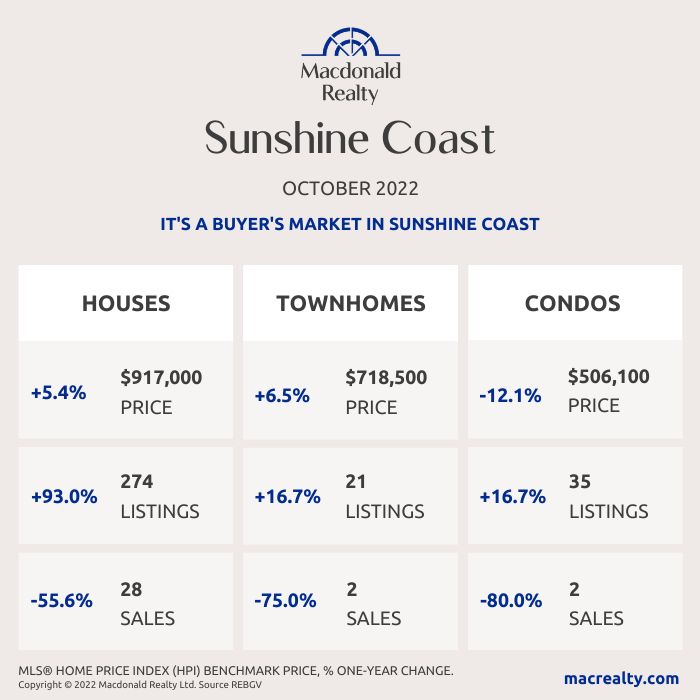
Sunshine Coast
In October 2022, there were 28 sales of detached homes and 274 active listings. The benchmark sale price was $917,000.
The condo market had 2 sales and 35 active listings at the end of the month.
The townhome market had 2 sales and, the active listings were 21.
It’s a buyer’s market in Sunshine Coast.
Looking for more information about the real estate market in specific neighbourhoods in Squamish, Whistler, and Sunshine Coast? Macdonald Realty has offices in Squamish, Whistler, and Sunshine Coast. Please email [email protected] or call 1-877-278-3888 to be matched with a REALTOR® working in your area.
MLS® Home Price Index (HPI) Benchmark Price
Average and median home prices are often misinterpreted, are affected by change in the mix of homes sold, and can swing dramatically from month to month (based on the types and prices of properties that sold in a given month). The MLS® HPI overcomes these shortcomings and uses the concept of a benchmark home, a notional home with common attributes of typical homes in a defined area. Visit www.housepriceindex.ca for more information.
This blog post is based on market data provided by the Real Estate Board of Greater Vancouver (REBGV) www.rebgv.org
by Macrealty Marketing Team | Nov 4, 2022 | Market Updates
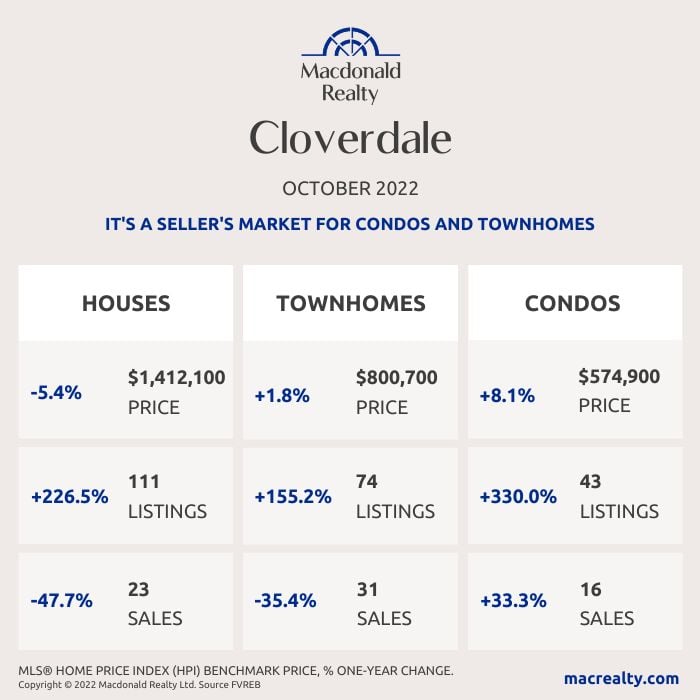
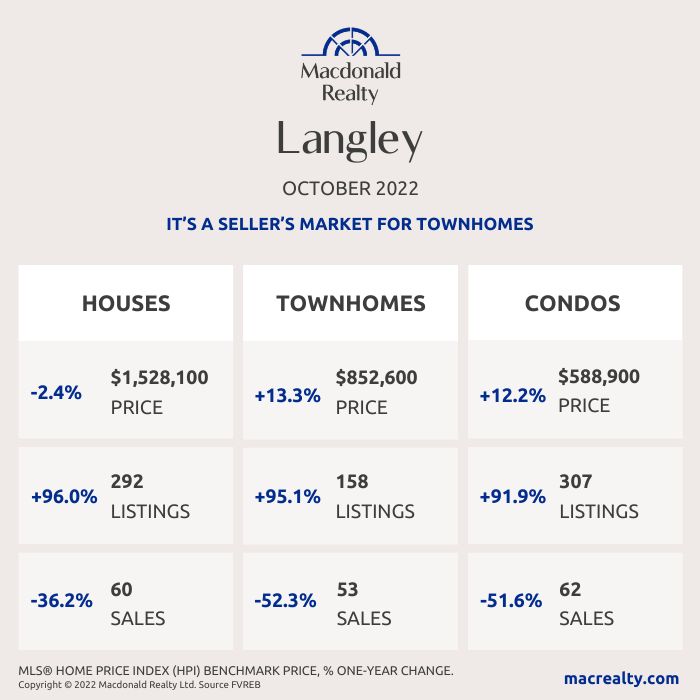
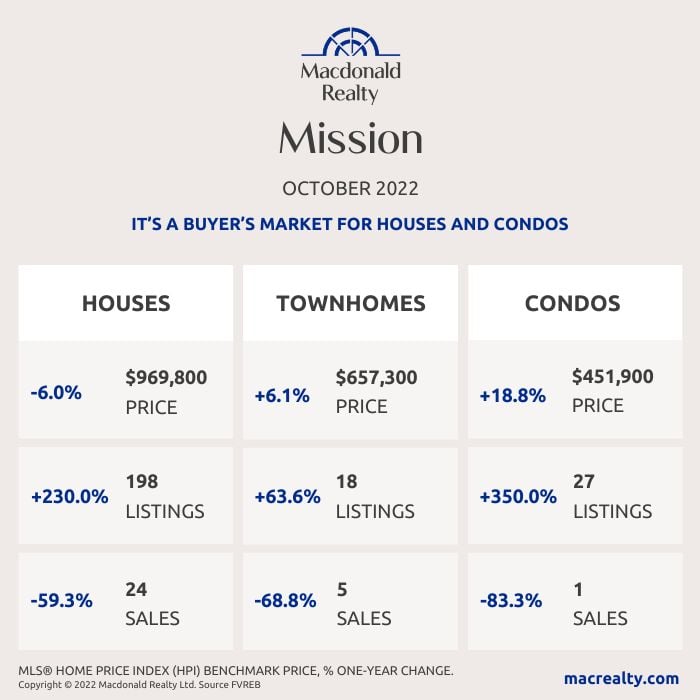
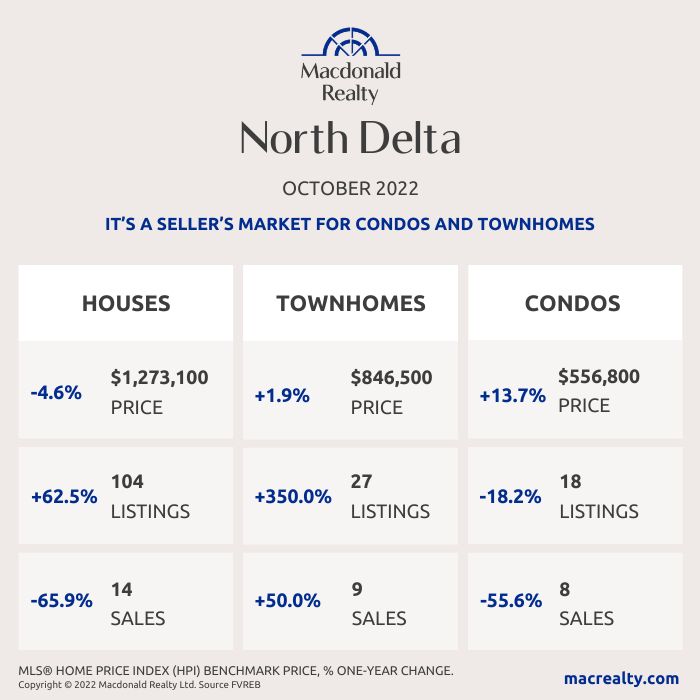
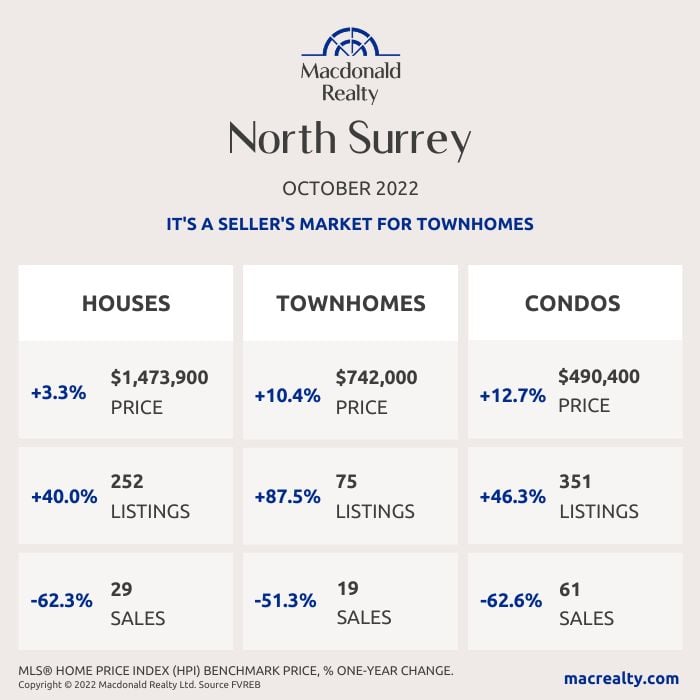
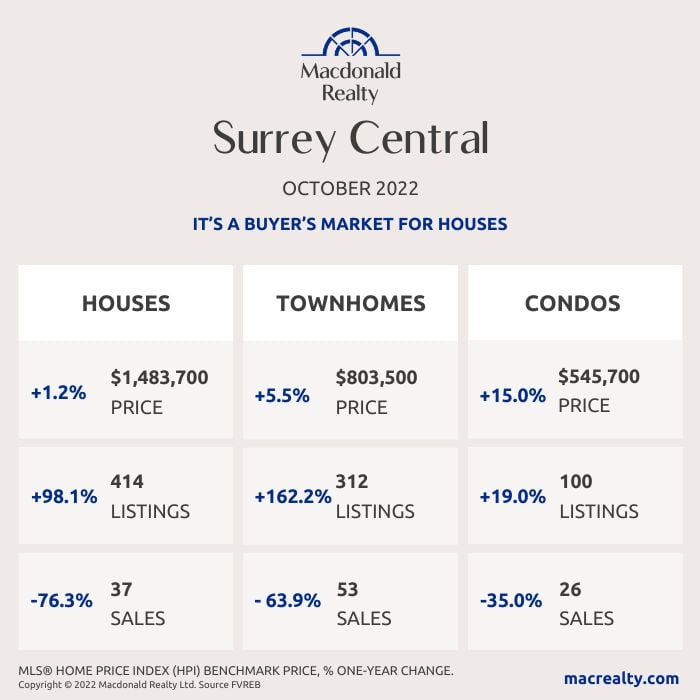
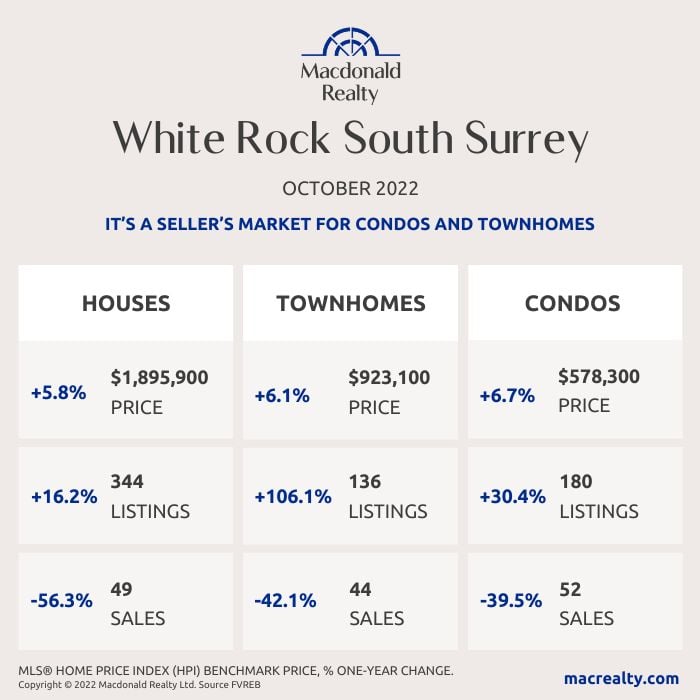
According to the Fraser Valley Real Estate Board, Fraser Valley housing market sales for October remained relatively unchanged from last month as prices dipped slightly across all categories
In October, the Fraser Valley Real Estate Board (FVREB) processed 901 sales on its Multiple Listing Service® (MLS®), an increase of 0.4 per cent compared to last month and a 53.5 per cent decrease compared to this time last year.
The Board received 2,186 new listings in October, a decrease of 3.8 per cent compared to September, and on par with October 2021. The month ended with a total active inventory of 5,642, a decrease of 2.8 per cent from last month but up 63.7 per cent compared to October 2021.
With a sales-to-active listings ratio of 16 per cent, the overall market was again balanced for the fifth straight month after a prolonged sellers’ market earlier in the year. (The market is considered balanced when the sales-toactive listings ratio is between 12 per cent and 20 per cent.)
“These trends suggest that the market is looking to re-establish equilibrium in the wake of last year’s intense activity and in the face of continued interest rate pressures,” said Sandra Benz, President of the Fraser Valley Real Estate Board. “With sales continuing to lag and new inventory slow to come onstream, we’re seeing a holding pattern regarding whether to buy or list a property and expect this to continue through to year-end.”
Prices continued to soften, with month-over-month Benchmark prices down slightly across all property categories. For detached homes, prices are on par with October 2021 levels, while townhomes and apartments are up 7.7 per cent and 11.5 per cent, respectively, over 2021.
Find all the infographics related to the October Market Statistics by visiting the Facebook Album.
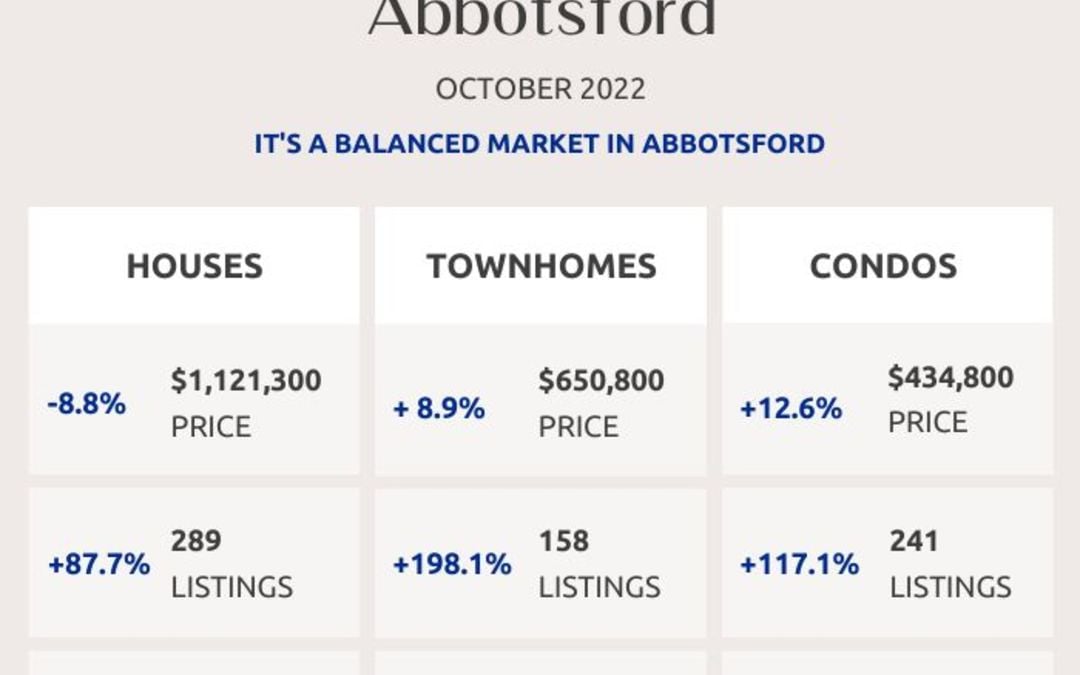
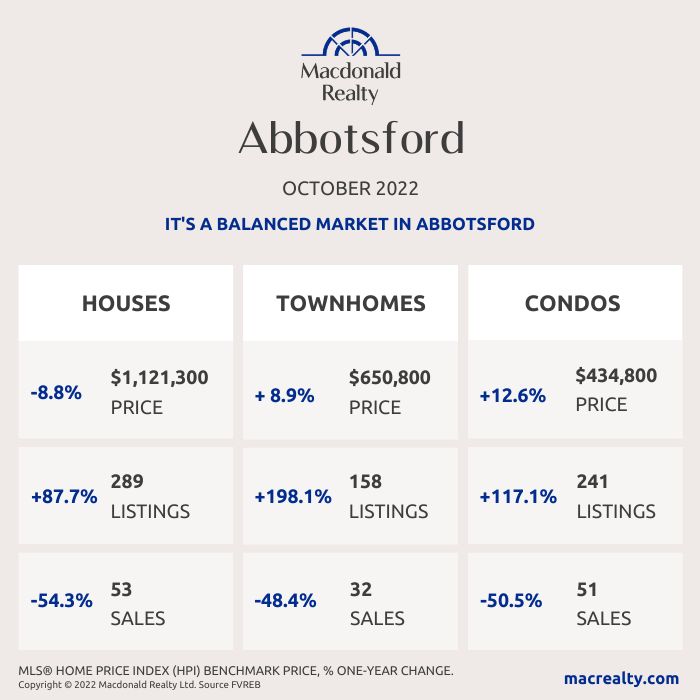
Abbotsford
Cloverdale
Langley
Mission
North Delta
North Surrey
Surrey Central
White Rock / South Surrey
Looking for more information about the real estate market in specific neighbourhoods in Surrey, Langley and Fraser Valley?
Macdonald Realty has offices in North Delta, White Rock/South Surrey, and Langley. Please email [email protected] or call 1-877-278-3888 to be matched with a REALTOR® working in your area.
MLS® Home Price Index (HPI) Benchmark Price
Average and median home prices are often misinterpreted, are affected by change in the mix of homes sold, and can swing dramatically from month to month (based on the types and prices of properties that sold in a given month). The MLS® HPI overcomes these shortcomings and uses the concept of a benchmark home, a notional home with common attributes of typical homes in a defined area. Visit www.housepriceindex.ca for more information.
This blog post is based on market data provided by the Fraser Valley Real Estate Board (FVREB) www.fvreb.bc.ca