by Macrealty Marketing Team | Dec 7, 2021 | Market Updates
Here are the latest real estate market statistics from Macdonald Realty on the Greater Vancouver listings and sales in November 2021.
Find all the infographics by visiting the Facebook Album.
As released by the Board, home sale activity remains elevated across Metro Vancouver’s* housing market while the pace of homes being listed for sale continues to follow long-term averages.
“We expect home sale totals to end the year at or near an all-time record in our region,” Keith Stewart, REBGV economist said. “We’ve had elevated home sale activity throughout 2021 despite persistently low levels of homes available for sale. With a new year around the corner, it’s critical that this supply crunch remains the focus for addressing the housing affordability challenges in our region.”
The Board also has informed:
“The imbalance between supply and demand, coupled with some buyers wanting to use rate holds on lower rate fixed-term mortgages, is keeping upward pressure on home prices in this traditionally quieter time of year for the market.”
*Areas covered by the Real Estate Board of Greater Vancouver include Burnaby, Coquitlam, Maple Ridge, New Westminster, North Vancouver, Pitt Meadows, Port Coquitlam, Port Moody, Richmond, South Delta, Squamish, Sunshine Coast, Vancouver, West Vancouver, and Whistler. Check out the infographics of Squamish, Sunshine Coast and Whistler, HERE.
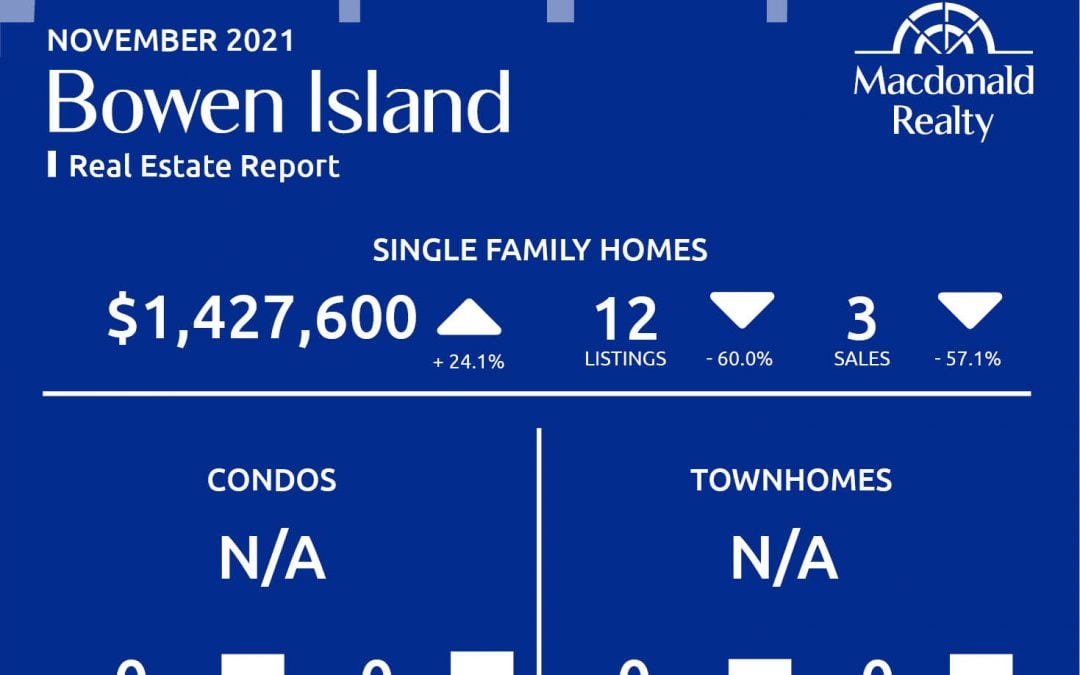
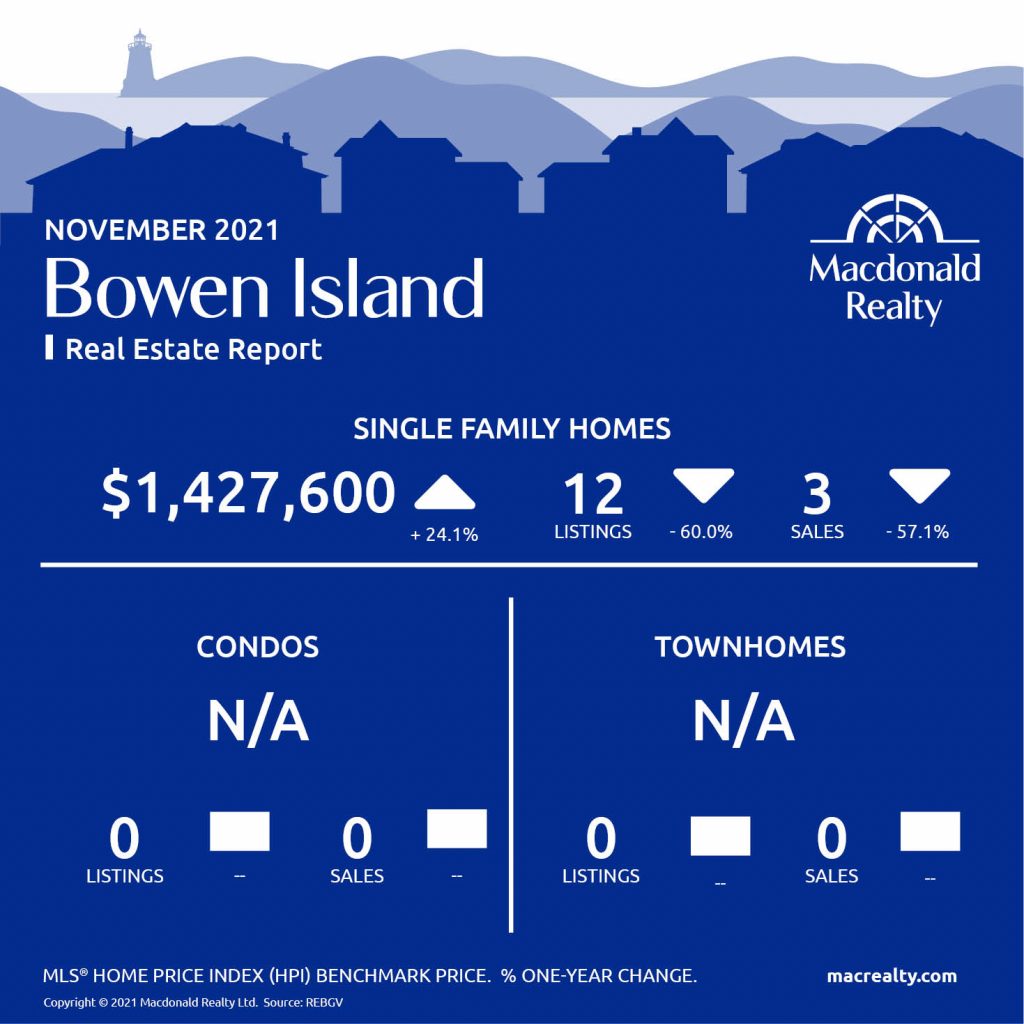
Bowen Island
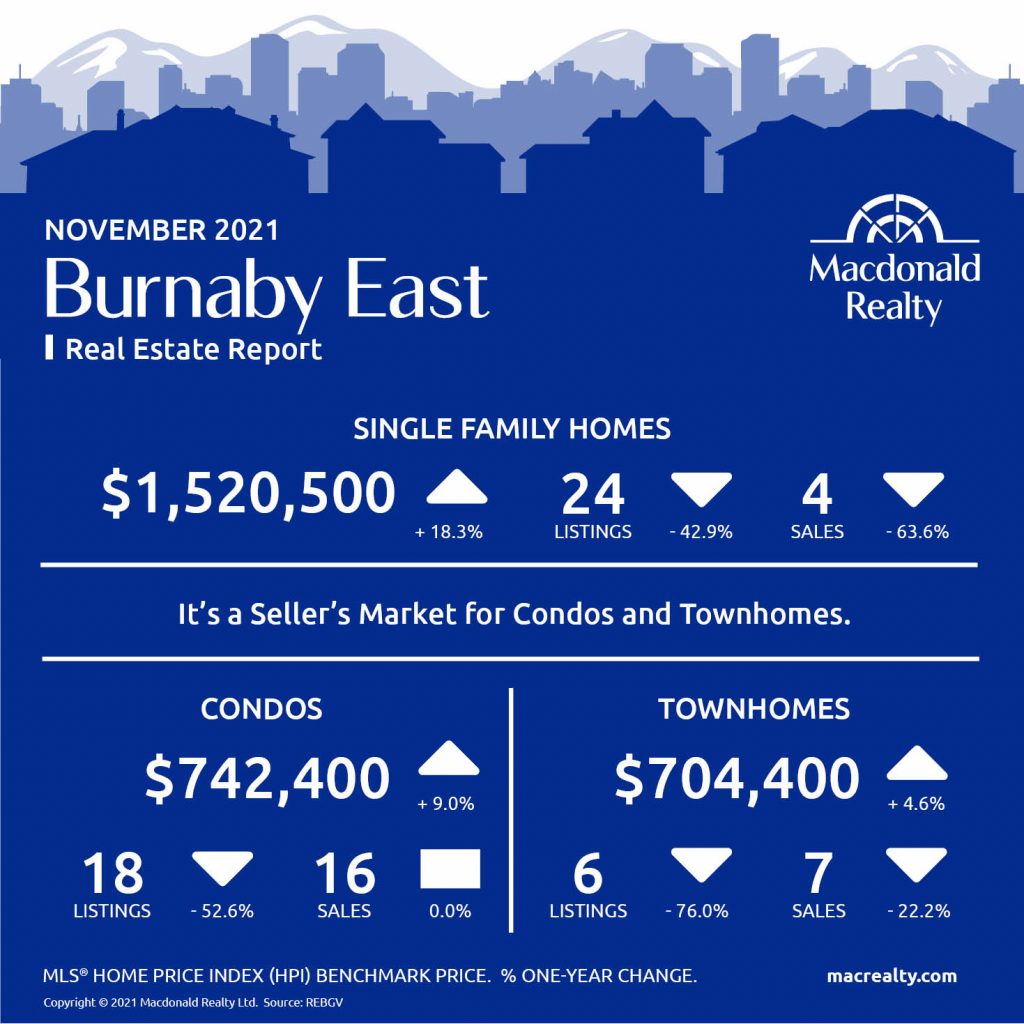
Burnaby East
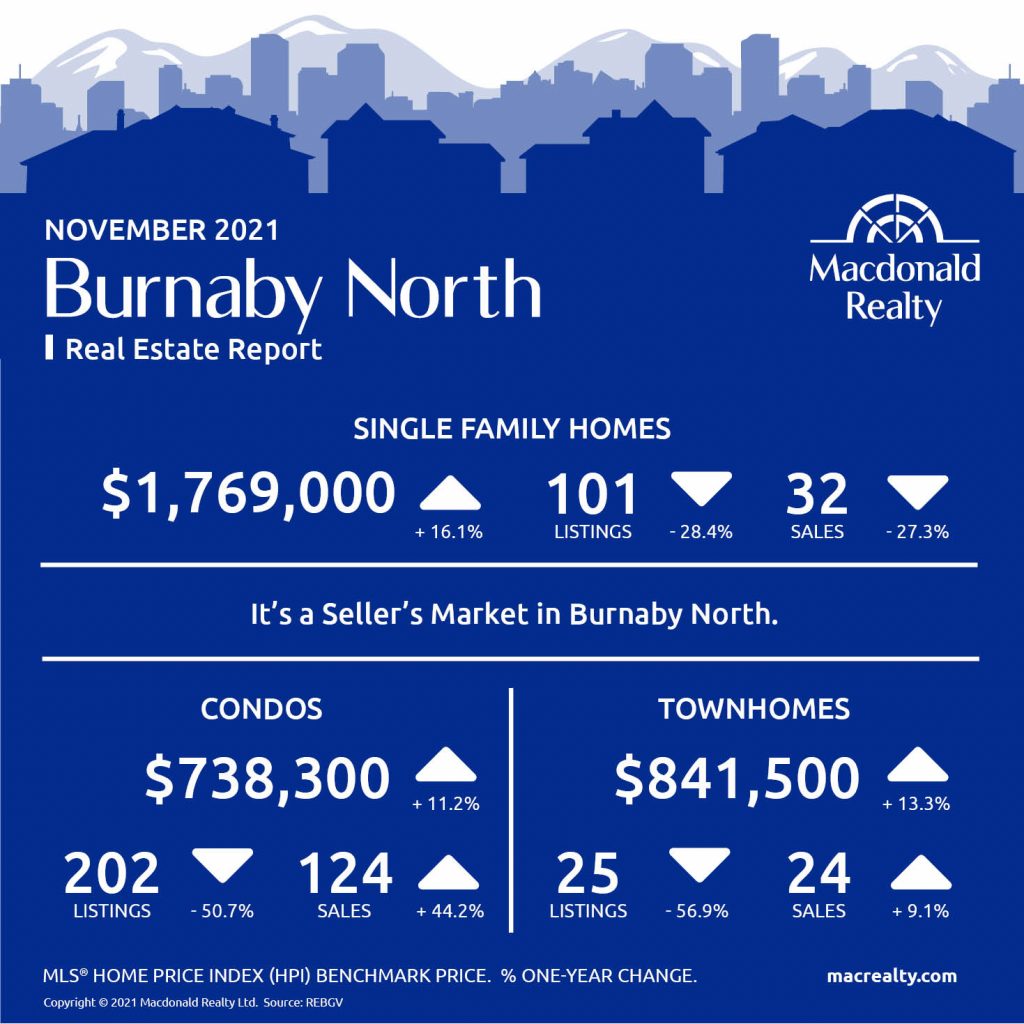
Burnaby North
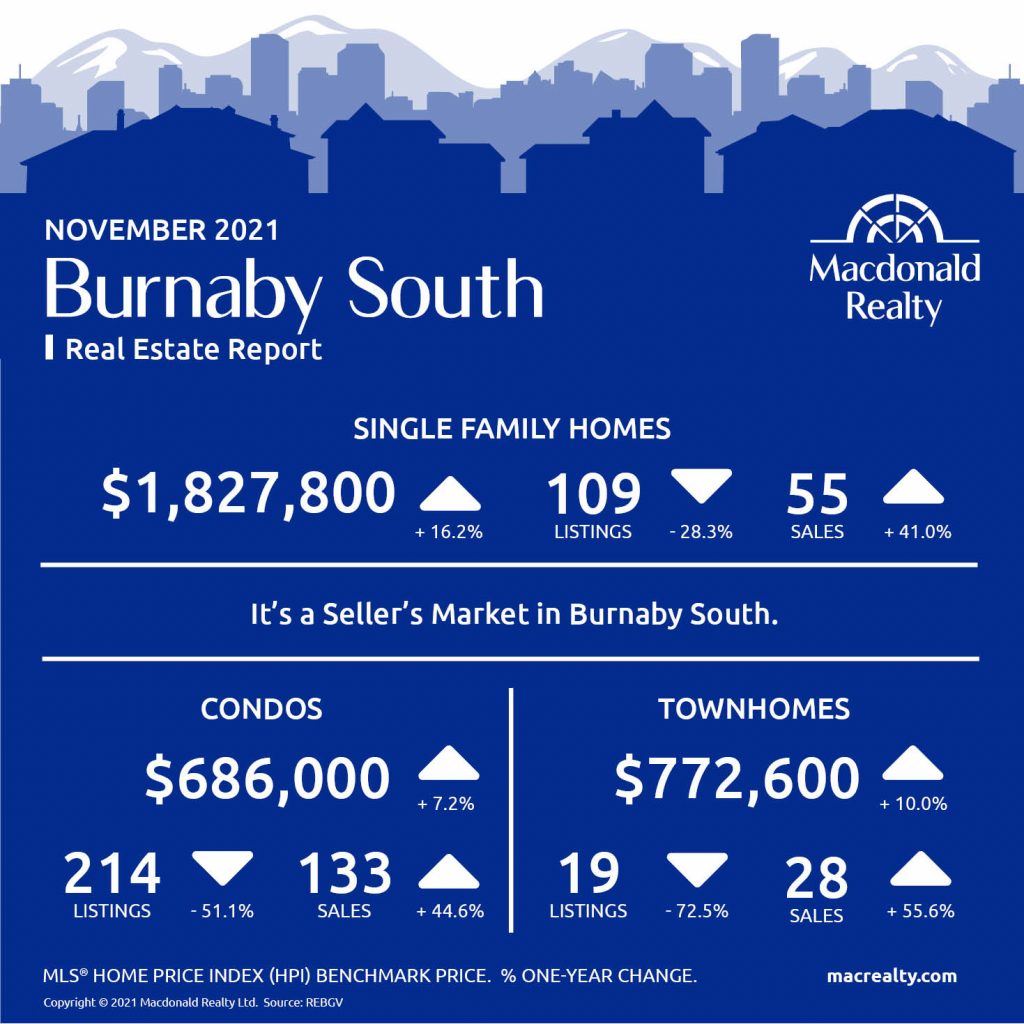
Burnaby South
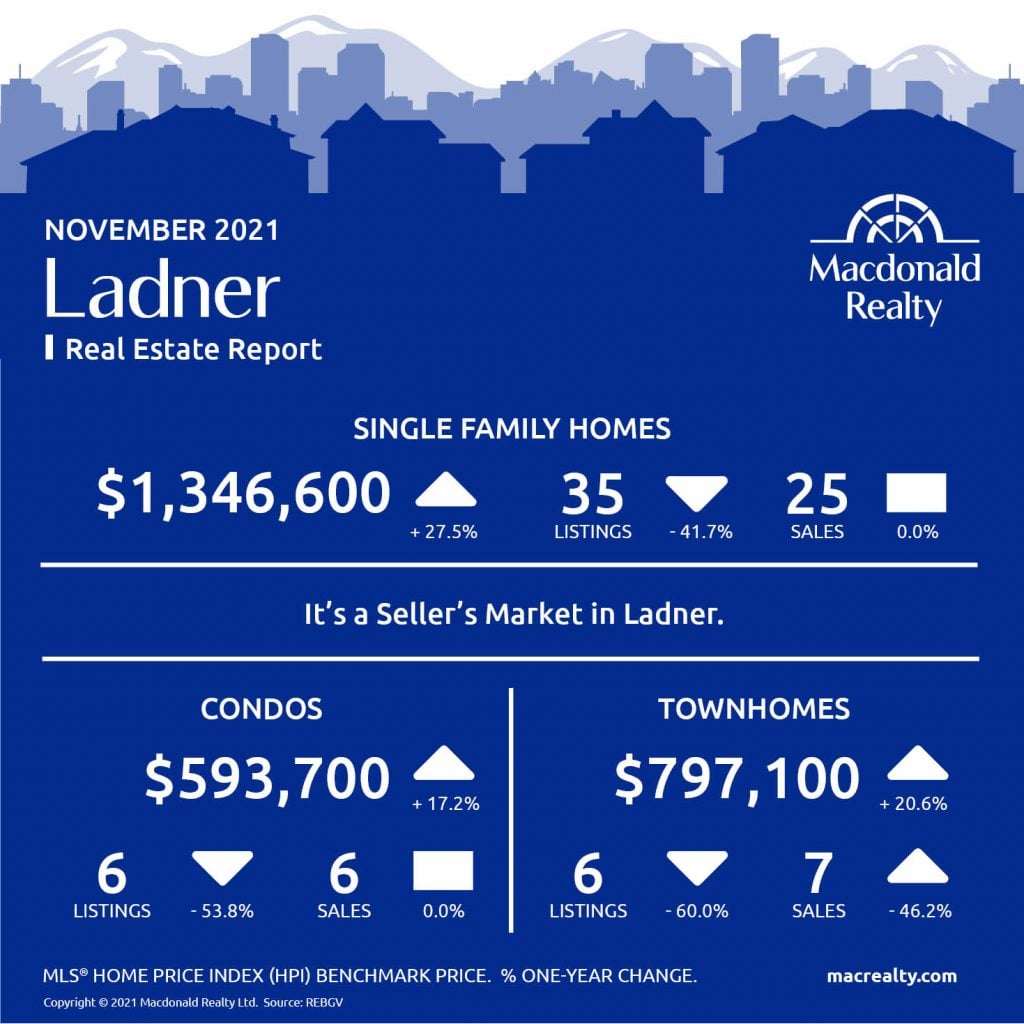
Ladner
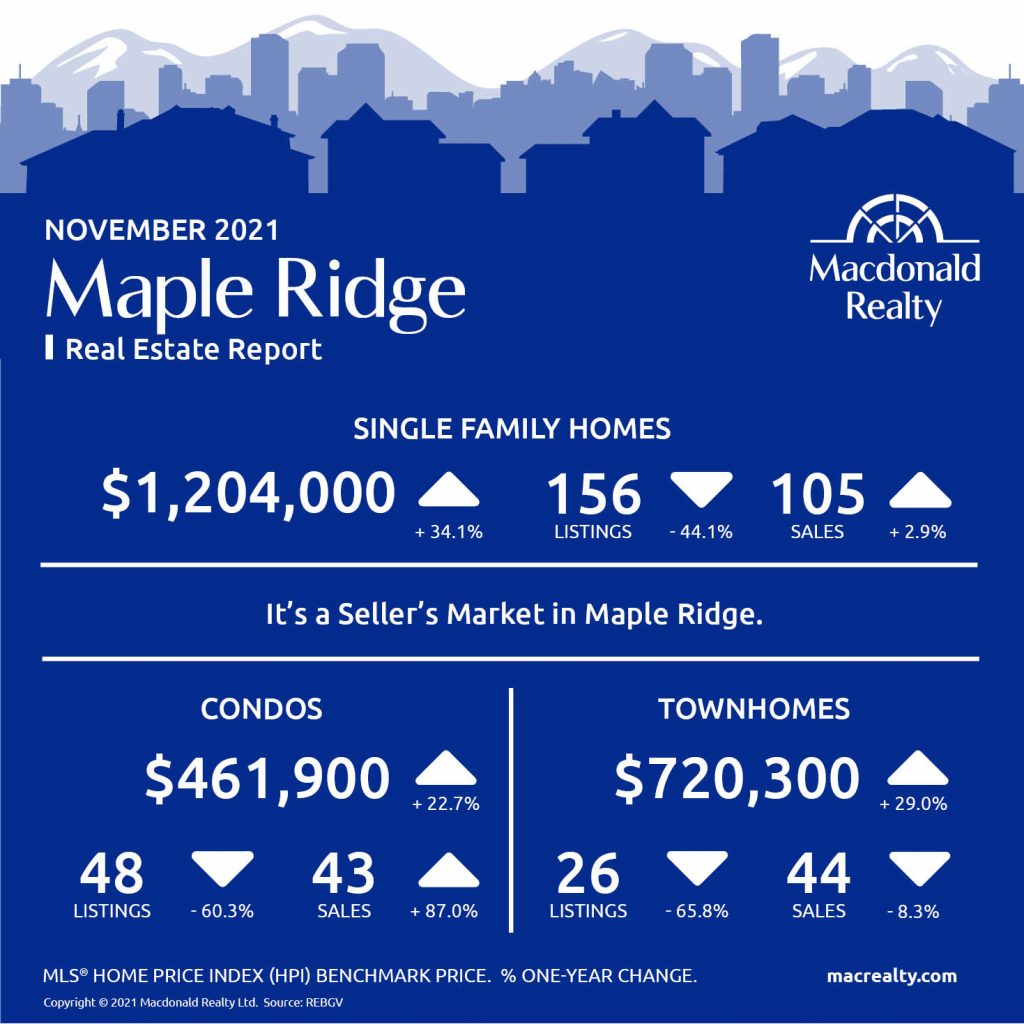
Maple Ridge
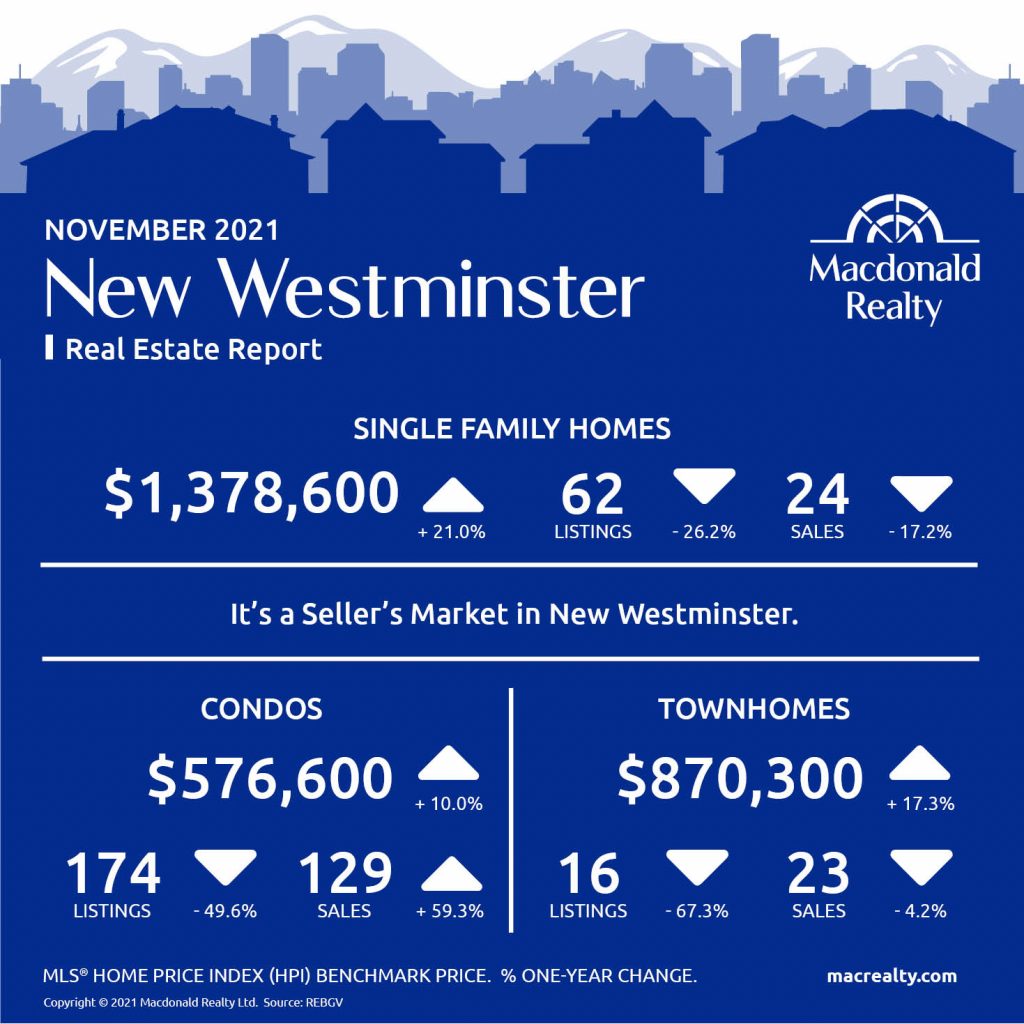
New Westminster
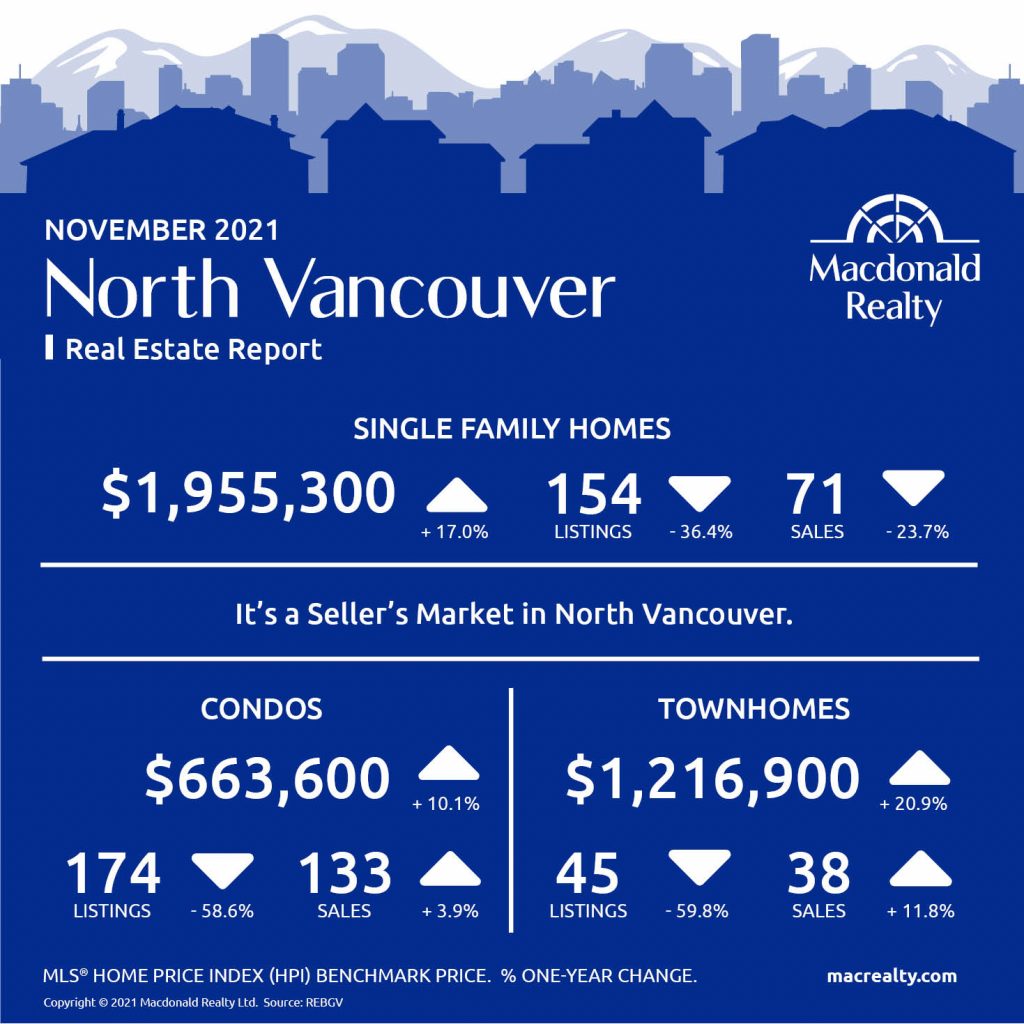
North Vancouver
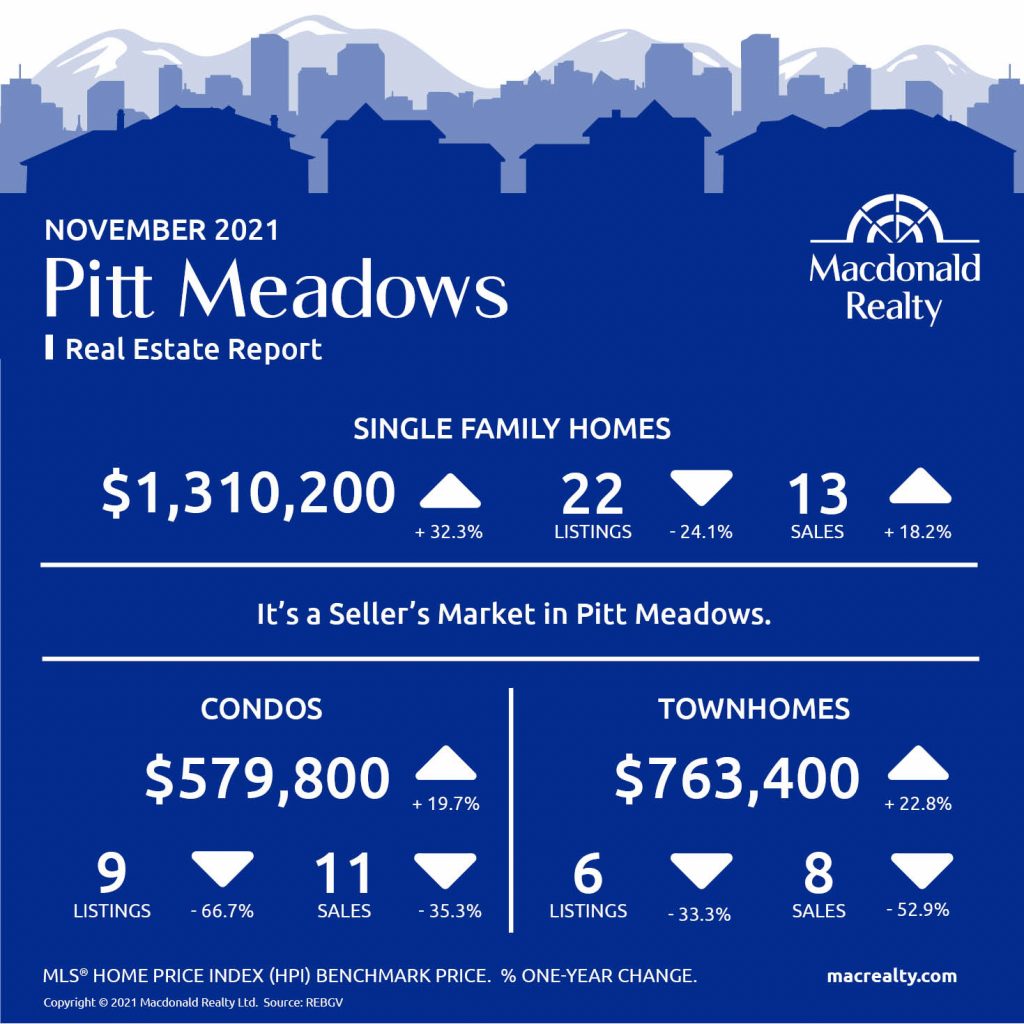
Pitt Meadows
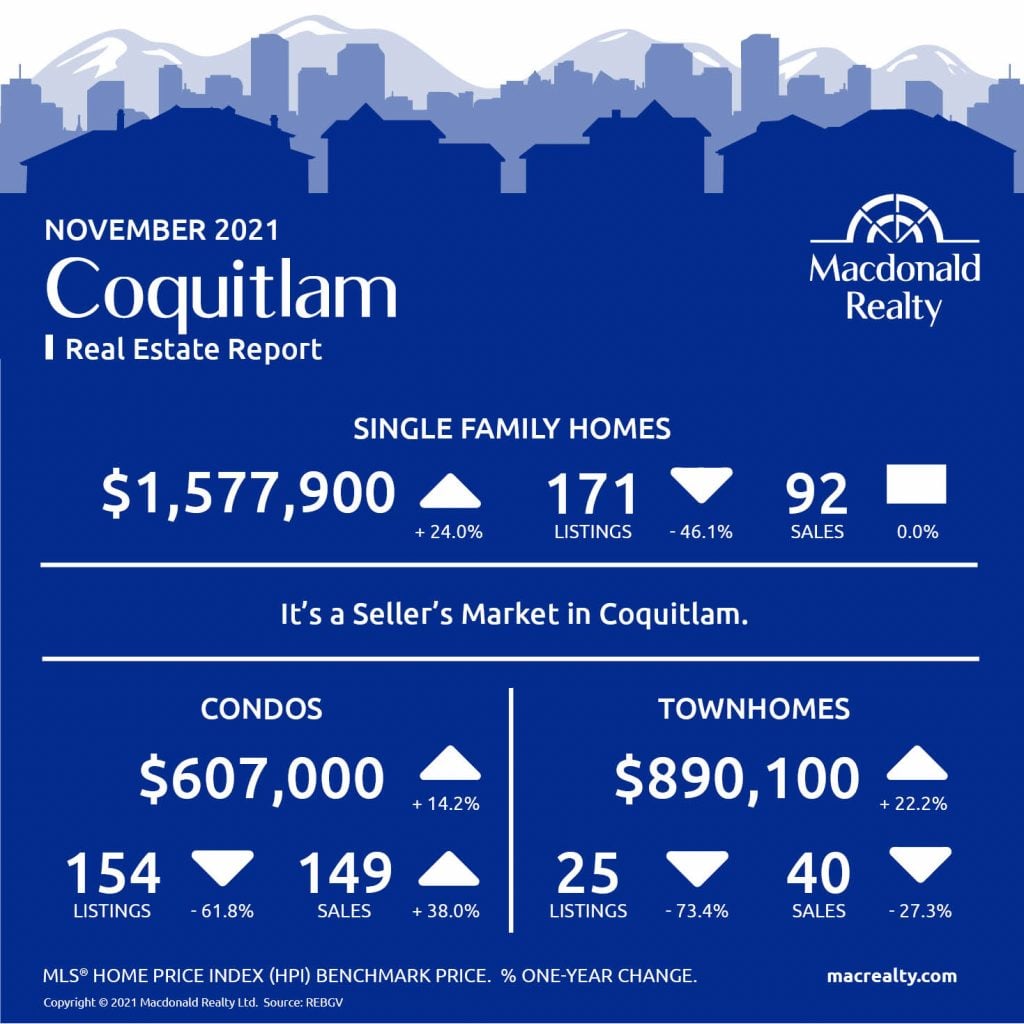
Coquitlam
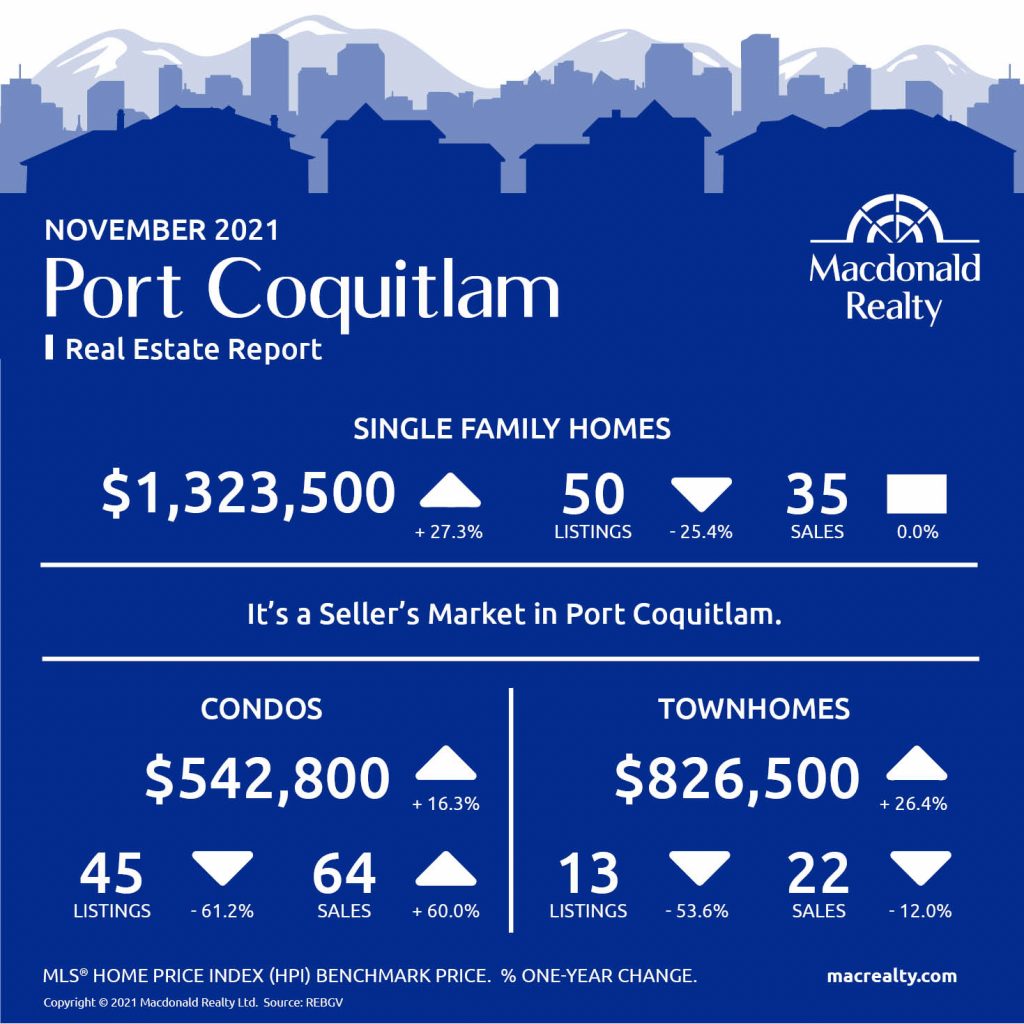
Port Coquitlam
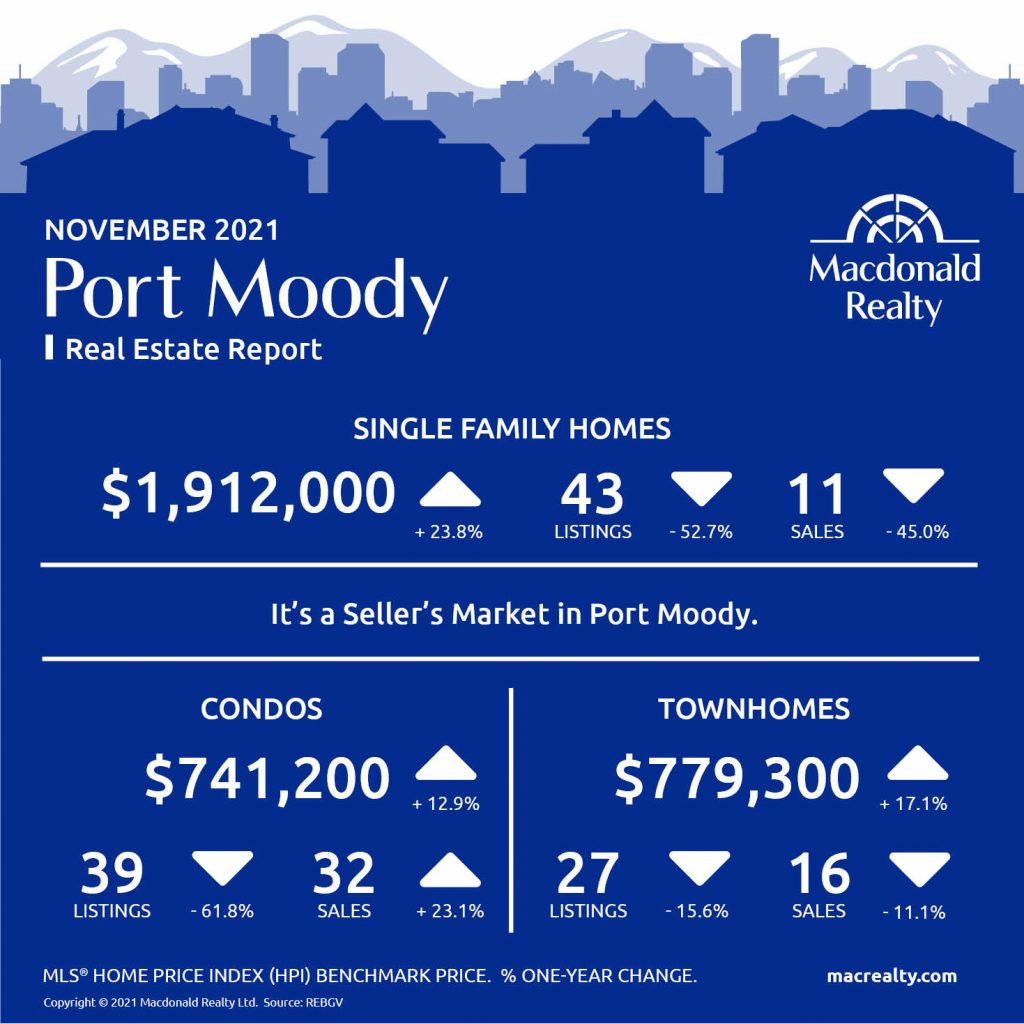
Port Moody
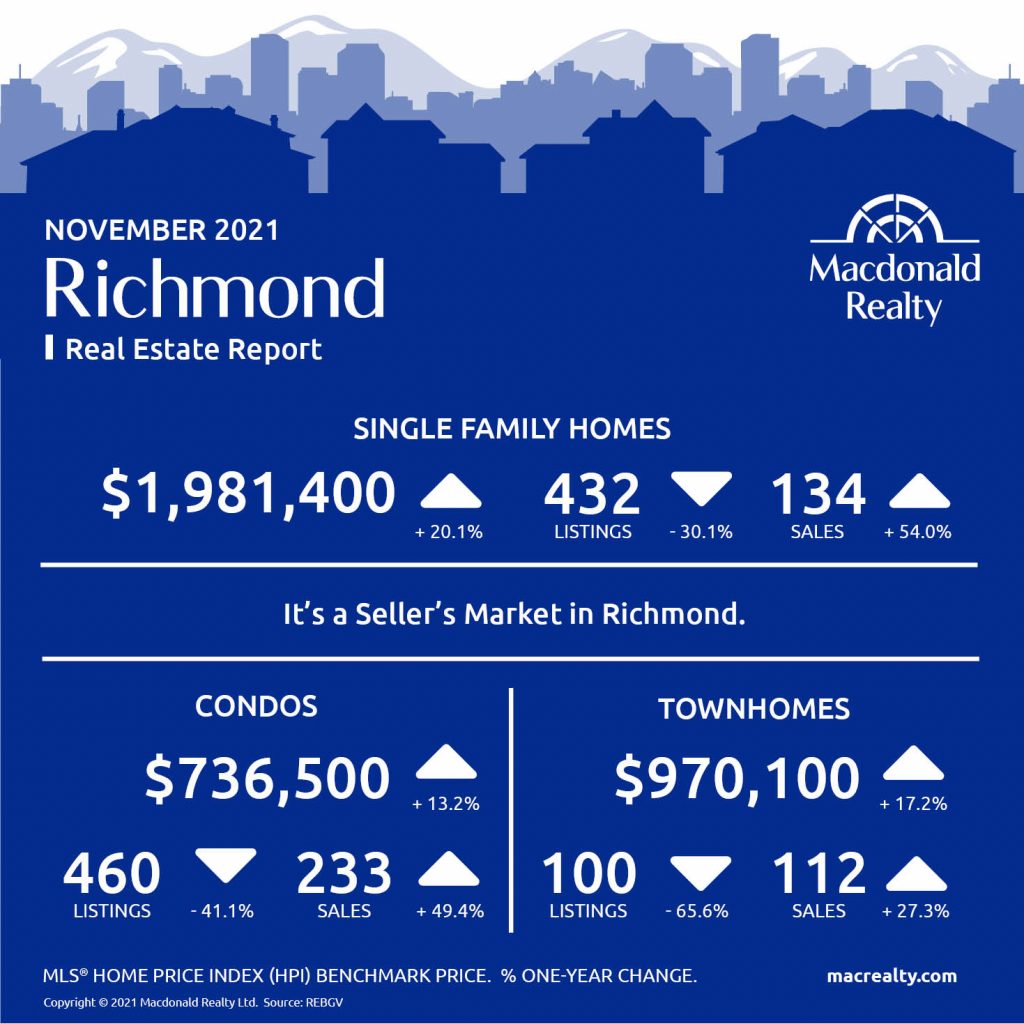
Richmond
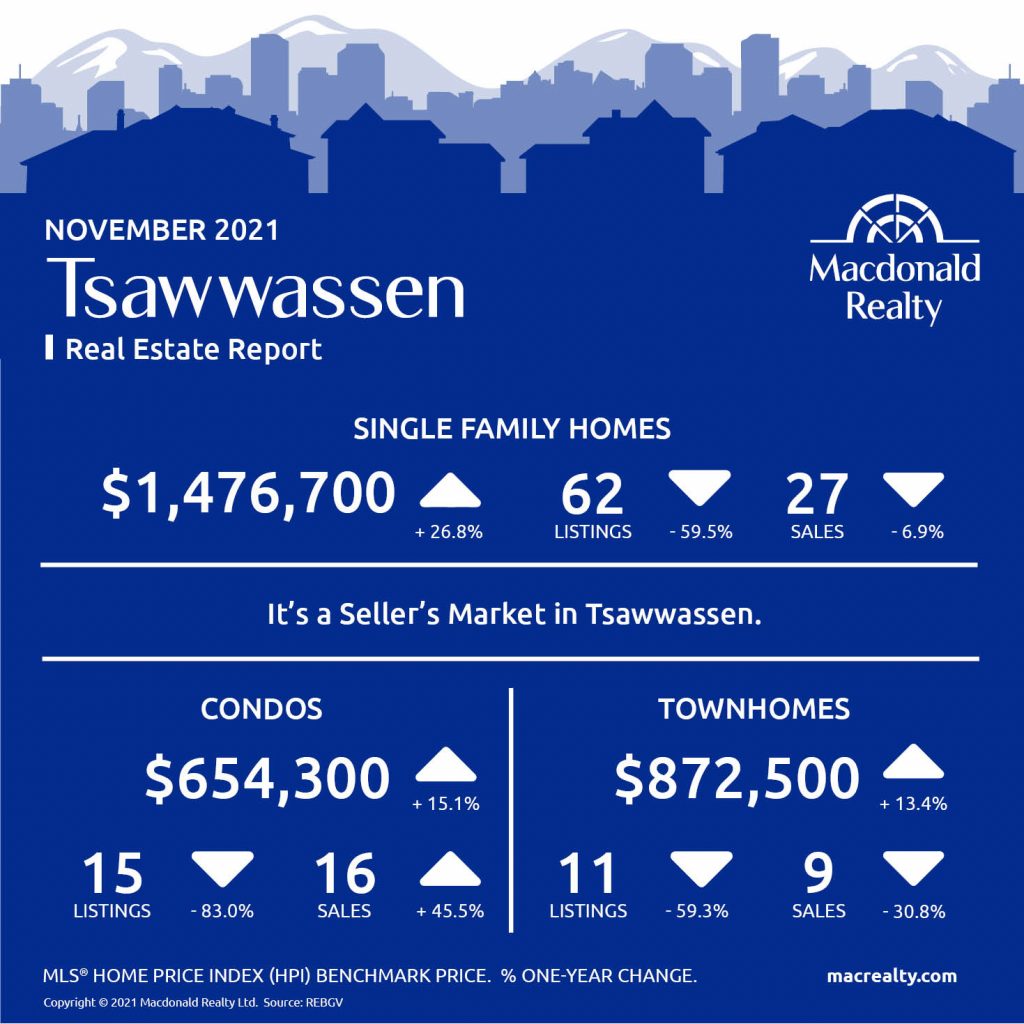
Tsawwassen
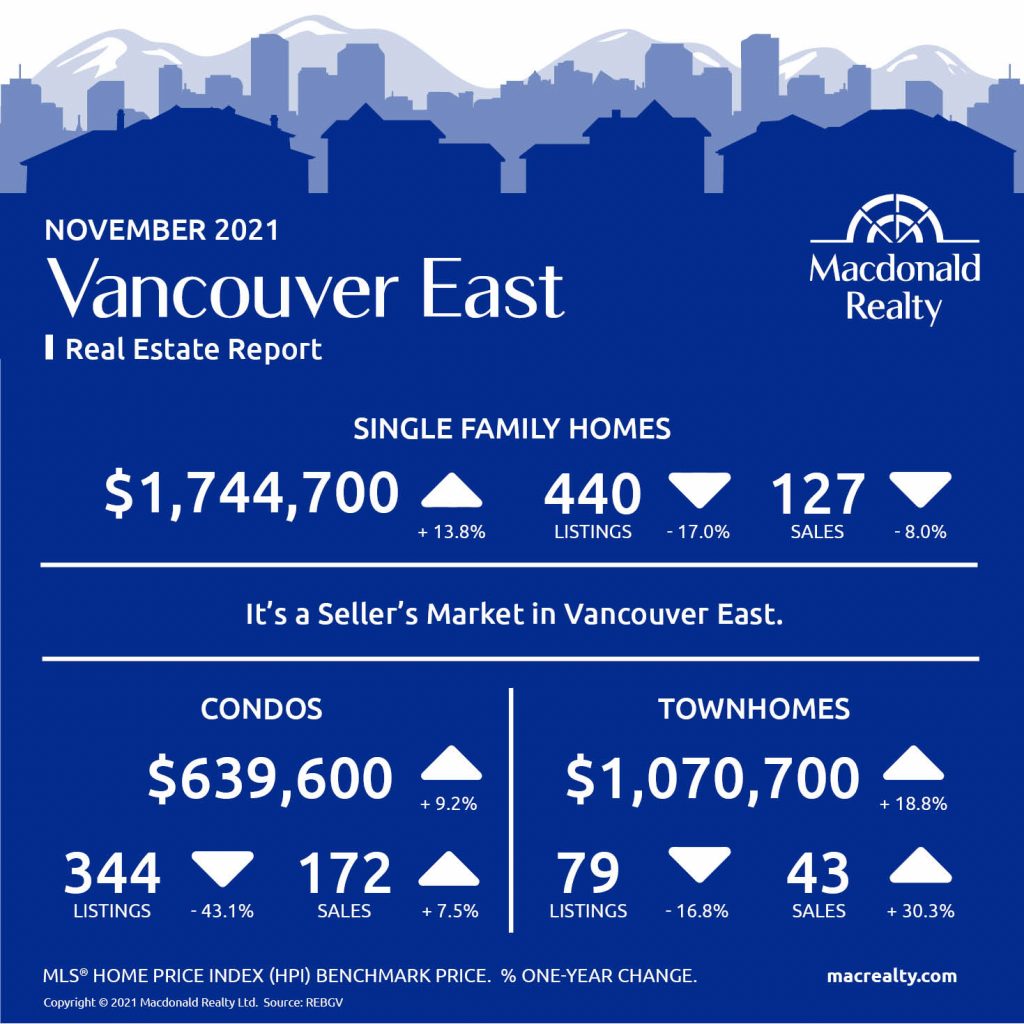
Vancouver East
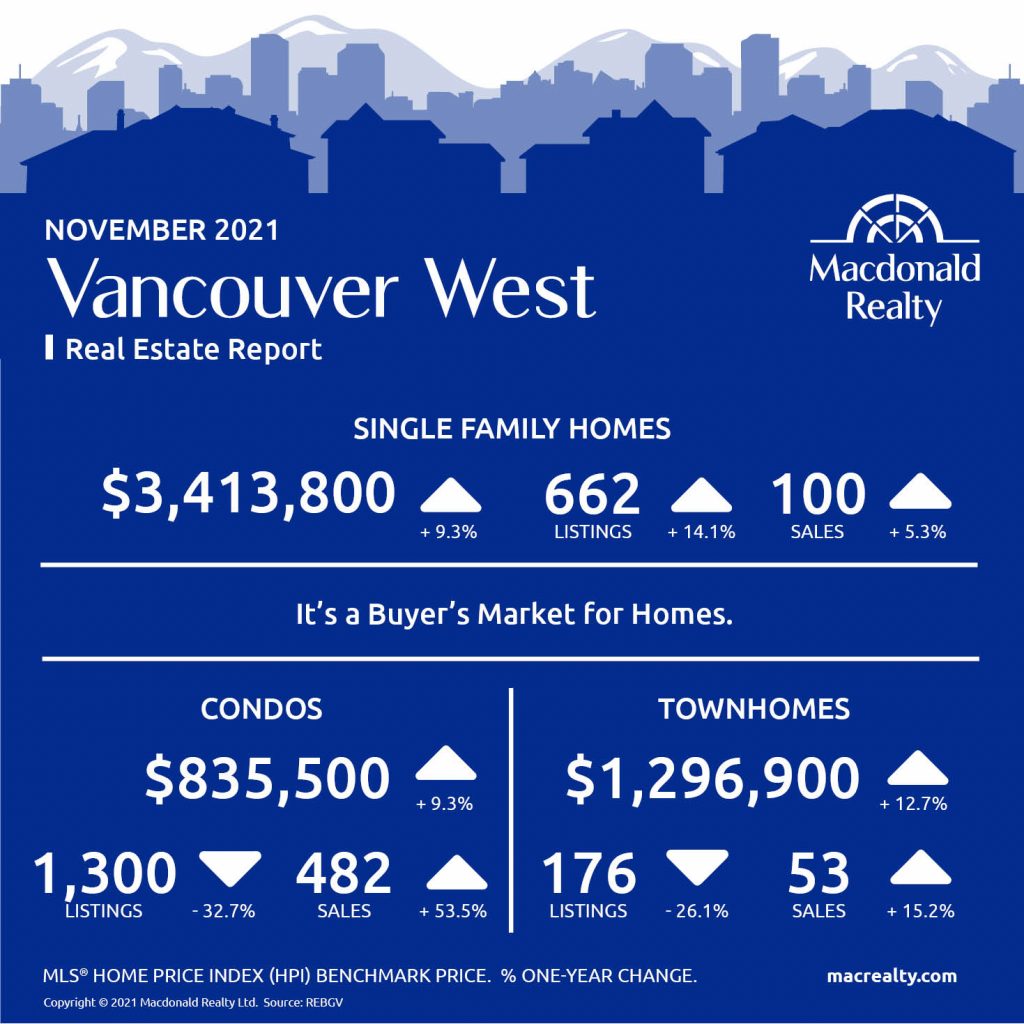
Vancouver West
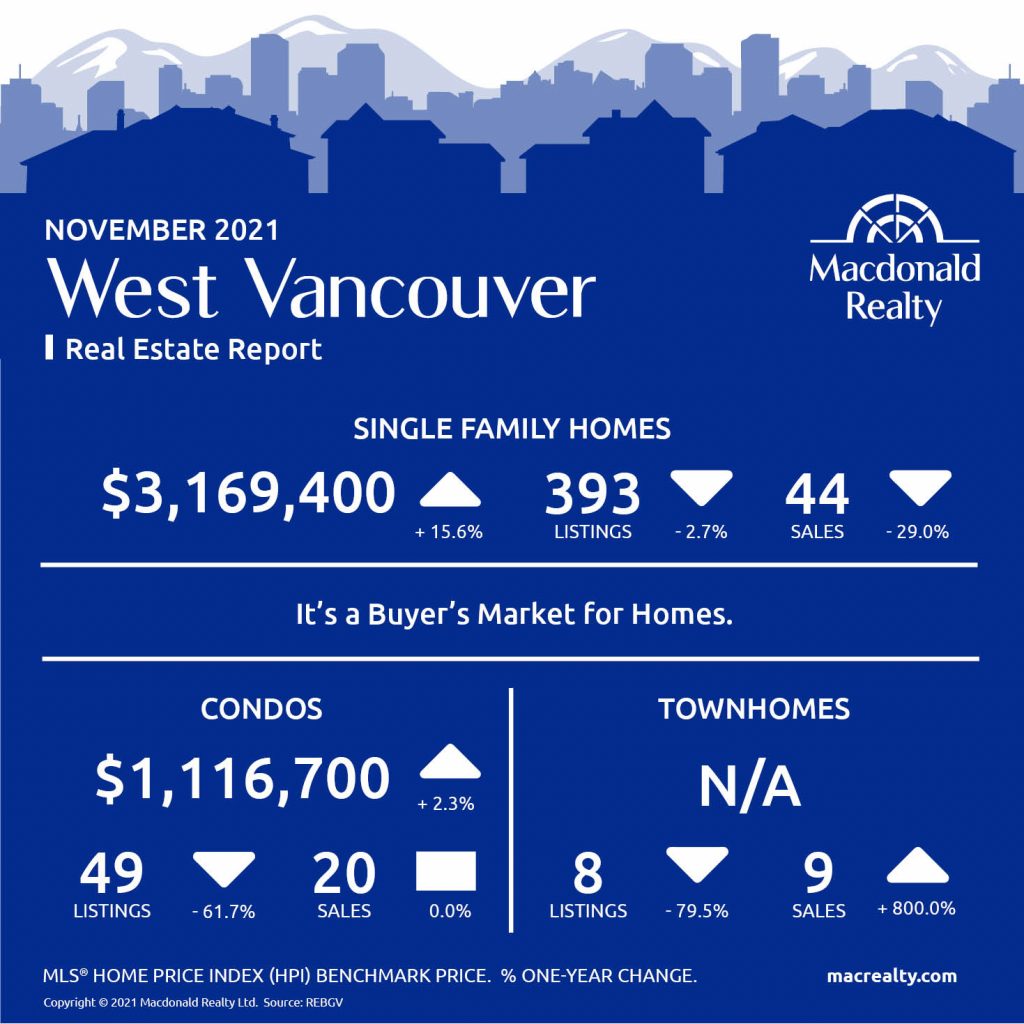
West Vancouver
Looking for more information about the real estate market in specific neighbourhoods in the Greater Vancouver?
Macdonald Realty has offices across the Greater Vancouver. Please email [email protected] or call 1-877-278-3888 to be matched with a REALTOR® working in your area.
MLS® Home Price Index (HPI) Benchmark Price
Average and median home prices are often misinterpreted, are affected by change in the mix of homes sold, and can swing dramatically from month to month (based on the types and prices of properties that sold in a given month). The MLS® HPI overcomes these shortcomings and uses the concept of a benchmark home, a notional home with common attributes of typical homes in a defined area. Visit www.housepriceindex.ca for more information.
This blog post is based on market data provided by the Real Estate Board of Greater Vancouver (REBGV) www.rebgv.org
by Macrealty Marketing Team | Dec 7, 2021 | Market Updates
December 2021 – Lower Mainland Monthly Update (REBGV & FVREB)
Record breaking Year will set New standards for 2022
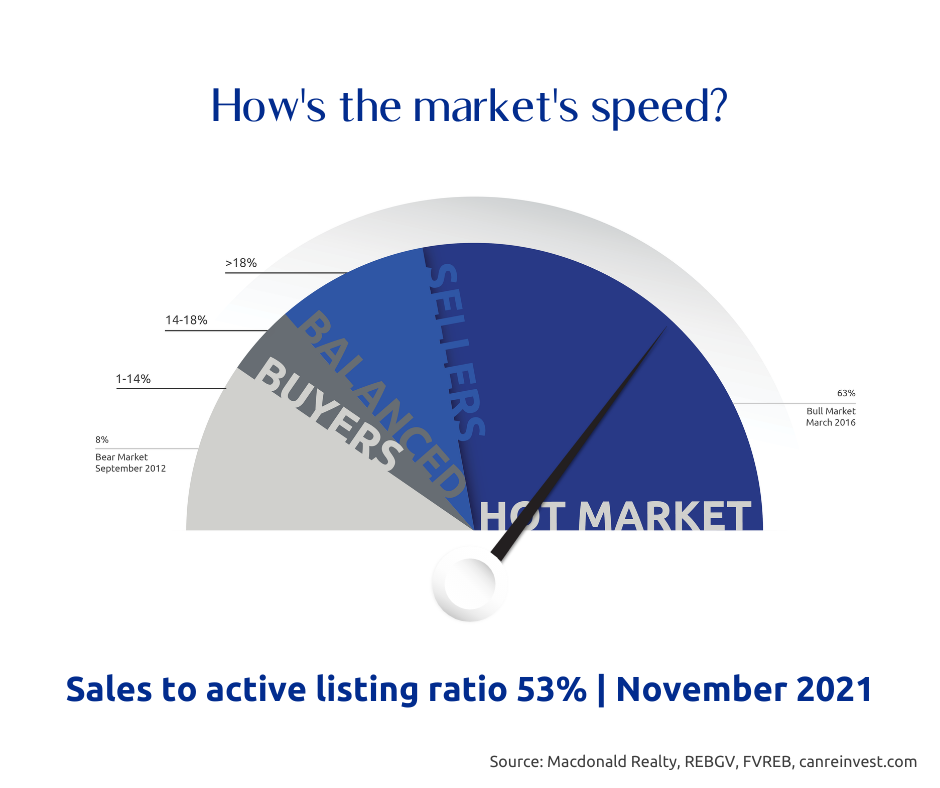
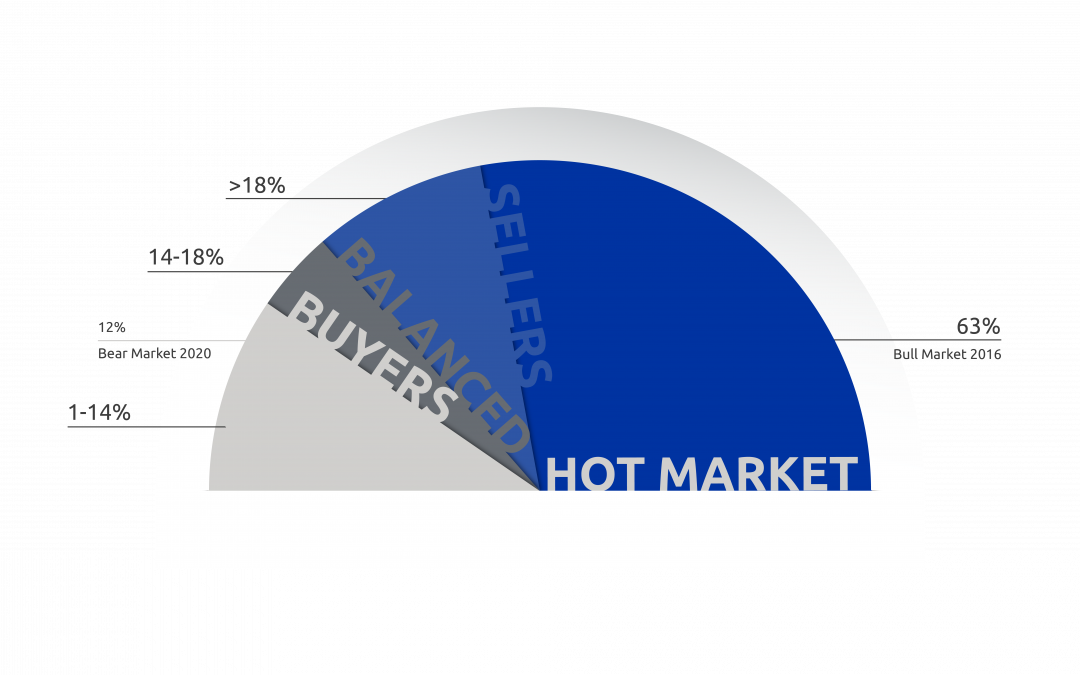
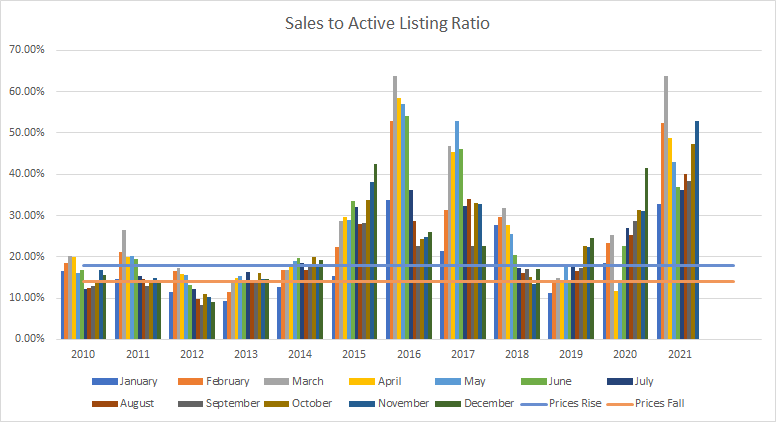
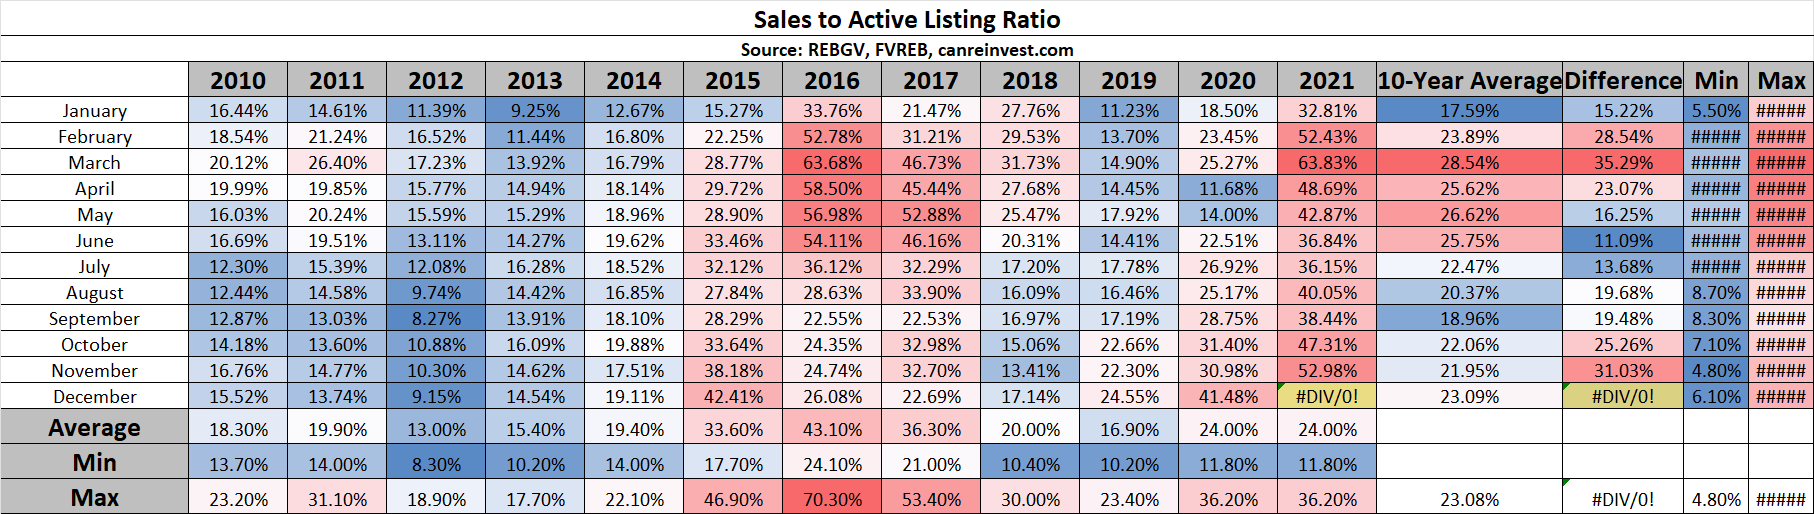
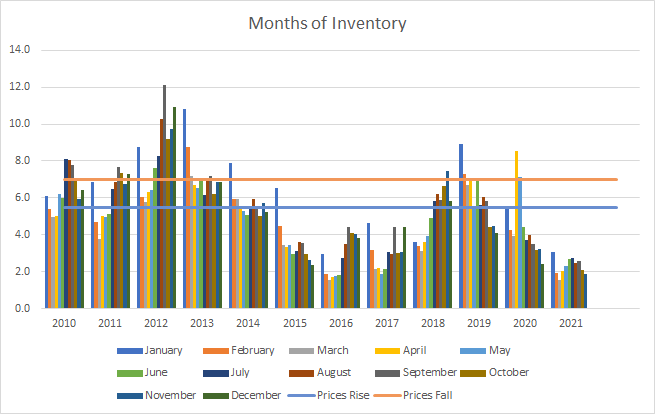
The most reliable indicator of market prices is the Sales to Active Listings Ratio (SAL). This is the ratio between the number of sales in a given month and the number of active listings at month-end.
In hotter markets in BC, a long-term analysis has shown that prices will usually act in the following ways:
- 7+ Months of Inventory (Under 14% SAL): Prices will likely DECLINE
- 5 – 7 Months of Inventory (14% – 18% SAL): Prices will likely be STABLE
- Less than 5.5 Months of Inventory (Over 18% SAL): Prices will likely RISE
Visit this link to learn more about house prices and inventory.
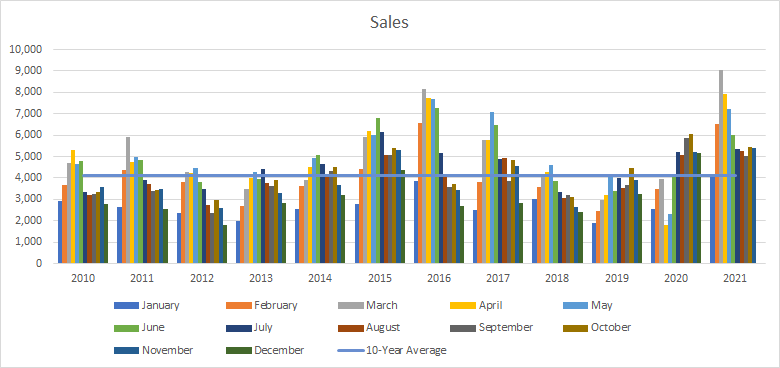
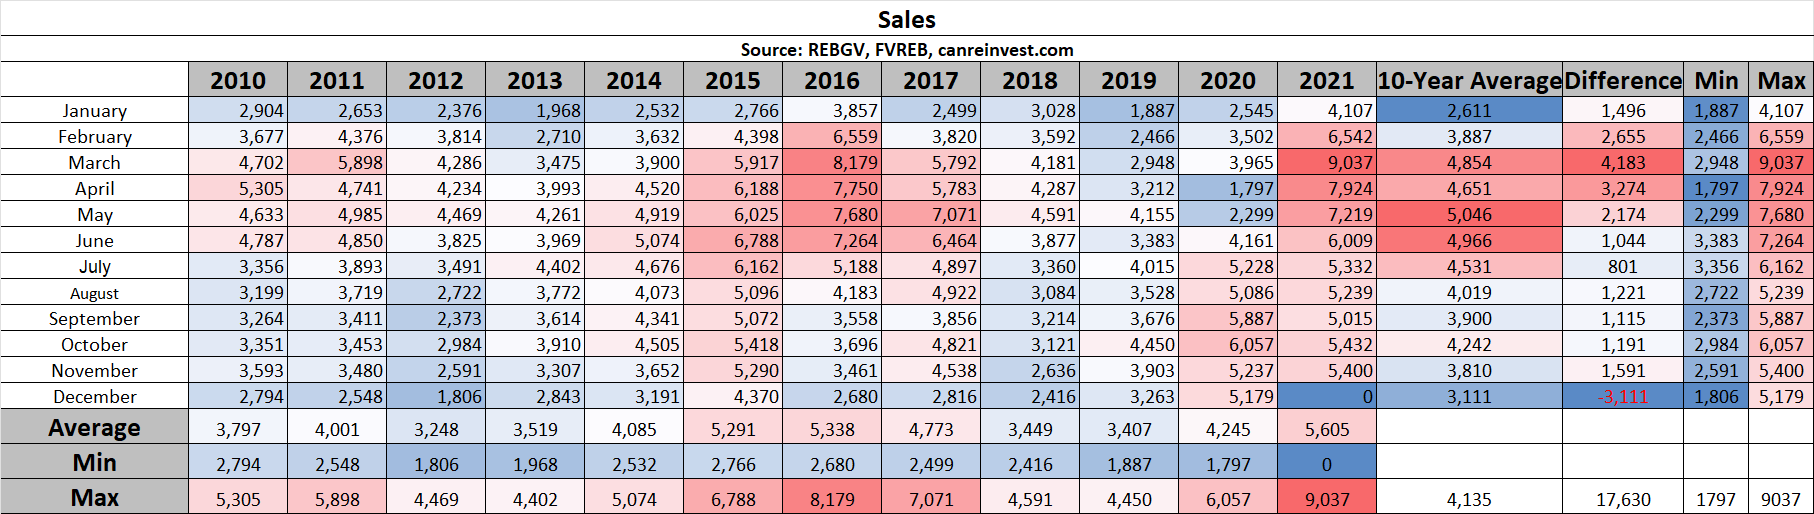
Sales
Sales have officially broken all records in Greater Vancouver. Sales in November (5,400) surpassed the previous high in 2015 (5,290).
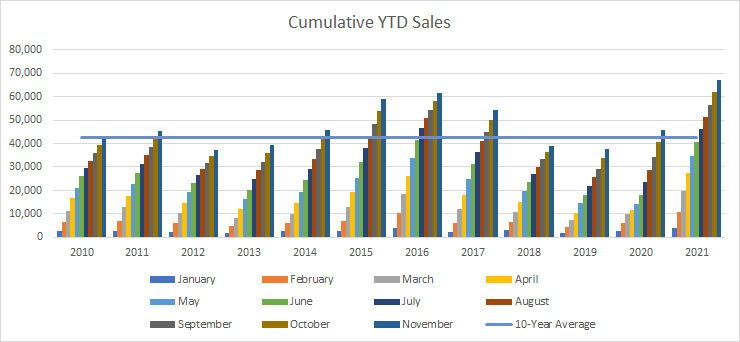
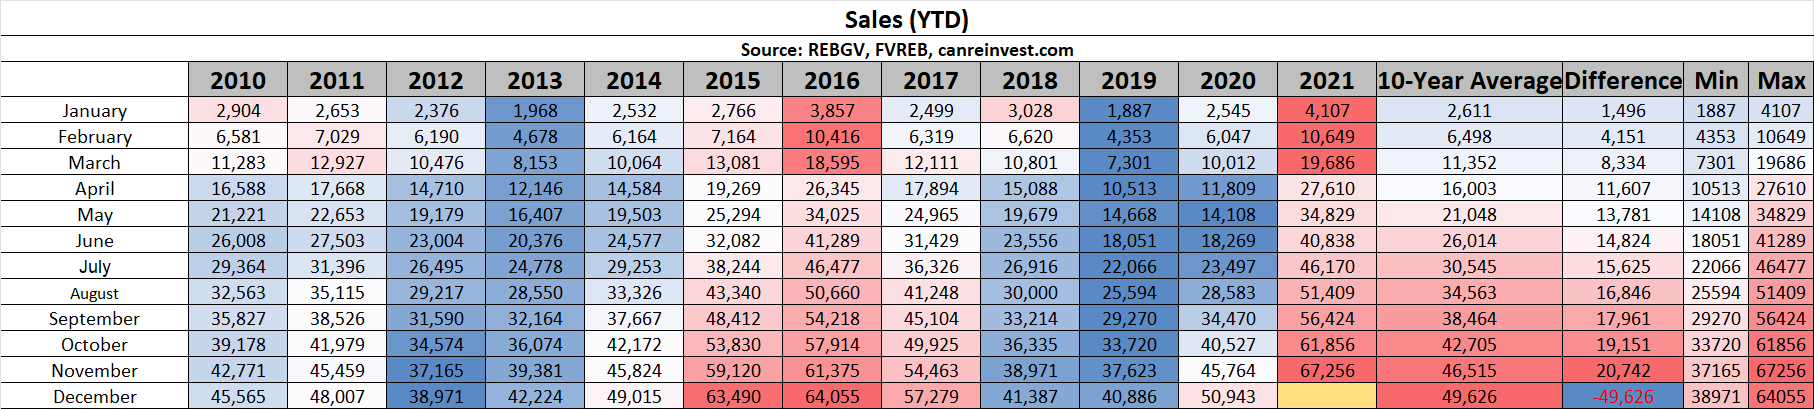
Cumulative Year-to-date Sales
Sales to the end of November (67,256) have already surpassed the previous full-year high in 2016 (64,055)
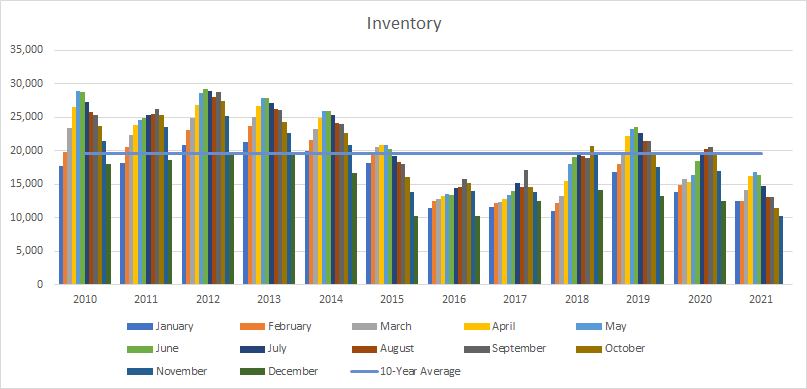
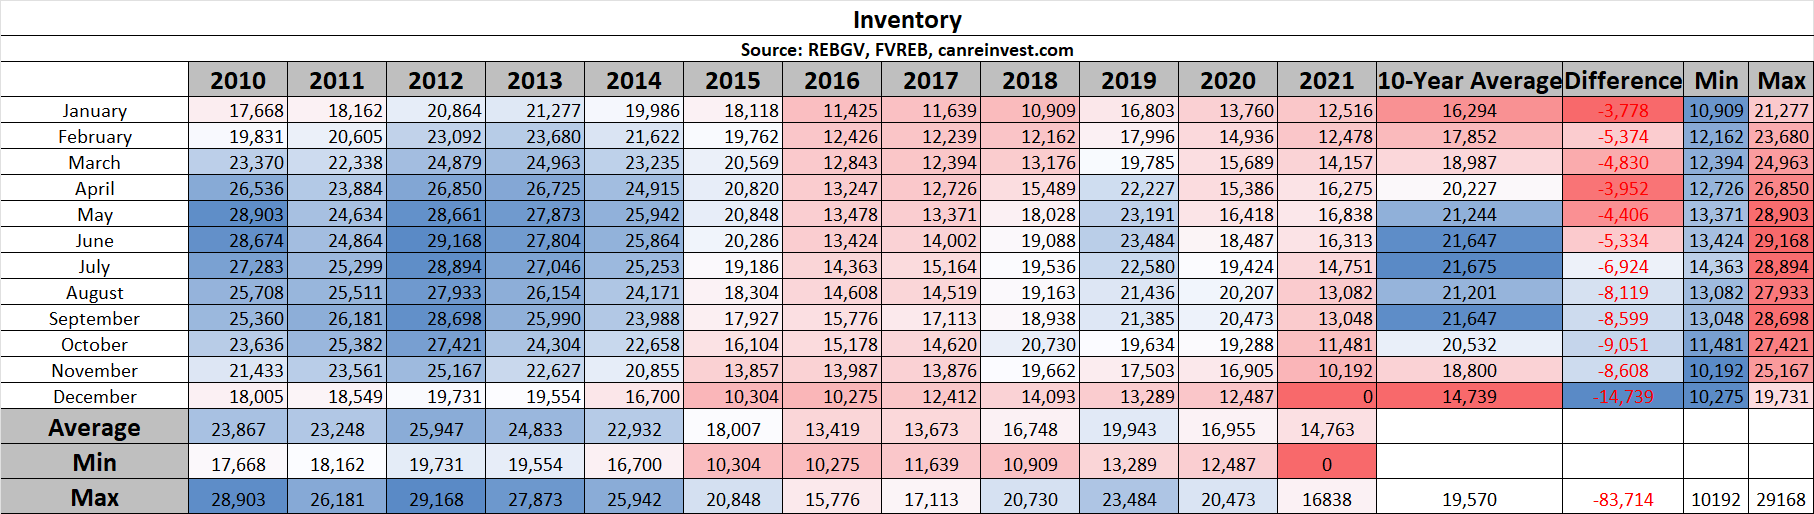
Inventory
Standing Inventory (10,192) is the lowest on record. The previous low (10,275) was in December 2016
Sales to Active Listings
Sales to Active Listings of 53% indicates prices should continue to rise
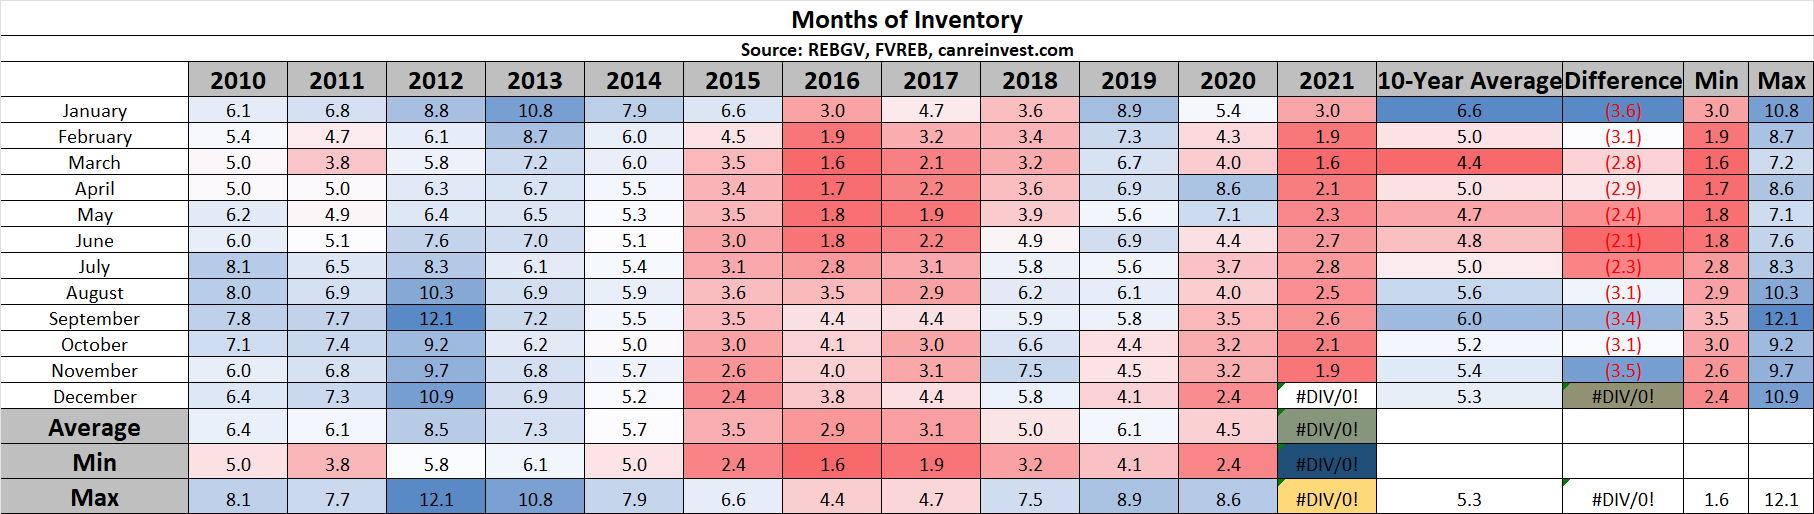
Months of Inventory
Months of inventory has not been above 3 months for all of 2021. That has never happened before.
by Macrealty Marketing Team | Nov 5, 2021 | Market Updates
Here are the latest real estate market statistics from Macdonald Realty on Okanagan listings and sales in October 2021.
Find the infographics by visiting the Facebook Album.
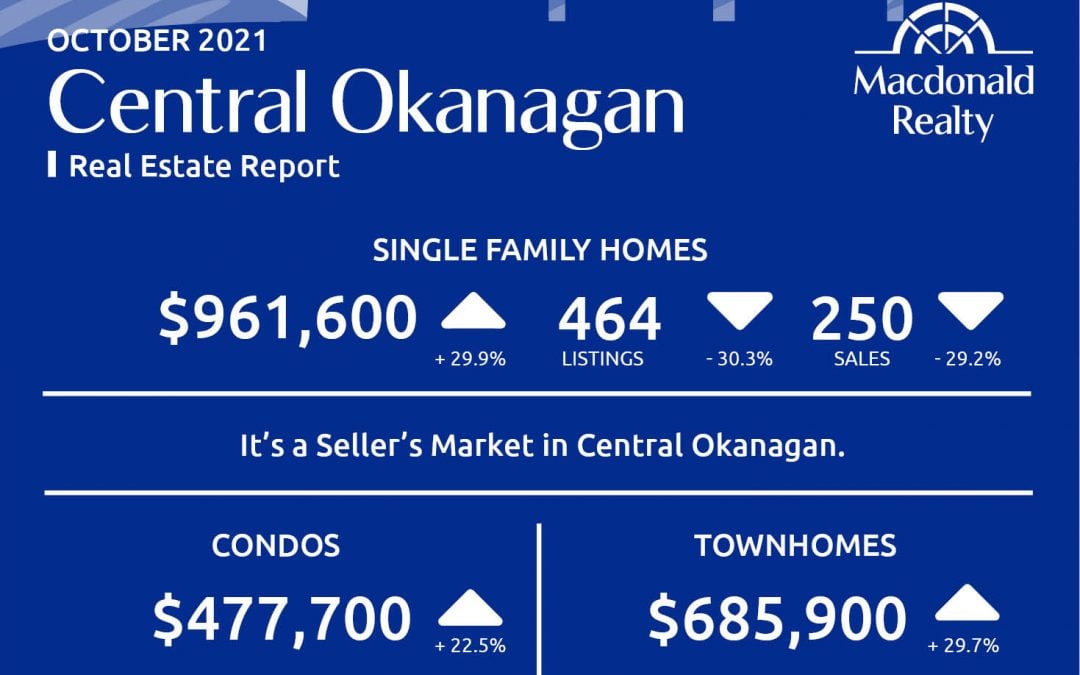
Central Okanagan: Kelowna and Lake Country
There were 250 sales, 464 active listings, and $961,600 average sale price for detached homes in the Central Okanagan market, including Kelowna and Lake Country.
The condo market featured 154 sales and 239 active listings at the end of the month. The average sale price was $477,700. Townhome sales were 91, active listings were 136 and the average sale price was $685,900. It’s a seller’s market in Central Okanagan.

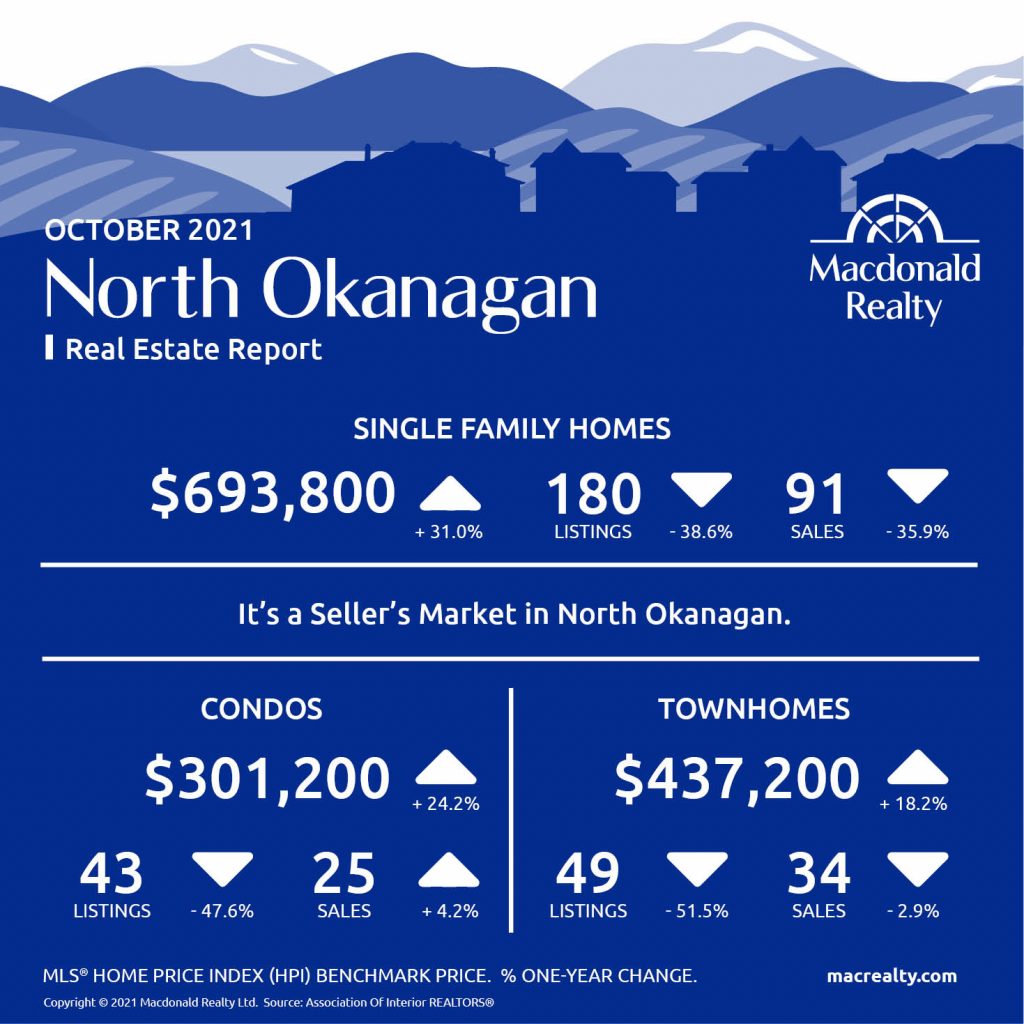
North Okanagan: Vernon and surrounding area
In North Okanagan, including Vernon and the surrounding area and the average sale price was $693,800. At the end of the month, there were 91 sales and 180 active listings.
There were 25 sales and 43 active listings for condos. The average sale price was $301,200.
In comparison, townhomes featured 34 sales, 49 active listings and a $437,200 average sale price.
It’s a seller’s market in North Okanagan.
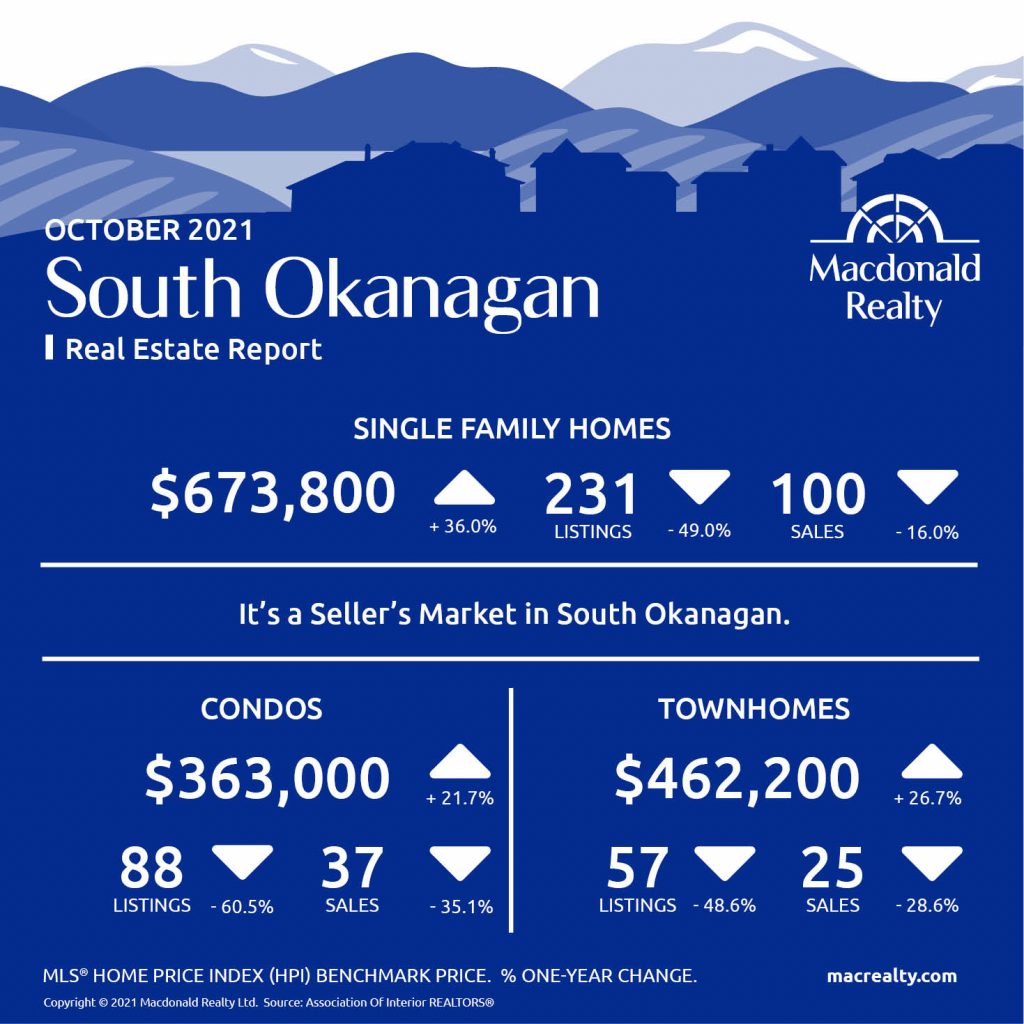
South Okanagan
There were 100 sales, 231 active listings, and $673,800 average sale price for detached homes in the South Okanagan market.
The condo market featured 37 sales and 88 active listings at the end of the month. The average sale price was $363,000.
Townhome sales were 25, active listings were 57 and the average sale price was $462,200.
It’s a seller’s market in South Okanagan.
Looking for more information about the real estate market in specific neighbourhoods in Okanagan?
Macdonald Realty has offices in Kelowna and across BC. Please email [email protected] or call 1-877-278-3888 to be matched with a REALTOR® working in your area.
This blog post is based on market data provided by the Association Of Interior REALTORS® https://www.interiorrealtors.ca/.
by Macrealty Marketing Team | Nov 5, 2021 | Market Updates
According to the Fraser Valley Real Estate Board demand for Fraser Valley real estate remained solid in October with overall sales the third highest on record.
The Board processed a total of 1,938 property sales on its Multiple Listing Service® (MLS®) in October, an increase of 3.9 per cent compared to September and a decrease of 18.2 per cent compared to the same month last year.
Larry Anderson, President of the Board, said, “What we’re seeing is a combination of above‐average sales with below‐average new listings which is placing strong upward pressure on home prices, for all residential categories, month‐over‐month.
“It is a very challenging time, particularly for buyers. I empathize with clients who have been trying to buy a home for more than a year without success after multiple attempts. Now, more than ever is the time when buyers and sellers alike must rely on their REALTOR® to guide and advise them in considering all available options, including a change in community or even property type.”
After rebounding slightly in September, new listings decreased in October. The Board received 2,188 new listings, a decrease of 29.0 per cent compared to last year, and a decrease of 6.6 per cent compared to September 2021. The month ended with a total active inventory of 3,447, which is a 9.6 per cent decrease compared to September, and a 49.8 percent decrease compared to October 2020.
Baldev Gill, Chief Executive Officer of the Board, said, “Fraser Valley is a top destination currently in BC for buyers looking for relatively affordable family‐sized homes. Townhomes and single‐family homes are selling on average within two to four weeks in our region, with buyers keenly watching the market for new listings.”
Across the Fraser Valley, in October, the average number of days to sell a single‐family detached home was 28 and a townhome was 18 days. Apartments took, on average, 27 days to sell.
Find all the infographics related to the October Market Statistics by visiting the Facebook Album.
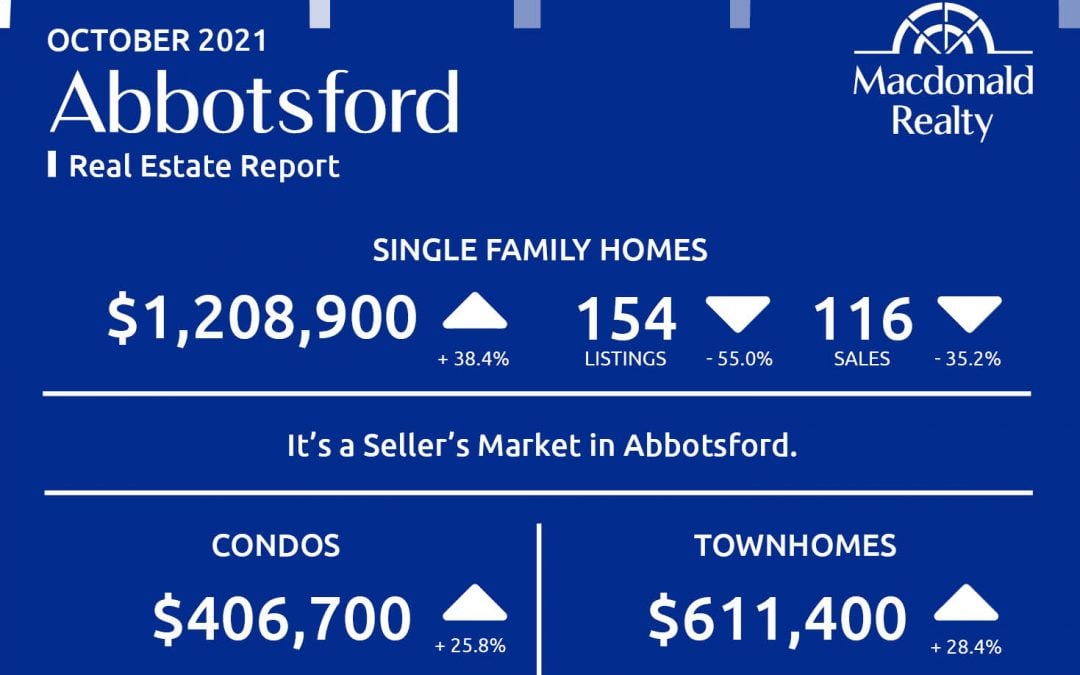
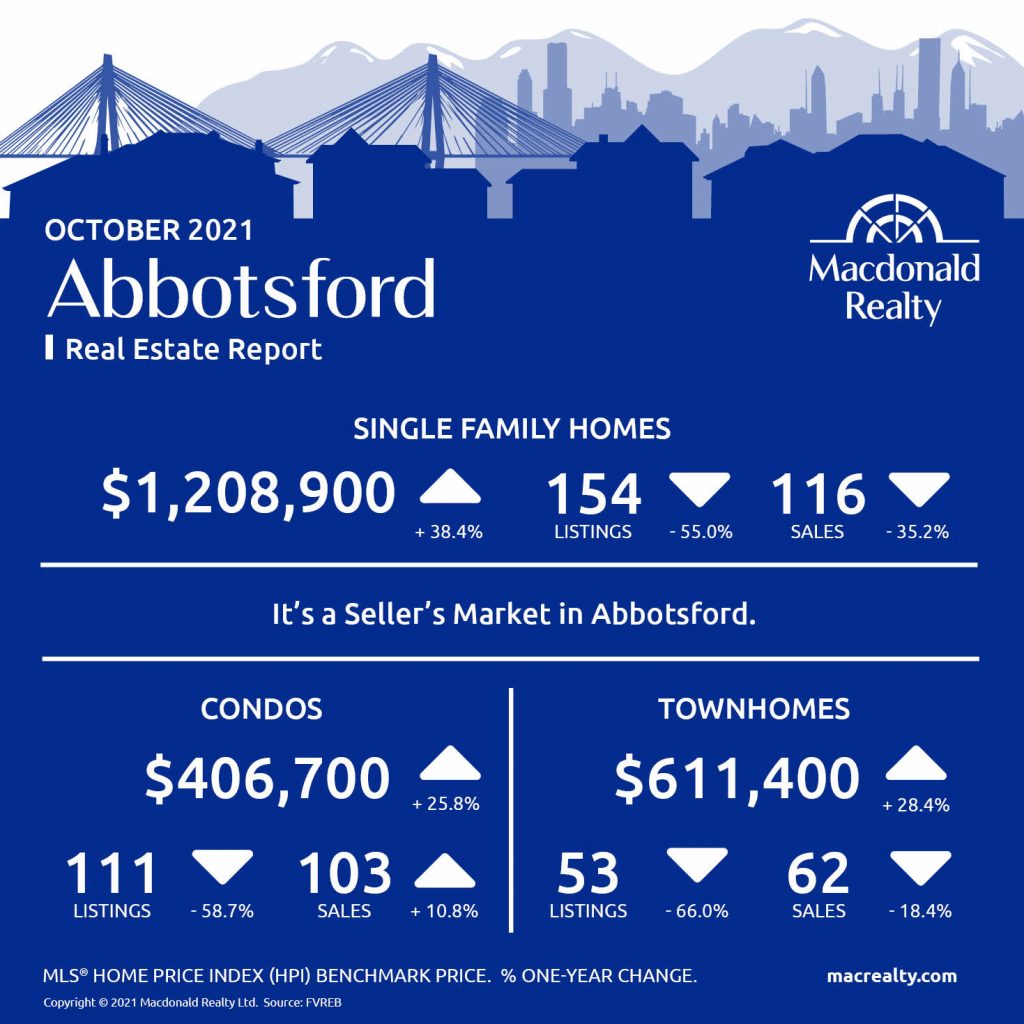
Abbotsford
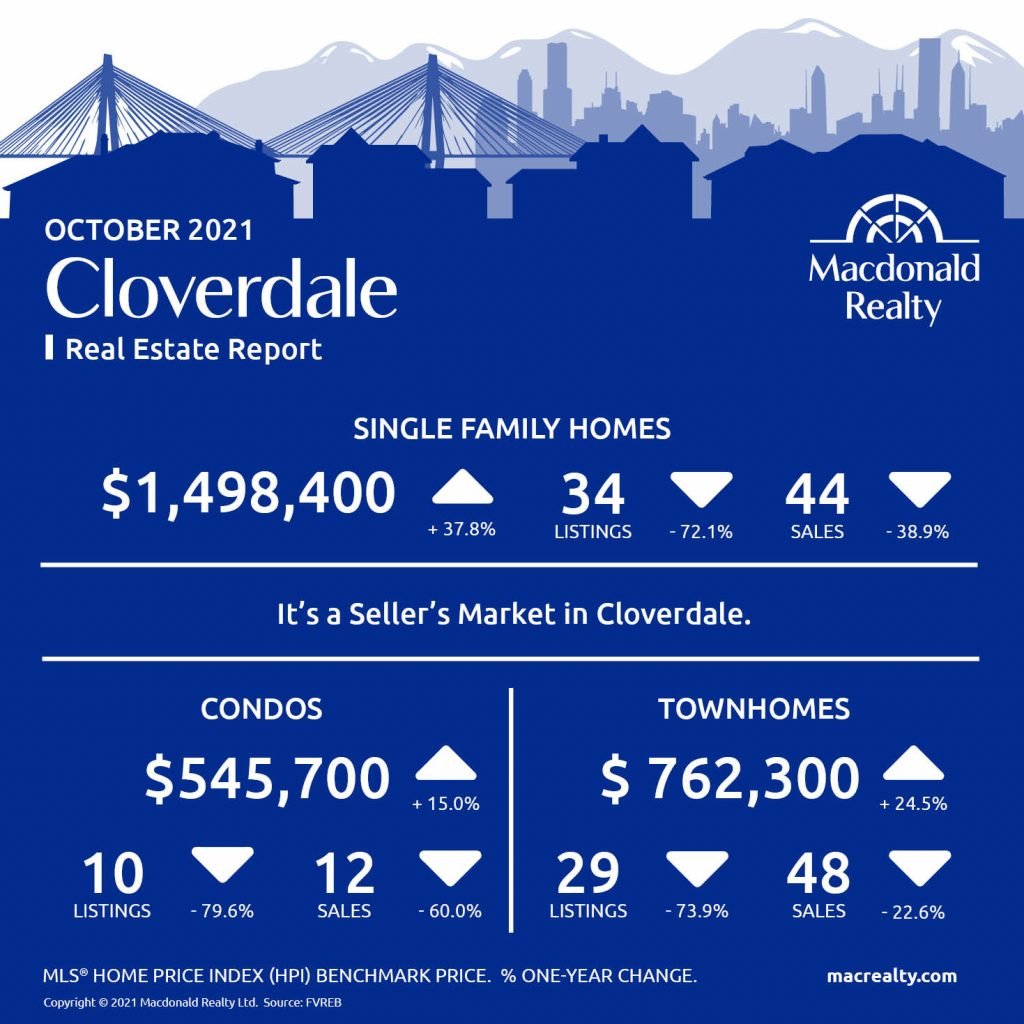
Cloverdale
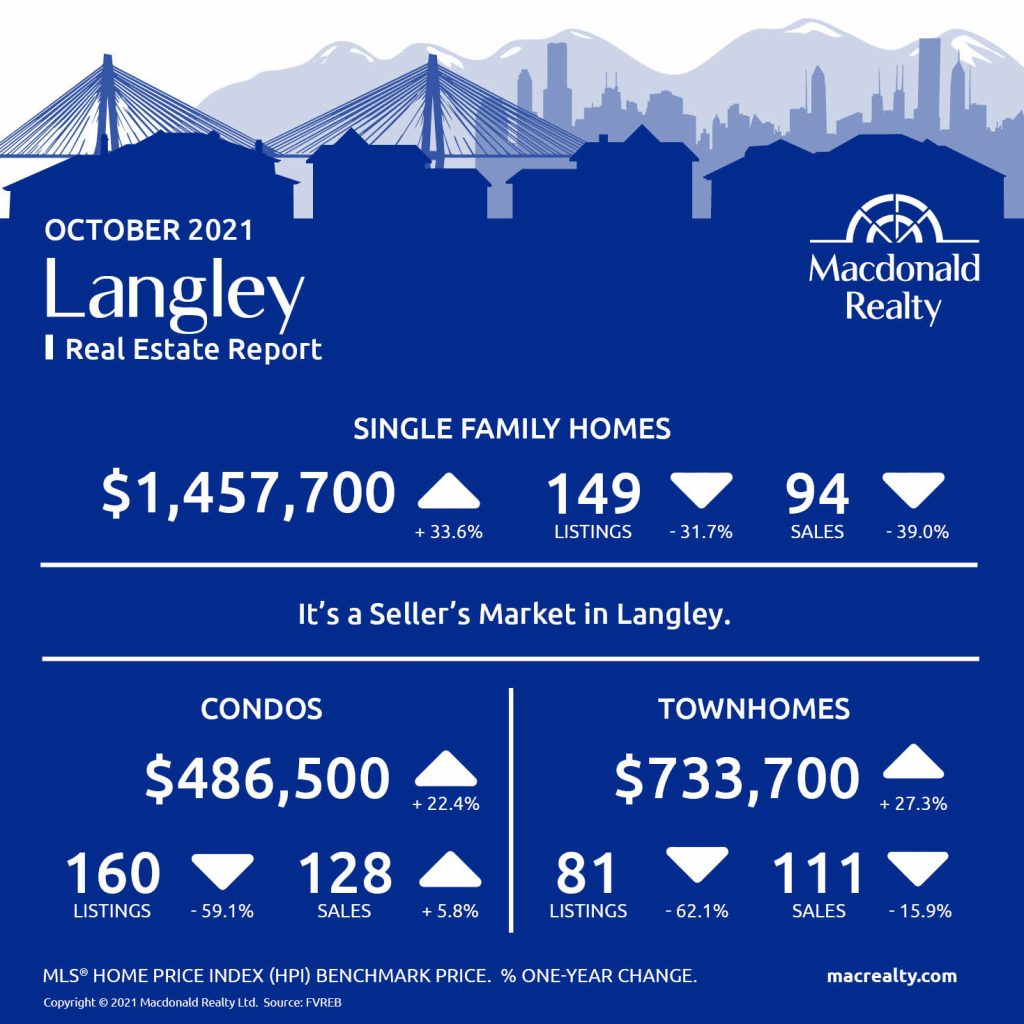
Langley
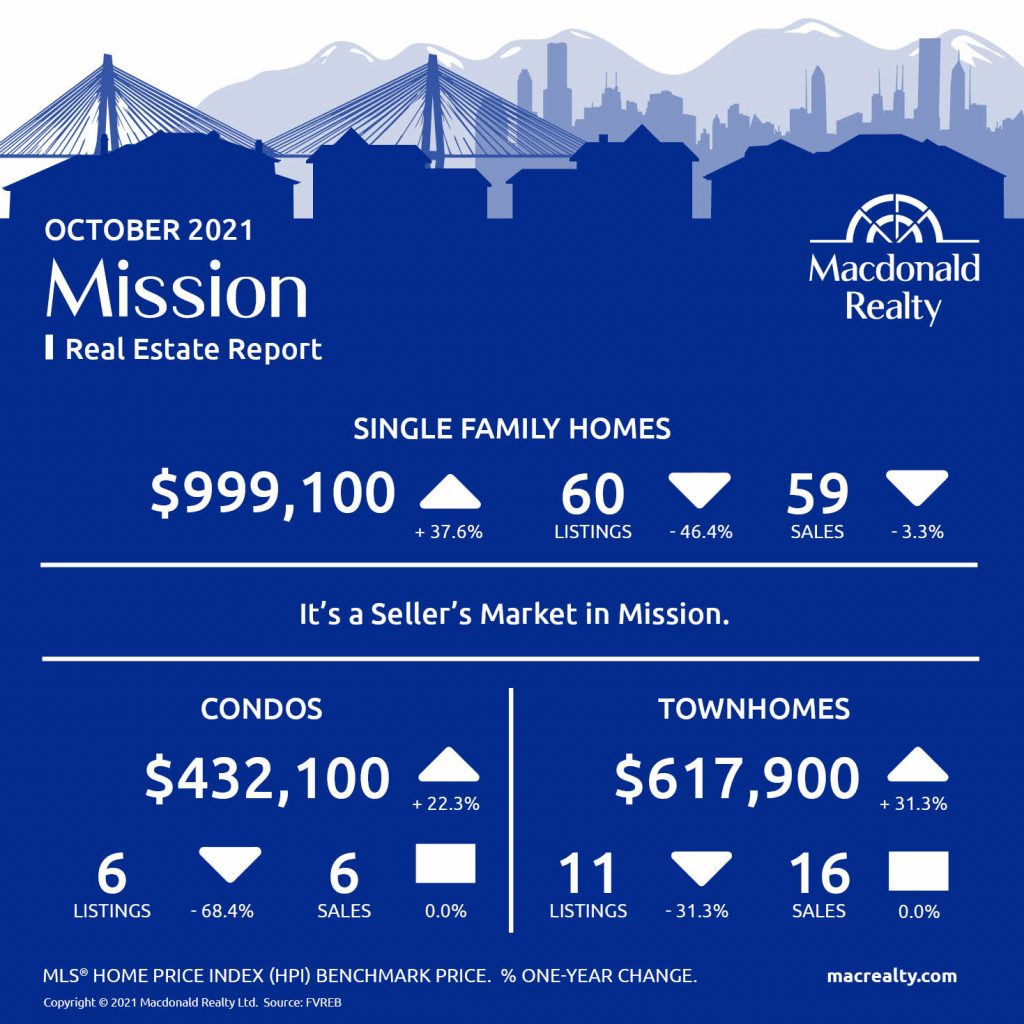
Mission
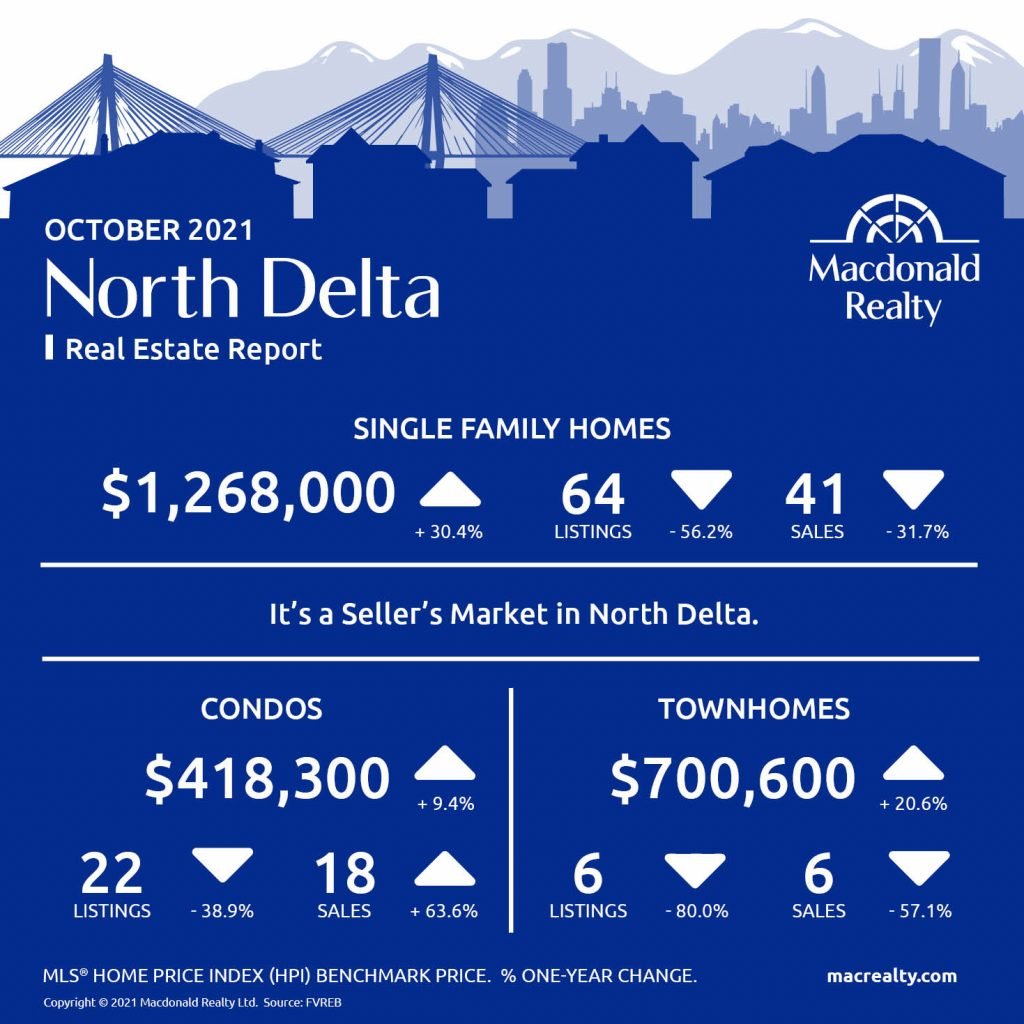
North Delta
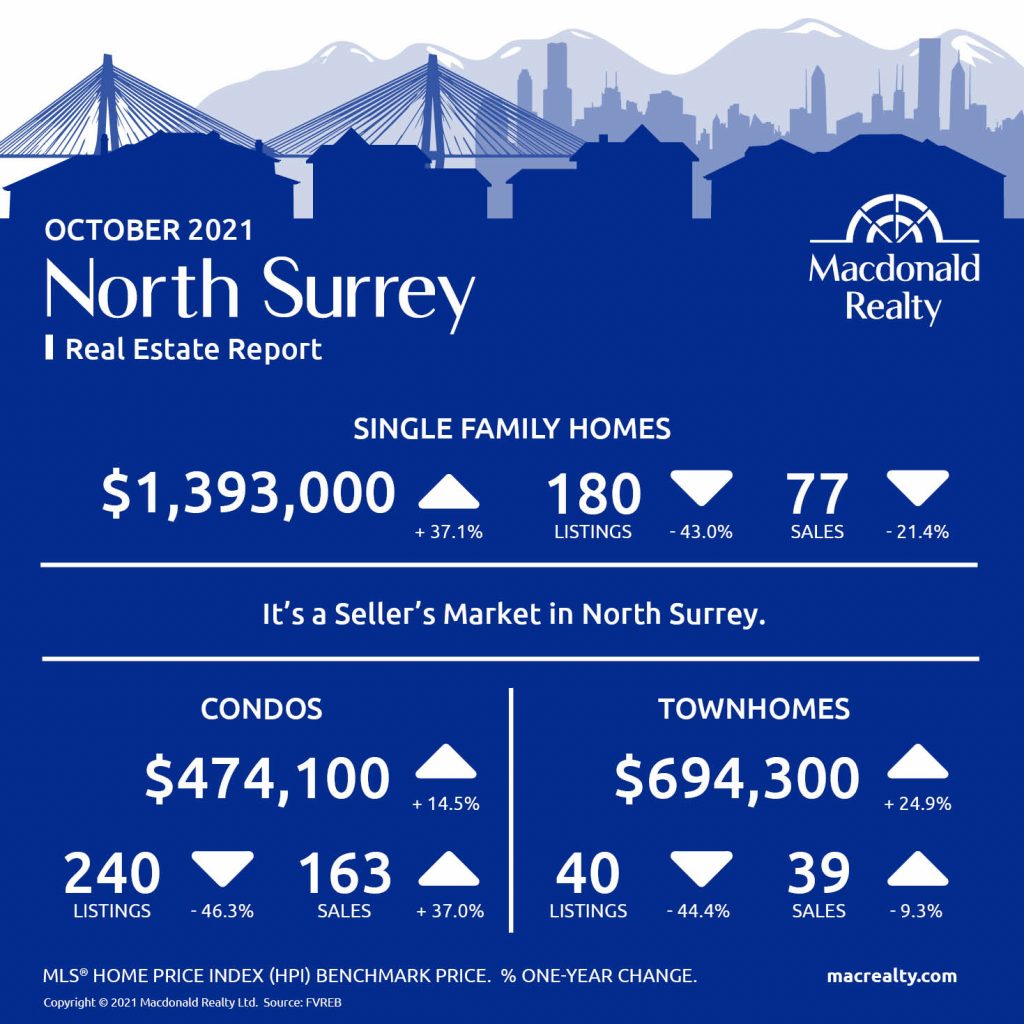
North Surrey
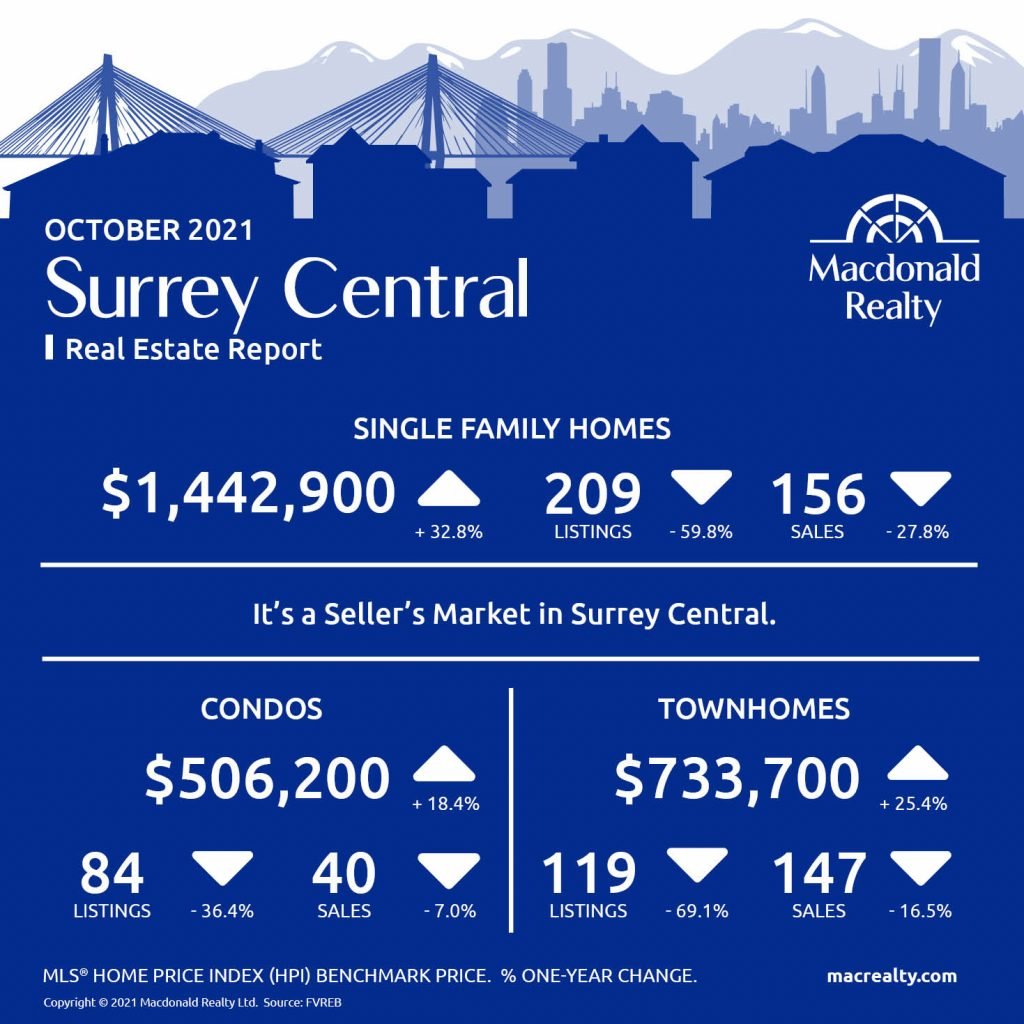
Surrey Central
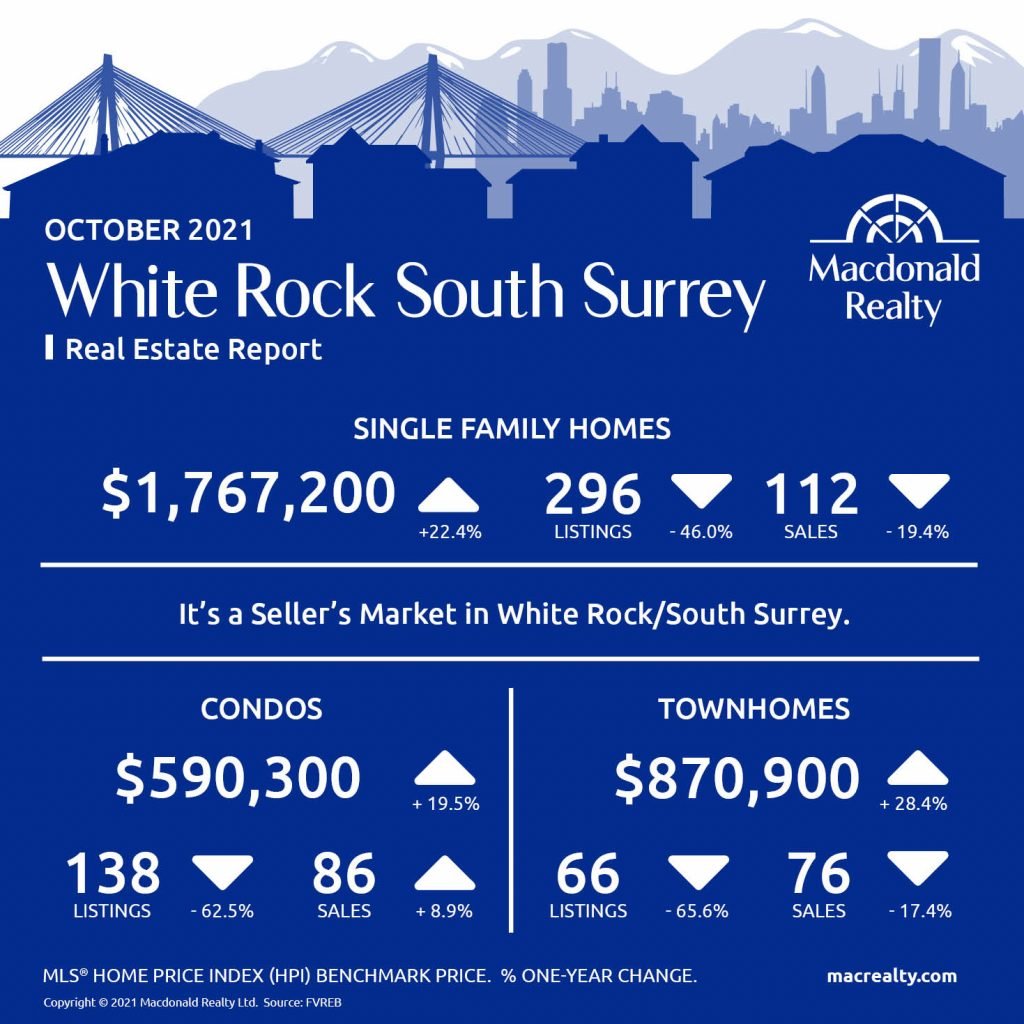
White Rock / South Surrey
Looking for more information about the real estate market in specific neighbourhoods in Surrey, Langley and Fraser Valley?
Macdonald Realty has offices in North Delta, White Rock/South Surrey, and Langley. Please email [email protected] or call 1-877-278-3888 to be matched with a REALTOR® working in your area.
MLS® Home Price Index (HPI) Benchmark Price
Average and median home prices are often misinterpreted, are affected by change in the mix of homes sold, and can swing dramatically from month to month (based on the types and prices of properties that sold in a given month). The MLS® HPI overcomes these shortcomings and uses the concept of a benchmark home, a notional home with common attributes of typical homes in a defined area. Visit www.housepriceindex.ca for more information.
This blog post is based on market data provided by the Fraser Valley Real Estate Board (FVREB) www.fvreb.bc.ca
by Macrealty Marketing Team | Nov 5, 2021 | Market Updates
Here are the latest real estate market statistics from Macdonald Realty on Greater Victoria, Parksville/Qualicum, and Nanaimo listings and sales in October 2021. Find all the infographics related to the October Market Statistics by visiting the Facebook Album.
According to the Victoria Real Estate Board inventory pressures continue to constrain Victoria real estate market.
A total of 745 properties sold in the Victoria Real Estate Board region this October, 24.7 per cent fewer than the 990 properties sold in October 2020 and 2.1 per cent fewer than the previous month of September. Condominium sales were down 18.1 per cent from October 2020 with 249 units sold. 18.6 per cent fewer condominiums sold in October 2021 than in the previous month of September. Sales of single family homes were down 30.4 per cent from October 2020 with 339 sold. 2.4 per cent more single family homes sold in October 2021 than in the previous month of September.
“Once again – it’s anyone’s guess what our sales numbers would be like had we been in a market with a historically average number of homes for sale,” said Victoria Real Estate Board President David Langlois. “Over the previous ten years, the average number of properties for sale in October was 3,210 – we are one third of that this year. We continue to see record breaking low levels of homes for sale and with continuing competition for homes, we see pricing pressure persist.”
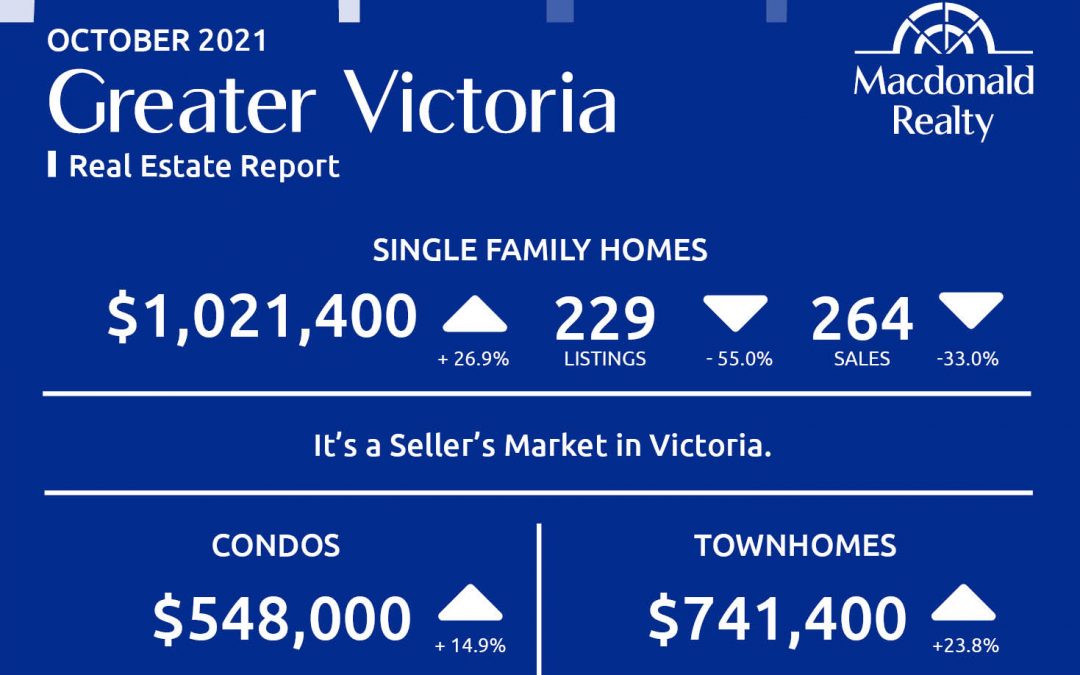
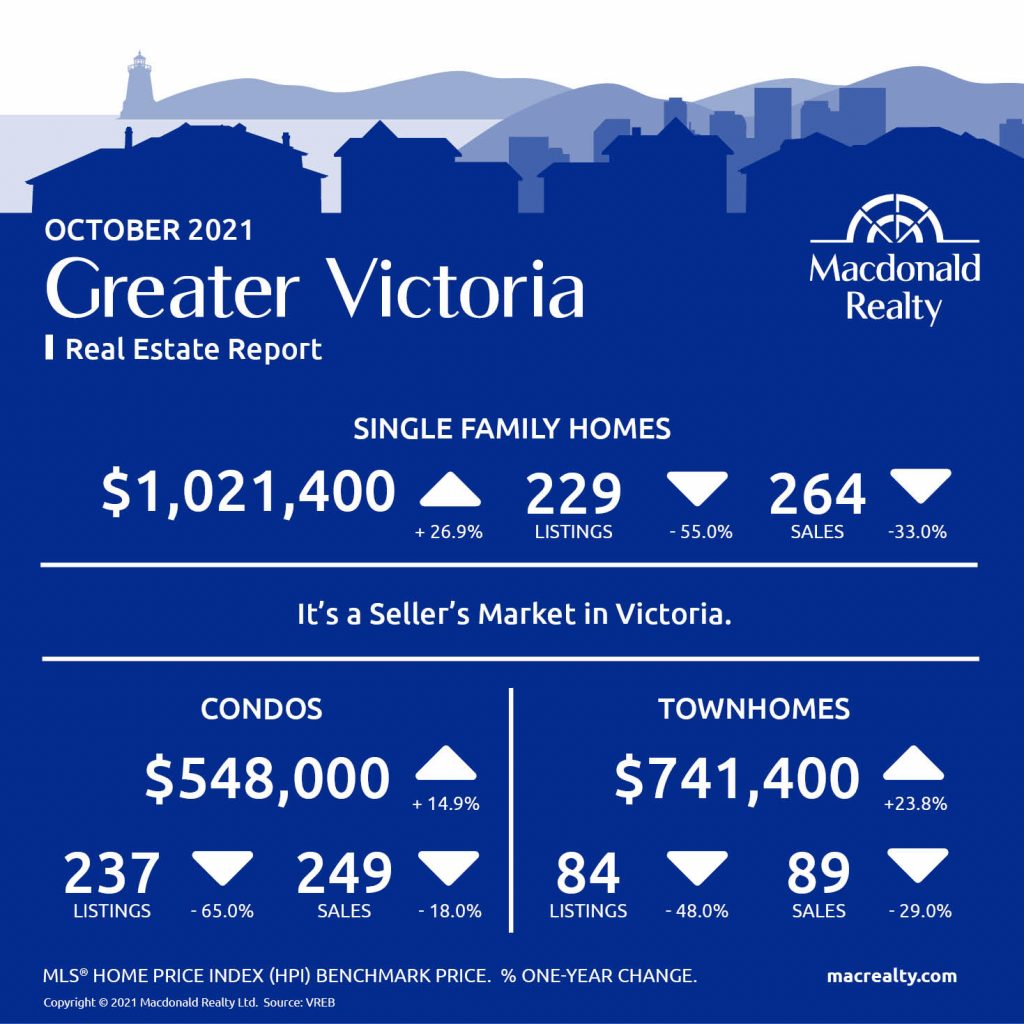
Greater Victoria
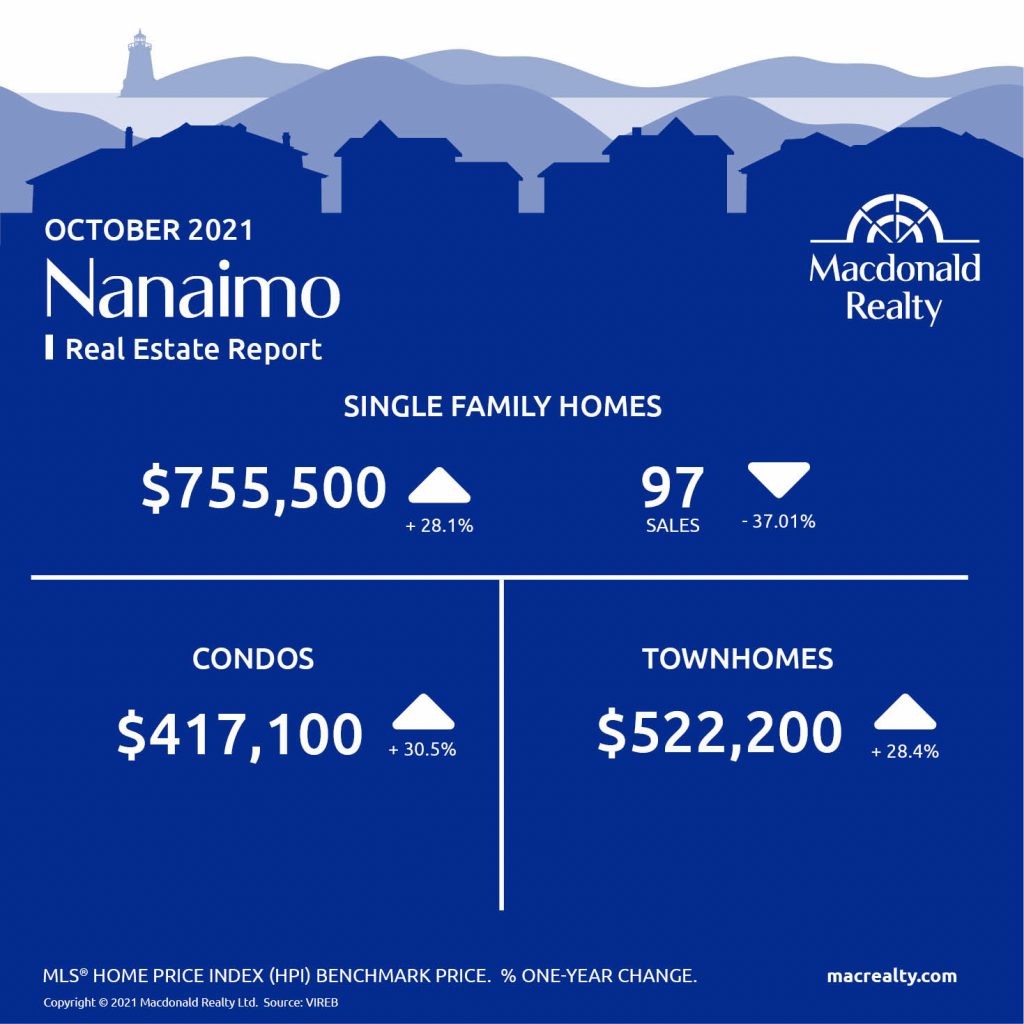
Nanaimo
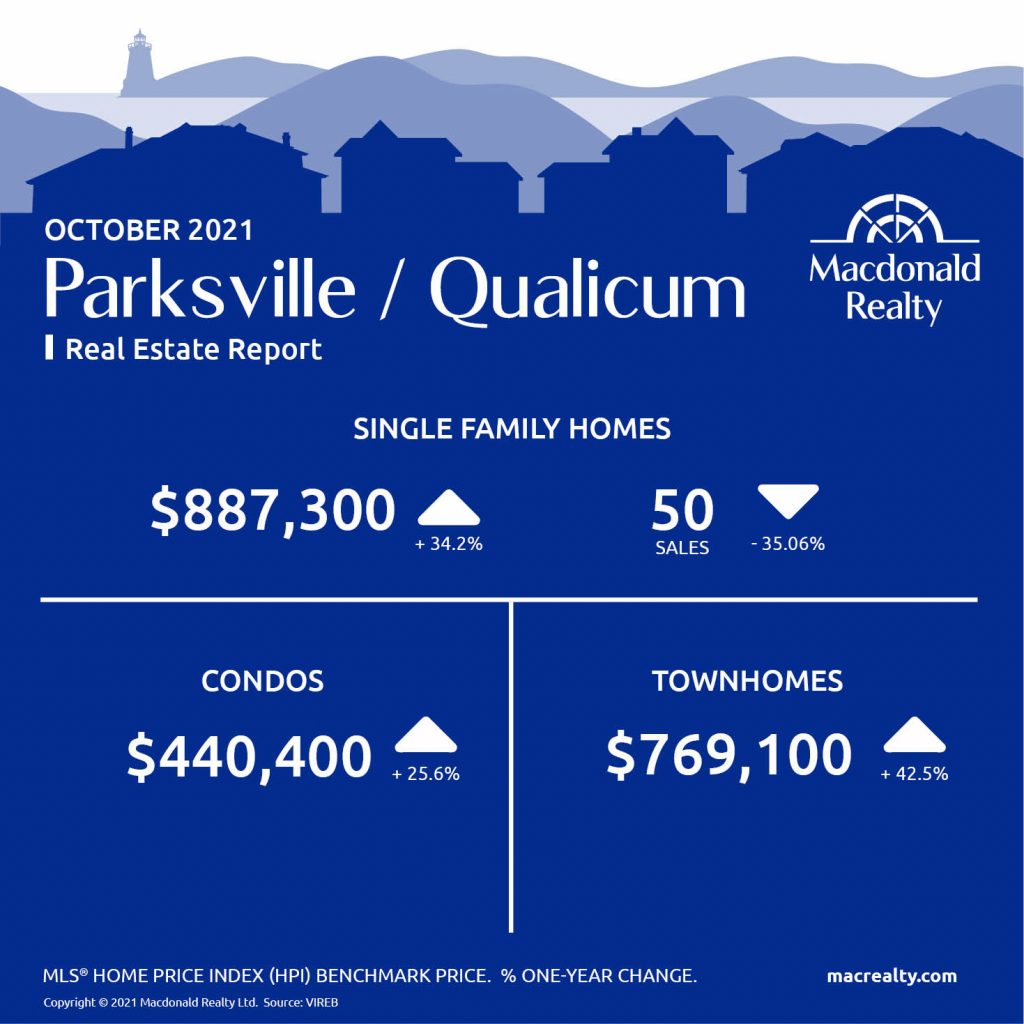
Parksville / Qualicum
Looking for more information about the real estate market in specific neighbourhoods in Victoria, Parksville, Nanaimo, Vancouver Island and the Gulf Islands?
Macdonald Realty has offices in downtown Victoria, Sidney, Parksville and Salt Spring Island. Please email [email protected] or call 1-877-278-3888 to be matched with a REALTOR® working in your area.
MLS® Home Price Index (HPI) Benchmark Price
Average and median home prices are often misinterpreted, are affected by change in the mix of homes sold, and can swing dramatically from month to month (based on the types and prices of properties that sold in a given month). The MLS® HPI overcomes these shortcomings and uses the concept of a benchmark home, a notional home with common attributes of typical homes in a defined area. Visit www.housepriceindex.ca for more information.
This blog post is based on market data provided by the Victoria Real Estate Board (VREB) www.vreb.org and the Vancouver Island Real Estate Board (VIREB) www.vireb.com. Market data from the VIREB includes listings and sales in Campbell River, Comox Valley, Cowichan Valley Nanaimo, Parksville/Qualicum, Port Alberni/West, North Island, and the Islands.
by Macrealty Marketing Team | Nov 5, 2021 | Market Updates
Here are the latest real estate market statistics from Macdonald Realty on Squamish, Whistler, and Sunshine Coast listings and sales in October 2021.
Find all the infographics related to the October Market Statistics by visiting the Facebook Album.
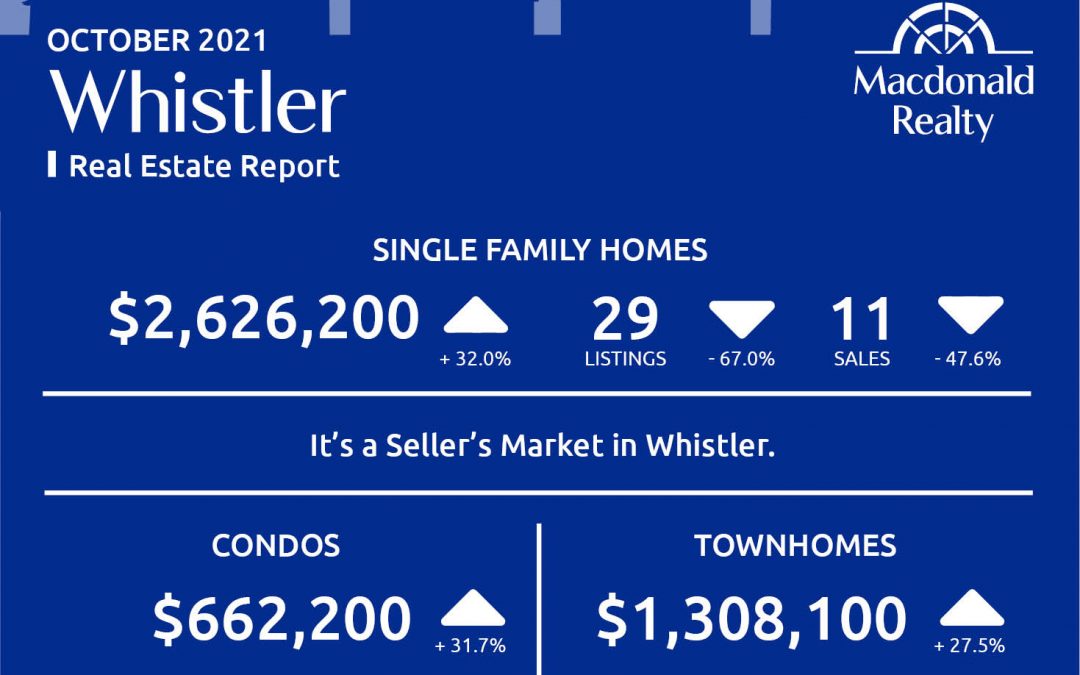
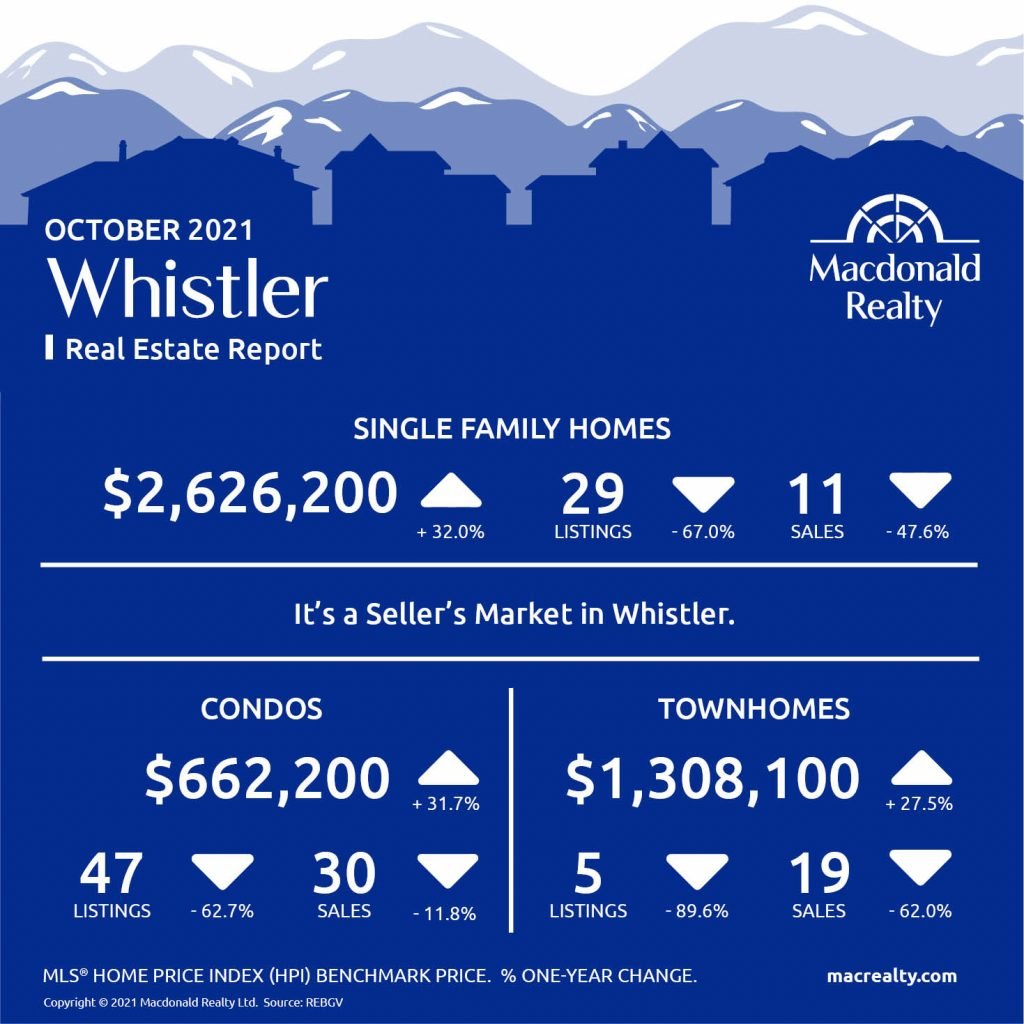
Whistler
In October 2021, there were 11 sales of detached homes and 19 active listings. The benchmark sale price was $2,626,200.
The condo market had 30 sales and 47 active listings at the end of the month. The benchmark sale price was $662,200.
The townhome market had 19 sales and, the active listings were 5. The benchmark sale price was $1,308,100.
It’s a Seller’s market in Whistler.
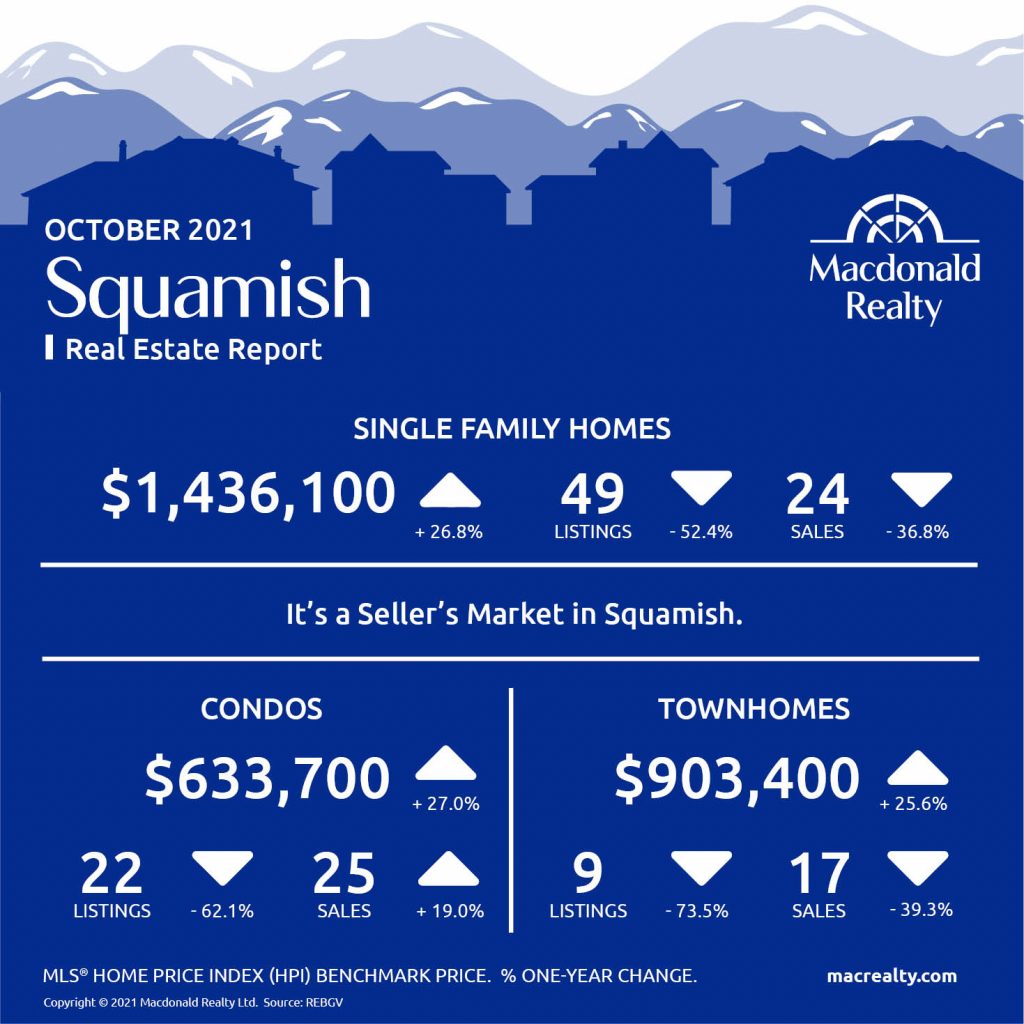
Squamish
In October 2021, there were 24 sales of detached homes and 49 active listings. The benchmark sale price was $1,436,100.
The condo market had 25 sales and 22 active listings at the end of the month. The benchmark sale price was $633,700.
The townhome market had 17 sales and, the active listings were 9. The benchmark sale price was $903,400.
It’s a Seller’s Market in Squamish.
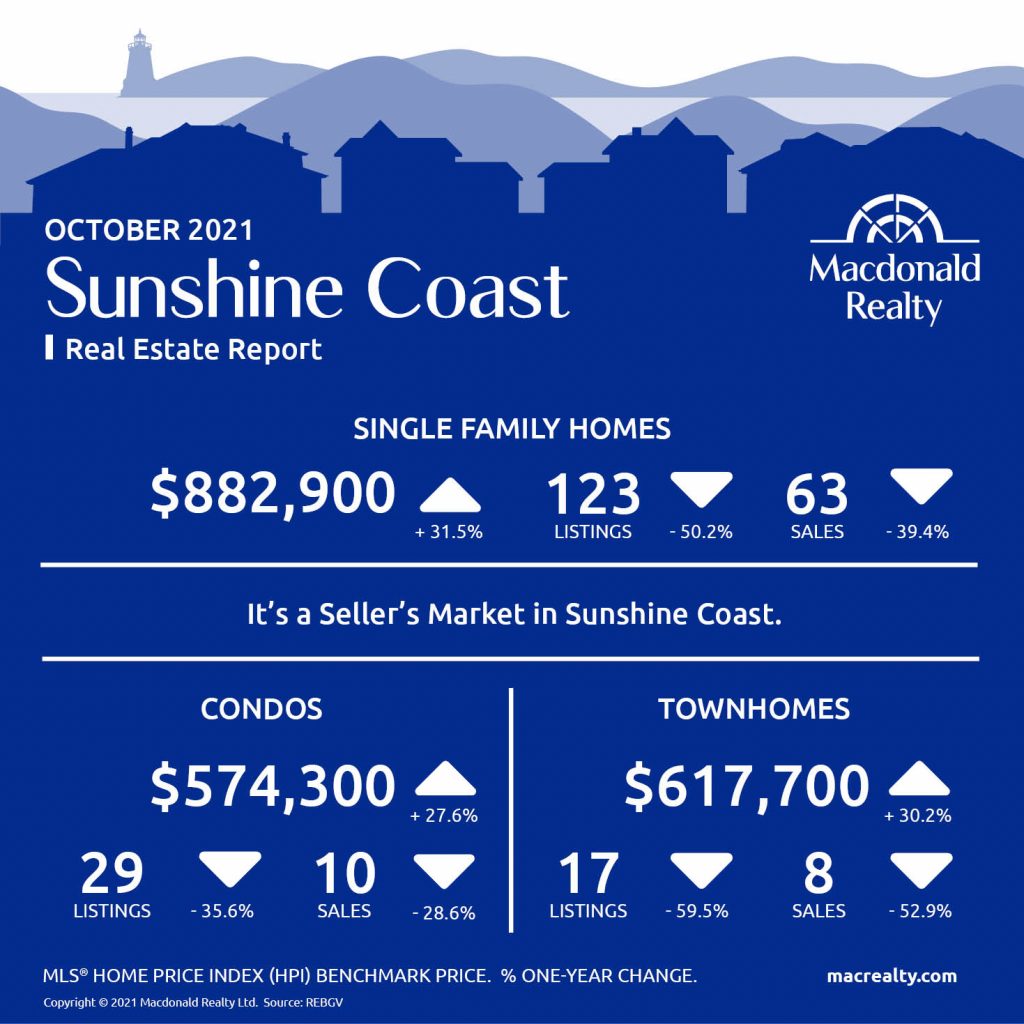
Sunshine Coast
In October 2021, there were 63 sales of detached homes and 123 active listings. The benchmark sale price was $882,900.
The condo market had 10 sales and 29 active listings at the end of the month.
The townhome market had 8 sales and, the active listings were 17.
It’s a Seller’s market on Sunshine Coast.
Looking for more information about the real estate market in specific neighbourhoods in Squamish, Whistler, and Sunshine Coast? Macdonald Realty has offices in Squamish, Whistler, and Sunshine Coast. Please email [email protected] or call 1-877-278-3888 to be matched with a REALTOR® working in your area.
MLS® Home Price Index (HPI) Benchmark Price
Average and median home prices are often misinterpreted, are affected by change in the mix of homes sold, and can swing dramatically from month to month (based on the types and prices of properties that sold in a given month). The MLS® HPI overcomes these shortcomings and uses the concept of a benchmark home, a notional home with common attributes of typical homes in a defined area. Visit www.housepriceindex.ca for more information.
This blog post is based on market data provided by the Real Estate Board of Greater Vancouver (REBGV) www.rebgv.org