by Macrealty Marketing Team | Jan 10, 2022 | Market Updates
According to the Fraser Valley Real Estate Board, fueled by the consumer response to the COVID‐19 pandemic along with historically low interest rates, total property sales in the Fraser Valley in 2021 shattered the previous annual record last set in 2016.
The FVREB processed 27,692 sales its Multiple Listing Service® (MLS®) in 2021, an increase of 39.0 per cent compared 19,926 sales in 2020; and 15.5 per cent higher than 2016’s 23,974 sales.
Larry Anderson, President of the Board, said, “No one could have predicted how the pandemic would impact the real estate market. Our region’s relative affordability, combined with a newfound ability to work from home and the value for housing dollar in the Fraser Valley attracted buyers in numbers like we’ve never seen.
“Whether helping sellers list or helping buyers complete a sale, our Board averaged over 5,200 transactions every month. And even though our volume of new listings was also high, it just couldn’t keep up with the demand.”
Year‐over‐year, sales of detached homes soared by 31.8 per cent in 2021 compared to 2020; townhome sales increased by 33.7 per cent and sales of apartments increased by 68.9 per cent. Anderson added, “With the rapid escalation of prices in 2021, many buyers made decisions based on economic factors, resulting in an explosion of condo sales in our region.”
In 2021, the FVREB received 35,629 new listings – the second highest on record (second only to 2008 at 35,651); and 12.4 per cent more than in 2020.
Baldev Gill, Chief Executive Officer of the Board, said, “Fraser Valley REALTORS® played an instrumental role in helping people navigate their real estate buying and selling needs, through uncharted territory. It’s the professionalism and expertise of our members who have done a remarkable job serving the interests and needs of buyers and sellers throughout a most challenging and unusual year.”
Baldev Gill, Chief Executive Officer of the Board, said, “Fraser Valley REALTORS® played an instrumental role in helping people navigate their real estate buying and selling needs, through uncharted territory. It’s the professionalism and expertise of our members who have done a remarkable job serving the interests and needs of buyers and sellers throughout a most challenging and unusual year.”
Find all the infographics related to the December Market Statistics by visiting the Facebook Album.
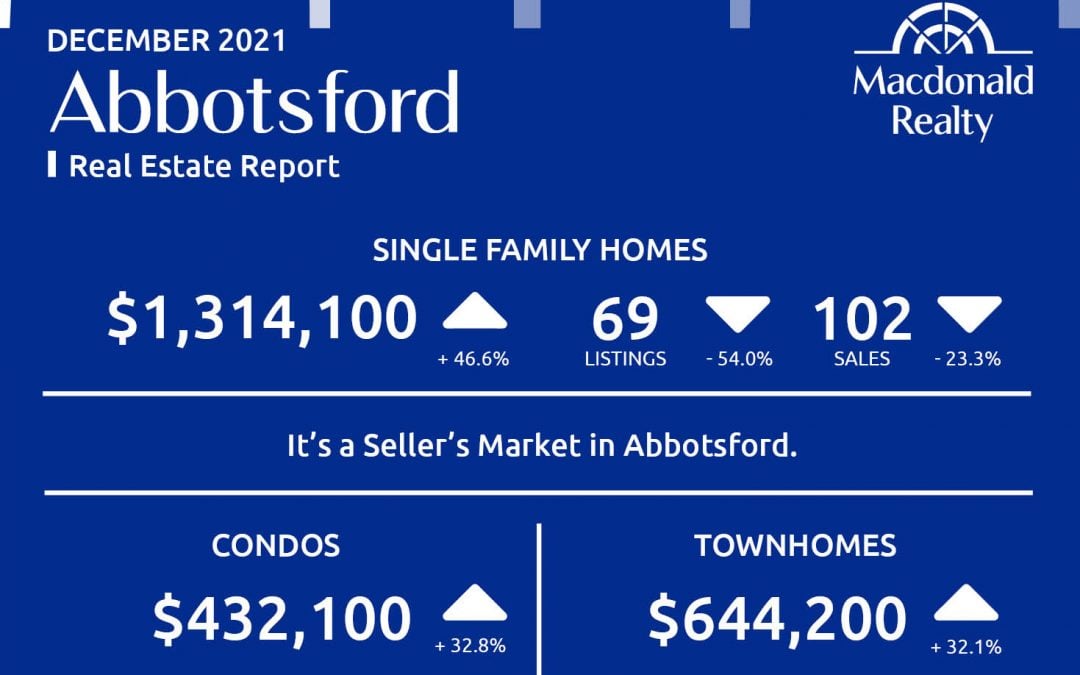
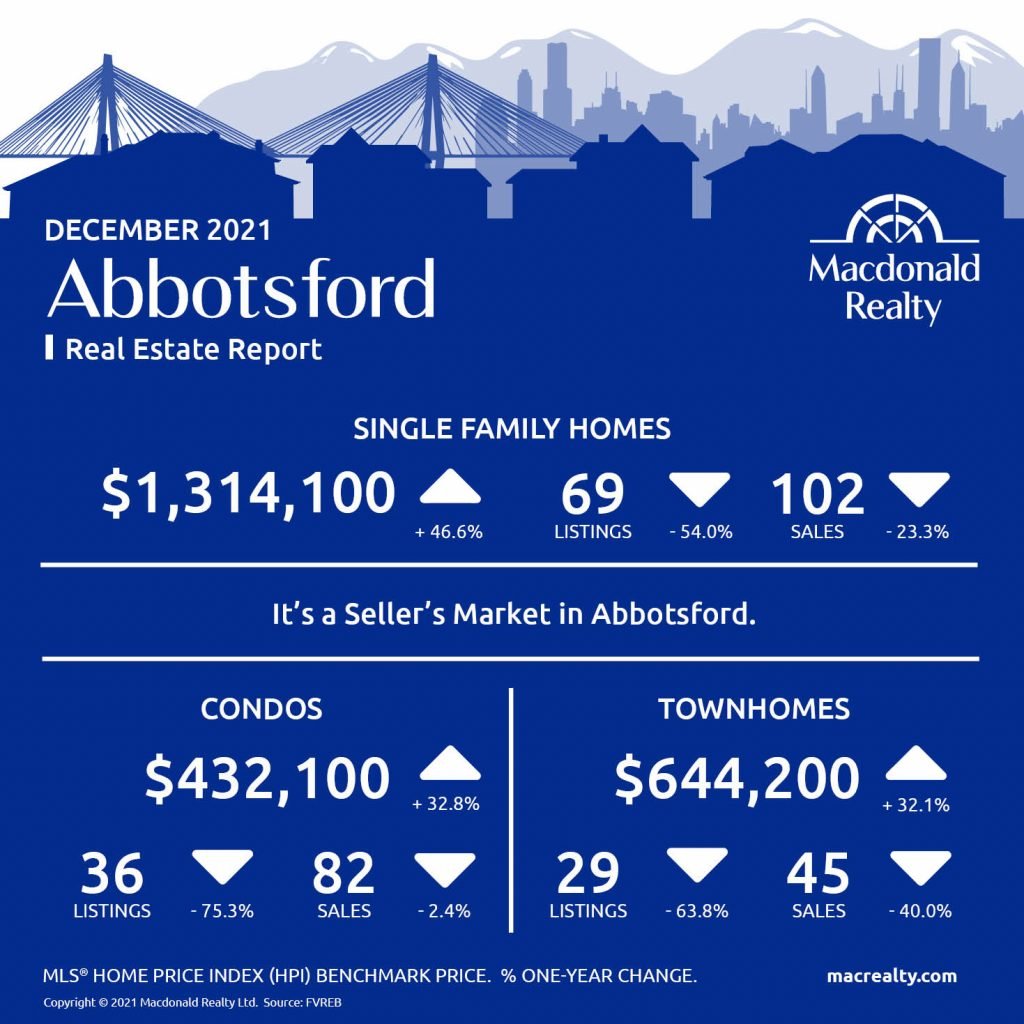
Abbotsford
Cloverdale

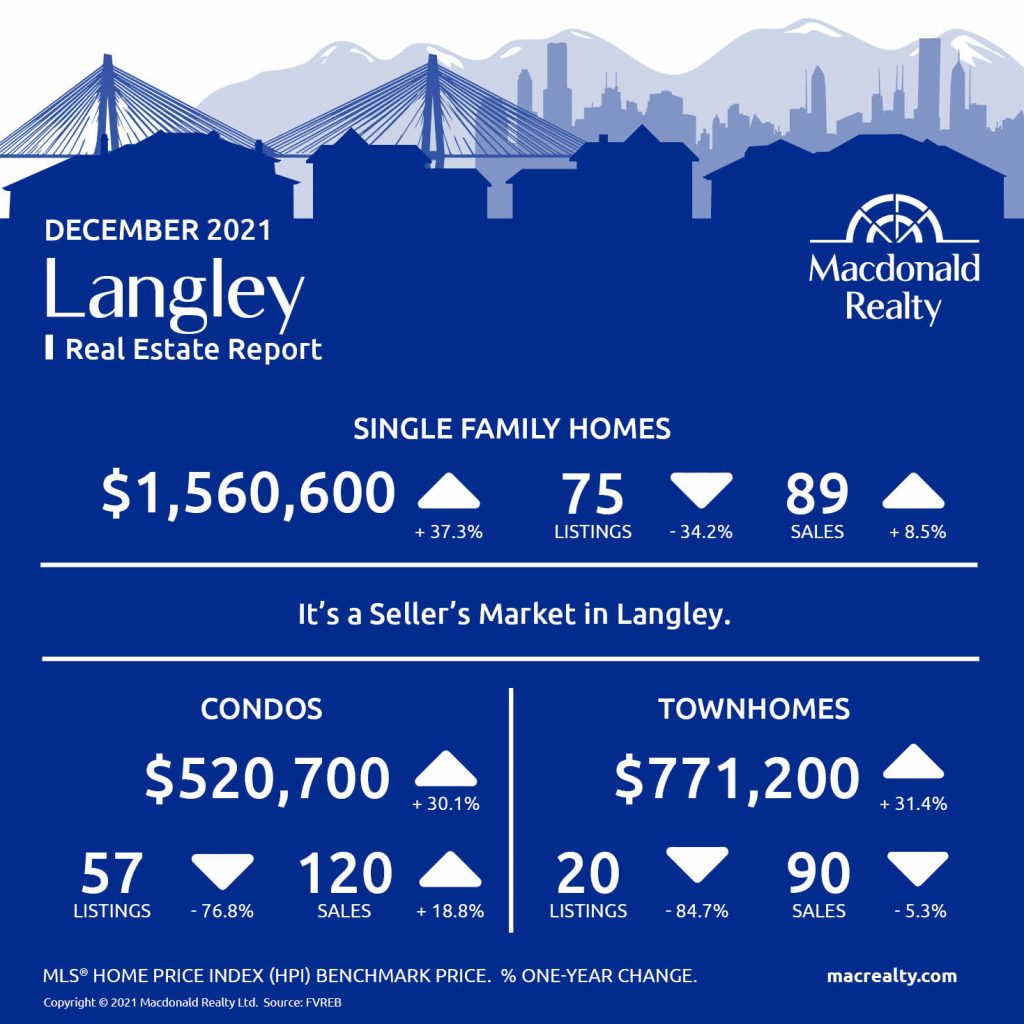
Langley
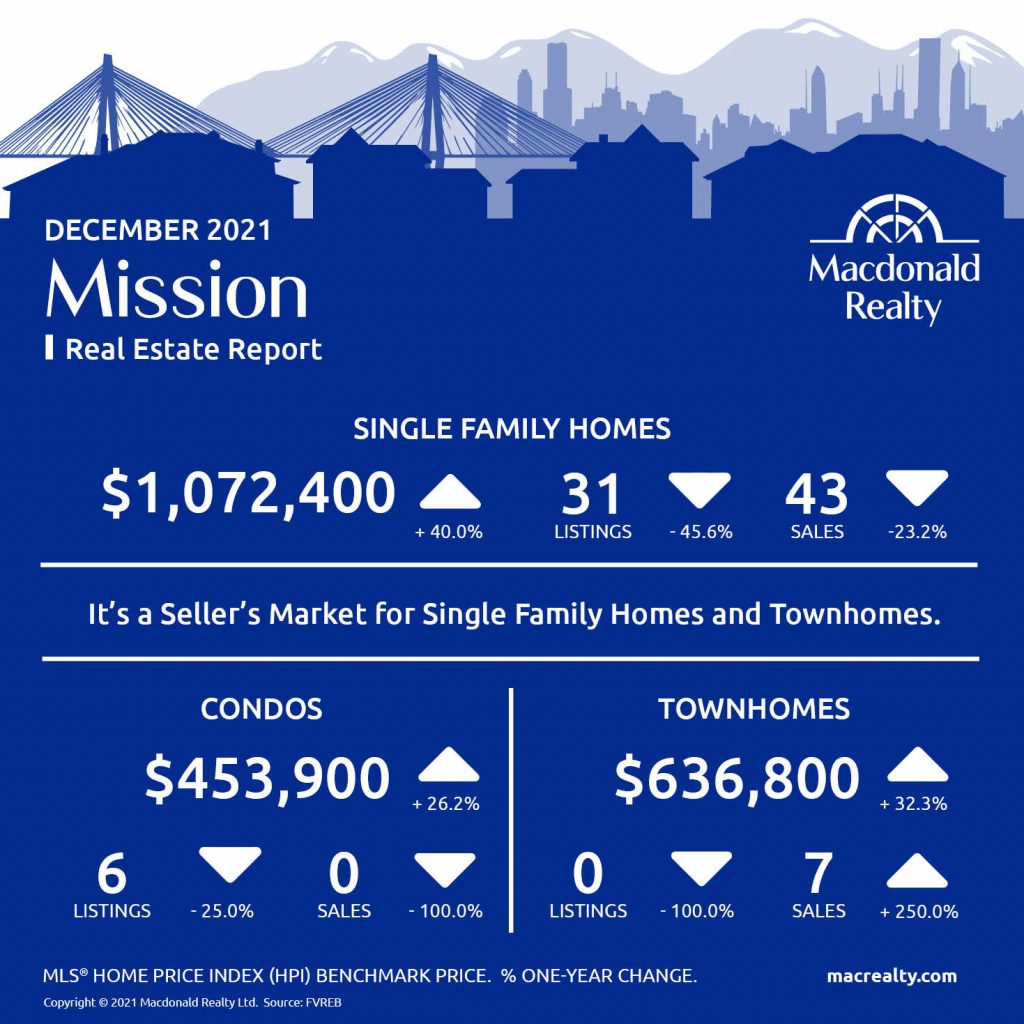
Mission
North Delta

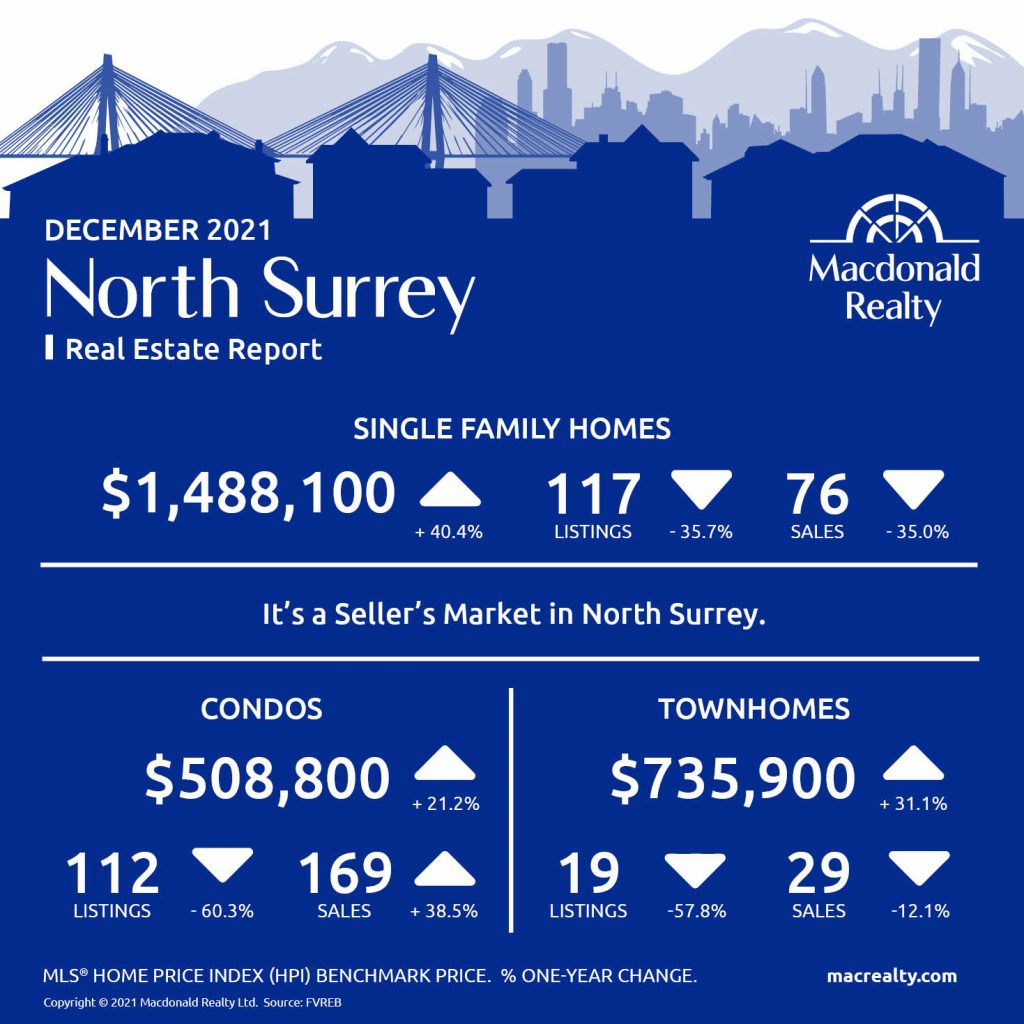
North Surrey
Surrey Central

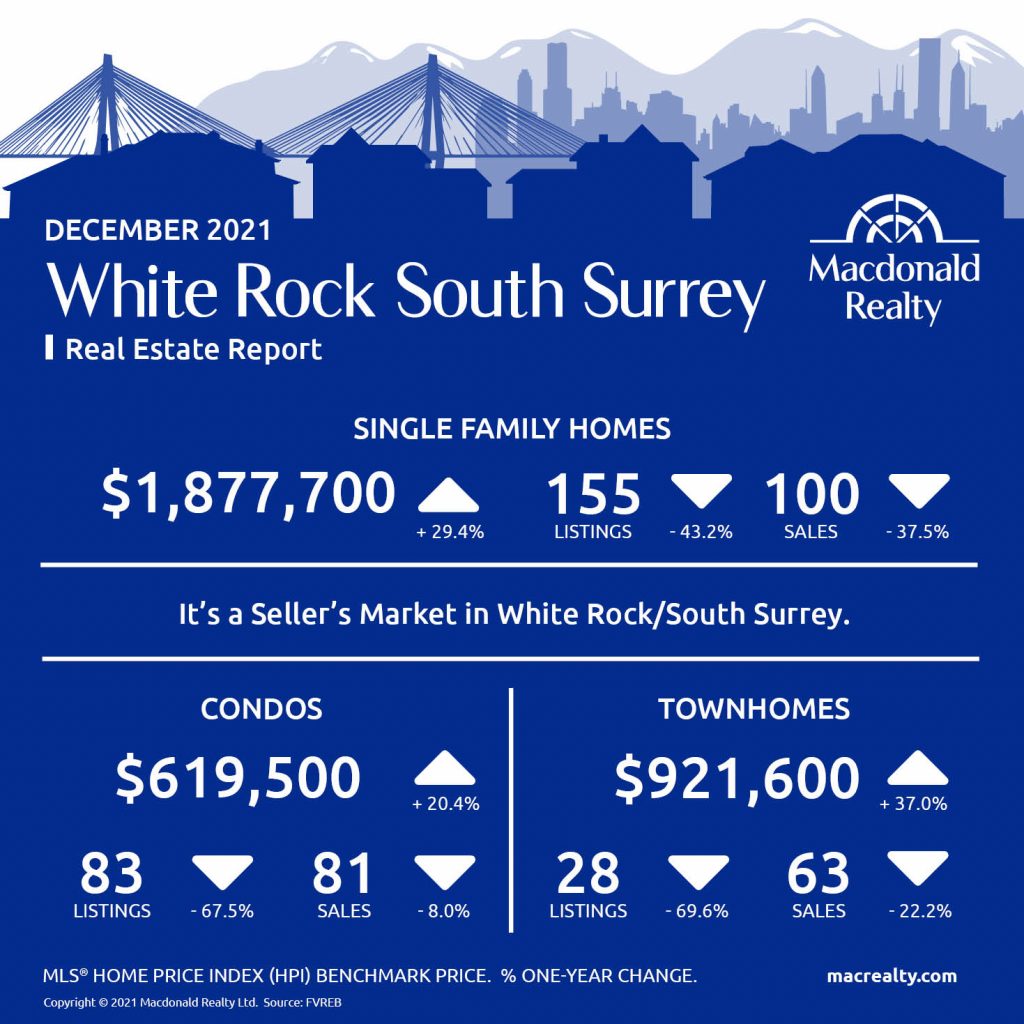
White Rock / South Surrey
Looking for more information about the real estate market in specific neighbourhoods in Surrey, Langley and Fraser Valley?
Macdonald Realty has offices in North Delta, White Rock/South Surrey, and Langley. Please email [email protected] or call 1-877-278-3888 to be matched with a REALTOR® working in your area.
MLS® Home Price Index (HPI) Benchmark Price
Average and median home prices are often misinterpreted, are affected by change in the mix of homes sold, and can swing dramatically from month to month (based on the types and prices of properties that sold in a given month). The MLS® HPI overcomes these shortcomings and uses the concept of a benchmark home, a notional home with common attributes of typical homes in a defined area. Visit www.housepriceindex.ca for more information.
This blog post is based on market data provided by the Fraser Valley Real Estate Board (FVREB) www.fvreb.bc.ca
by Macrealty Marketing Team | Jan 10, 2022 | Market Updates
Here are the latest real estate market statistics from Macdonald Realty on Okanagan listings and sales in December 2021.
Find the infographics by visiting the Facebook Album.
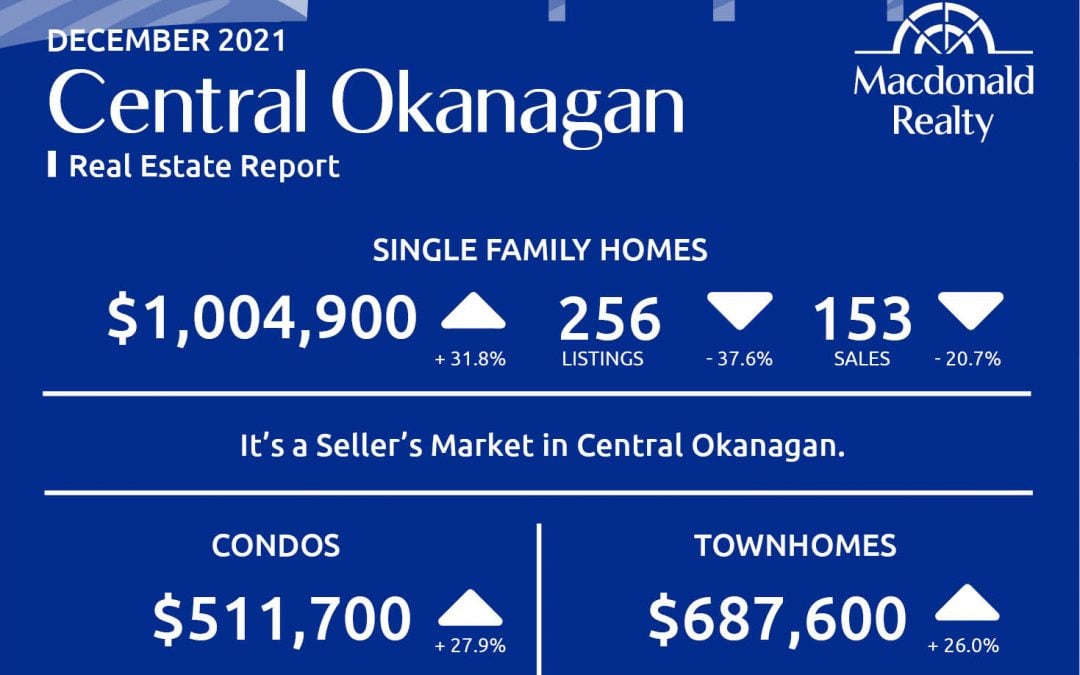
Central Okanagan: Kelowna and Lake Country
There were 256 sales, 153 active listings, and $1,004,900 average sale price for detached homes in the Central Okanagan market, including Kelowna and Lake Country.
The condo market featured 189 sales and 109 active listings at the end of the month. The average sale price was $511,700. Townhome sales were 53, active listings were 83 and the average sale price was $687,600. It’s a seller’s market in Central Okanagan.

North Okanagan: Vernon and surrounding area
In North Okanagan, including Vernon and the surrounding area and the average sale price was $709,400. At the end of the month, there were 63 sales and 92 active listings. There were 13 sales and 40 active listings for condos. The average sale price was $323,300. In comparison, townhomes featured 21 sales, 30 active listings and a $455,200 average sale price. It’s a seller’s market in North Okanagan.

South Okanagan
There were 43 sales, 135 active listings, and $714,700 average sale price for detached homes in the South Okanagan market.
The condo market featured 12 sales and 62 active listings at the end of the month. The average sale price was $380,000. Townhome sales were 14, active listings were 31 and the average sale price was $475,900. It’s a seller’s market for single family homes and townhomes in South Okanagan.

Looking for more information about the real estate market in specific neighbourhoods in Okanagan?
Macdonald Realty has offices in Kelowna and across BC. Please email [email protected] or call 1-877-278-3888 to be matched with a REALTOR® working in your area.
This blog post is based on market data provided by the Association Of Interior REALTORS® https://www.interiorrealtors.ca/.
by Macrealty Marketing Team | Dec 7, 2021 | Market Updates
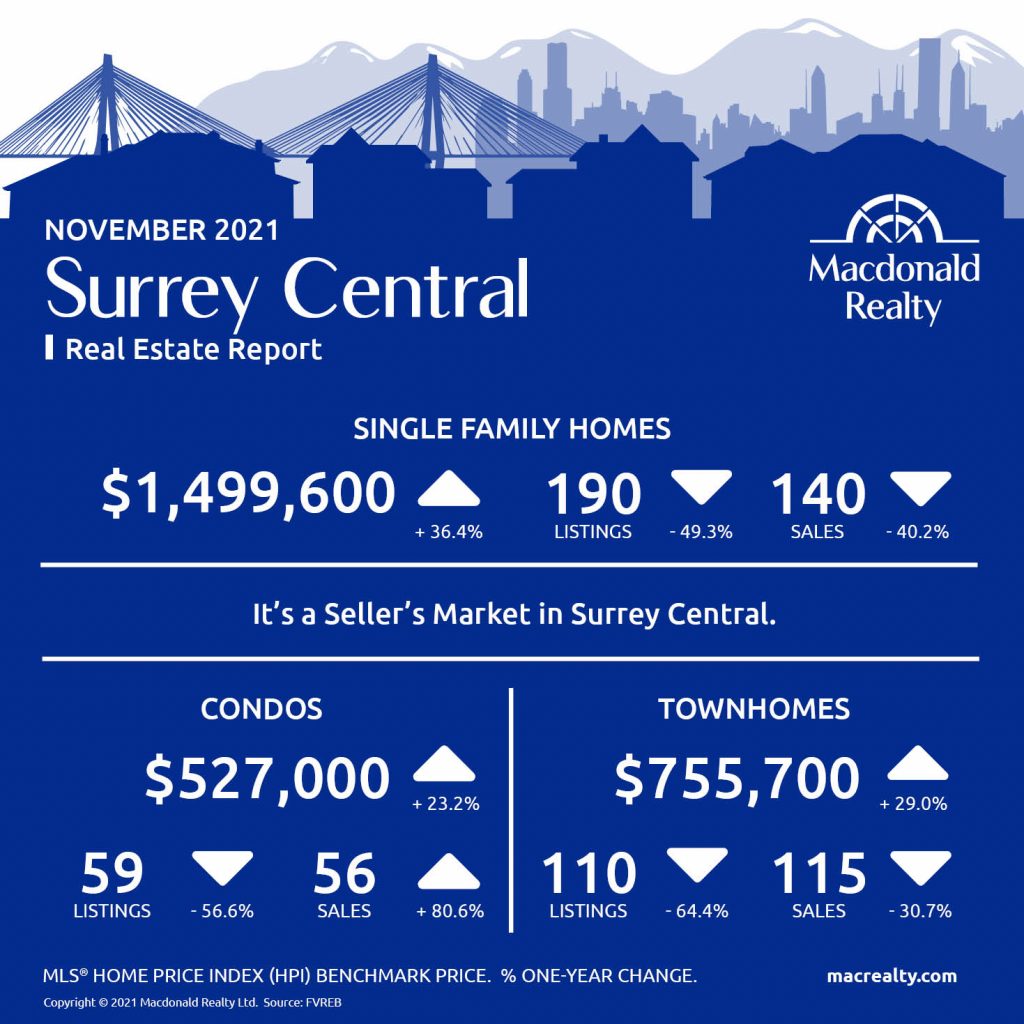
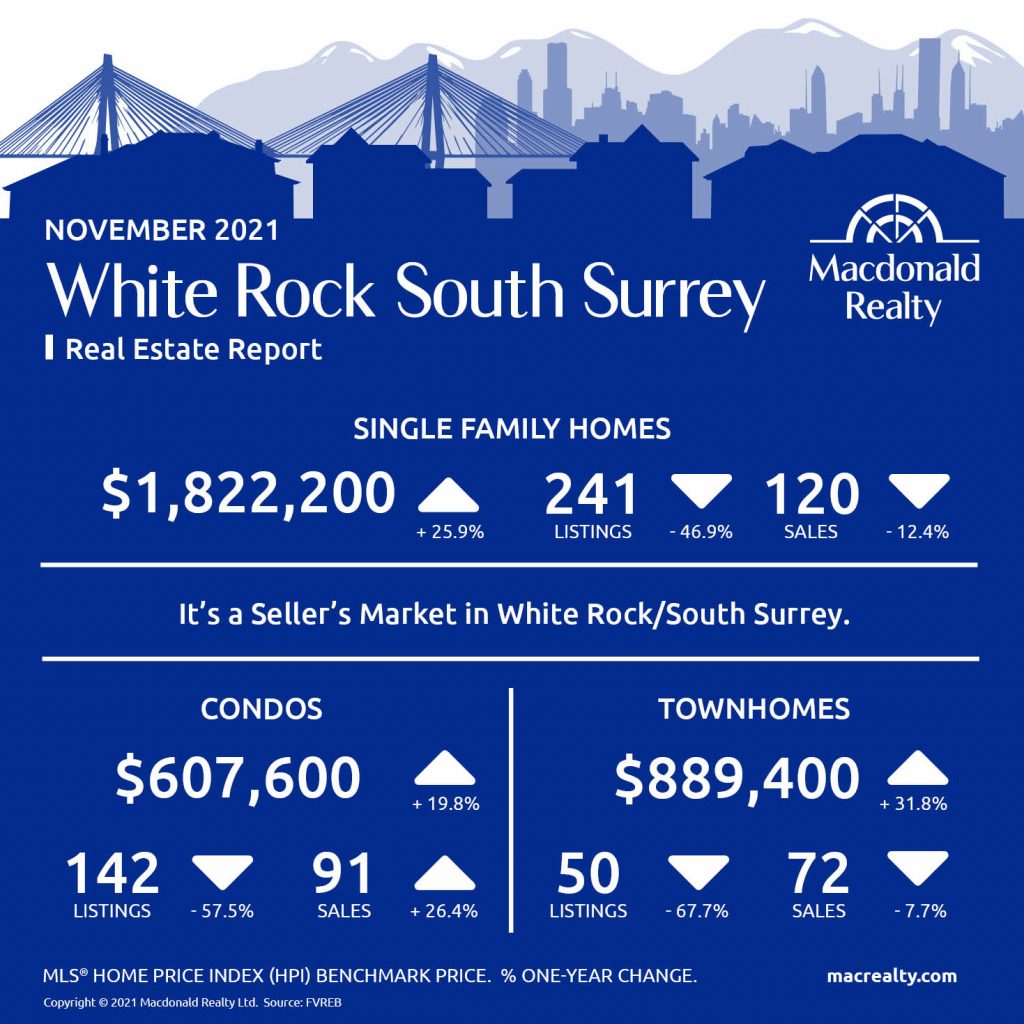
According to the Fraser Valley Real Estate Board, robust demand for Fraser Valley real estate continued in November, with the Fraser Valley Real Estate Board (FVREB) recording the region’s second-highest volume of sales of all property types for the month – second only to November 2020.
In November, the FVREB processed 1,972 sales of all property types on its Multiple Listing Service® (MLS®), a decrease of 9.2 per cent compared to the 2,173 sales in November of last year, and a 1.8 per cent increase month-over-month compared to the 1,938 sales in October.
The Board received 2,096 new listings in November, a 4.2 per cent decrease compared to October’s intake and a decrease of 5.5 per cent compared to the 2,217 new listings received during the same month last year. The 10-year average for November new listings is 1,948, so last month finished slightly above normal levels.
Larry Anderson, President of the Board, said, “Lack of supply continues to be the biggest factor impacting the market. To see sales increase from October to November, even slightly, is un
“This is not an easy market. Buyers and sellers alike are relying on the experience and skill of their REALTOR® to help them navigate a lack of supply, multiple offer situations, and very fast turnaround times.”
November finished with 3,048 active listings, a decrease of 11.6 per cent compared to October and a decrease of 47.9 per cent year-over-year, and an 11.6 per cent decrease compared to last month. In a typical November market, inventory levels in the Fraser Valley would be more than double.
Baldev Gill, Chief Executive Officer of the Board said, “We’re seeing a number of factors at play, including historically low interest rates fueling purchases, with buyers aware that rates are likely to increase next year. “Our province has seen a strong economic recovery in most sectors through this pandemic, and this strength bolsters home purchasing decisions.”
For the Fraser Valley region, the average number of days to sell an apartment in November was 24 days, and 16 days for townhomes. Single family detached homes remained on market for an average of 24 days before selling.
Find all the infographics related to the November Market Statistics by visiting the Facebook Album.
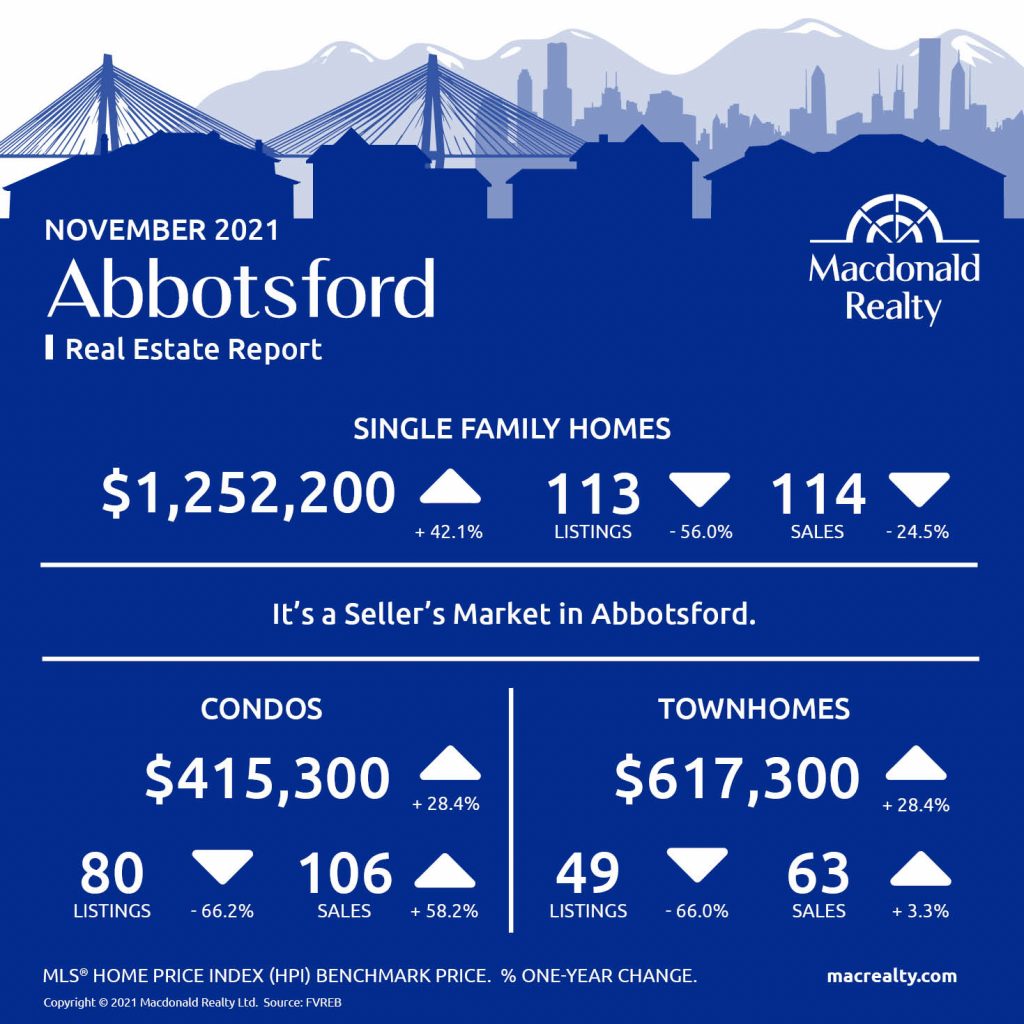
Abbotsford
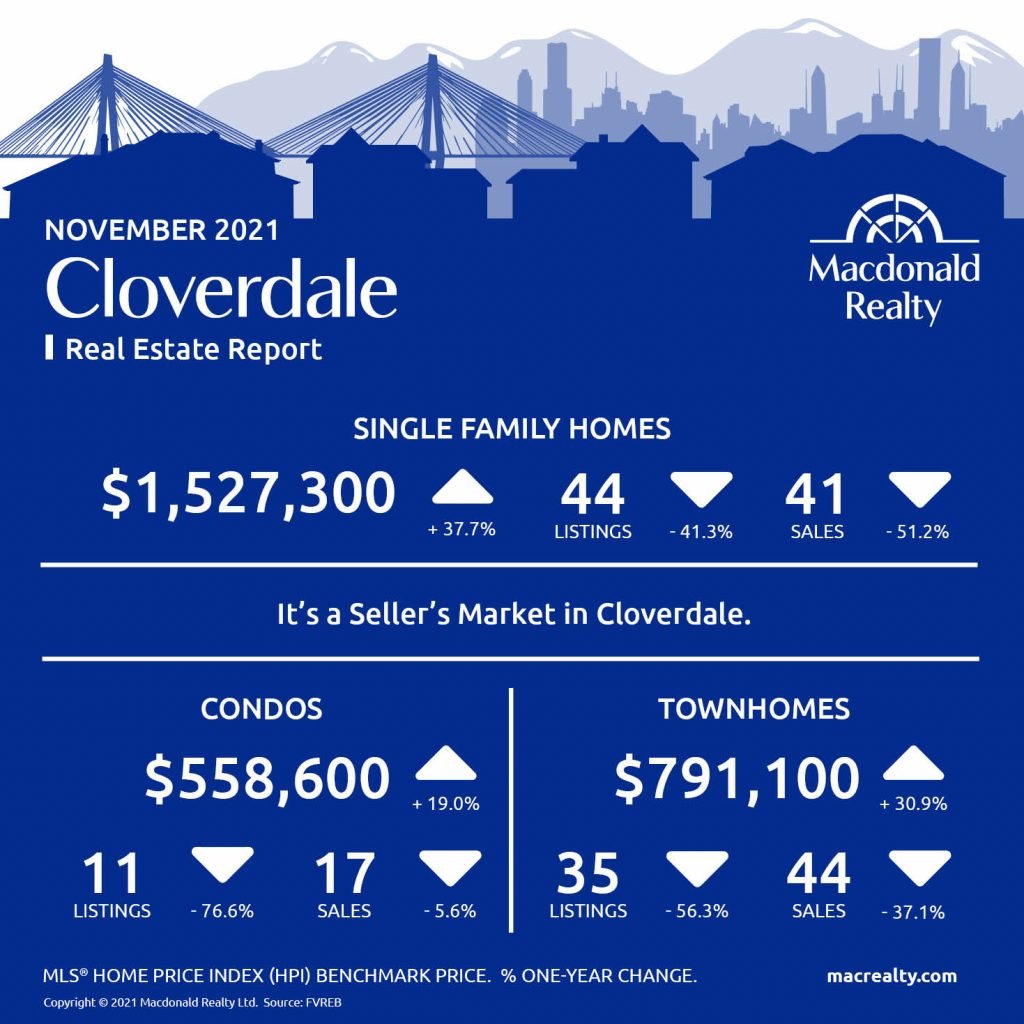
Cloverdale
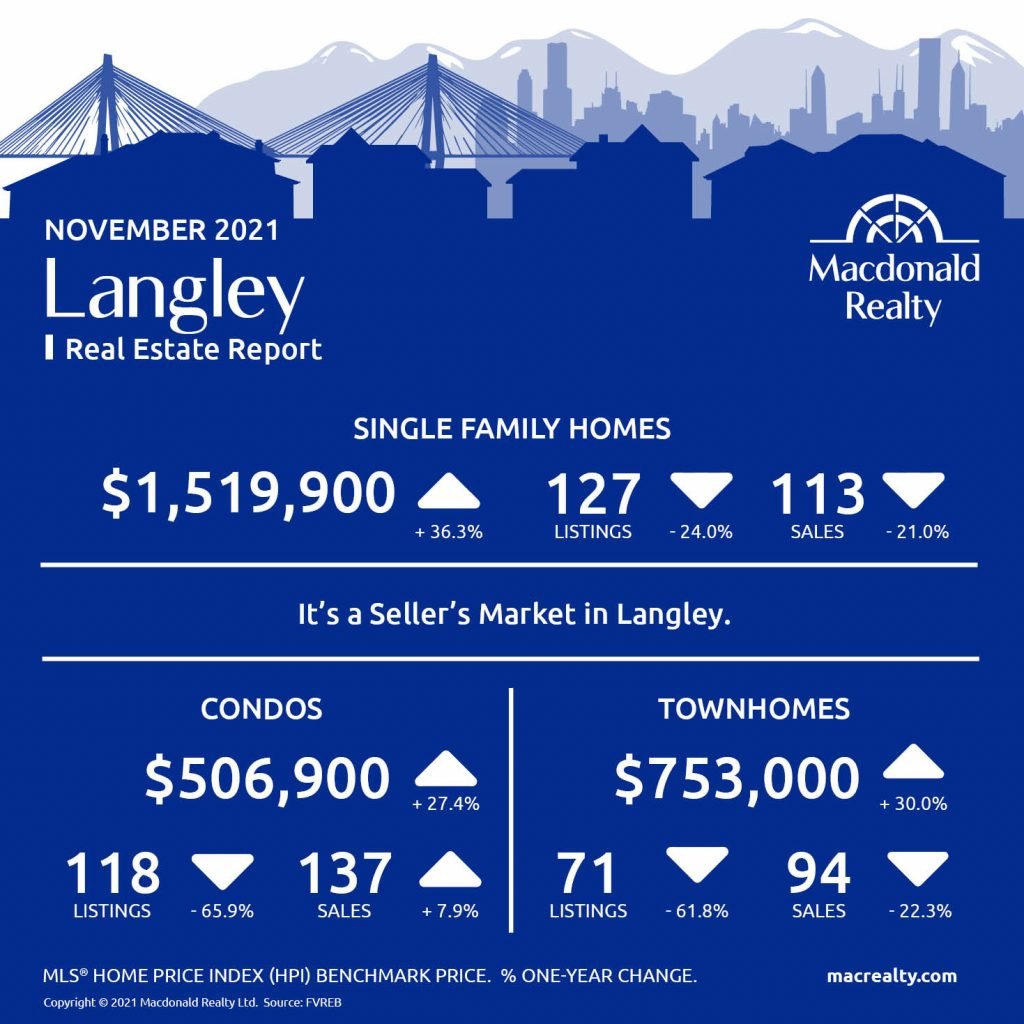
Langley
Mission

North Delta

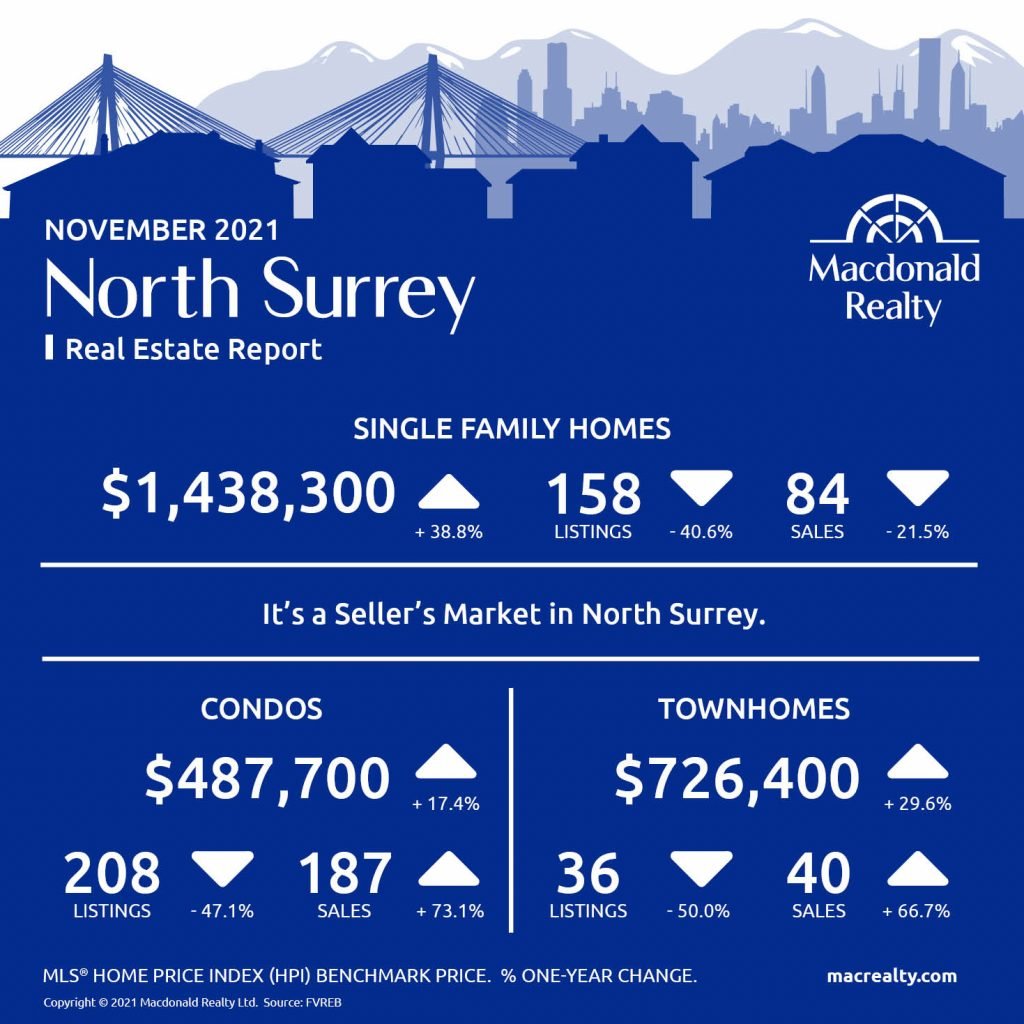
North Surrey
Surrey Central
White Rock / South Surrey
Looking for more information about the real estate market in specific neighbourhoods in Surrey, Langley and Fraser Valley?
Macdonald Realty has offices in North Delta, White Rock/South Surrey, and Langley. Please email [email protected] or call 1-877-278-3888 to be matched with a REALTOR® working in your area.
MLS® Home Price Index (HPI) Benchmark Price
Average and median home prices are often misinterpreted, are affected by change in the mix of homes sold, and can swing dramatically from month to month (based on the types and prices of properties that sold in a given month). The MLS® HPI overcomes these shortcomings and uses the concept of a benchmark home, a notional home with common attributes of typical homes in a defined area. Visit www.housepriceindex.ca for more information.
This blog post is based on market data provided by the Fraser Valley Real Estate Board (FVREB) www.fvreb.bc.ca
by Macrealty Marketing Team | Dec 7, 2021 | Market Updates
Here are the latest real estate market statistics from Macdonald Realty on Greater Victoria, Parksville/Qualicum, and Nanaimo listings and sales in November 2021. Find all the infographics related to the November Market Statistics by visiting the Facebook Album.
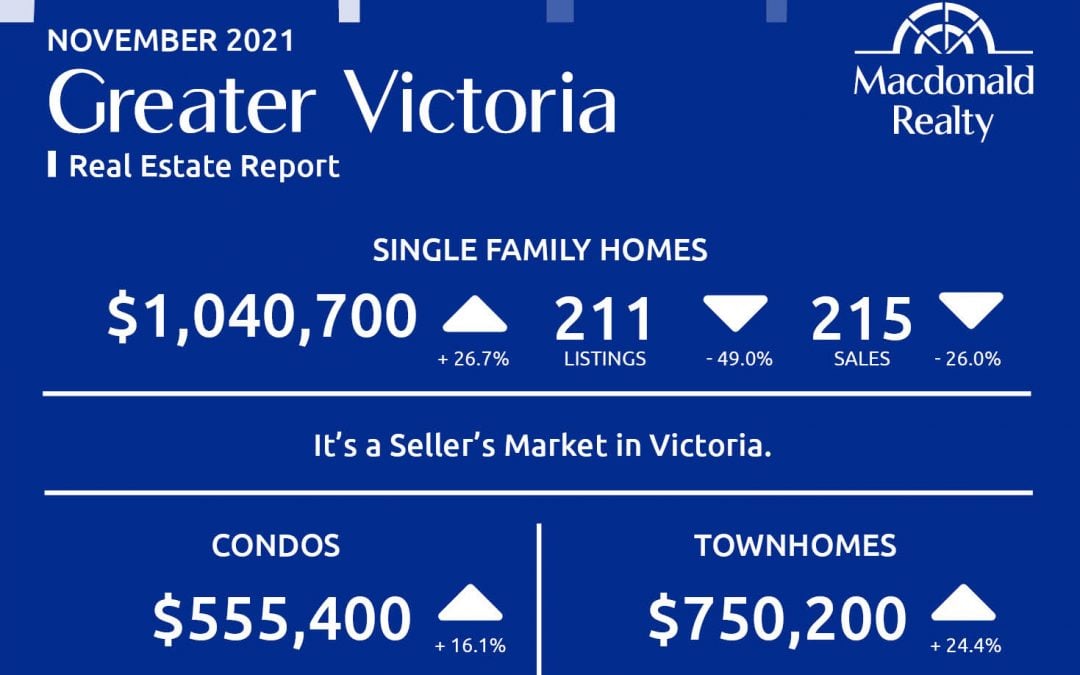
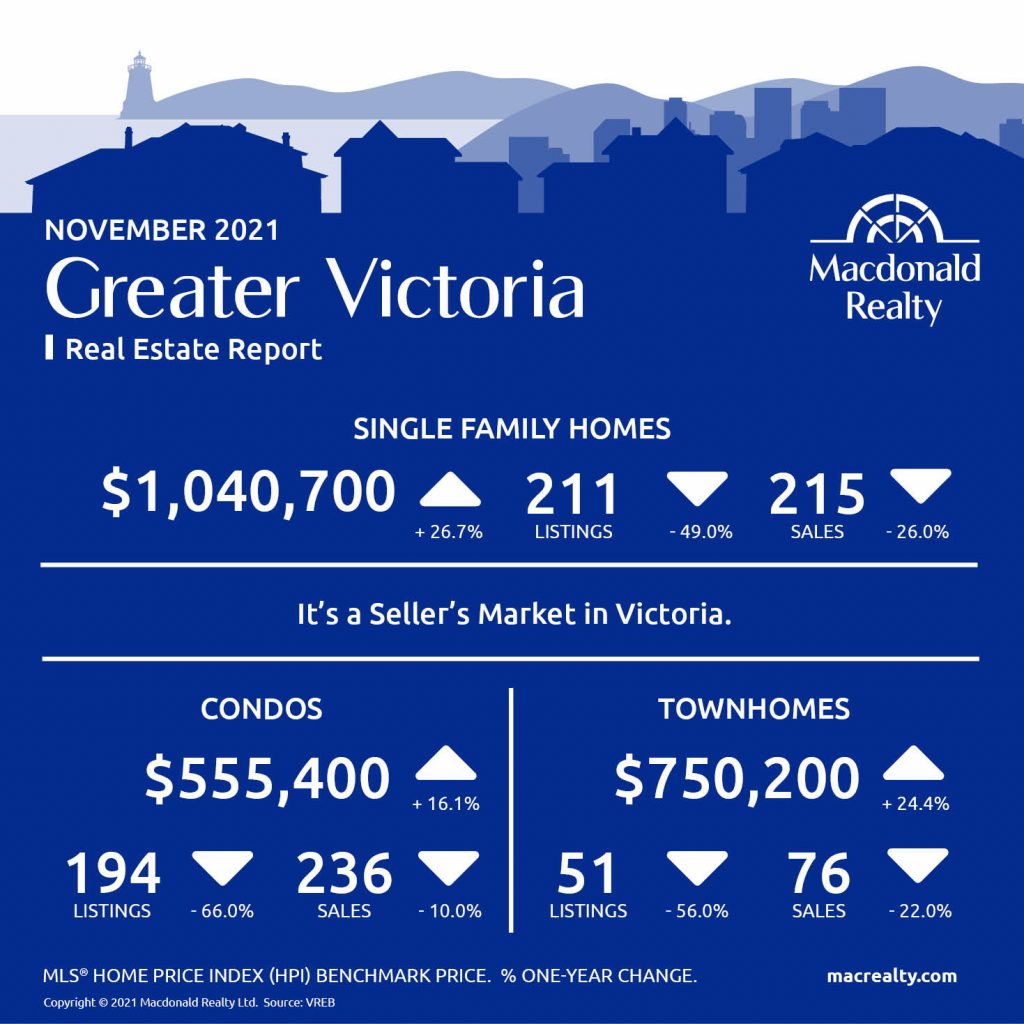
According to the Victoria Real Estate Board, there is no change on the horizon for the Victoria real estate market.
A total of 653 properties sold in the Victoria Real Estate Board region this November, 17.9 per cent fewer than the 795 properties sold in November 2020 and 12.3 per cent fewer than the previous month of October. 236 condominiums sold, 5.2 per cent fewer than in the previous month of October. 276 single family homes sold, 18.6 per cent fewer than in the previous month of October.
“Strong demand for housing in our community continues to exceed the ultra-low number of listings of homes available for sale,” said Victoria Real Estate Board President David Langlois. “This demand creates competition and pressure on pricing and we continue to see home values notch up. At this moment in time, there are fewer than 600 residential properties for sale in our market.”
Greater Victoria
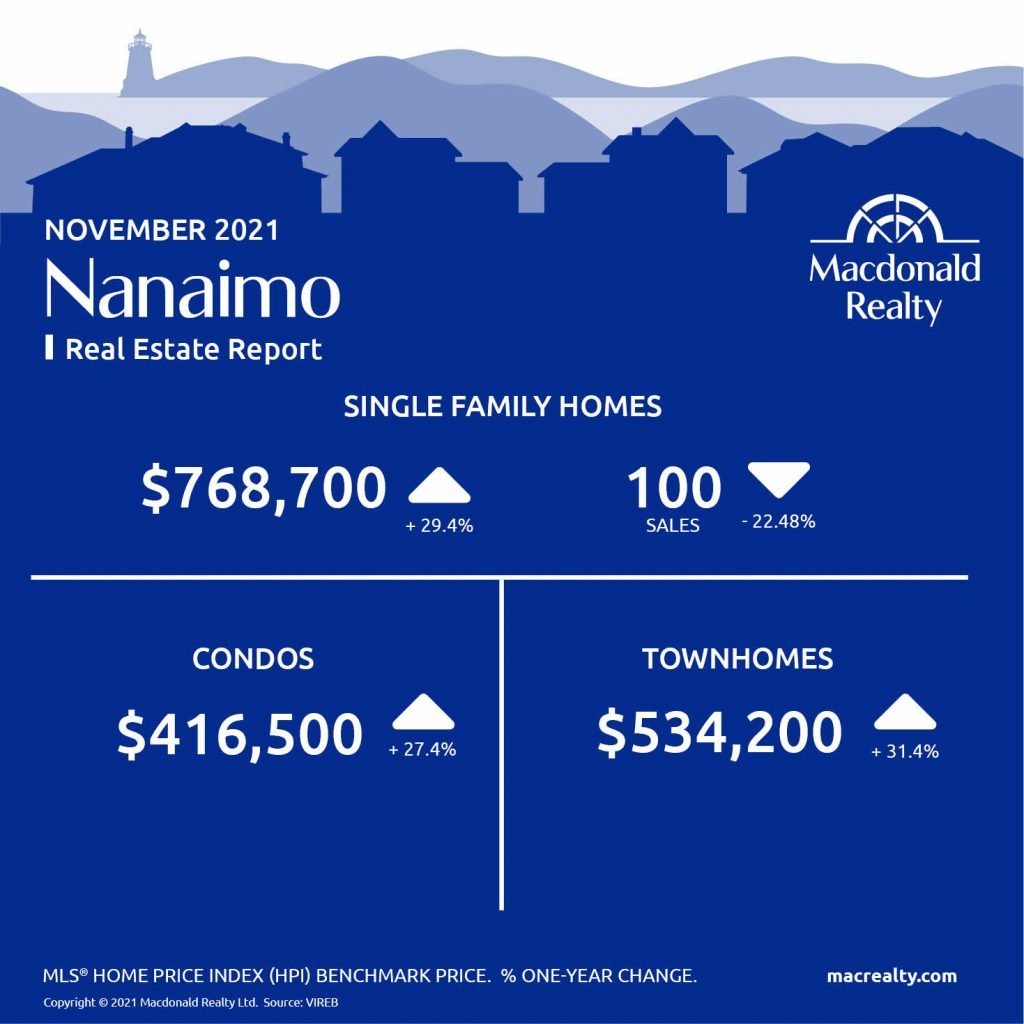
Nanaimo
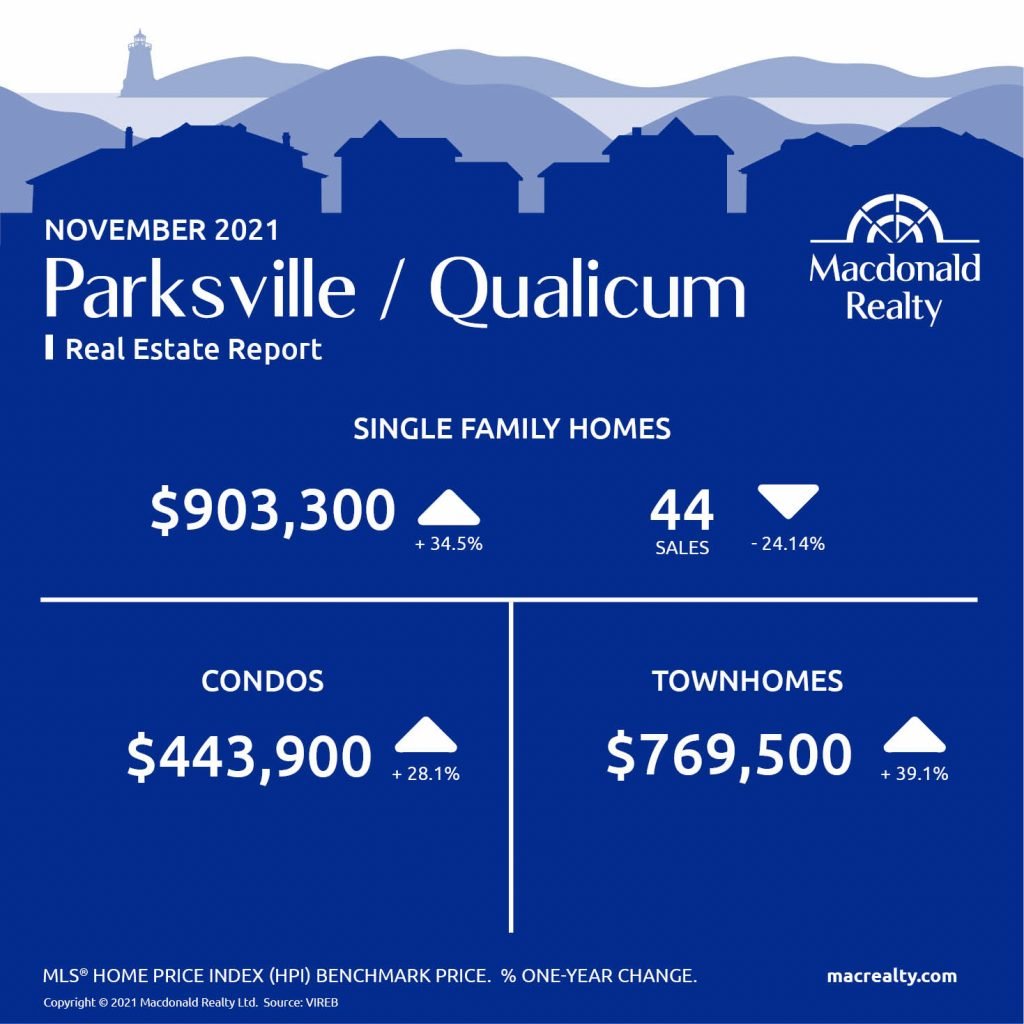
Parksville / Qualicum
Looking for more information about the real estate market in specific neighbourhoods in Victoria, Parksville, Nanaimo, Vancouver Island and the Gulf Islands?
Macdonald Realty has offices in downtown Victoria, Sidney, Parksville and Salt Spring Island. Please email [email protected] or call 1-877-278-3888 to be matched with a REALTOR® working in your area.
MLS® Home Price Index (HPI) Benchmark Price
Average and median home prices are often misinterpreted, are affected by change in the mix of homes sold, and can swing dramatically from month to month (based on the types and prices of properties that sold in a given month). The MLS® HPI overcomes these shortcomings and uses the concept of a benchmark home, a notional home with common attributes of typical homes in a defined area. Visit www.housepriceindex.ca for more information.
This blog post is based on market data provided by the Victoria Real Estate Board (VREB) www.vreb.org and the Vancouver Island Real Estate Board (VIREB) www.vireb.com. Market data from the VIREB includes listings and sales in Campbell River, Comox Valley, Cowichan Valley Nanaimo, Parksville/Qualicum, Port Alberni/West, North Island, and the Islands.
by Macrealty Marketing Team | Dec 7, 2021 | Market Updates
Here are the latest real estate market statistics from Macdonald Realty on Okanagan listings and sales in November 2021.
Find the infographics by visiting the Facebook Album.
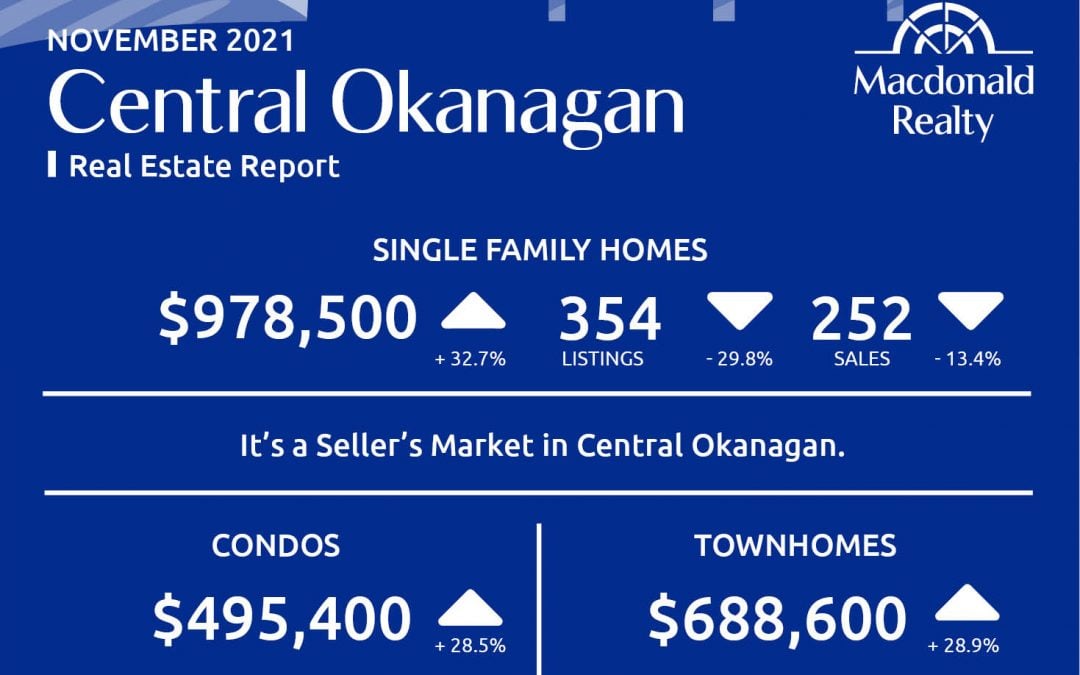
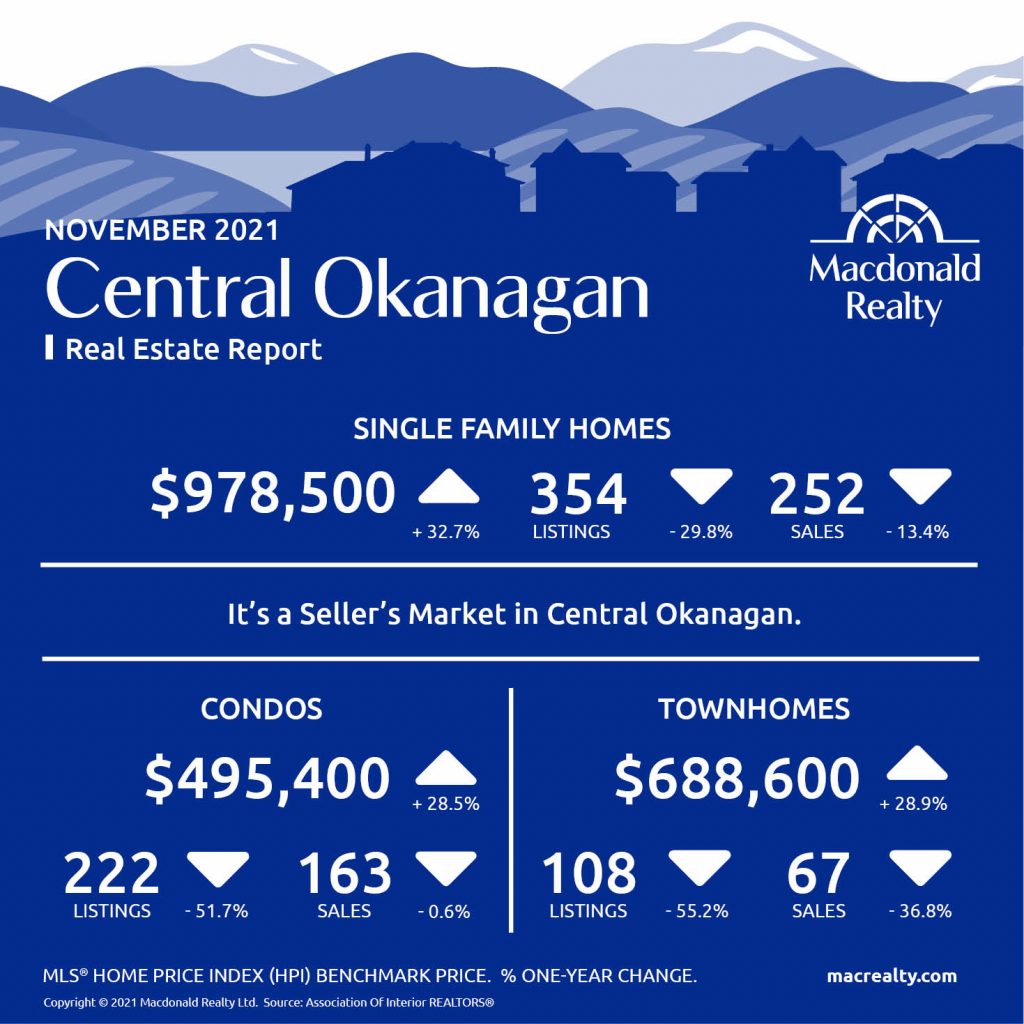
Central Okanagan: Kelowna and Lake Country
There were 252 sales, 354 active listings, and $978,500 average sale price for detached homes in the Central Okanagan market, including Kelowna and Lake Country.
The condo market featured 163 sales and 222 active listings at the end of the month. The average sale price was $495,400. Townhome sales were 67, active listings were 108 and the average sale price was $688,600. It’s a seller’s market in Central Okanagan.
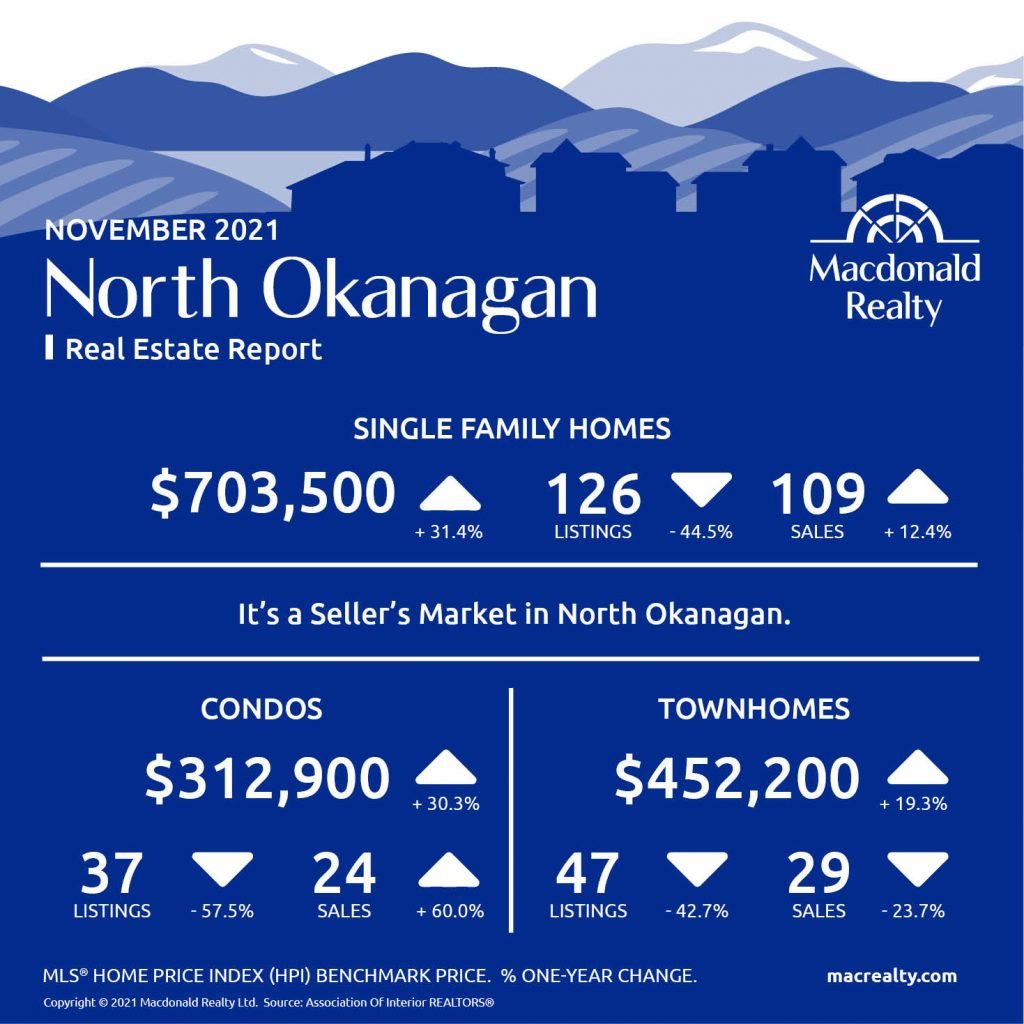
North Okanagan: Vernon and surrounding area
In North Okanagan, including Vernon and the surrounding area and the average sale price was $703,500. At the end of the month, there were 109 sales and 126 active listings.
There were 24 sales and 37 active listings for condos. The average sale price was $312,900.
In comparison, townhomes featured 29 sales, 47 active listings and a $452,200 average sale price.
It’s a seller’s market in North Okanagan.
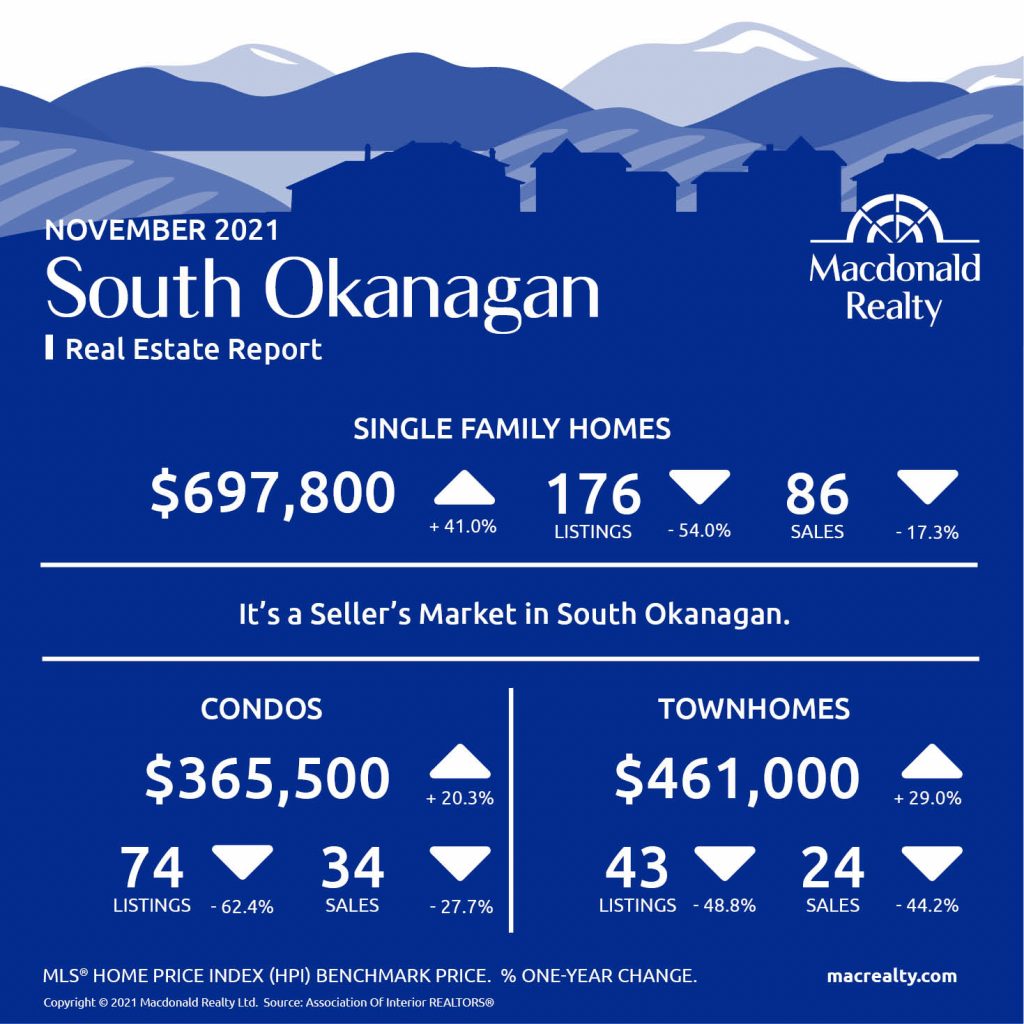
South Okanagan
There were 86 sales, 176 active listings, and $697,800 average sale price for detached homes in the South Okanagan market.
The condo market featured 34 sales and 74 active listings at the end of the month. The average sale price was $365,500.
Townhome sales were 24, active listings were 43 and the average sale price was $461,000.
It’s a seller’s market in South Okanagan.
Looking for more information about the real estate market in specific neighbourhoods in Okanagan?
Macdonald Realty has offices in Kelowna and across BC. Please email [email protected] or call 1-877-278-3888 to be matched with a REALTOR® working in your area.
This blog post is based on market data provided by the Association Of Interior REALTORS® https://www.interiorrealtors.ca/.
by Macrealty Marketing Team | Dec 7, 2021 | Market Updates
Here are the latest real estate market statistics from Macdonald Realty on Squamish, Whistler, and Sunshine Coast listings and sales in November 2021.
Find all the infographics related to the November Market Statistics by visiting the Facebook Album.
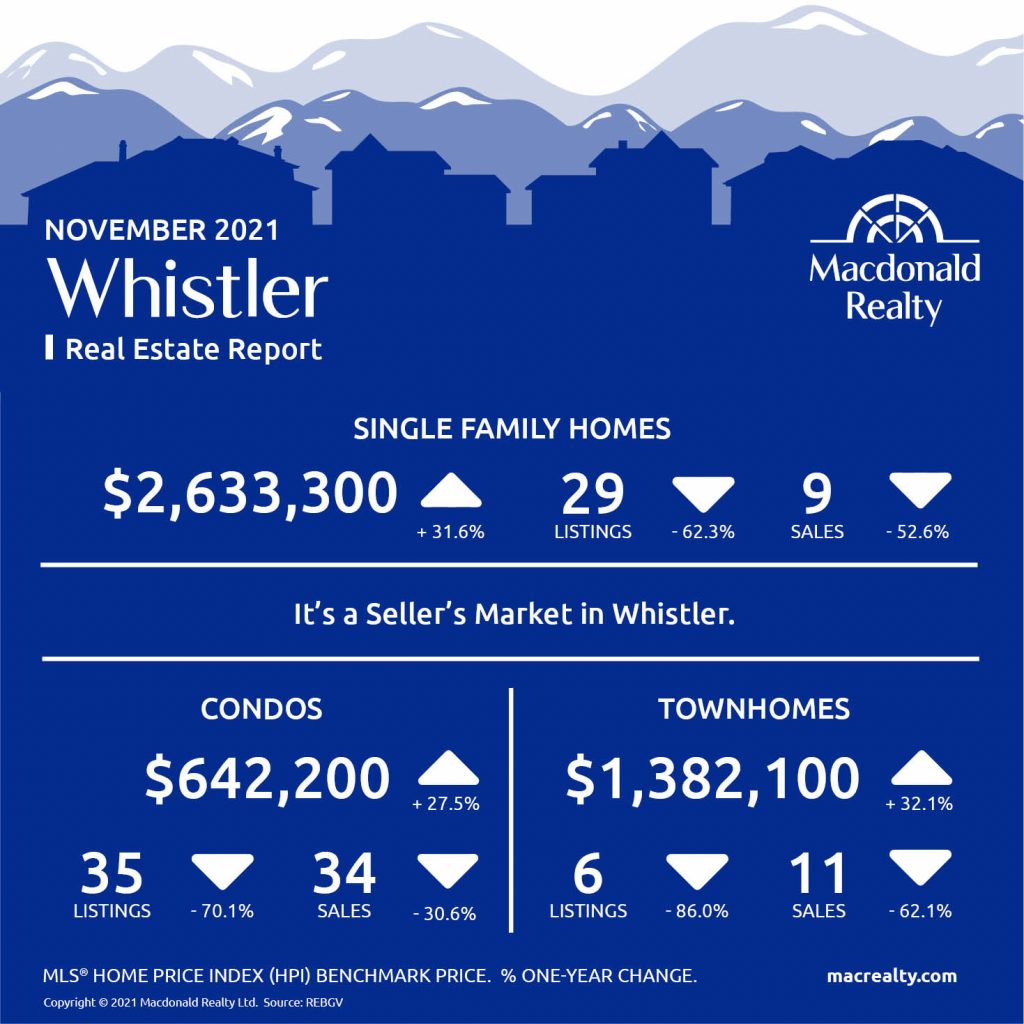
Whistler
In November 2021, there were 9 sales of detached homes and 29 active listings. The benchmark sale price was $2,633,300.
The condo market had 34 sales and 35 active listings at the end of the month. The benchmark sale price was $642,200.
The townhome market had 11 sales and, the active listings were 6. The benchmark sale price was $1,382,100.
It’s a Seller’s market in Whistler.
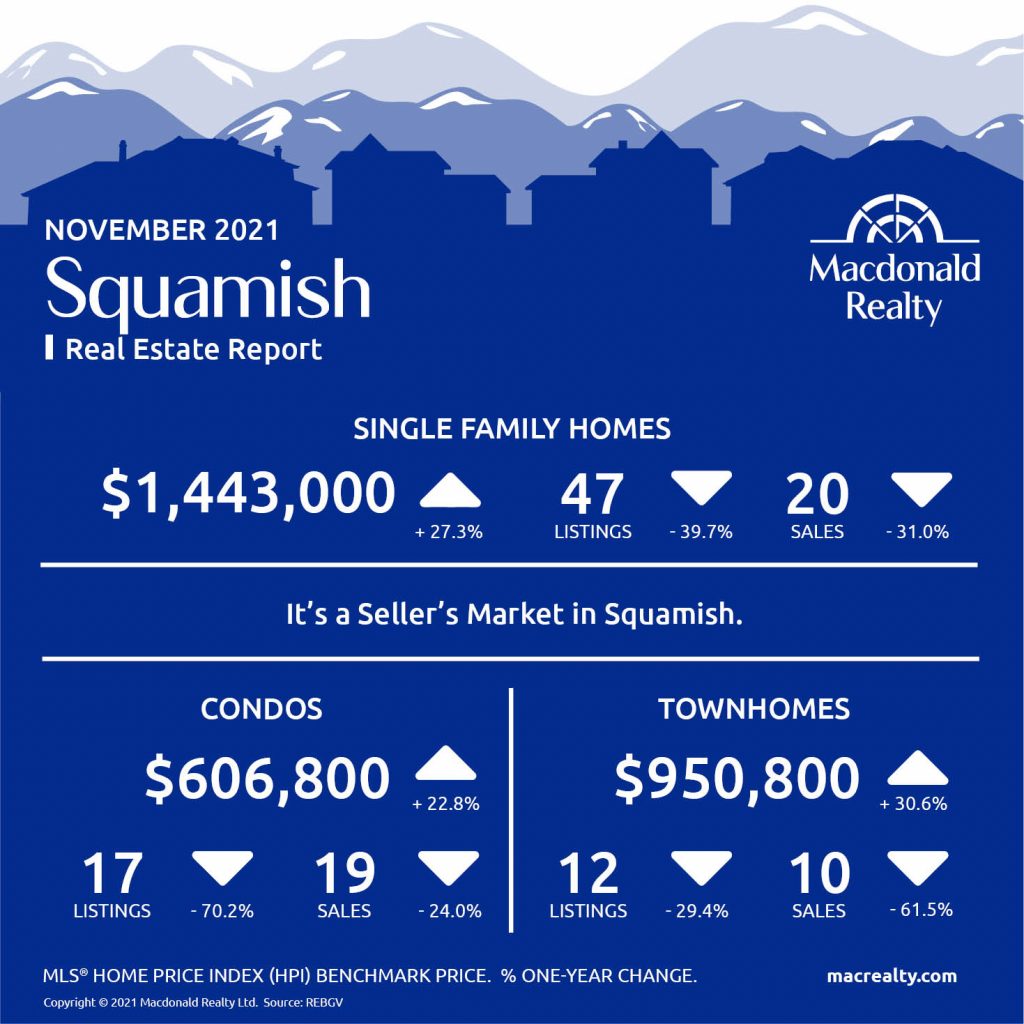
Squamish
In November 2021, there were 20 sales of detached homes and 47 active listings. The benchmark sale price was $1,443,000.
The condo market had 19 sales and 17 active listings at the end of the month. The benchmark sale price was $606,800.
The townhome market had 10 sales and, the active listings were 12. The benchmark sale price was $950,800.
It’s a Seller’s Market in Squamish.
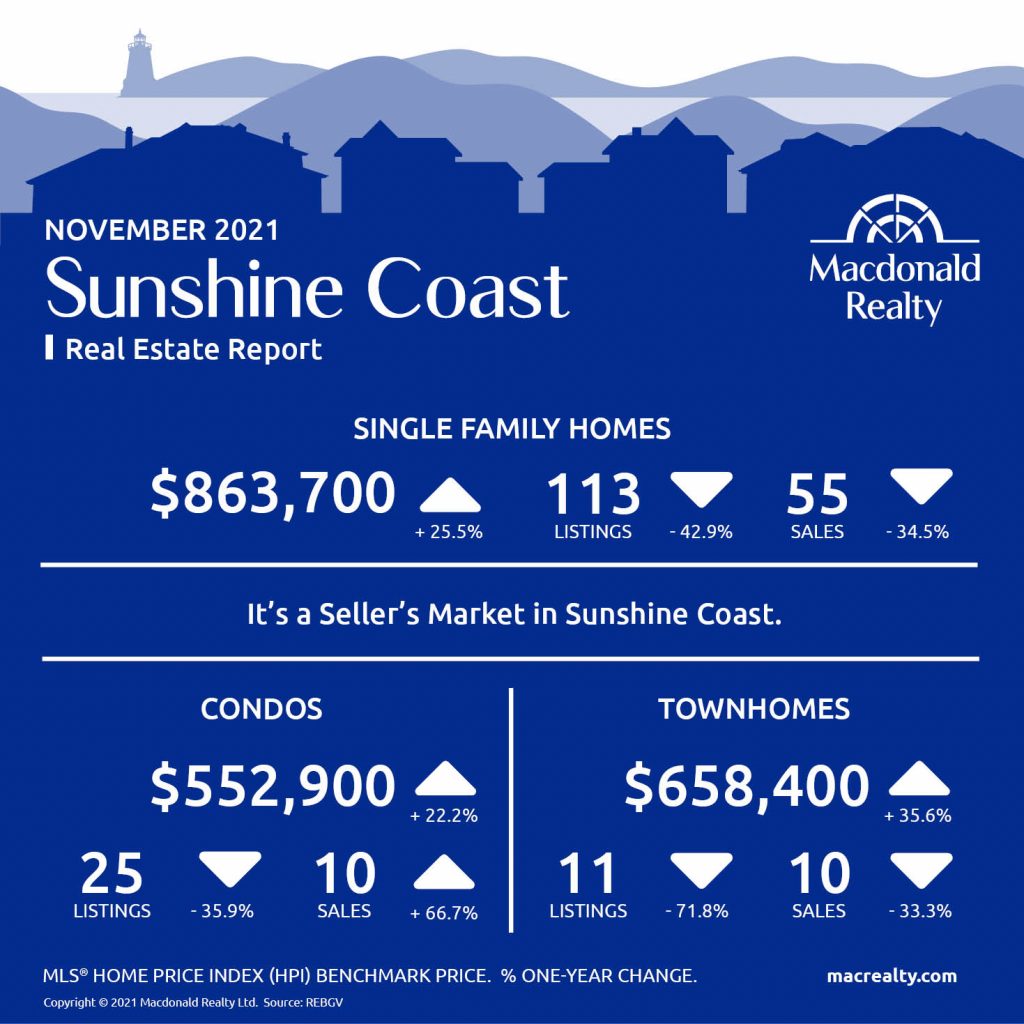
Sunshine Coast
In November 2021, there were 55 sales of detached homes and 113 active listings. The benchmark sale price was $863,700.
The condo market had 10 sales and 25 active listings at the end of the month.
The townhome market had 10 sales and, the active listings were 11.
It’s a Seller’s market on Sunshine Coast.
Looking for more information about the real estate market in specific neighbourhoods in Squamish, Whistler, and Sunshine Coast? Macdonald Realty has offices in Squamish, Whistler, and Sunshine Coast. Please email [email protected] or call 1-877-278-3888 to be matched with a REALTOR® working in your area.
MLS® Home Price Index (HPI) Benchmark Price
Average and median home prices are often misinterpreted, are affected by change in the mix of homes sold, and can swing dramatically from month to month (based on the types and prices of properties that sold in a given month). The MLS® HPI overcomes these shortcomings and uses the concept of a benchmark home, a notional home with common attributes of typical homes in a defined area. Visit www.housepriceindex.ca for more information.
This blog post is based on market data provided by the Real Estate Board of Greater Vancouver (REBGV) www.rebgv.org

