by Macrealty Marketing Team | Mar 8, 2022 | Market Updates
Here are the latest real estate market statistics from Macdonald Realty on Greater Victoria, Saanich Peninsula, Parksville/Qualicum, and Nanaimo listings and sales in February 2022. Find all the infographics related to the February Market Statistics by visiting the Facebook Album.
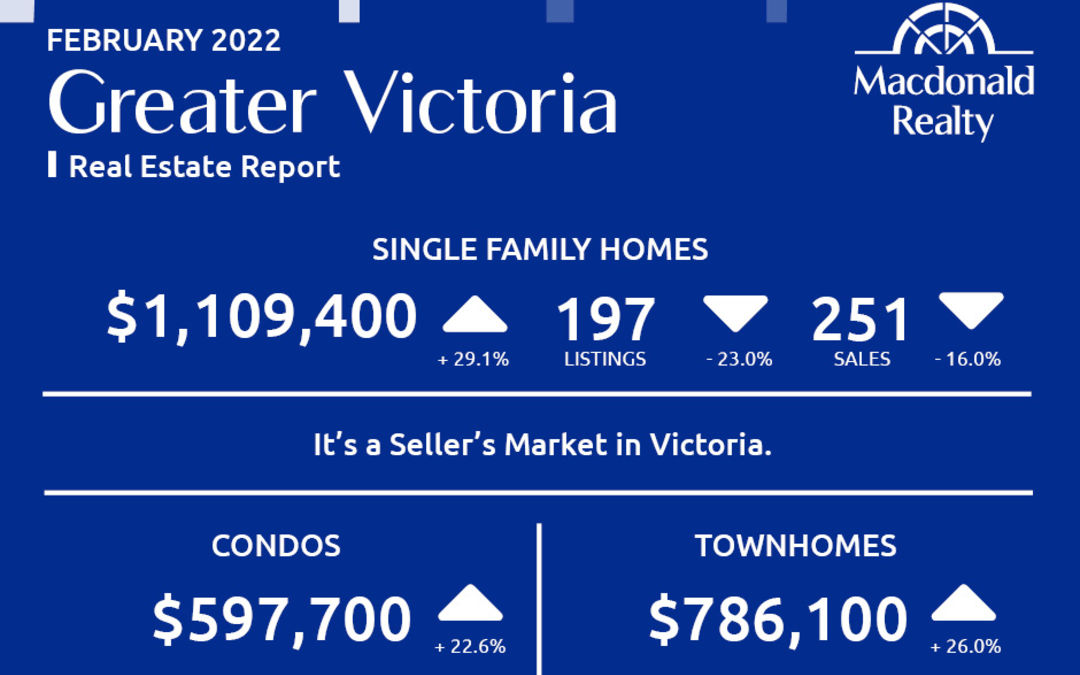
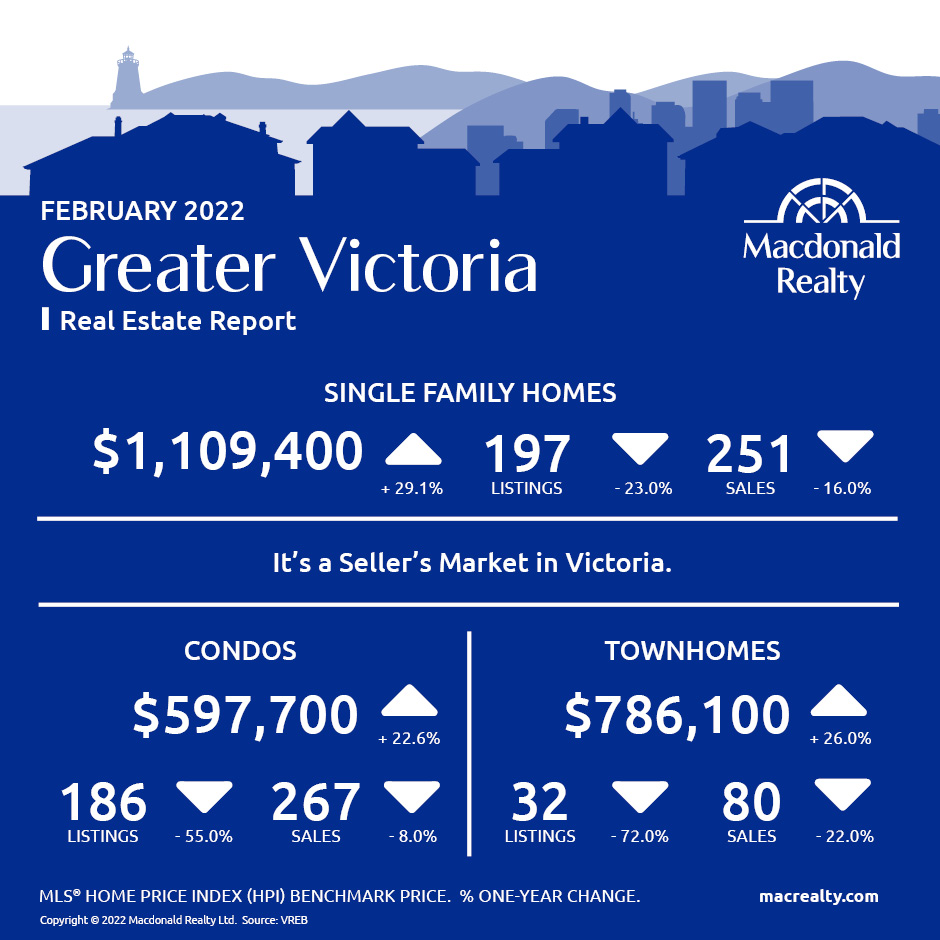
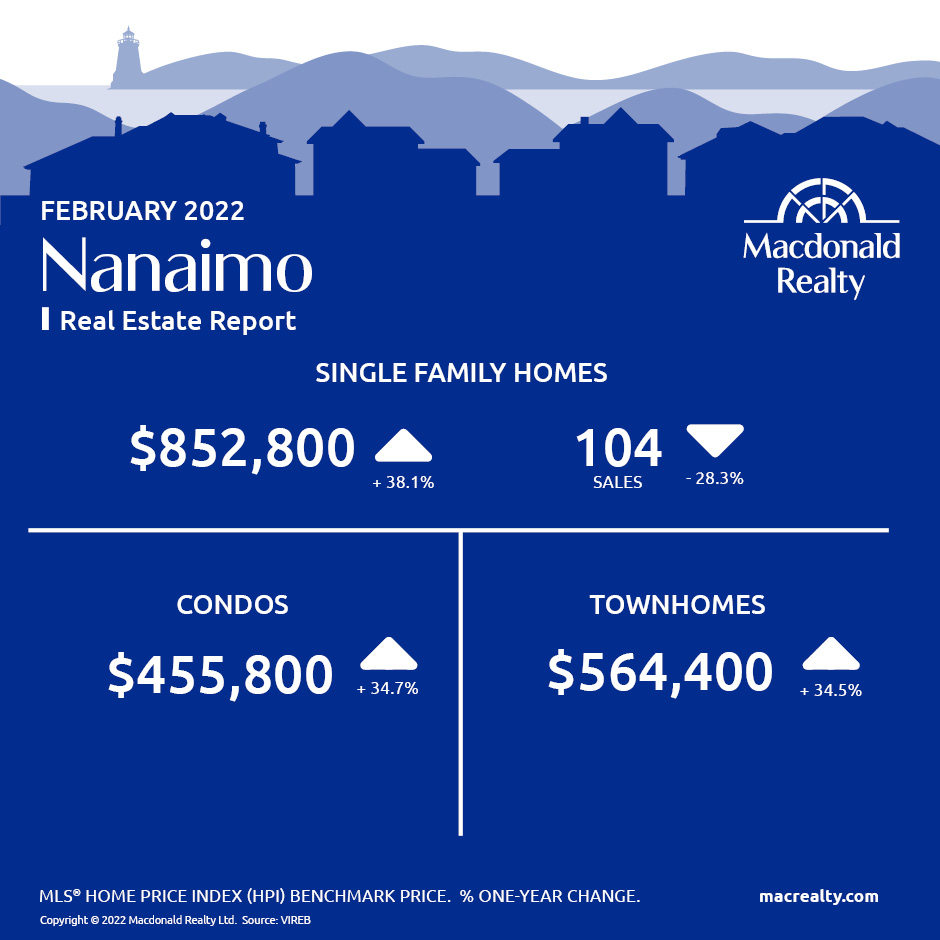
A total of 718 properties sold in the Victoria Real Estate Board region this February, 16.8 per cent fewer than the 863 properties sold in February 2021 but a 51.5 per cent increase from January 2021. Sales of condominiums were down 7.9 per cent from February 2021 with 267 units sold. Sales of single family homes decreased 20.8 per cent from February 2021 with 309 sold.
“It was heartening this month to see some more listings come to market in February,” said 2022 Victoria Real Estate Board President Karen Dinnie-Smyth. “However, inventory levels remain at record lows and without a strong government focus on increasing supply, buyers will continue to face escalating prices and difficult market conditions.”
Greater Victoria
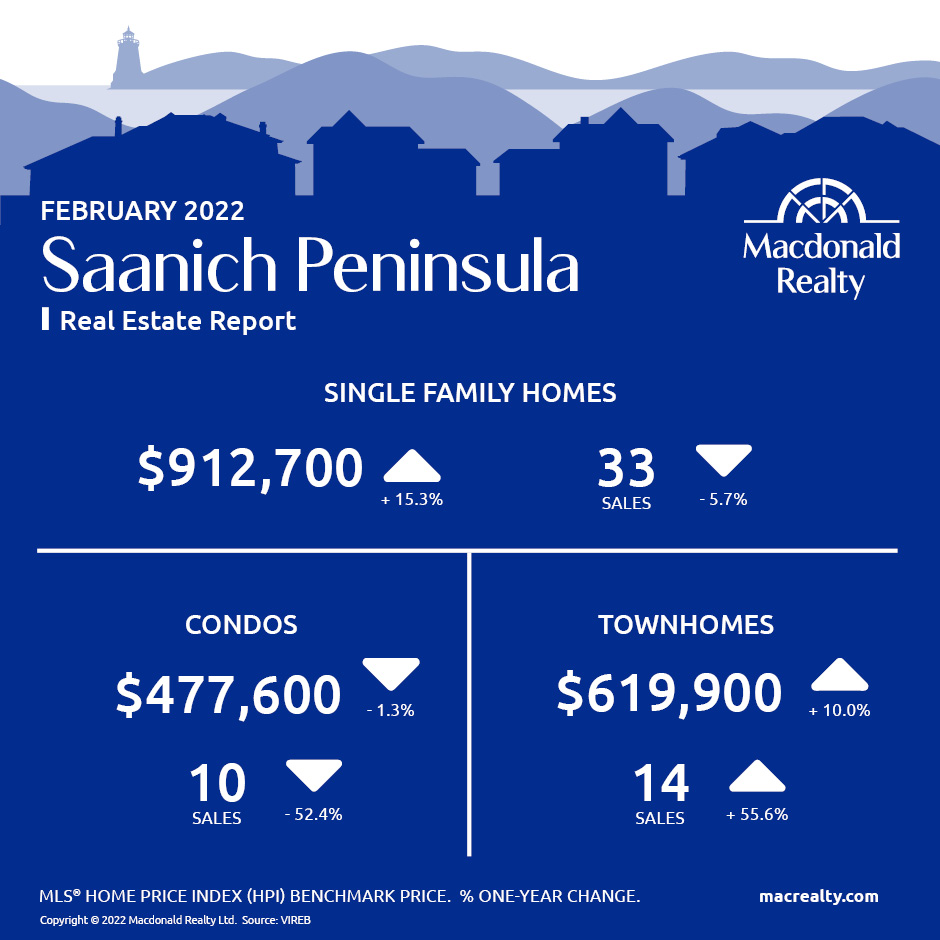
Saanich Peninsula
Nanaimo
Parksville / Qualicum

Looking for more information about the real estate market in specific neighbourhoods in Victoria, Saanich Peninsula, Parksville, Nanaimo, Vancouver Island and the Gulf Islands?
Macdonald Realty has offices in downtown Victoria, Sidney, Parksville and Salt Spring Island. Please email [email protected] or call 1-877-278-3888 to be matched with a REALTOR® working in your area.
MLS® Home Price Index (HPI) Benchmark Price
Average and median home prices are often misinterpreted, are affected by change in the mix of homes sold, and can swing dramatically from month to month (based on the types and prices of properties that sold in a given month). The MLS® HPI overcomes these shortcomings and uses the concept of a benchmark home, a notional home with common attributes of typical homes in a defined area. Visit www.housepriceindex.ca for more information.
This blog post is based on market data provided by the Victoria Real Estate Board (VREB) www.vreb.org and the Vancouver Island Real Estate Board (VIREB) www.vireb.com. Market data from the VIREB includes listings and sales in Campbell River, Comox Valley, Cowichan Valley Nanaimo, Parksville/Qualicum, Port Alberni/West, North Island, and the Islands.
by Macrealty Marketing Team | Mar 7, 2022 | Market Updates
March 2022 – Lower Mainland Monthly Update (REBGV & FVREB)
Metro Vancouver sales are moderate in February but still above 10 year average, and standing inventory continues to be the biggest challenge
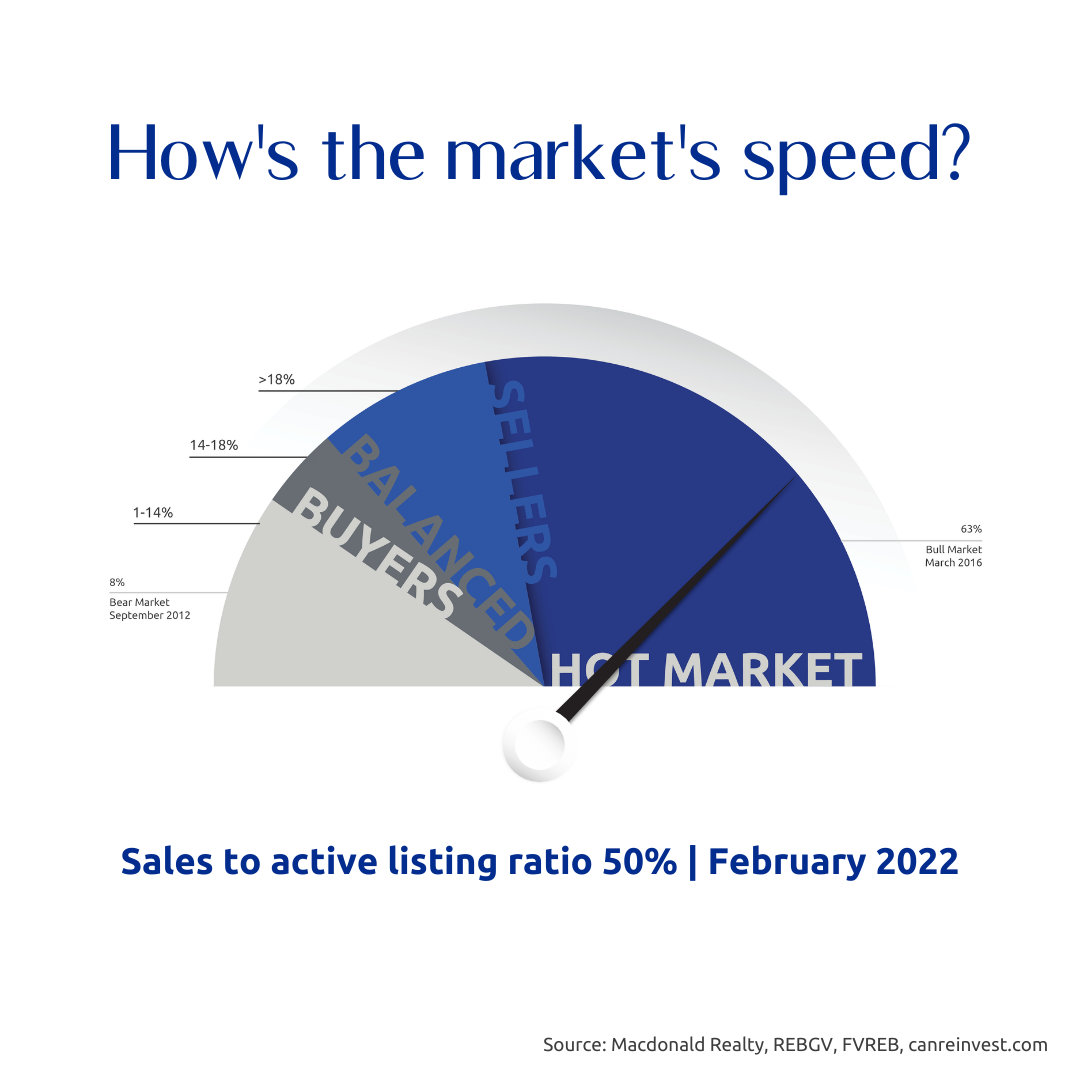
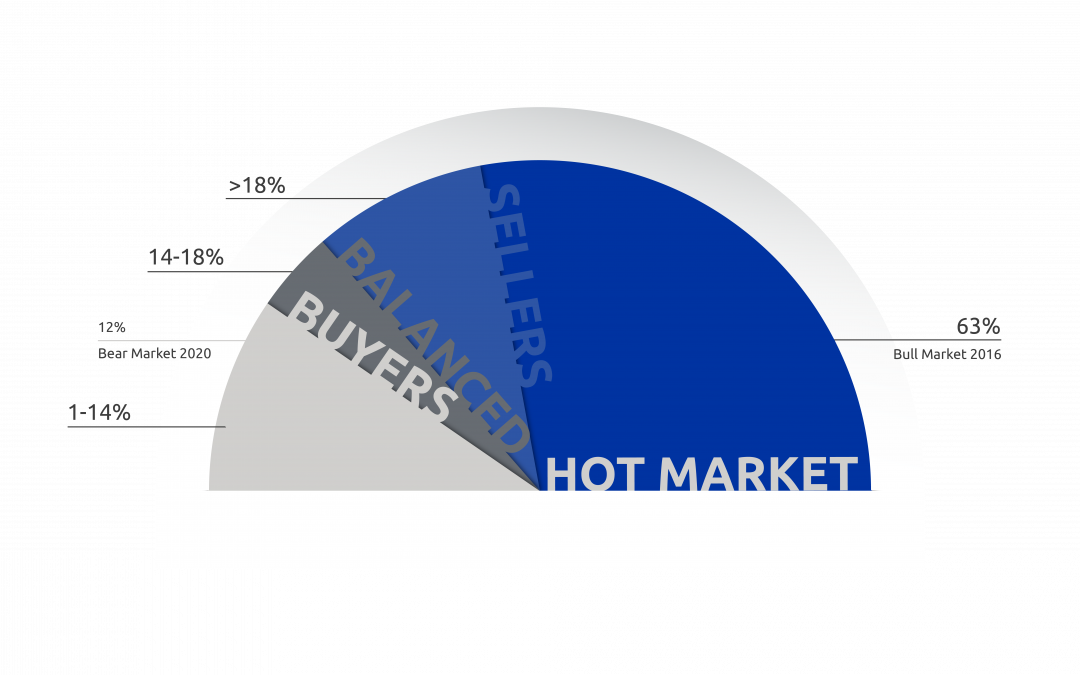
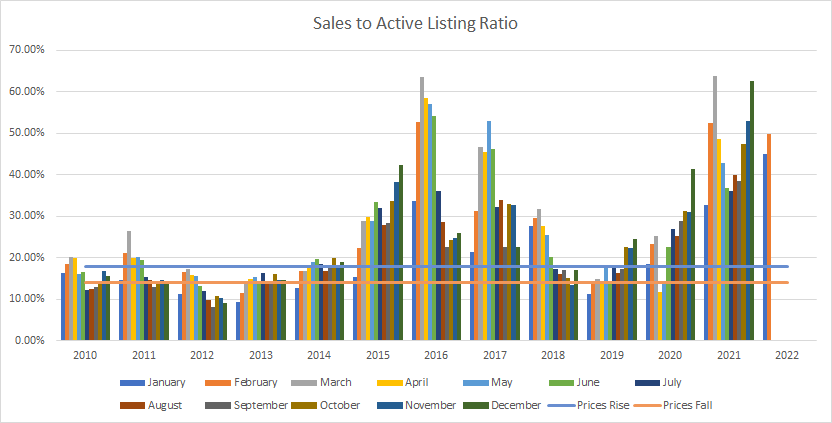
The most reliable indicator of market prices is the Sales to Active Listings Ratio (SAL). This is the ratio between the number of sales in a given month and the number of active listings at month-end.
In hotter markets in BC, a long-term analysis has shown that prices will usually act in the following ways:
- 7+ Months of Inventory (Under 14% SAL): Prices will likely DECLINE
- 5 – 7 Months of Inventory (14% – 18% SAL): Prices will likely be STABLE
- Less than 5.5 Months of Inventory (Over 18% SAL): Prices will likely RISE
Visit this link to learn more about house prices and inventory.
Sales
Metro Vancouver (combined @rebgv & @fvreb) sales continue to be strong, but show signs of slowing. 3rd highest February on record. 25% lower than in 2021, but 25% higher than the 10-year average.
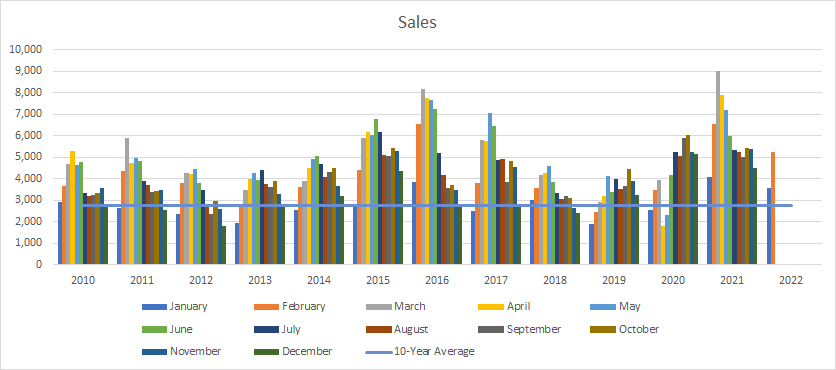
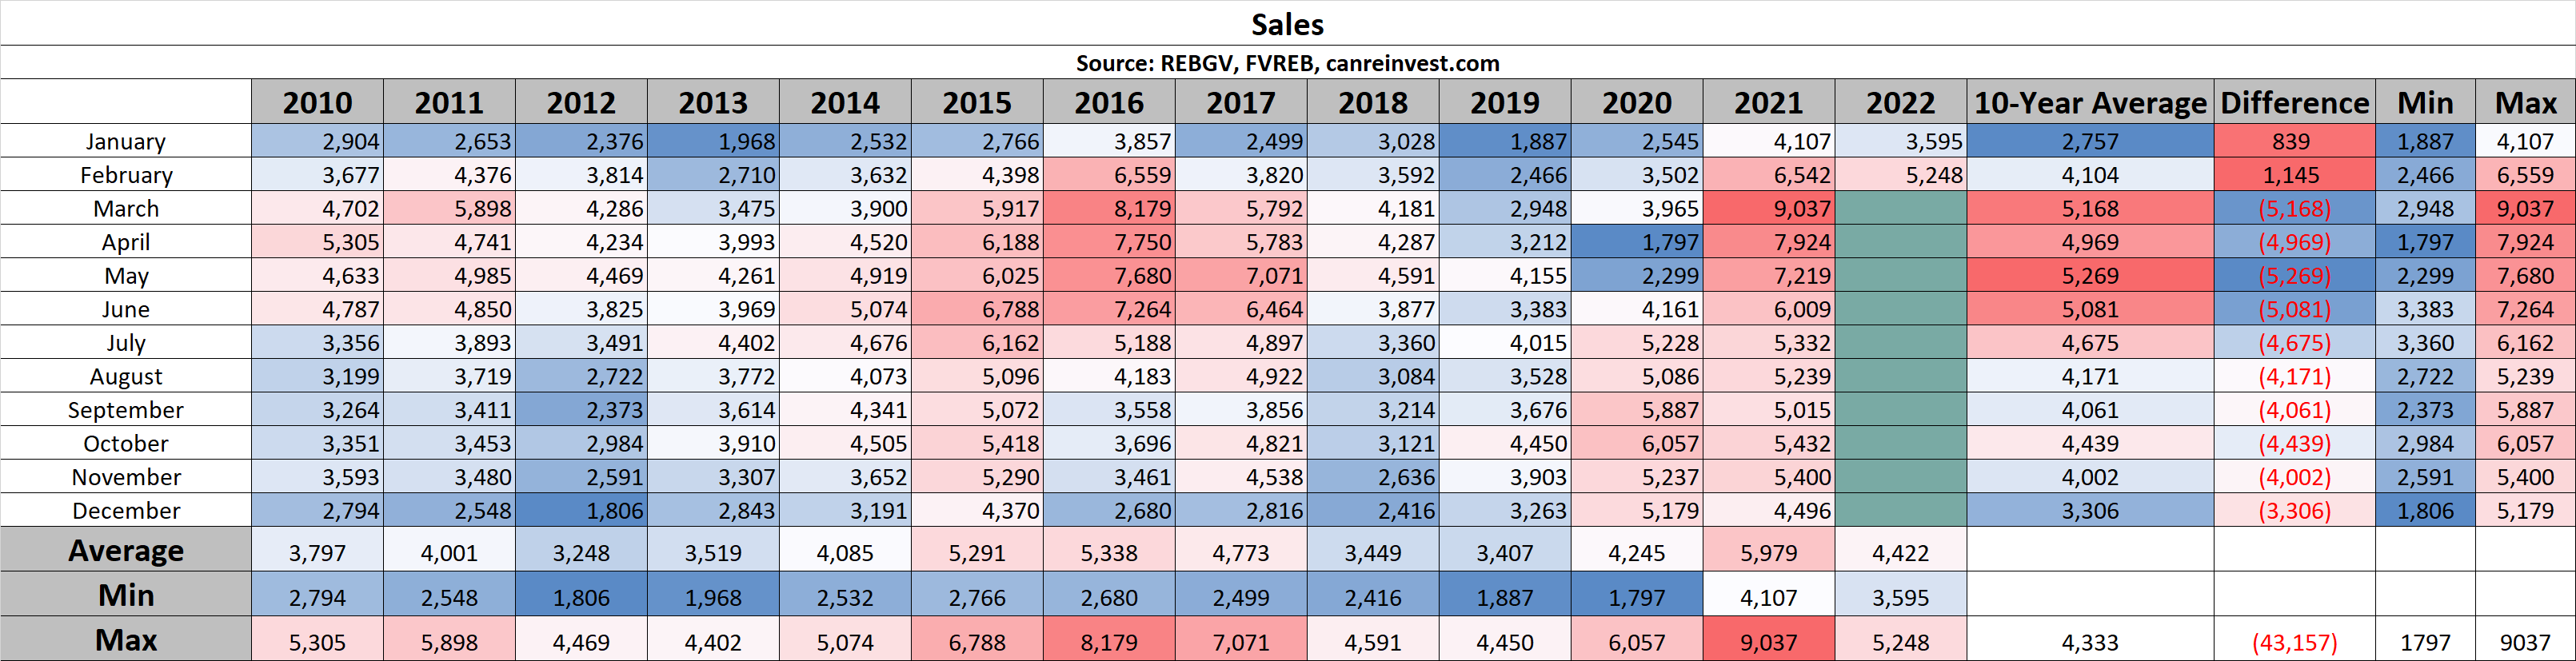
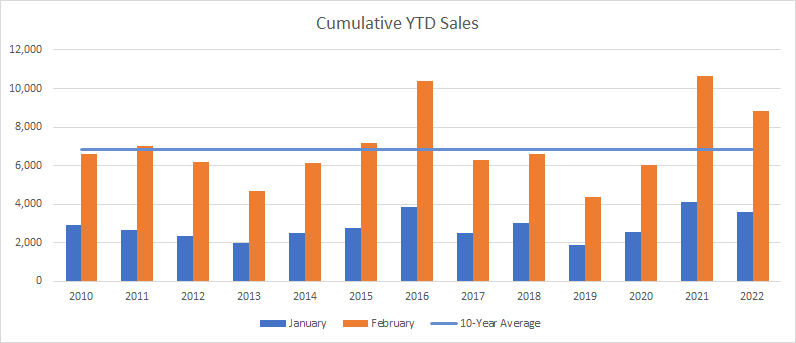
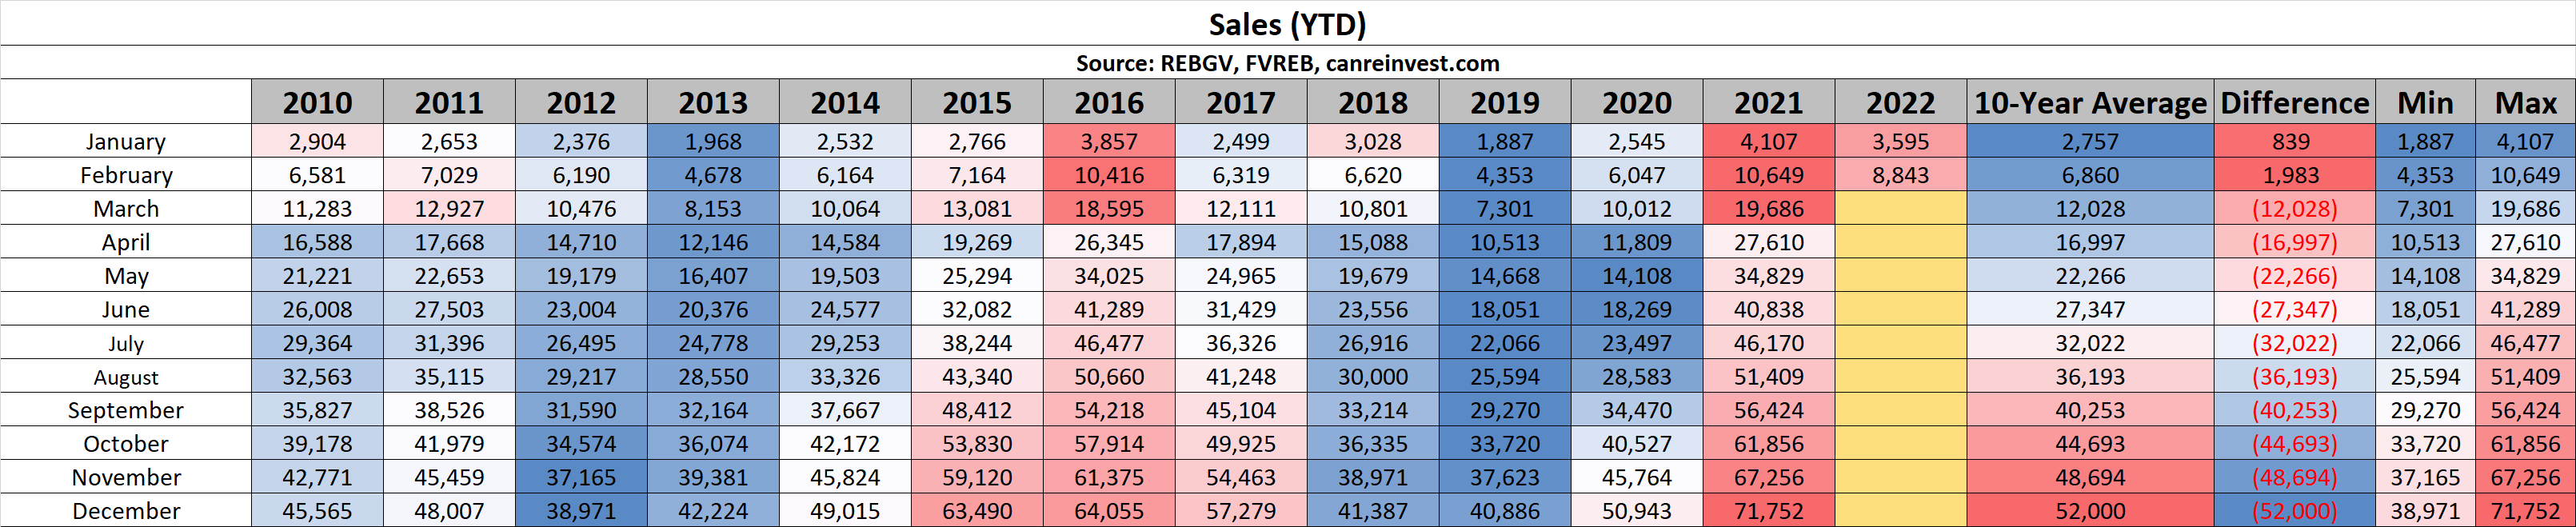
Cumulative Year-to-date Sales
YTD sales have moderated from 2021, but are still the 3rd highest on record (2021 #1; 2016 #2).
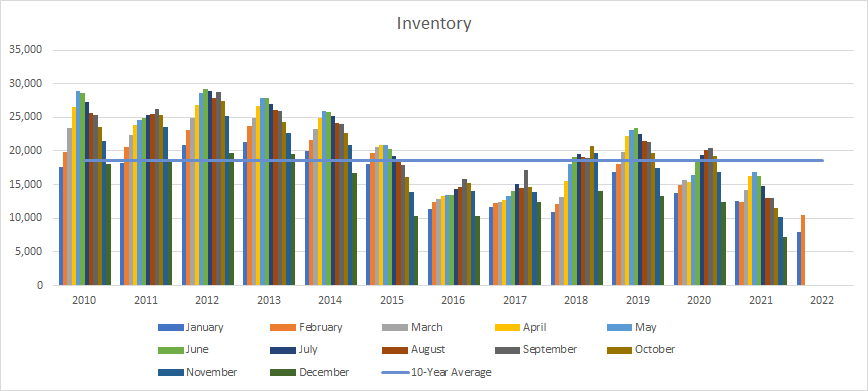
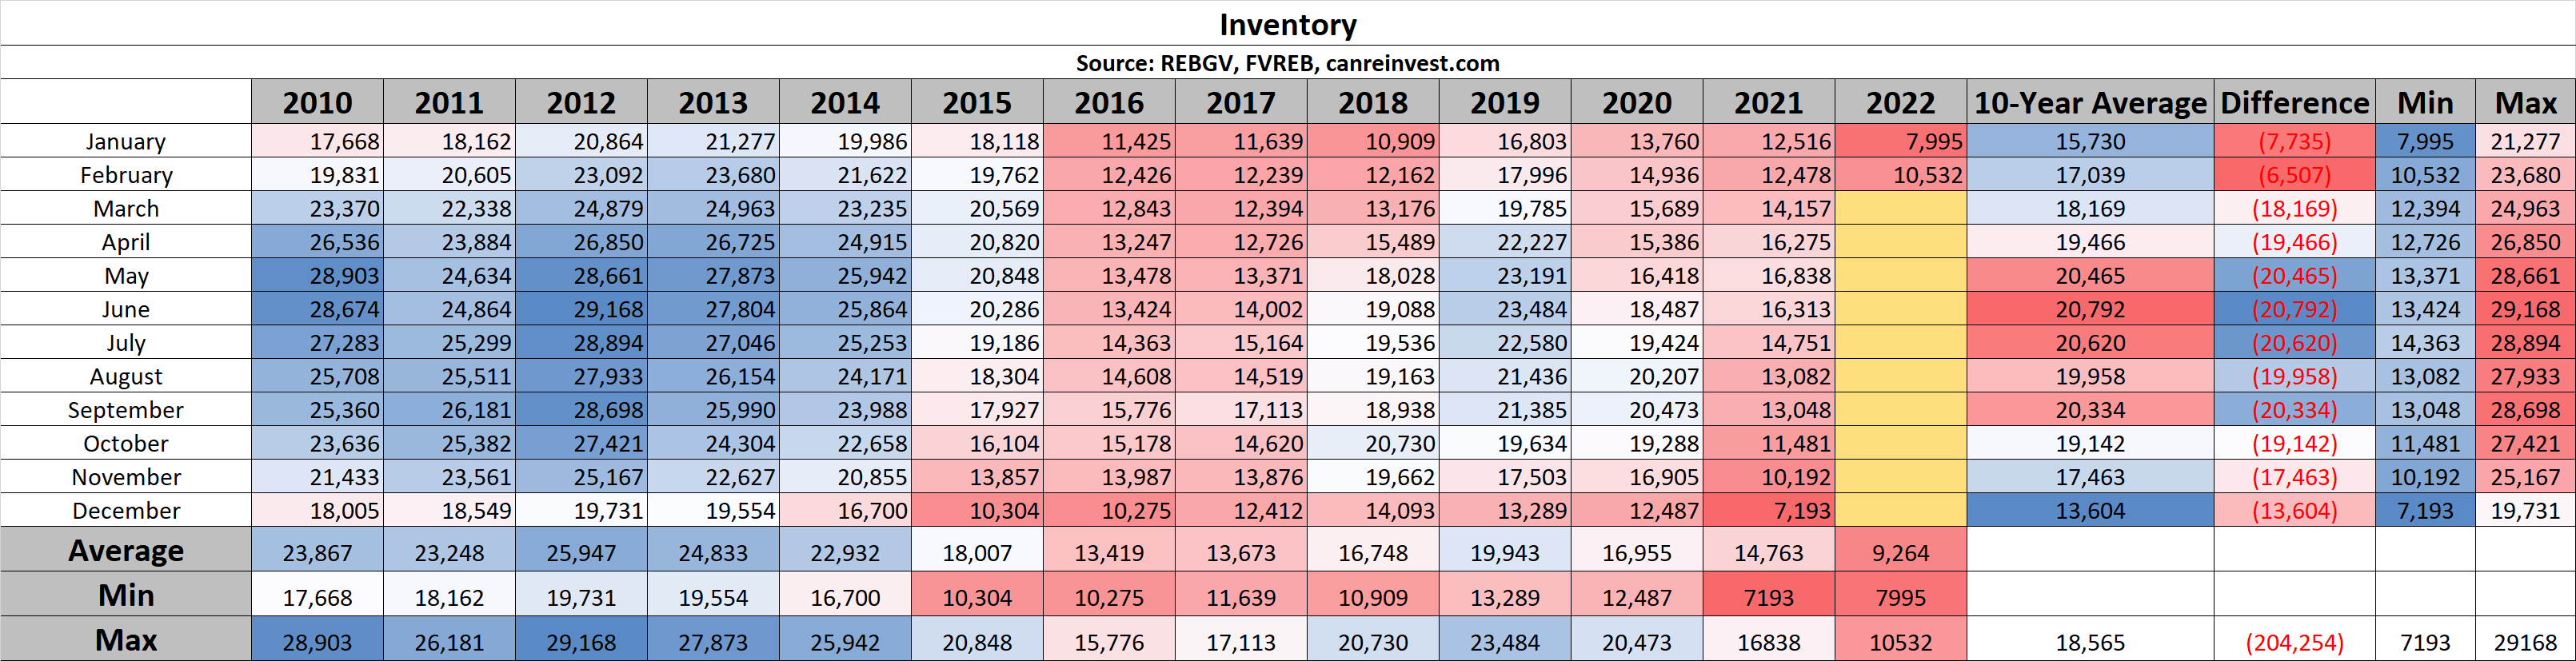
Inventory
Standing inventory continues to be the biggest challenge. Lowest February inventory in a generation. 10,532 active listings are 20% below last year (12,478) and 40% below the 10-year average (17,039).
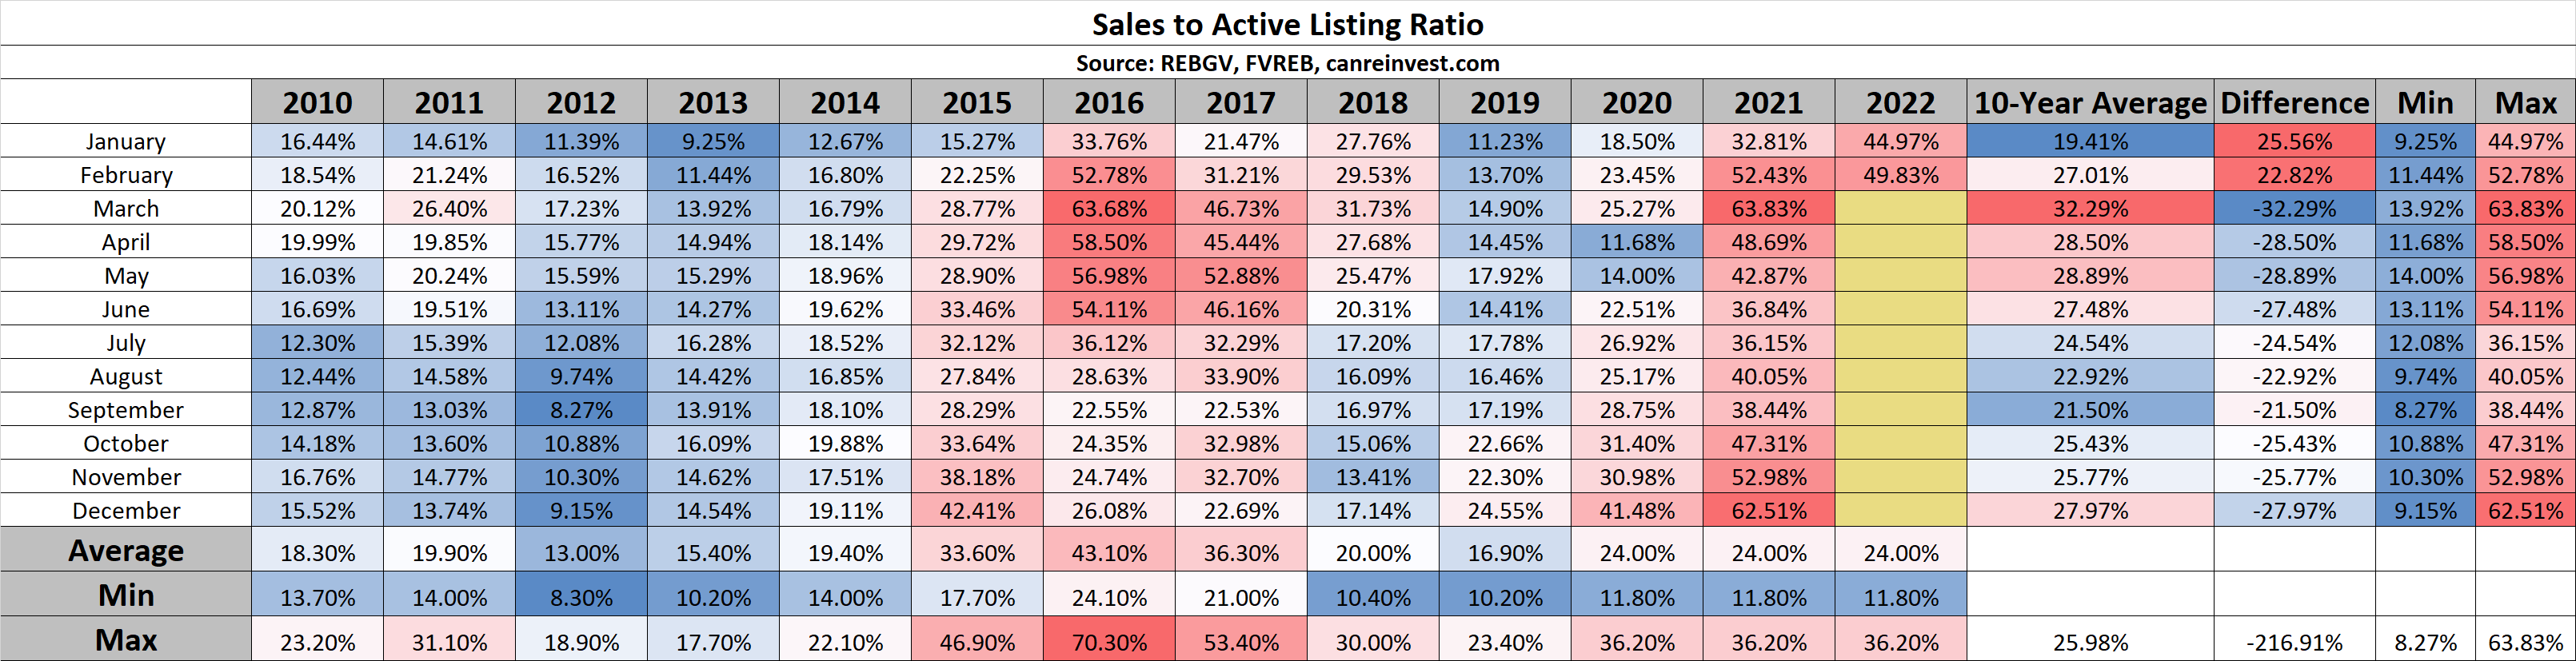
Sales to Active Listings
With a SAL of 50%, this indicates there is considerable support for higher prices.
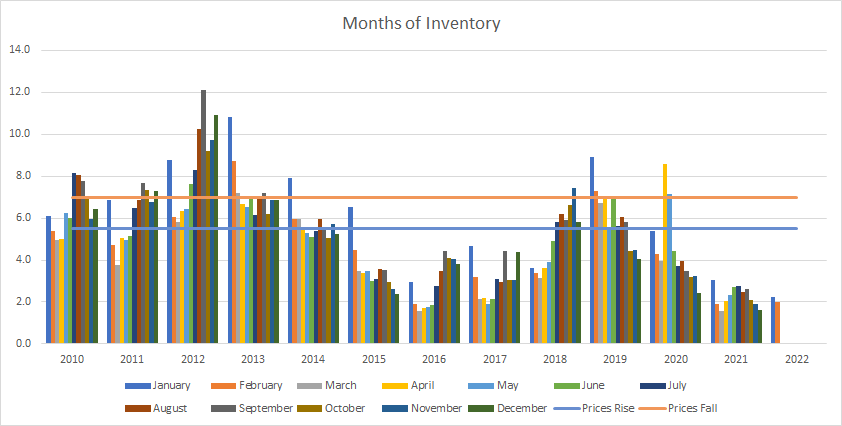
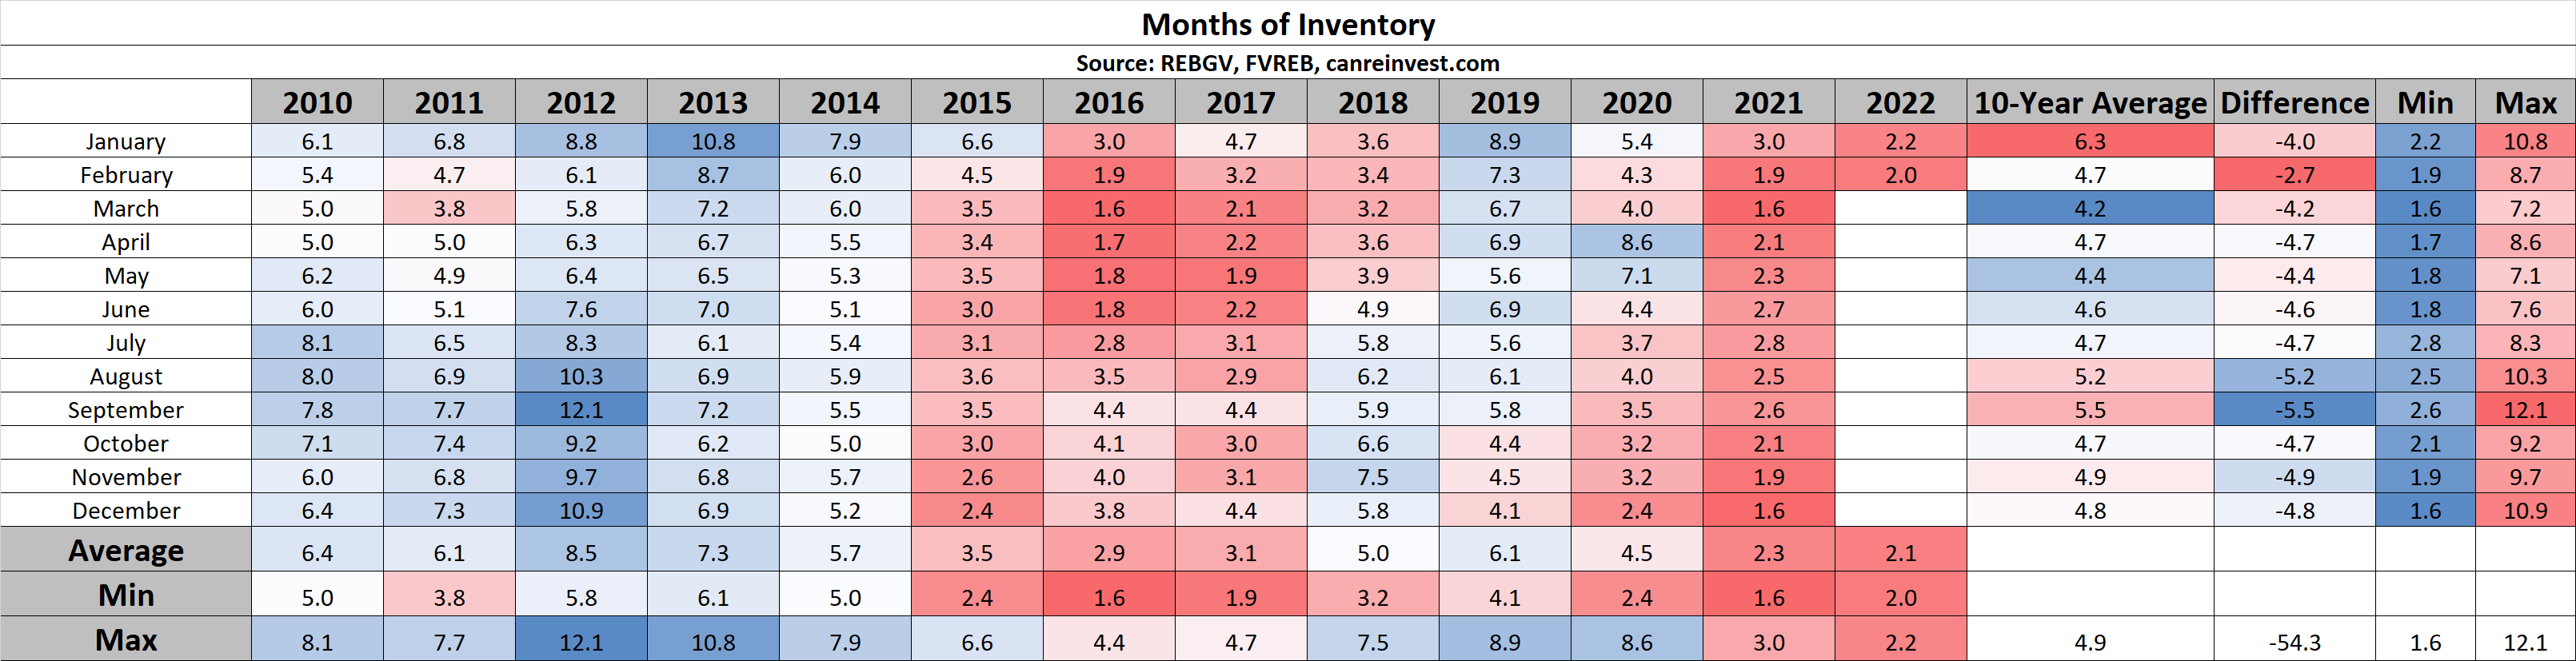
Months of Inventory
Currently, there is only 2 months of inventory. Normally, there should be closer to 5 months.
Want to learn more about these stats or discuss your move to Macdonald Realty?
check out careersinbcrealestate.com to connect today!
by Macrealty Marketing Team | Feb 8, 2022 | Market Updates
Here are the latest real estate market statistics from Macdonald Realty on the Greater Vancouver listings and sales in January 2022.
Find all the infographics by visiting the Facebook Album.
The first month of 2022 saw home sales come down from last year’s record-setting pace, while low supply continued to cause home prices to edge higher across Metro Vancouver*.
The Real Estate Board of Greater Vancouver (REBGV) reports that residential home sales in the region totalled 2,285 in January 2022, a 4.4 per cent decrease from the 2,389 sales recorded in January 2021, and a 15 per cent decrease from the 2,688 homes sold in December 2021.
Last month’s sales were 25.3 per cent above the 10-year January sales average.
There were 4,170 detached, attached and apartment properties newly listed for sale on the Multiple Listing Service® (MLS®) in Metro Vancouver in January 2022. This represents a 6.9 per cent decrease compared to the 4,480 homes listed in January 2021 and a 114.4 per cent increase compared to December 2021 when 1,945 homes were listed.
“Our listing inventory on MLS® is less than half of what would be optimal to begin the year. As a result, hopeful home buyers have limited choice in the market today. This trend is causing fierce competition for a scarce number of homes for sale, which, in turn, increases prices,” Keith Stewart, REBGV economist said.
The Board also has informed:
“As we approach spring, we’ll keep a close eye on the impact of rising interest rates on buyers’ willingness to buy and on whether more home owners will opt to become sellers in what’s traditionally the busiest season of the year,” Stewart said. “With home prices reaching new highs in recent months, the need has never been greater for government to collaborate with the building community to expedite the creation of housing supply and provide more choice for those struggling to buy a home today.”
*Areas covered by the Real Estate Board of Greater Vancouver include Burnaby, Coquitlam, Maple Ridge, New Westminster, North Vancouver, Pitt Meadows, Port Coquitlam, Port Moody, Richmond, South Delta, Squamish, Sunshine Coast, Vancouver, West Vancouver, and Whistler. Check out the infographics of Squamish, Sunshine Coast and Whistler, HERE.
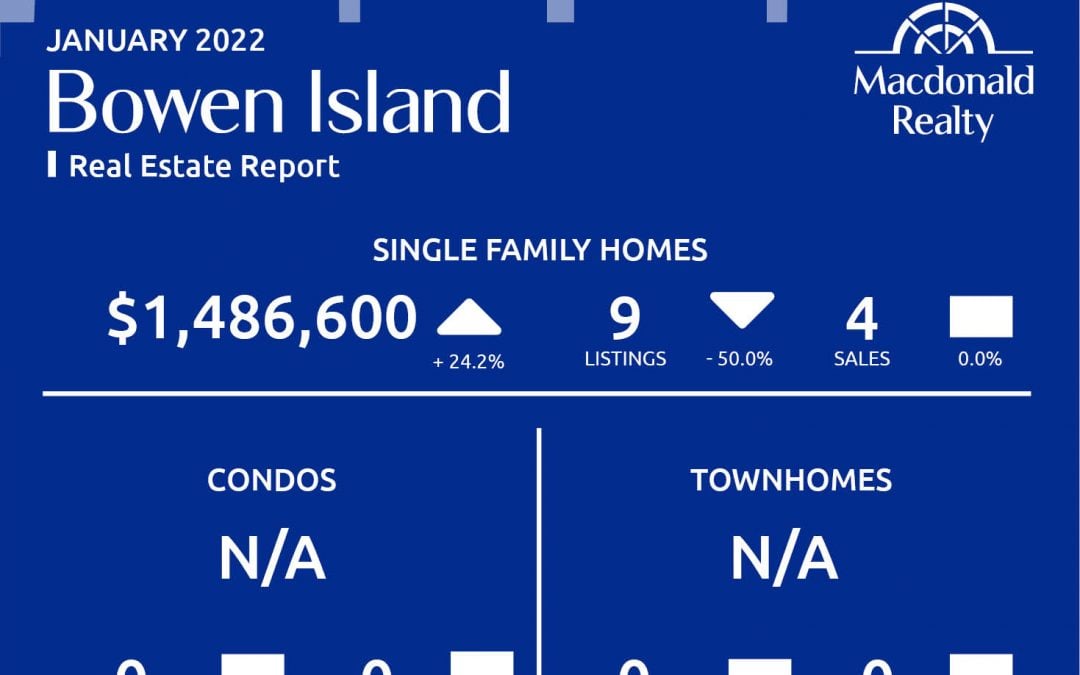
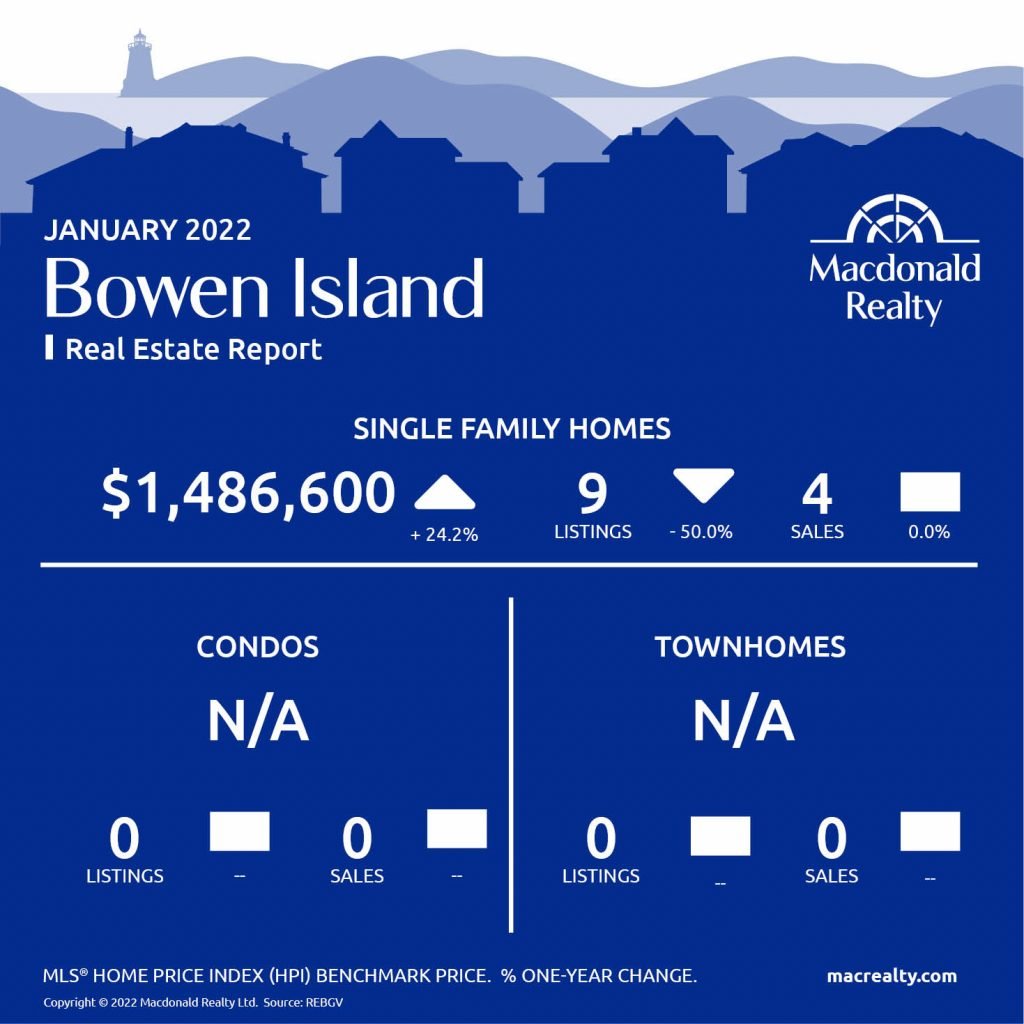
Bowen Island
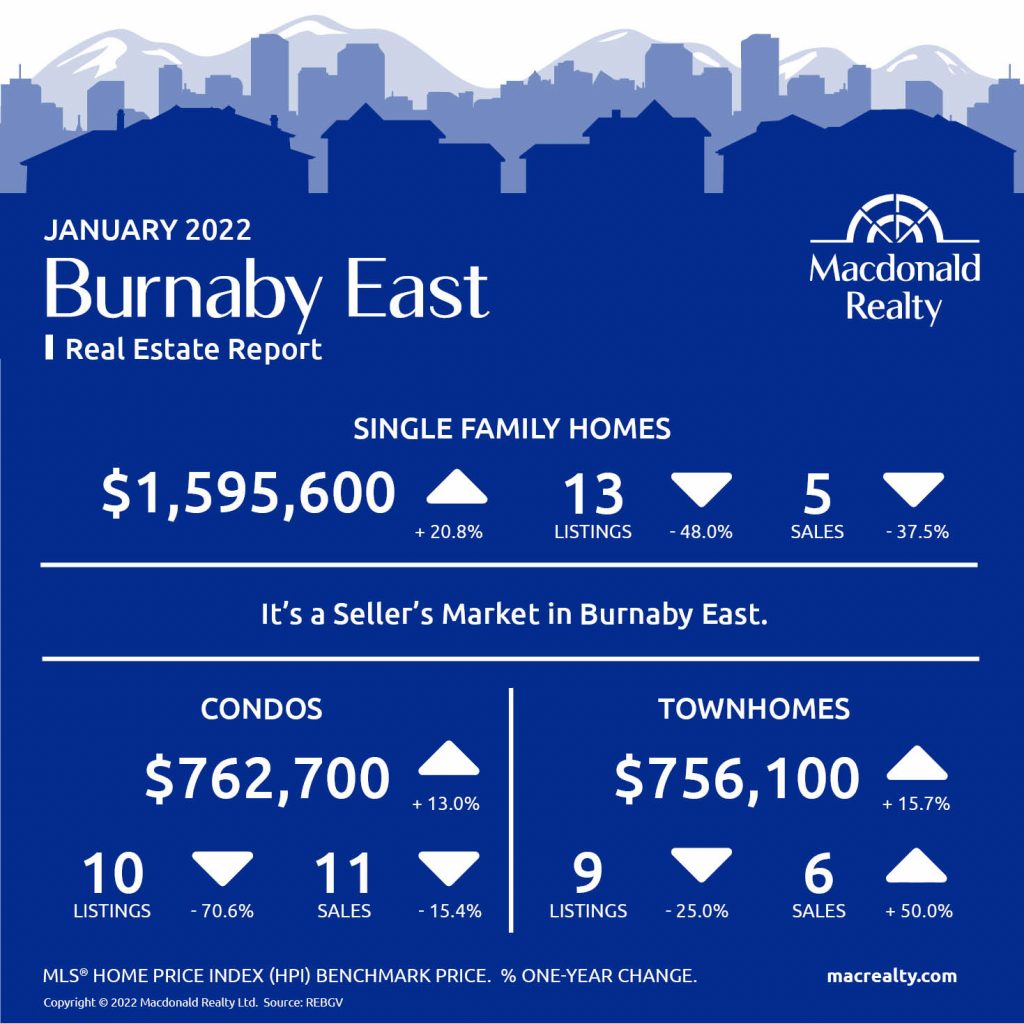
Burnaby East
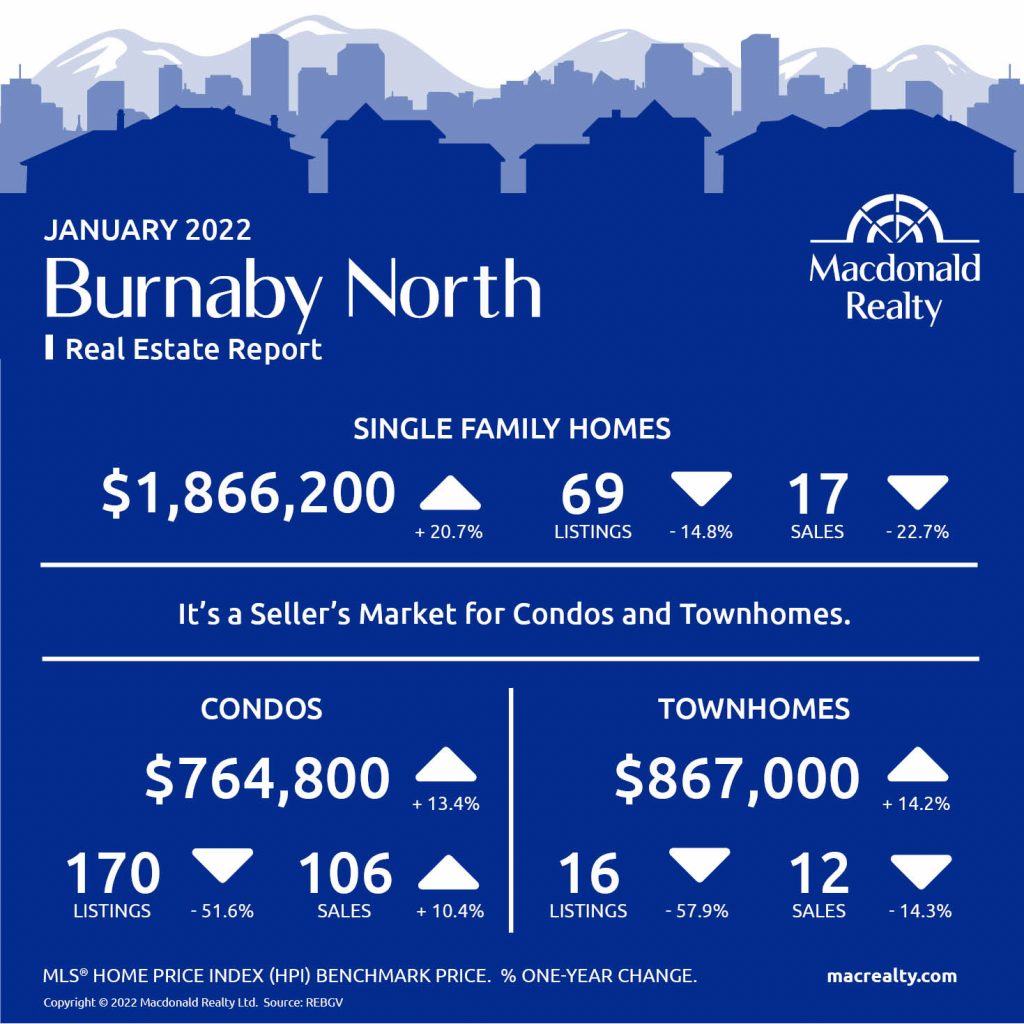
Burnaby North
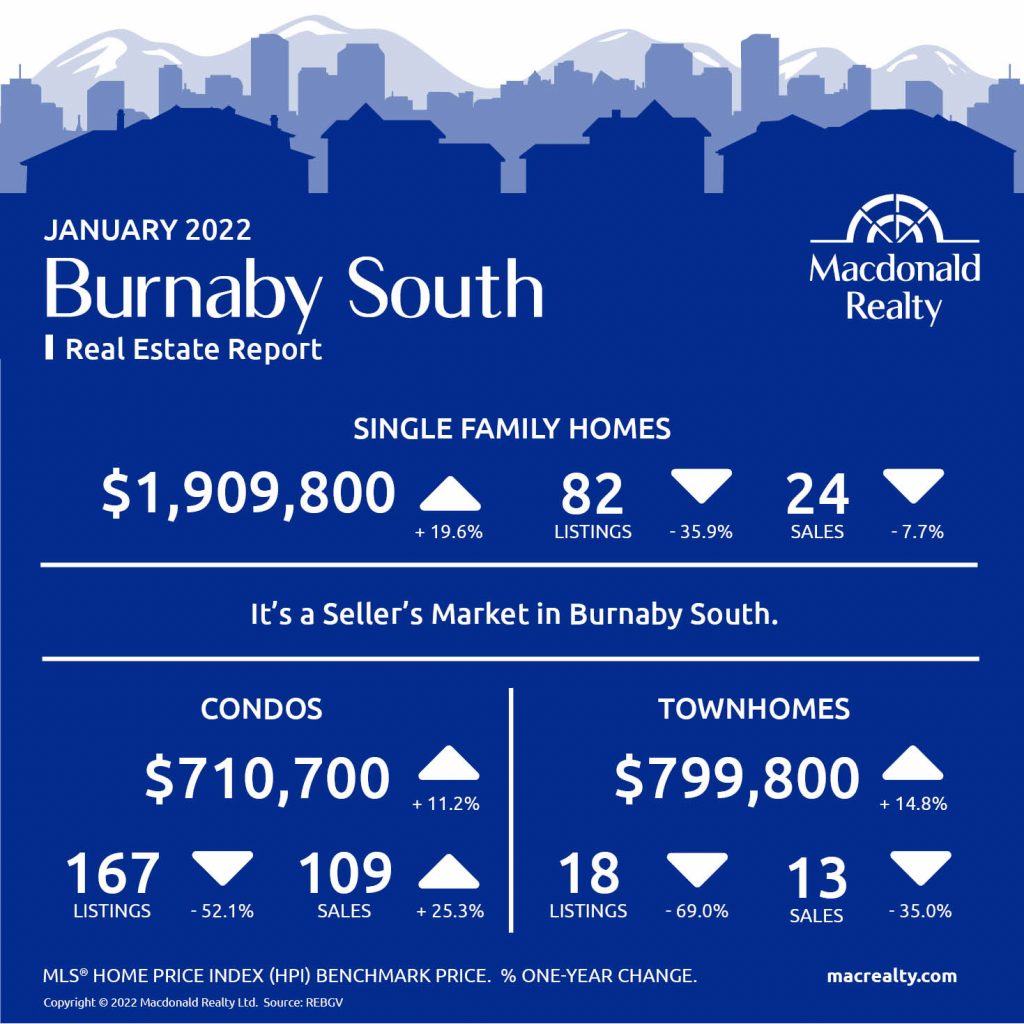
Burnaby South
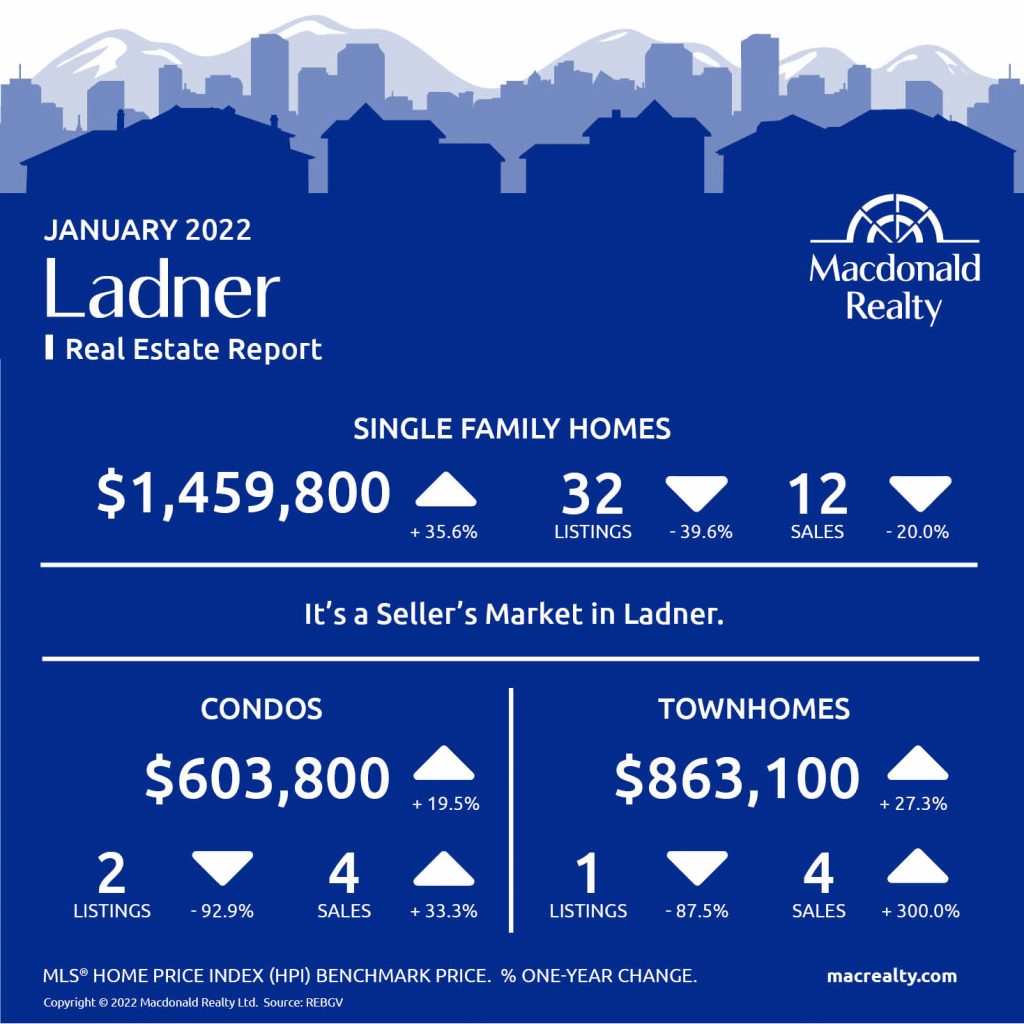
Ladner
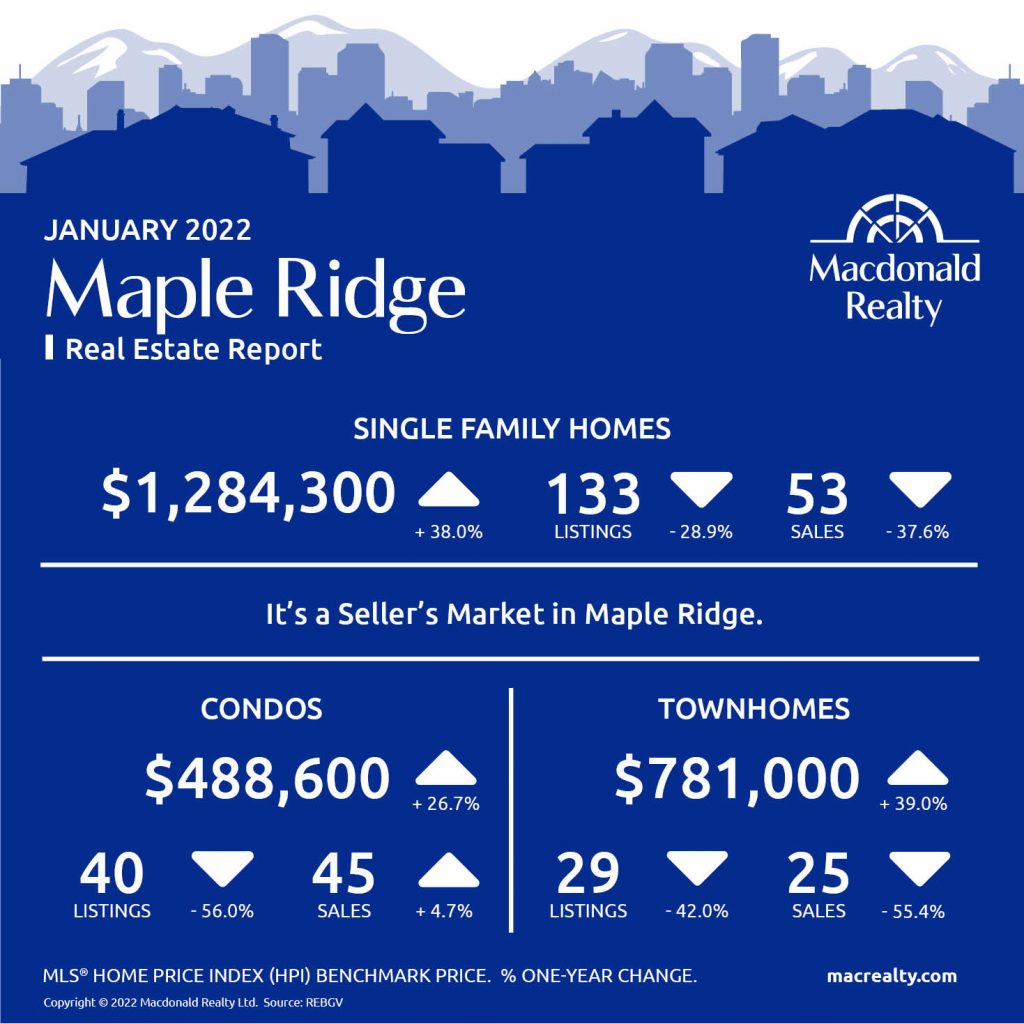
Maple Ridge
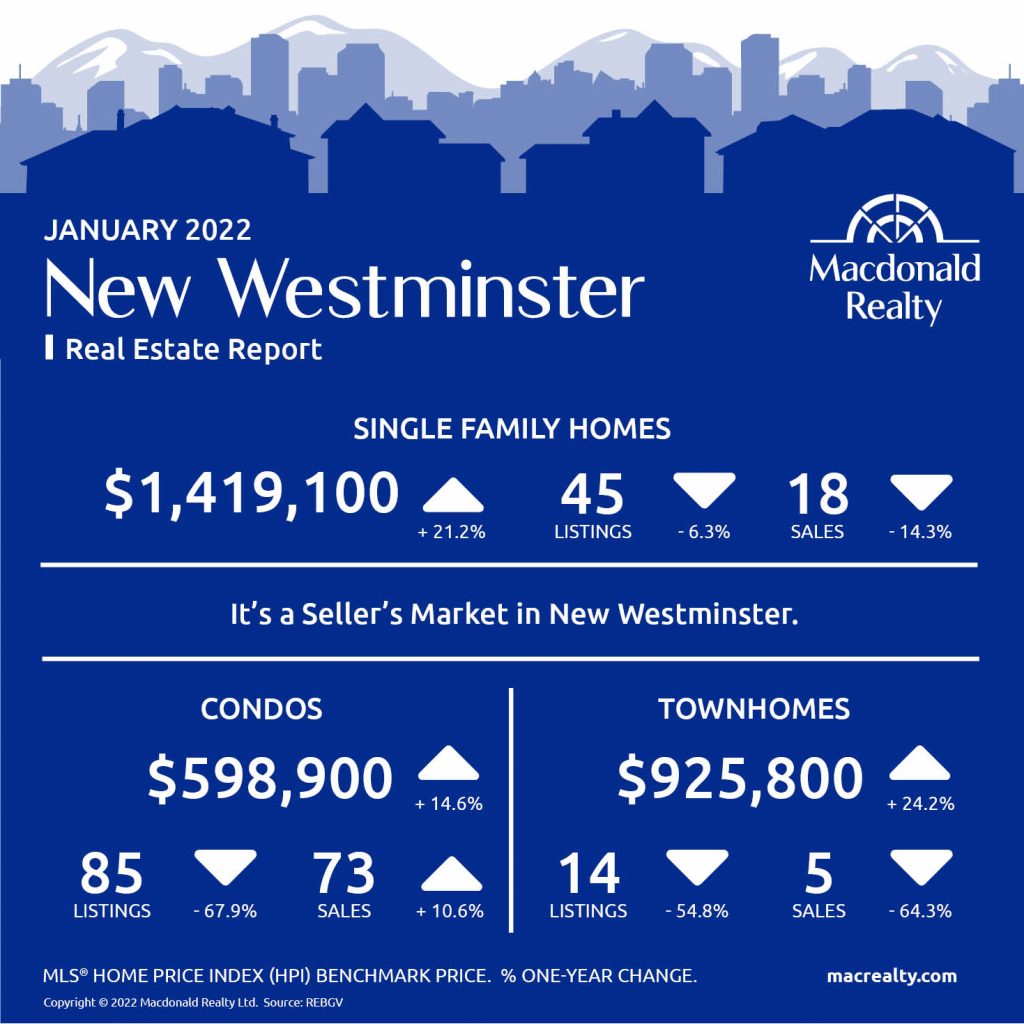
New Westminster
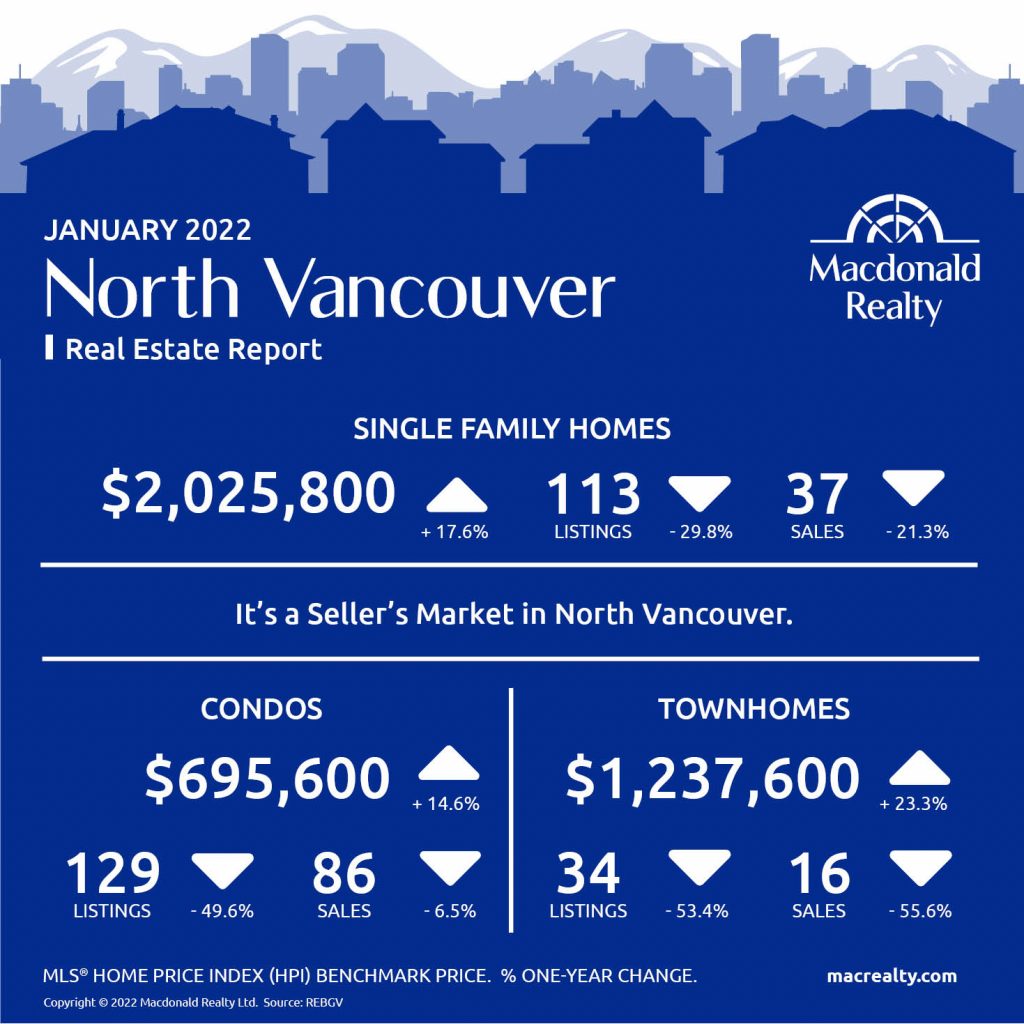
North Vancouver
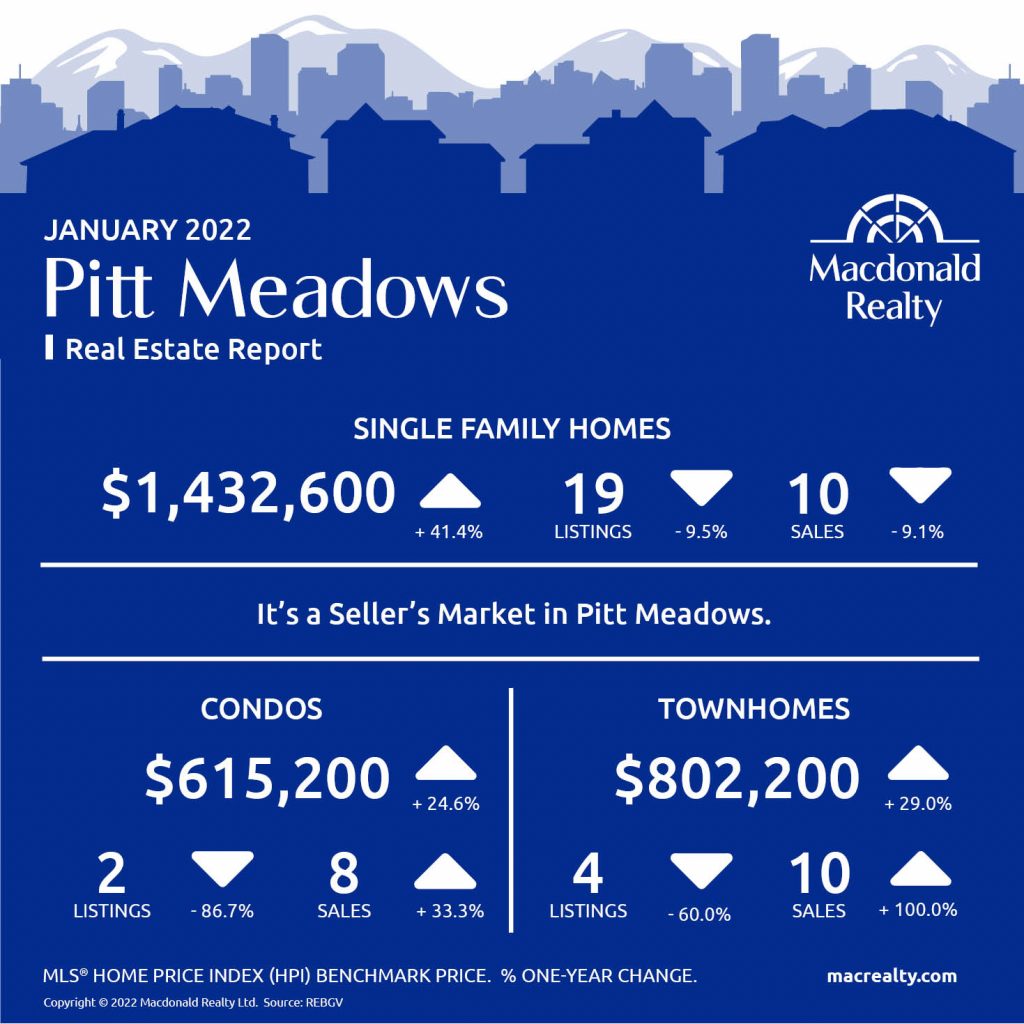
Pitt Meadows
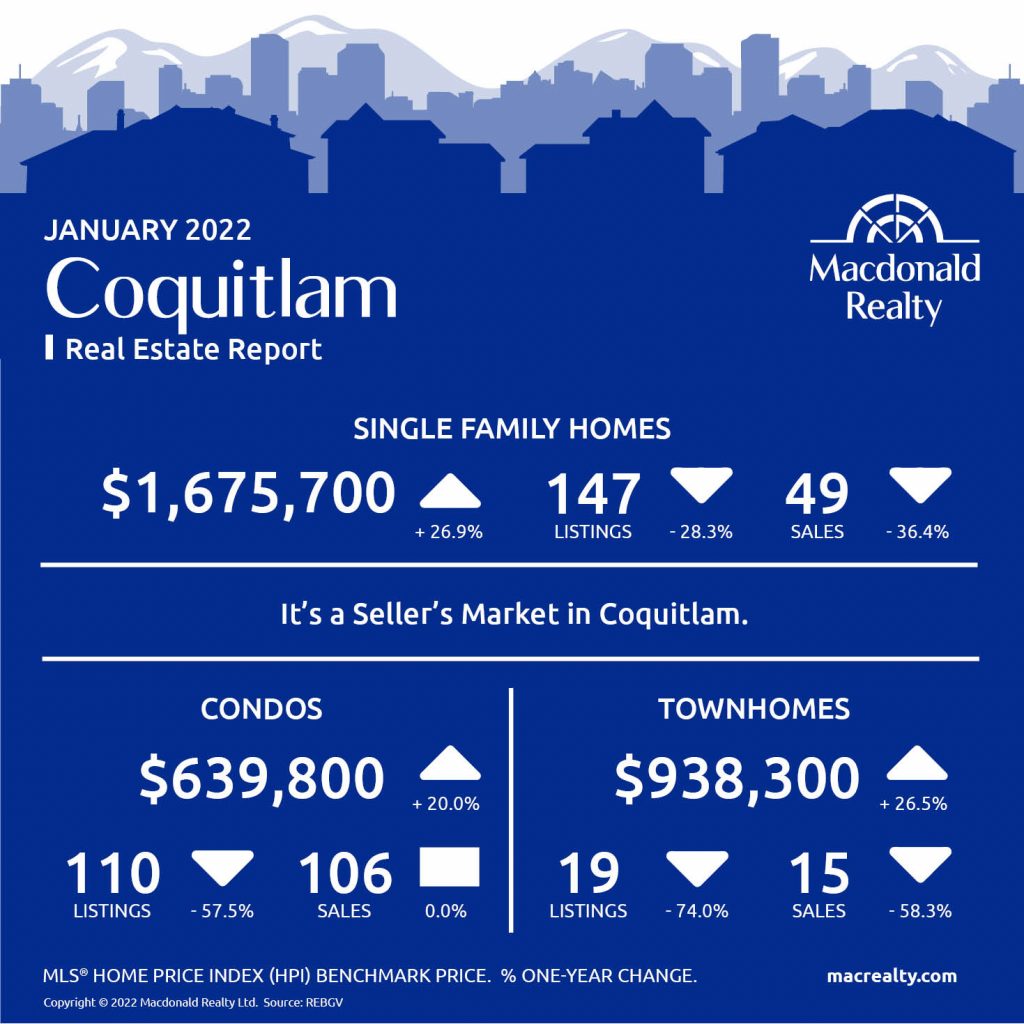
Coquitlam
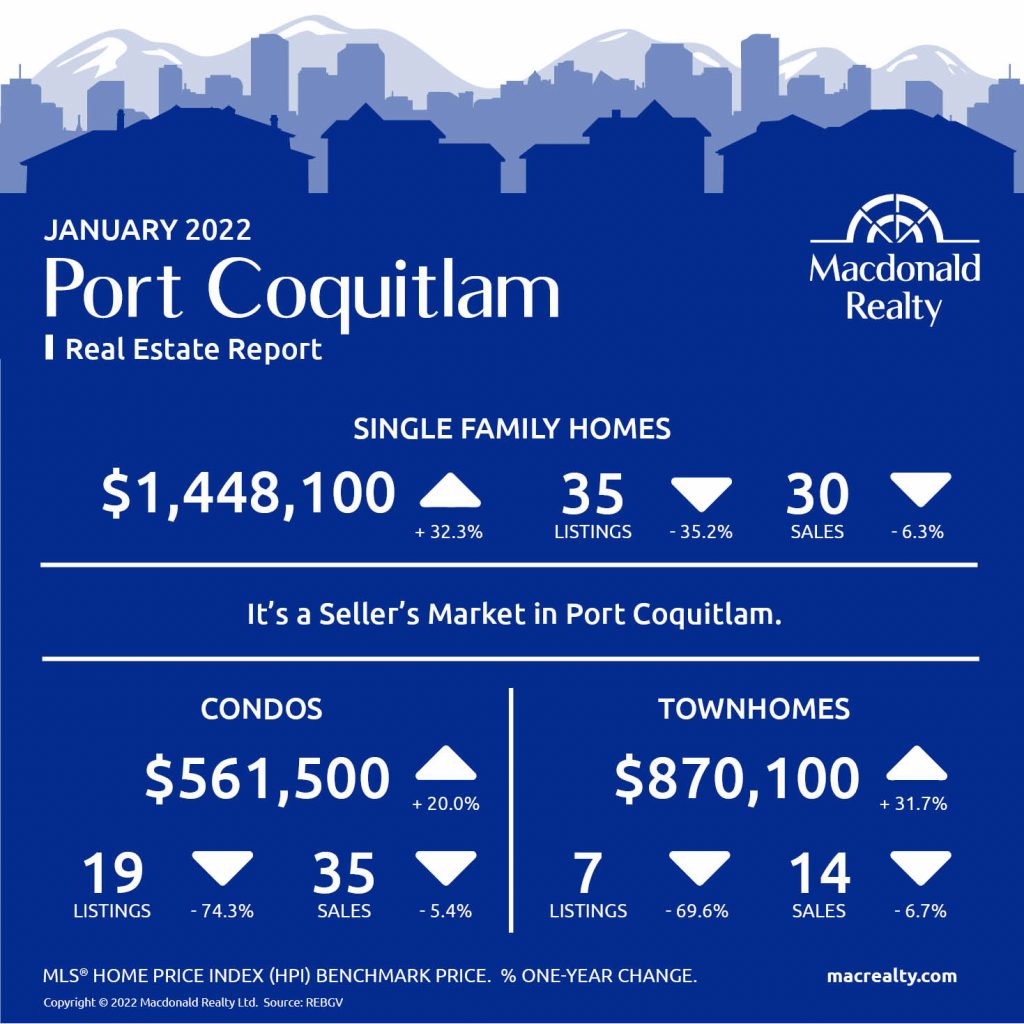
Port Coquitlam
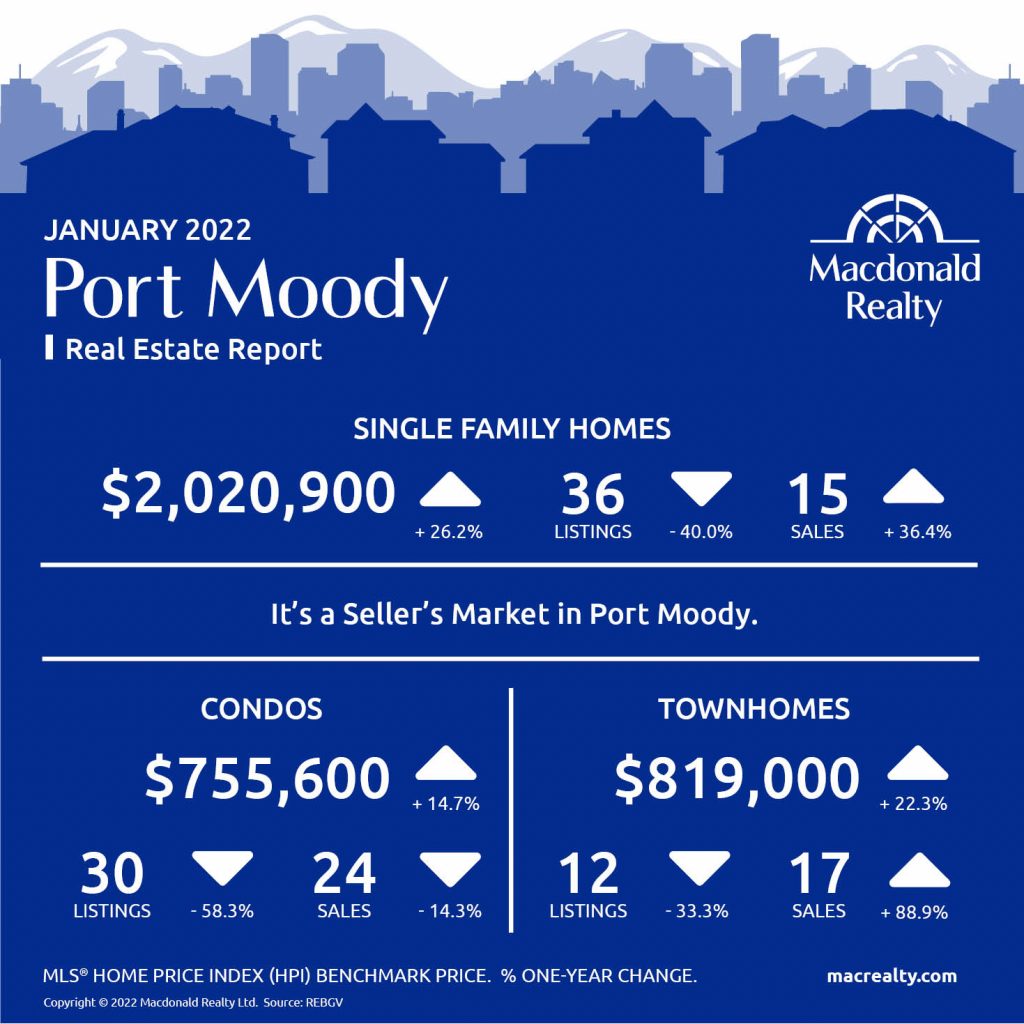
Port Moody
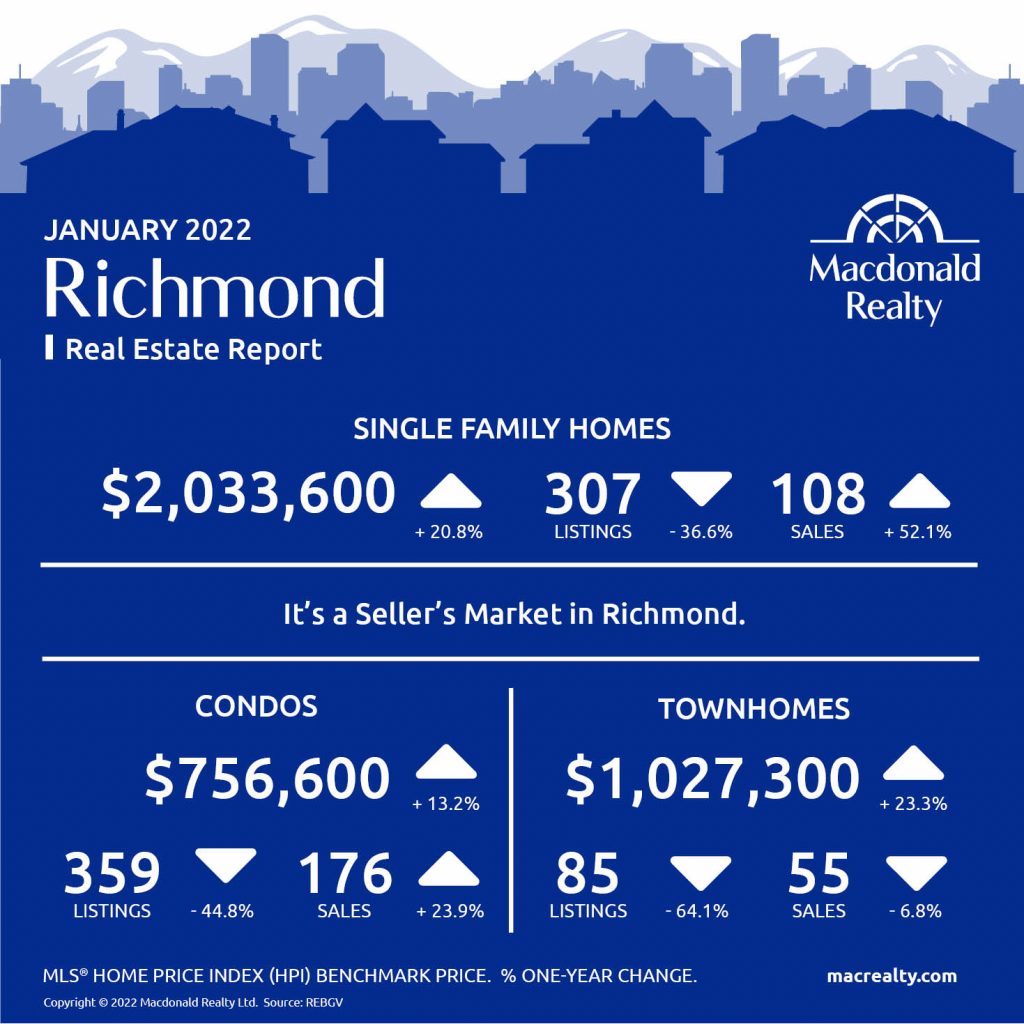
Richmond
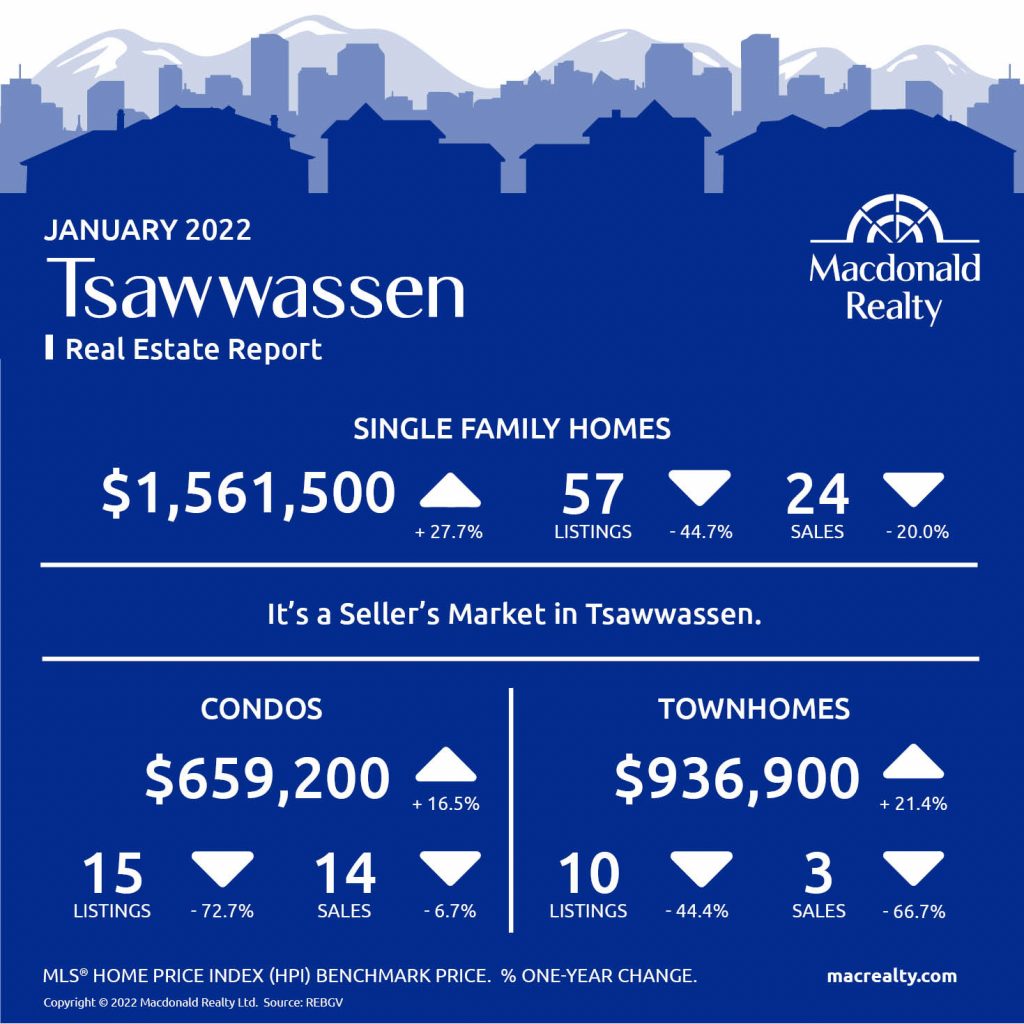
Tsawwassen
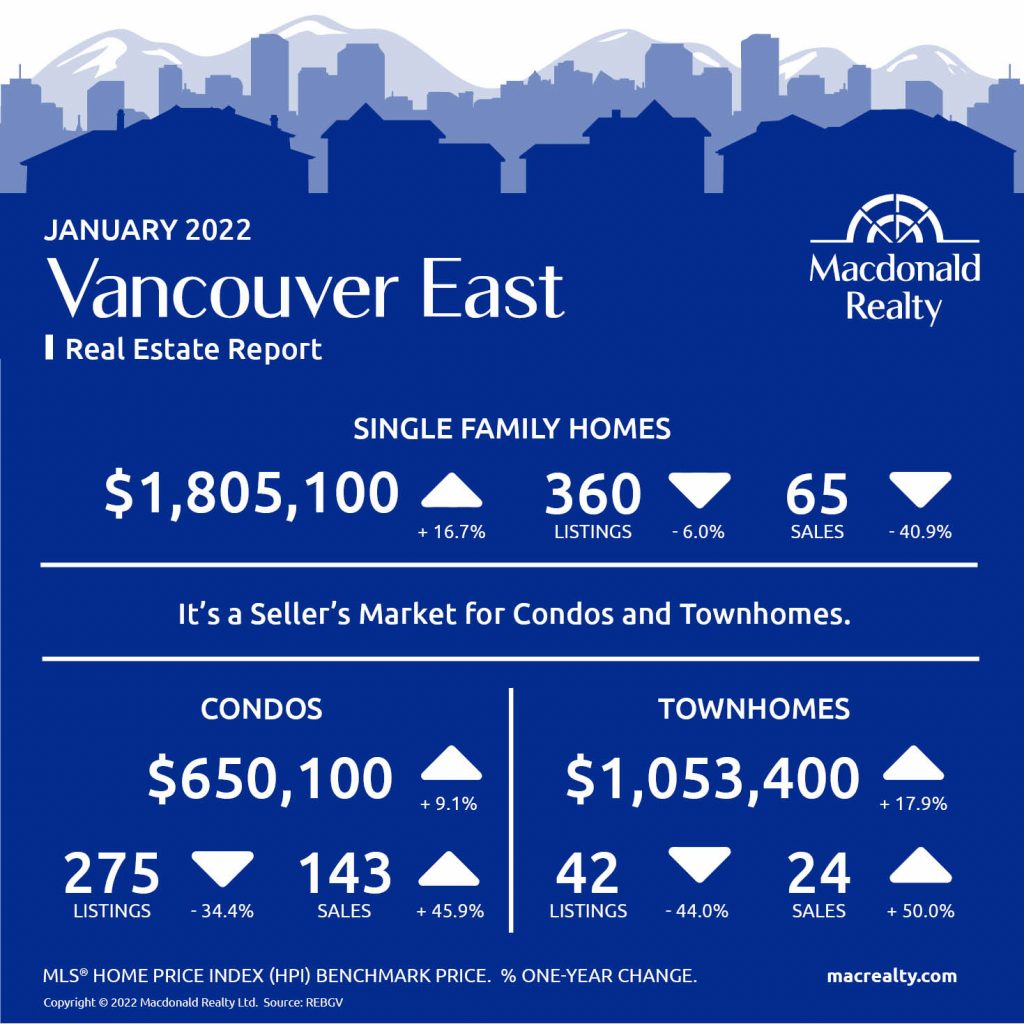
Vancouver East
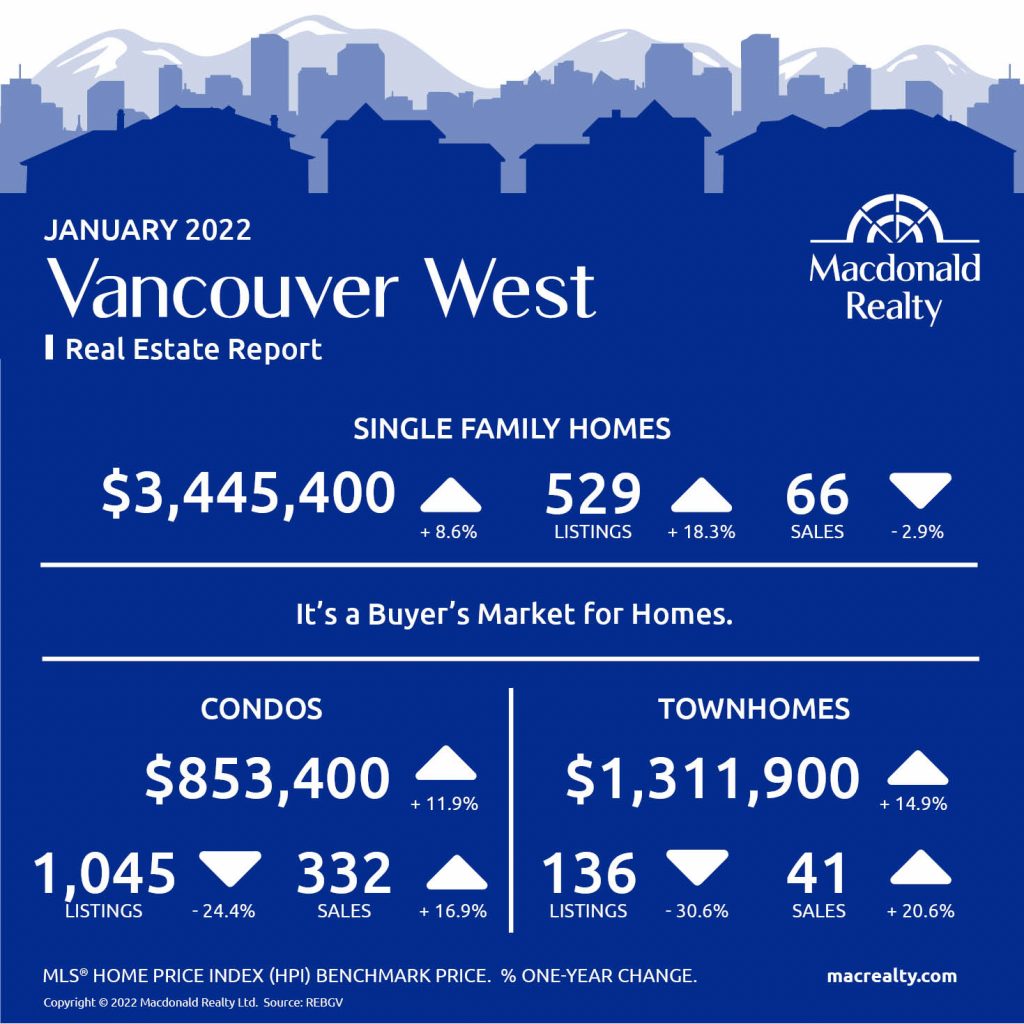
Vancouver West
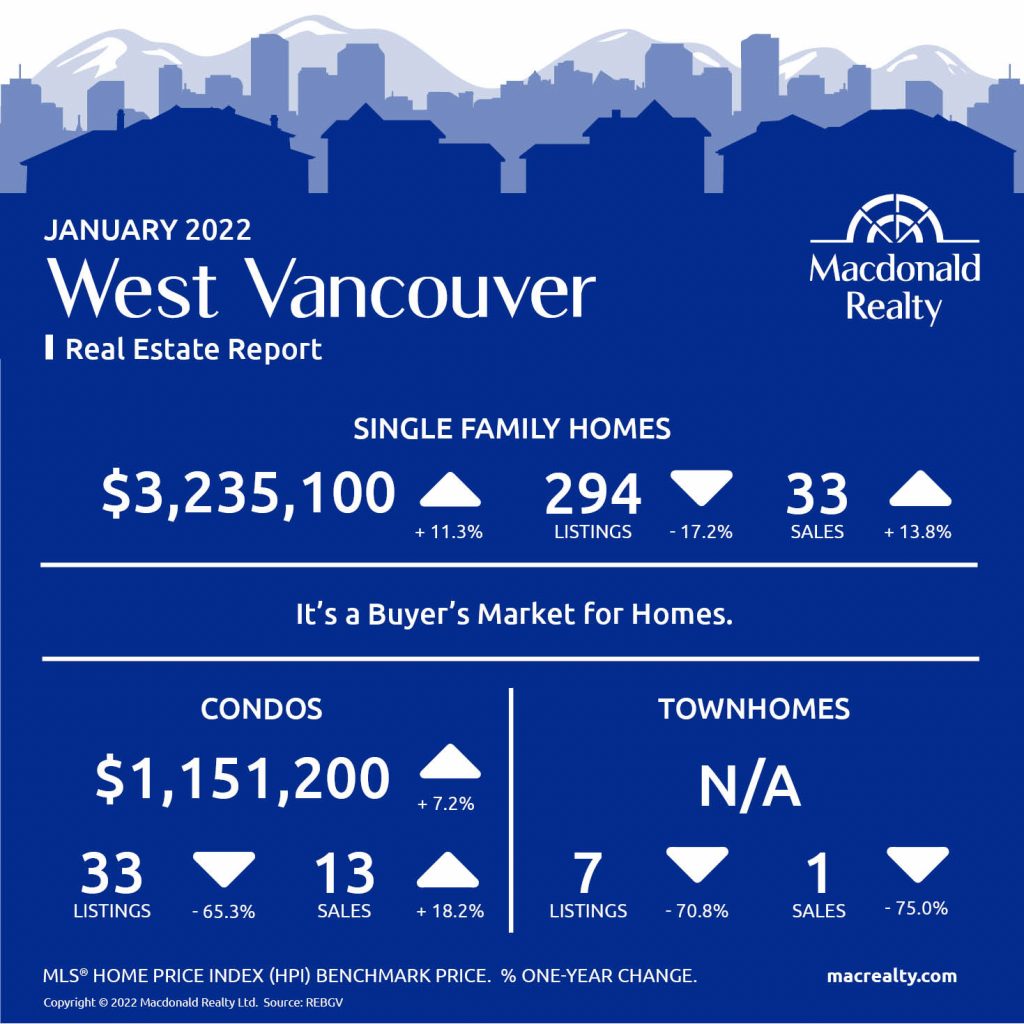
West Vancouver
Looking for more information about the real estate market in specific neighbourhoods in the Greater Vancouver?
Macdonald Realty has offices across the Greater Vancouver. Please email [email protected] or call 1-877-278-3888 to be matched with a REALTOR® working in your area.
MLS® Home Price Index (HPI) Benchmark Price
Average and median home prices are often misinterpreted, are affected by change in the mix of homes sold, and can swing dramatically from month to month (based on the types and prices of properties that sold in a given month). The MLS® HPI overcomes these shortcomings and uses the concept of a benchmark home, a notional home with common attributes of typical homes in a defined area. Visit www.housepriceindex.ca for more information.
This blog post is based on market data provided by the Real Estate Board of Greater Vancouver (REBGV) www.rebgv.org
by Macrealty Marketing Team | Feb 8, 2022 | Market Updates
Here are the latest real estate market statistics from Macdonald Realty on Squamish, Whistler, and Sunshine Coast listings and sales in January 2022.
Find all the infographics related to the January Market Statistics by visiting the Facebook Album.
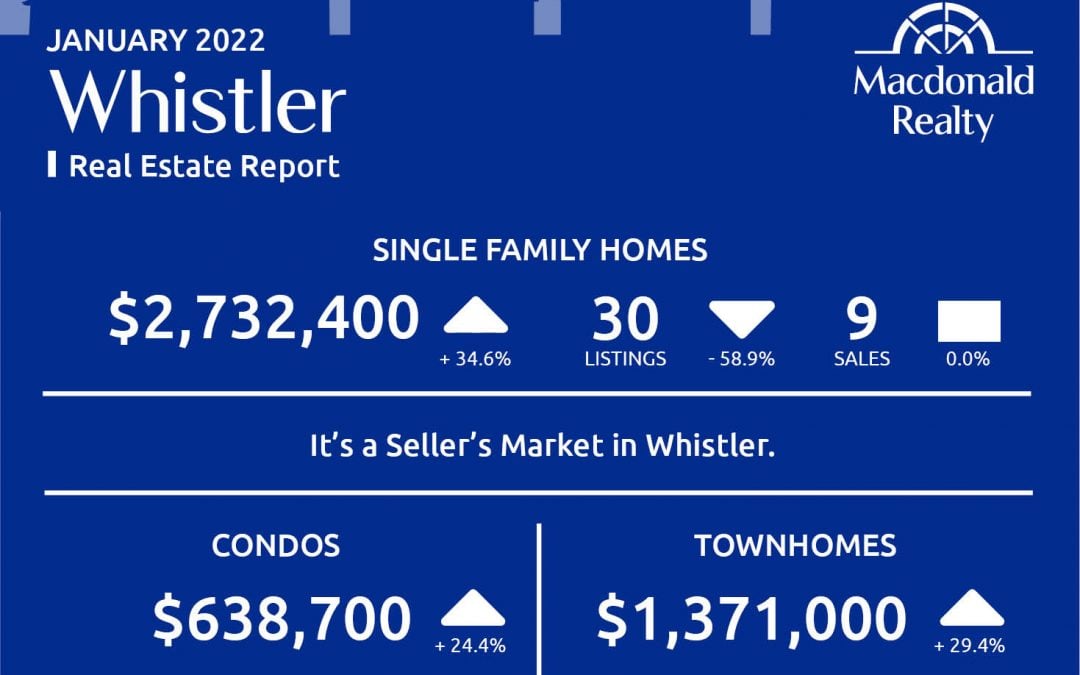
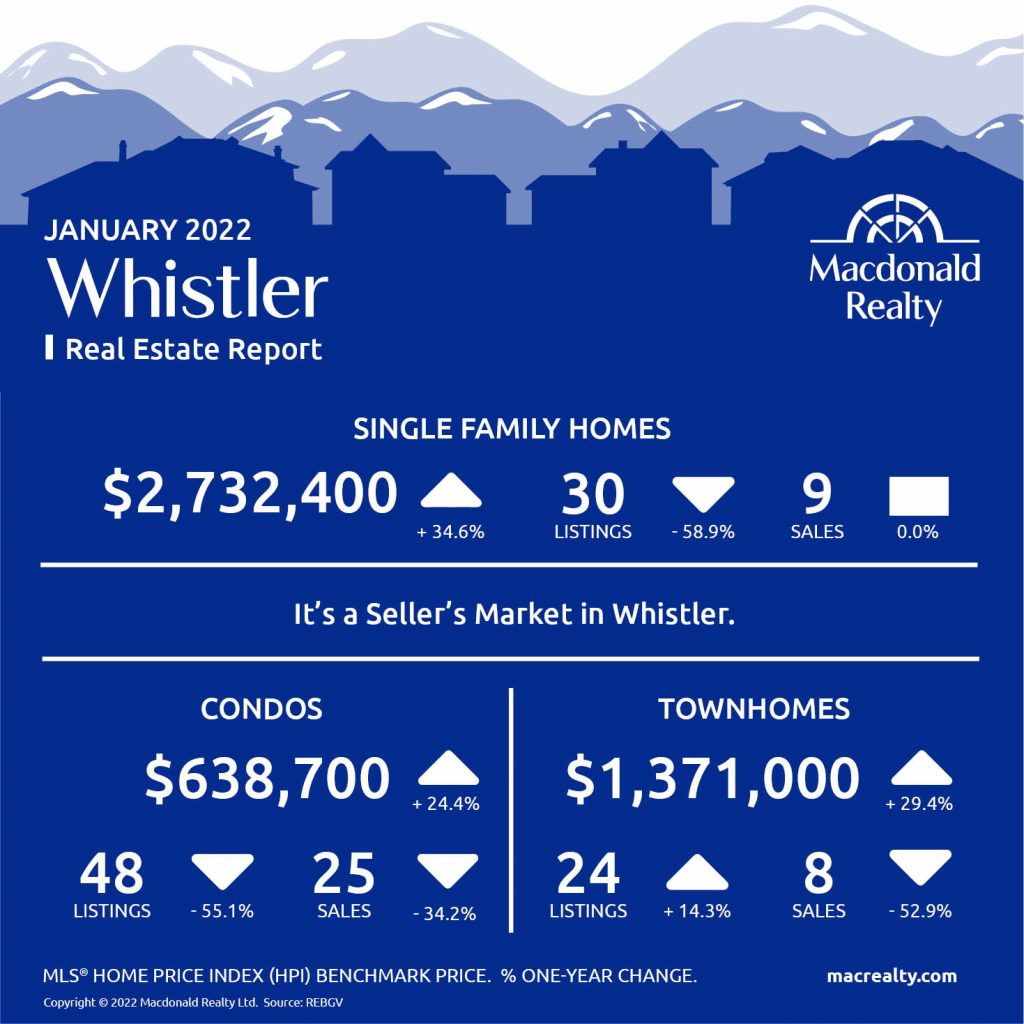
Whistler
In January 2022, there were 9 sales of detached homes and 30 active listings. The benchmark sale price was $2,732,400.
The condo market had 25 sales and 48 active listings at the end of the month. The benchmark sale price was $638,700.
The townhome market had 8 sales and the active listings were 24. The benchmark sale price was $1,371,000.
It’s a Seller’s market in Whistler.
Squamish
In January 2022, there were 13 sales of detached homes and 38 active listings. The benchmark sale price was $1,479,300.
The condo market had 7 sales and18 active listings at the end of the month. The benchmark sale price was $608,200.
The townhome market had 12 sales and, the active listings were 12. The benchmark sale price was $936,900.
It’s a Seller’s Market in Squamish.

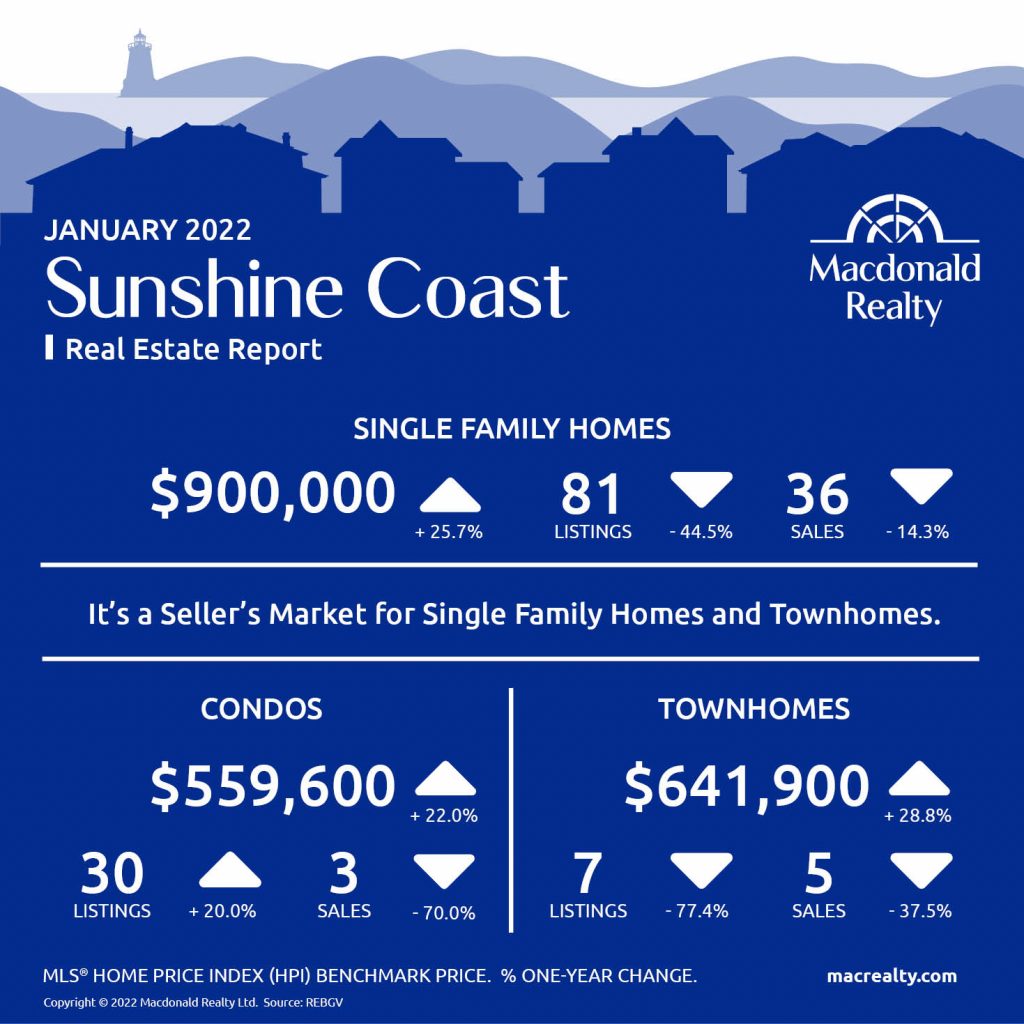
Sunshine Coast
In January 2022, there were 36 sales of detached homes and 81 active listings. The benchmark sale price was $900,000.
The condo market had 3 sales and 30 active listings at the end of the month.
The townhome market had 5 sales and, the active listings were 7.
It’s a Seller’s market for single family homes and townhomes in Sunshine Coast.
Looking for more information about the real estate market in specific neighbourhoods in Squamish, Whistler, and Sunshine Coast? Macdonald Realty has offices in Squamish, Whistler, and Sunshine Coast. Please email [email protected] or call 1-877-278-3888 to be matched with a REALTOR® working in your area.
MLS® Home Price Index (HPI) Benchmark Price
Average and median home prices are often misinterpreted, are affected by change in the mix of homes sold, and can swing dramatically from month to month (based on the types and prices of properties that sold in a given month). The MLS® HPI overcomes these shortcomings and uses the concept of a benchmark home, a notional home with common attributes of typical homes in a defined area. Visit www.housepriceindex.ca for more information.
This blog post is based on market data provided by the Real Estate Board of Greater Vancouver (REBGV) www.rebgv.org
by Macrealty Marketing Team | Feb 8, 2022 | Market Updates
Here are the latest real estate market statistics from Macdonald Realty on Greater Victoria, Saanich Peninsula, Parksville/Qualicum, and Nanaimo listings and sales in January 2022. Find all the infographics related to the January Market Statistics by visiting the Facebook Album.
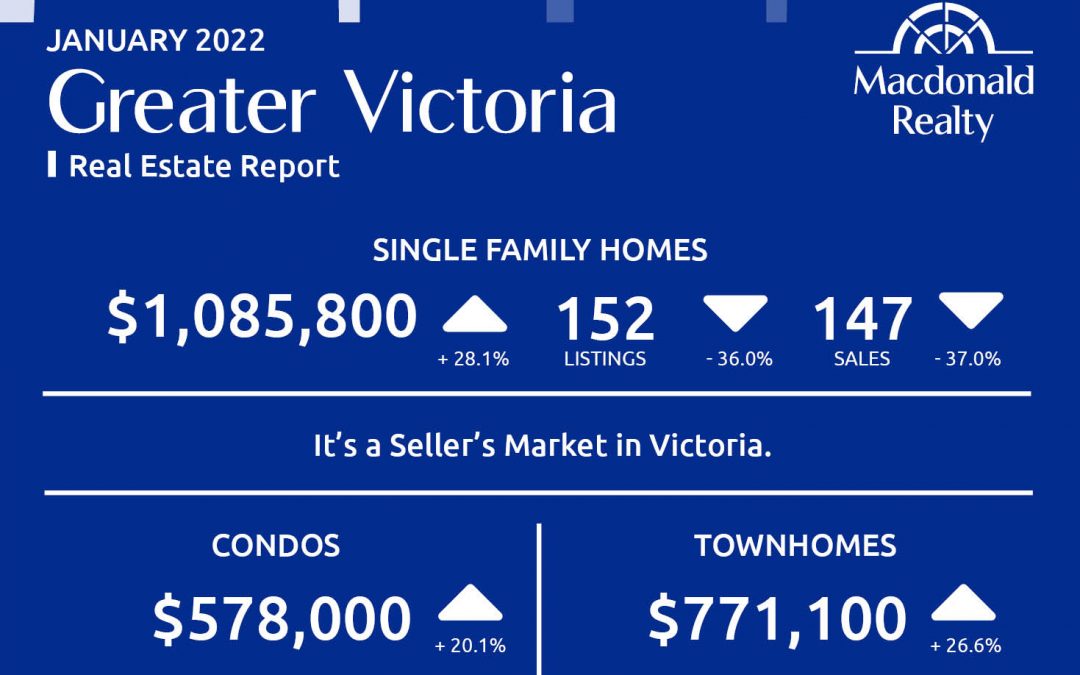
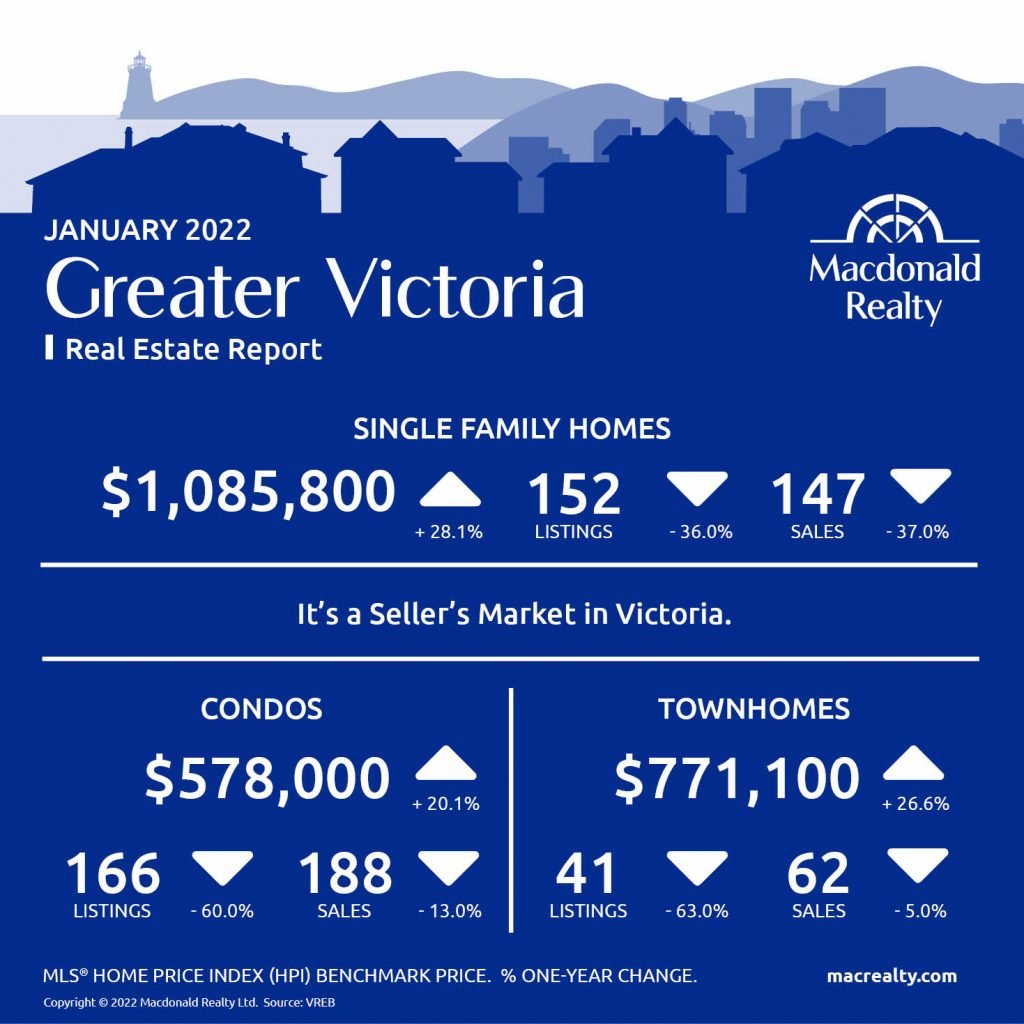
A total of 474 properties sold in the Victoria Real Estate Board region this January, 26.6 per cent fewer than the 646 properties sold in January 2021 but an 8.2 per cent increase from December 2021. Sales of condominiums were down 13 per cent from January 2021 with 188 units sold. Sales of single family homes decreased 39.7 per cent from January 2021 with 179 sold.
“A cursory glance at our sales numbers could lead to the quick conclusion that our market is slowing down,” says 2022 Victoria Real Estate Board President Karen Dinnie-Smyth. “But what we must consider is not only the number of homes that have sold, but also the number of homes which were for available for sale within the month. To put our inventory into context, last year broke the record for lowest inventory for the month of January. This January broke that record nearly in half and that lack of supply in the market really impacts what our end sales numbers are. Had we seen more homes for sale, it’s likely our result would have been many more sales.”
Greater Victoria
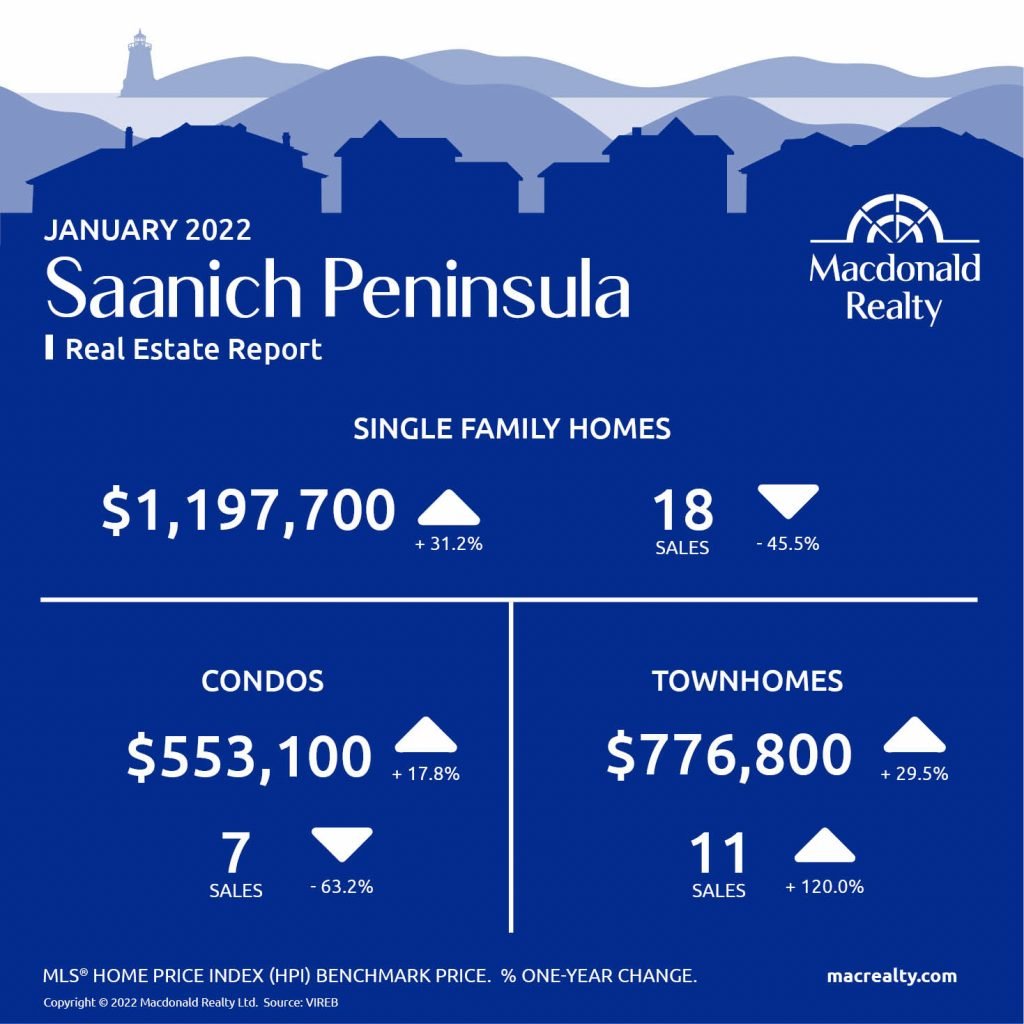
Saanich Peninsula
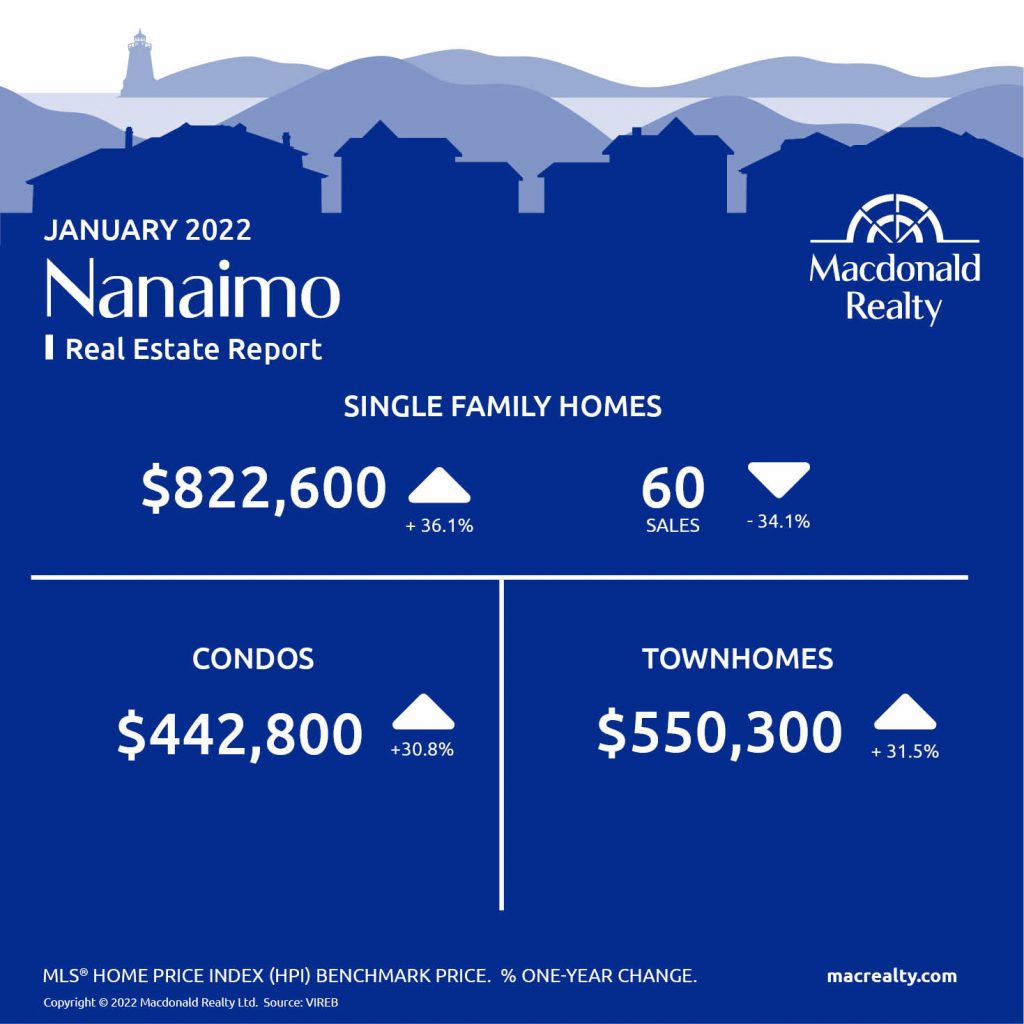
Nanaimo
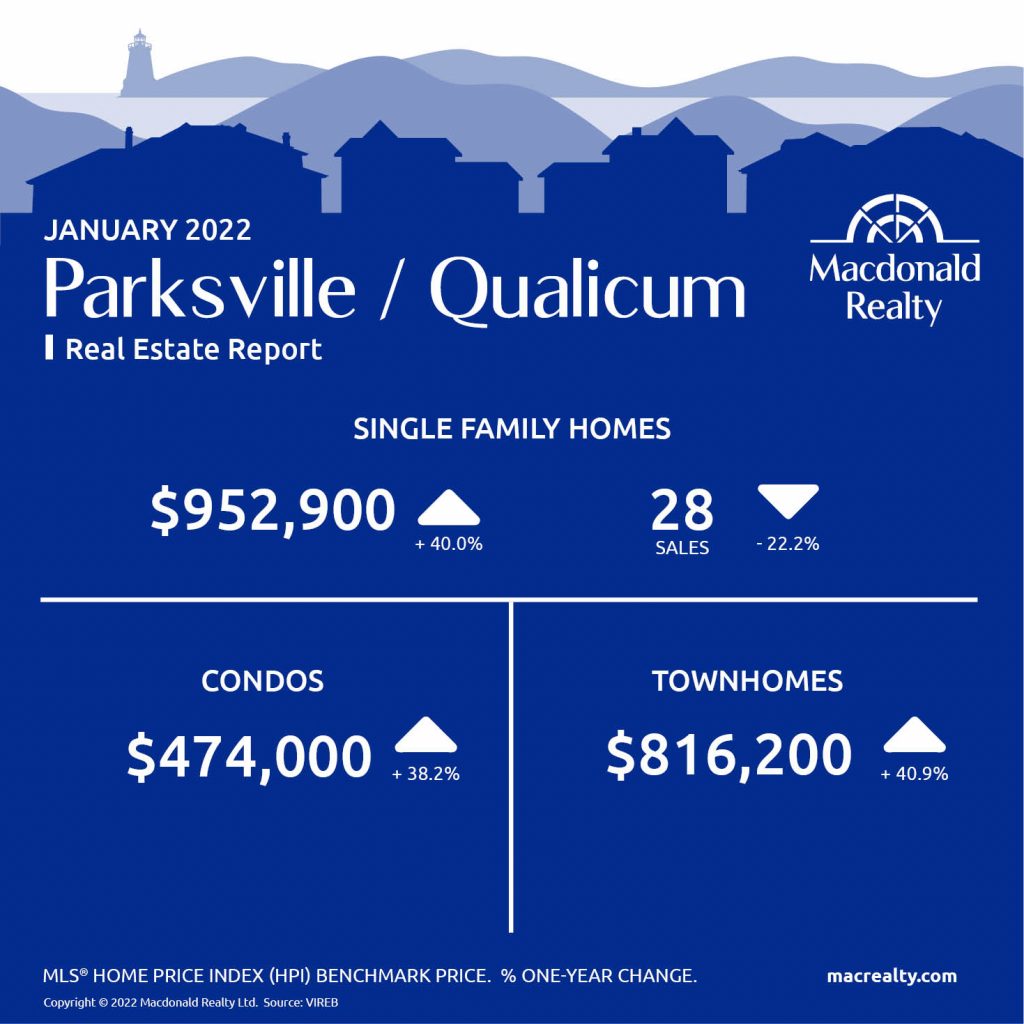
Parksville / Qualicum
Looking for more information about the real estate market in specific neighbourhoods in Victoria, Saanich Peninsula, Parksville, Nanaimo, Vancouver Island and the Gulf Islands?
Macdonald Realty has offices in downtown Victoria, Sidney, Parksville and Salt Spring Island. Please email [email protected] or call 1-877-278-3888 to be matched with a REALTOR® working in your area.
MLS® Home Price Index (HPI) Benchmark Price
Average and median home prices are often misinterpreted, are affected by change in the mix of homes sold, and can swing dramatically from month to month (based on the types and prices of properties that sold in a given month). The MLS® HPI overcomes these shortcomings and uses the concept of a benchmark home, a notional home with common attributes of typical homes in a defined area. Visit www.housepriceindex.ca for more information.
This blog post is based on market data provided by the Victoria Real Estate Board (VREB) www.vreb.org and the Vancouver Island Real Estate Board (VIREB) www.vireb.com. Market data from the VIREB includes listings and sales in Campbell River, Comox Valley, Cowichan Valley Nanaimo, Parksville/Qualicum, Port Alberni/West, North Island, and the Islands.
by Macrealty Marketing Team | Feb 8, 2022 | Market Updates
According to the Fraser Valley Real Estate Board, on the heels of the busiest year in history for Fraser Valley real estate, January activity saw the beginnings of a market rebalancing. Overall property sales – still the third highest ever for January – cooled compared to December while the volume of new listings improved significantly.
The Fraser Valley Real Estate Board processed a total of 1,310 sales of all property types on its Multiple Listing Service® (MLS®) in January 2022, a decrease of 23.7 per cent compared to January 2021, and 27.5 per cent lower compared to December 2021.
“It’s early days yet, but if this trend continues into spring, we could see an easing of the supply‐demand dynamic in our region. We have a long way to go to replenish our housing stock and bring much‐needed balance to the market, but this is a step in the right direction.”
Baldev Gill, Chief Executive Officer of the Board, said, “For almost two years, Fraser Valley REALTORS® have worked hard to help their clients navigate safely during the longest, most intense seller’s market in our Board’s history. This protracted pandemic market has resulted in considerable upward pressure on home prices. We anticipate the seasonal influx of new inventory, such as we’re already seeing, could provide a welcome, albeit far from fully adequate, easing of price growth moving into 2022.”
In January 2022, the average number of days to sell a single‐family detached home in the Fraser Valley was 25, compared to 35 days in January 2021; 12 days on average to sell a townhome and 17 days for apartments, compared to 28 and 37 days respectively, in January of last year.
Find all the infographics related to the January Market Statistics by visiting the Facebook Album.
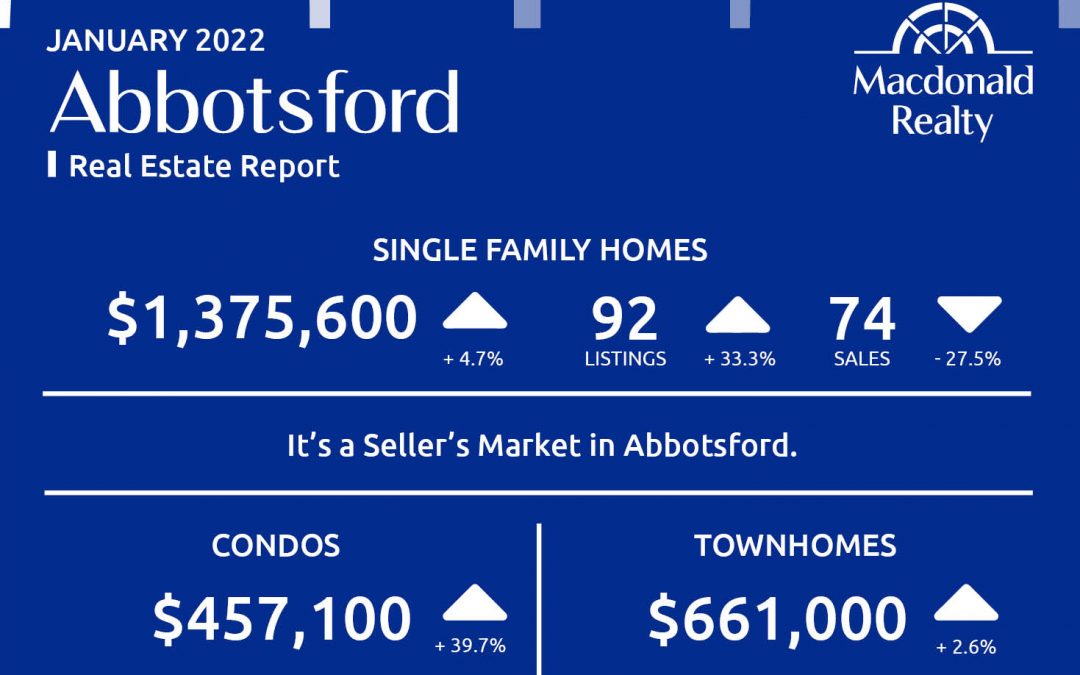
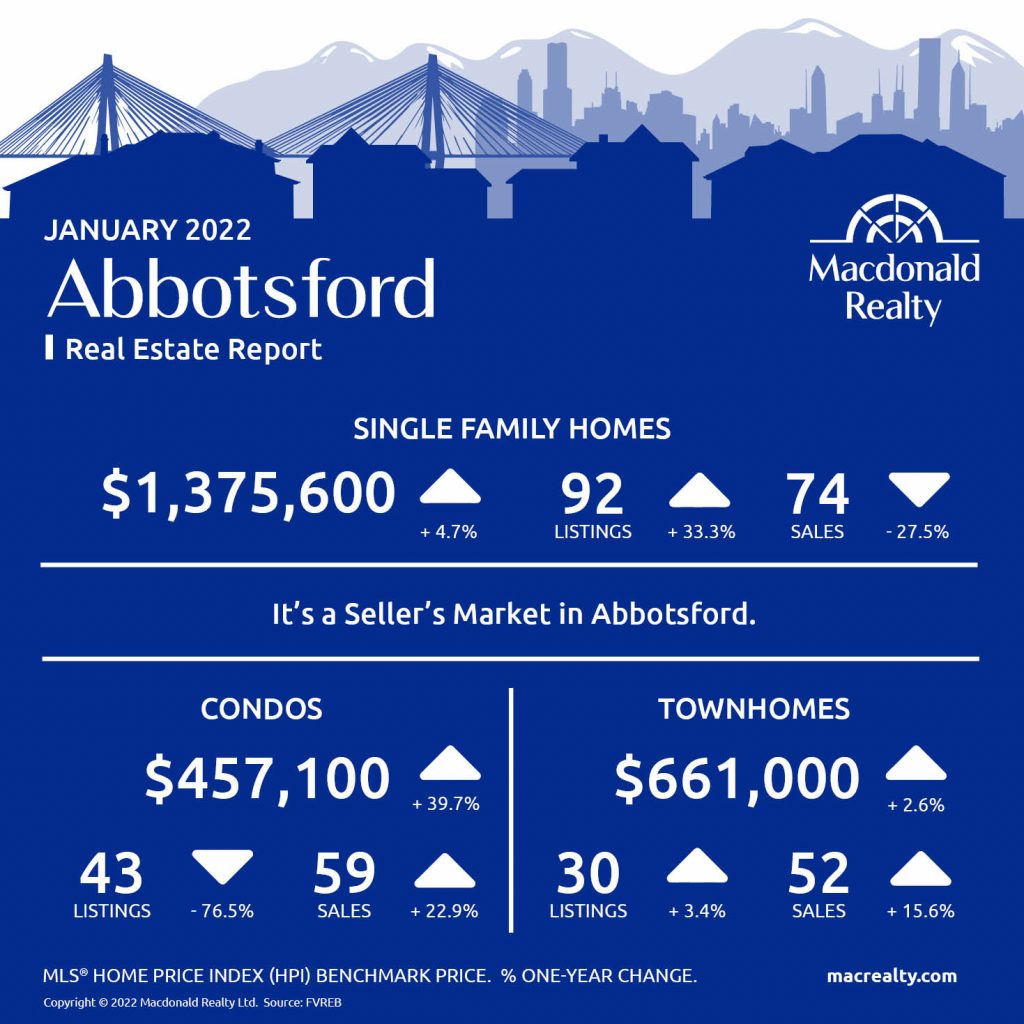
Abbotsford
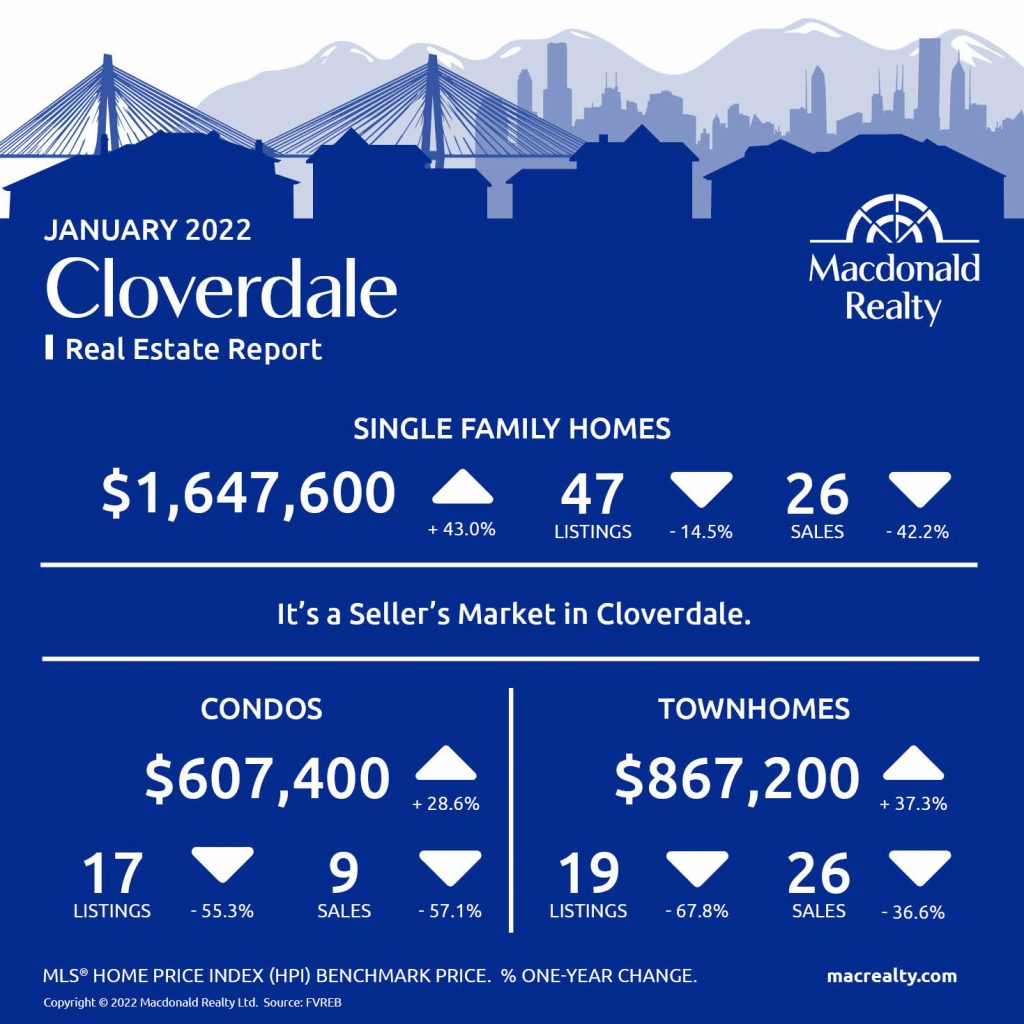
Cloverdale
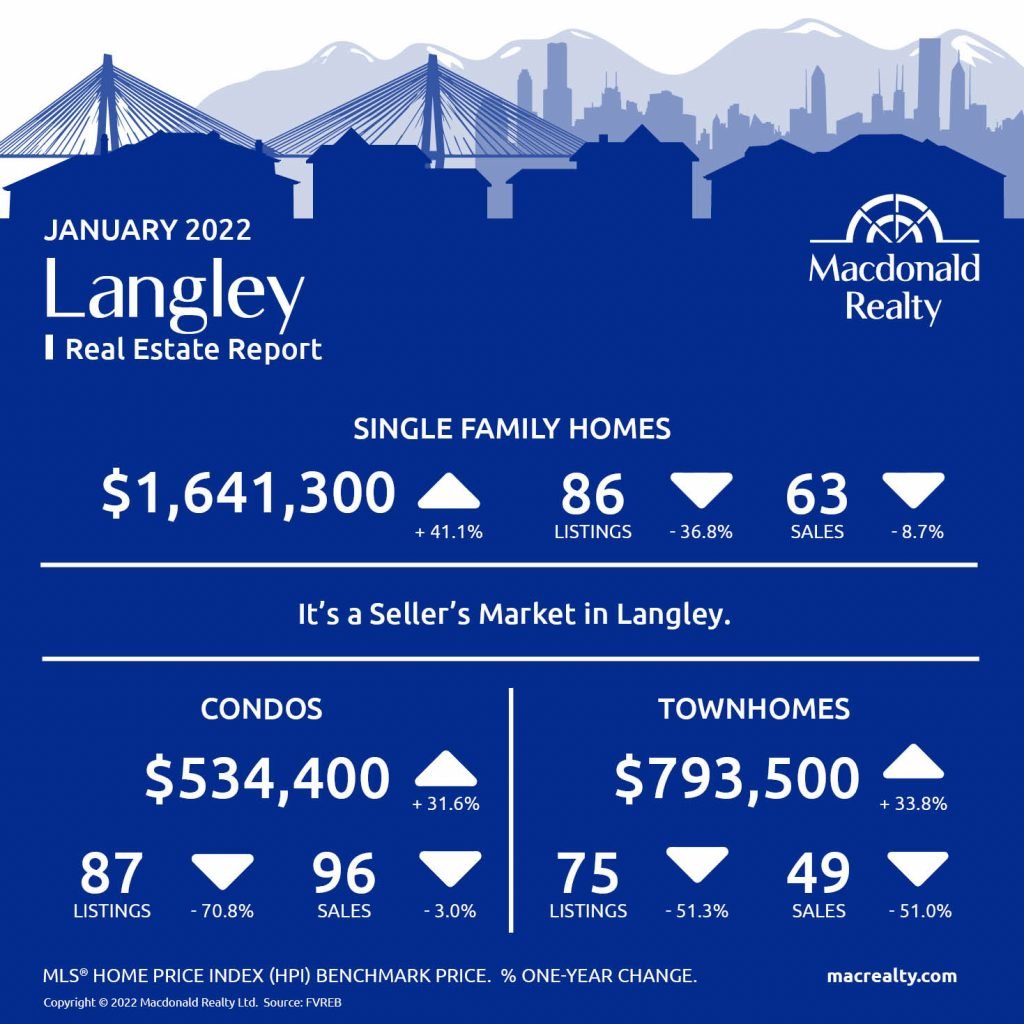
Langley
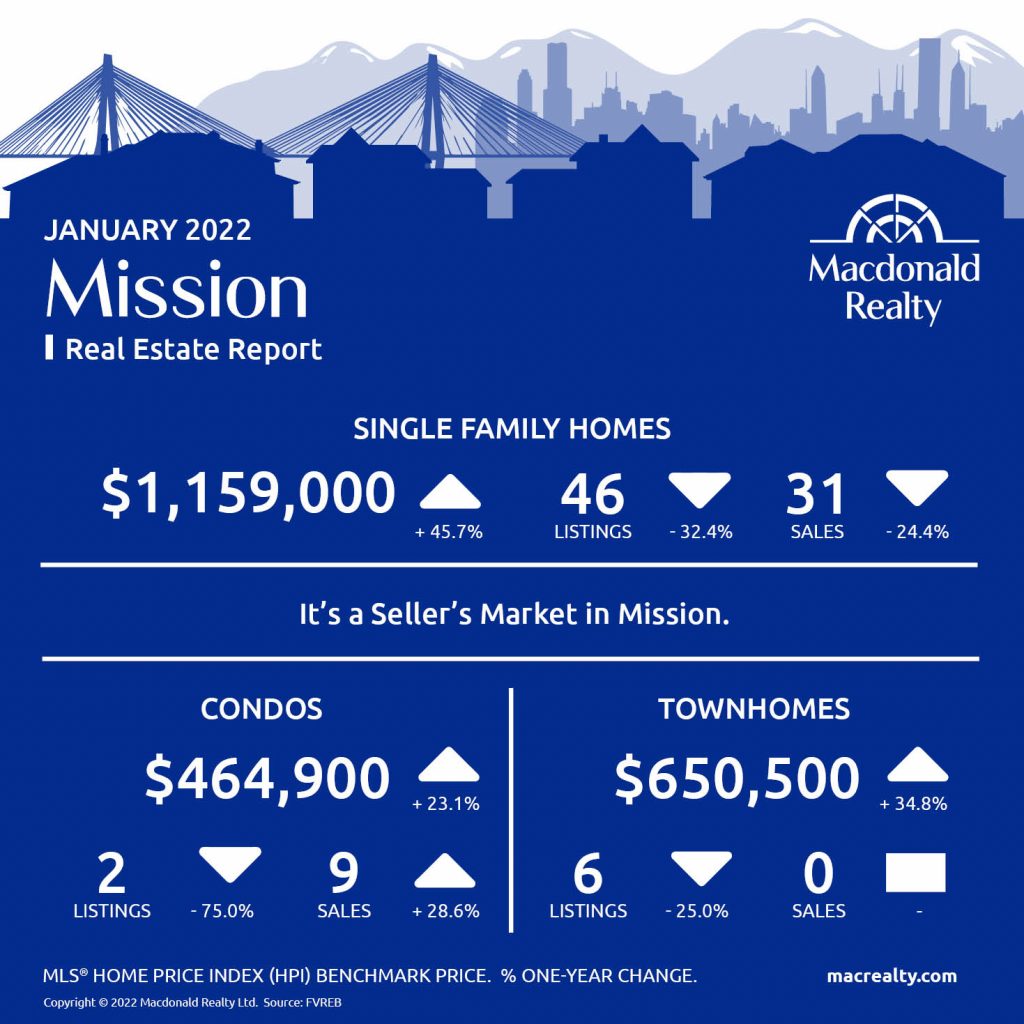
Mission
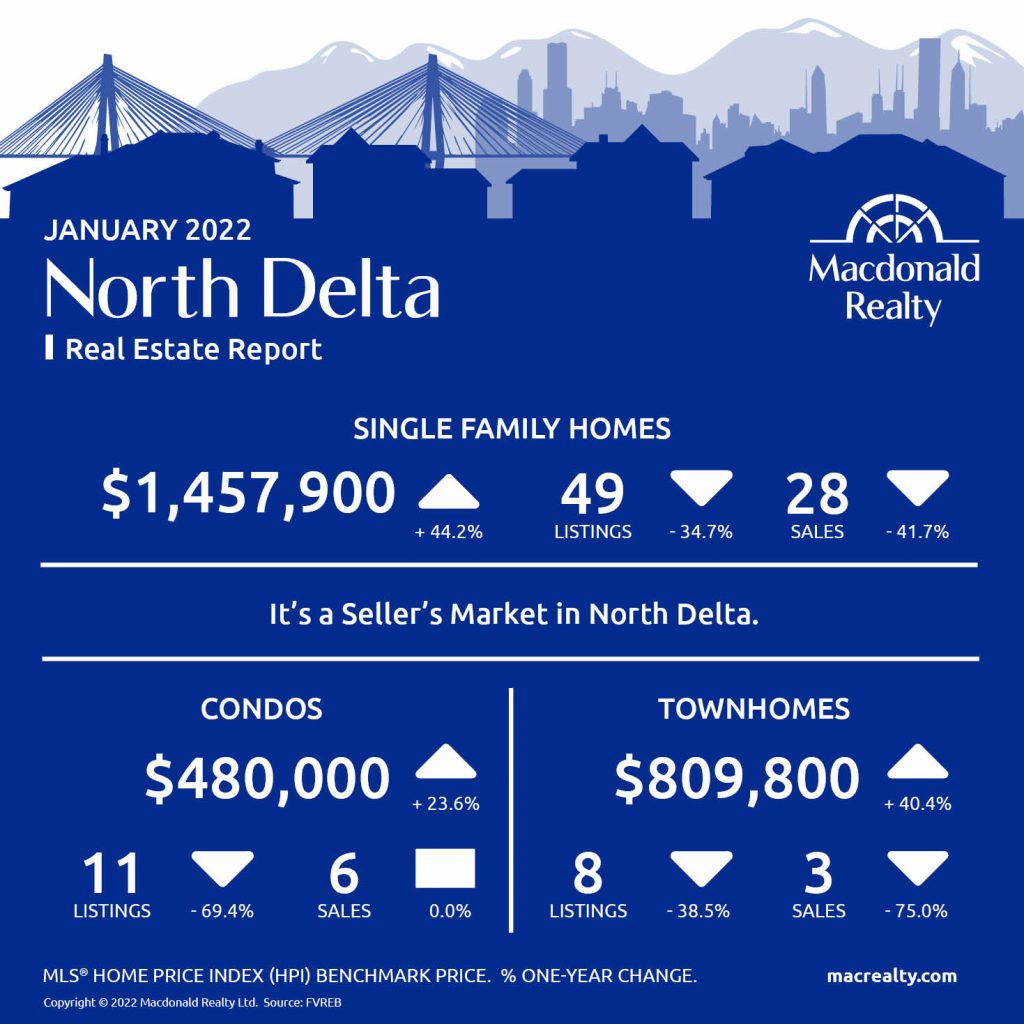
North Delta
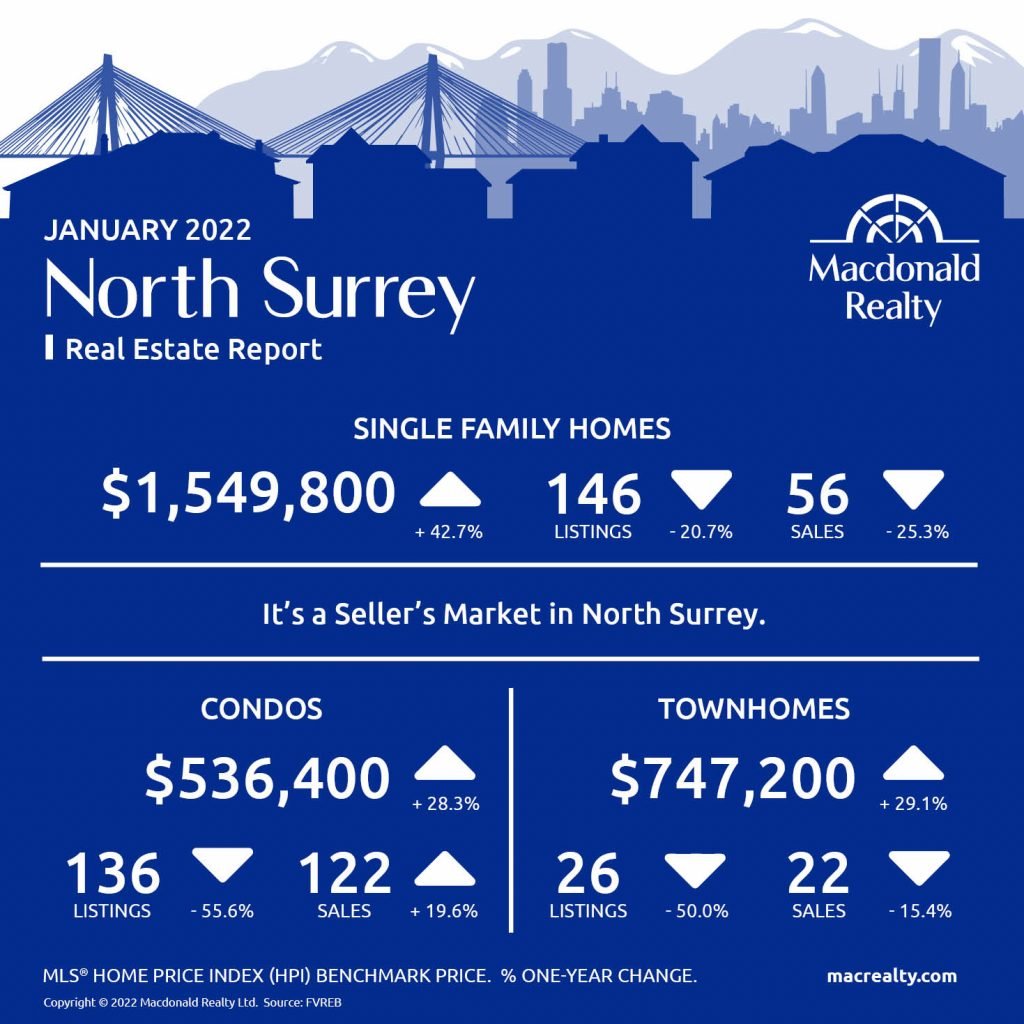
North Surrey
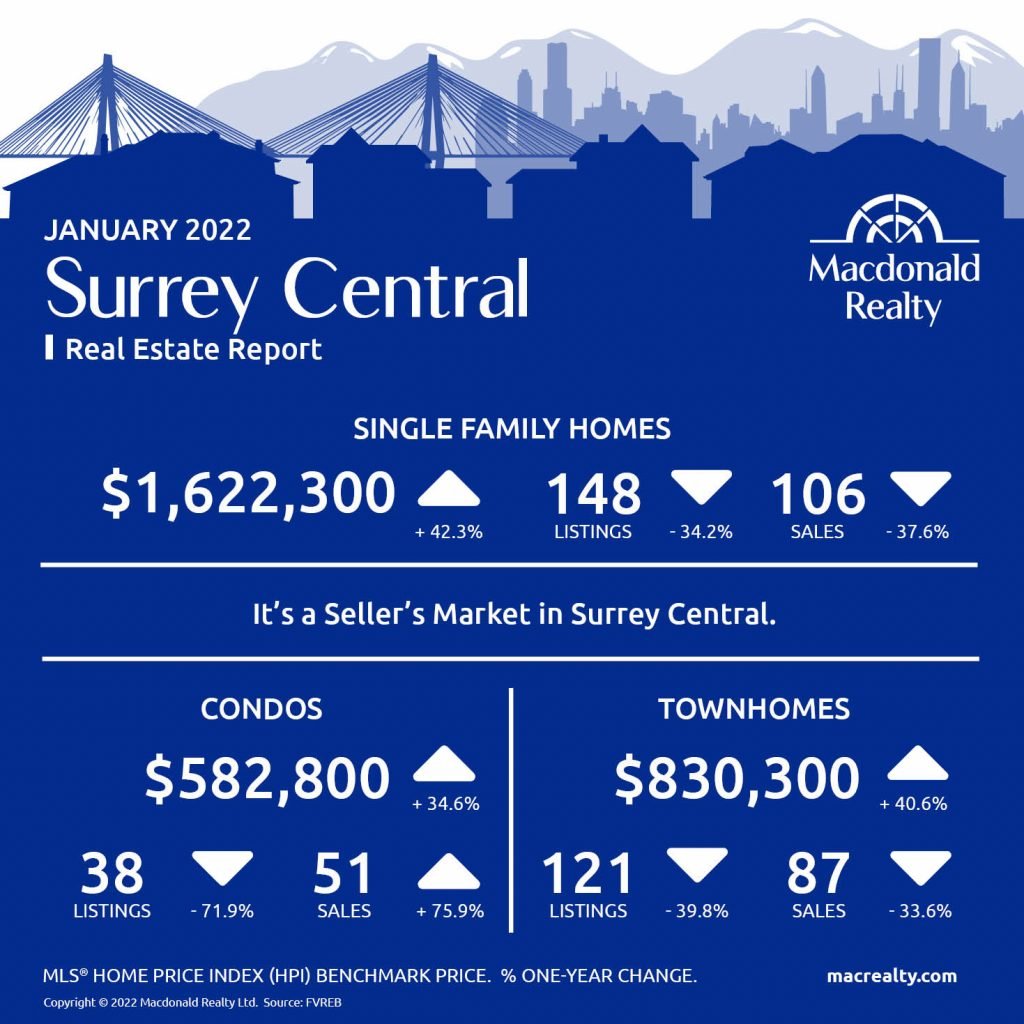
Surrey Central
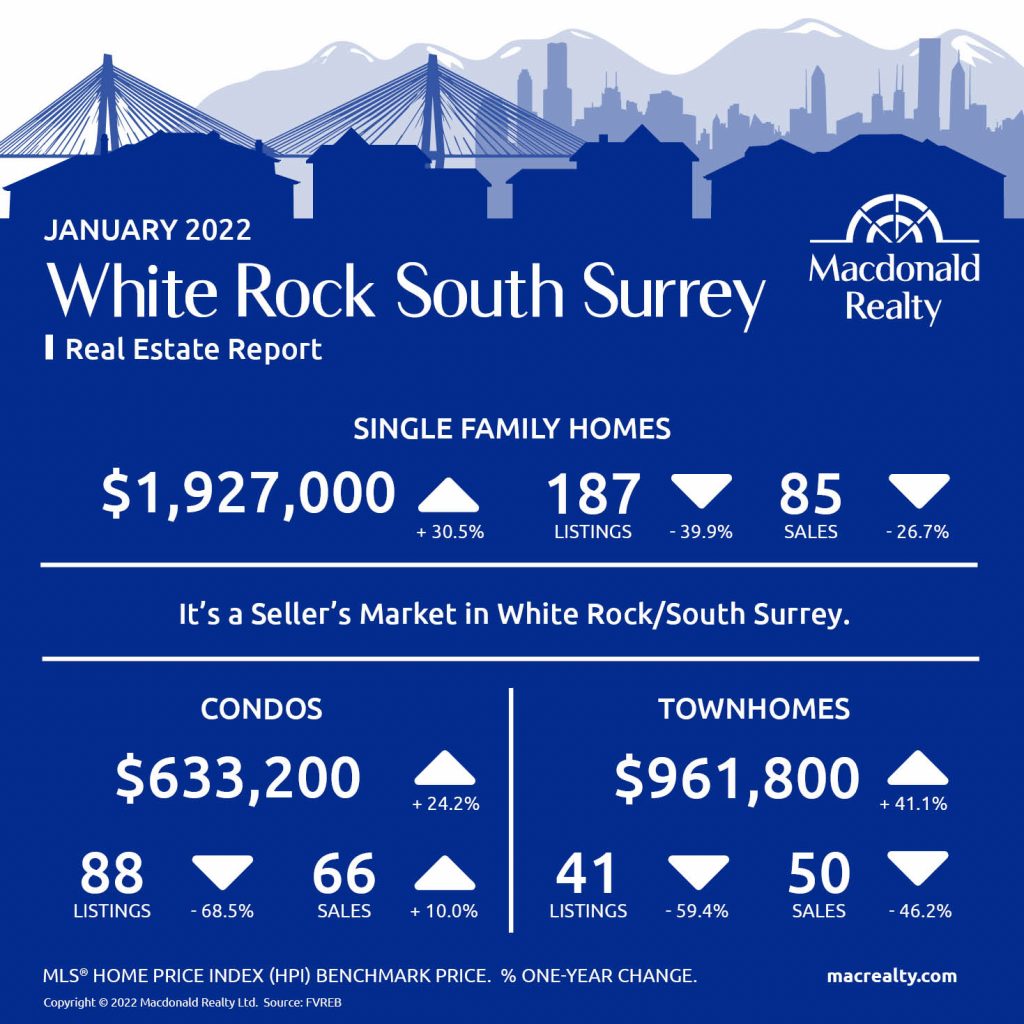
White Rock / South Surrey
Looking for more information about the real estate market in specific neighbourhoods in Surrey, Langley and Fraser Valley?
Macdonald Realty has offices in North Delta, White Rock/South Surrey, and Langley. Please email [email protected] or call 1-877-278-3888 to be matched with a REALTOR® working in your area.
MLS® Home Price Index (HPI) Benchmark Price
Average and median home prices are often misinterpreted, are affected by change in the mix of homes sold, and can swing dramatically from month to month (based on the types and prices of properties that sold in a given month). The MLS® HPI overcomes these shortcomings and uses the concept of a benchmark home, a notional home with common attributes of typical homes in a defined area. Visit www.housepriceindex.ca for more information.
This blog post is based on market data provided by the Fraser Valley Real Estate Board (FVREB) www.fvreb.bc.ca