by Macrealty Marketing Team | Apr 8, 2022 | Market Updates
Here are the latest real estate market statistics from Macdonald Realty on Squamish, Whistler, and Sunshine Coast listings and sales in March 2022.
Find all the infographics related to the March Market Statistics by visiting the Facebook Album.
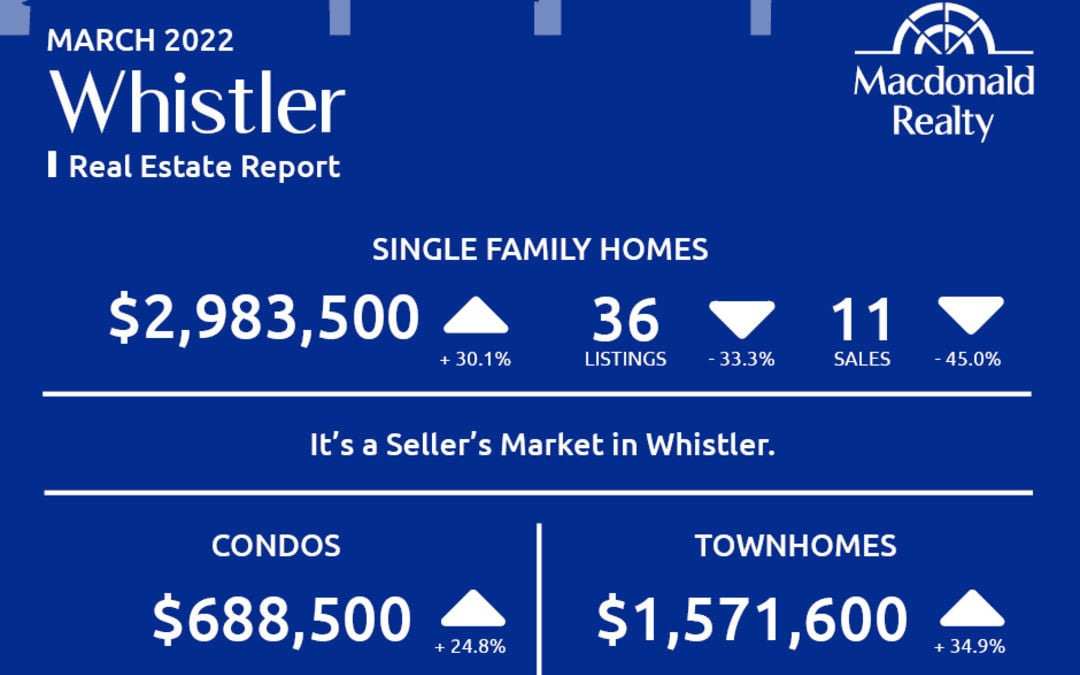
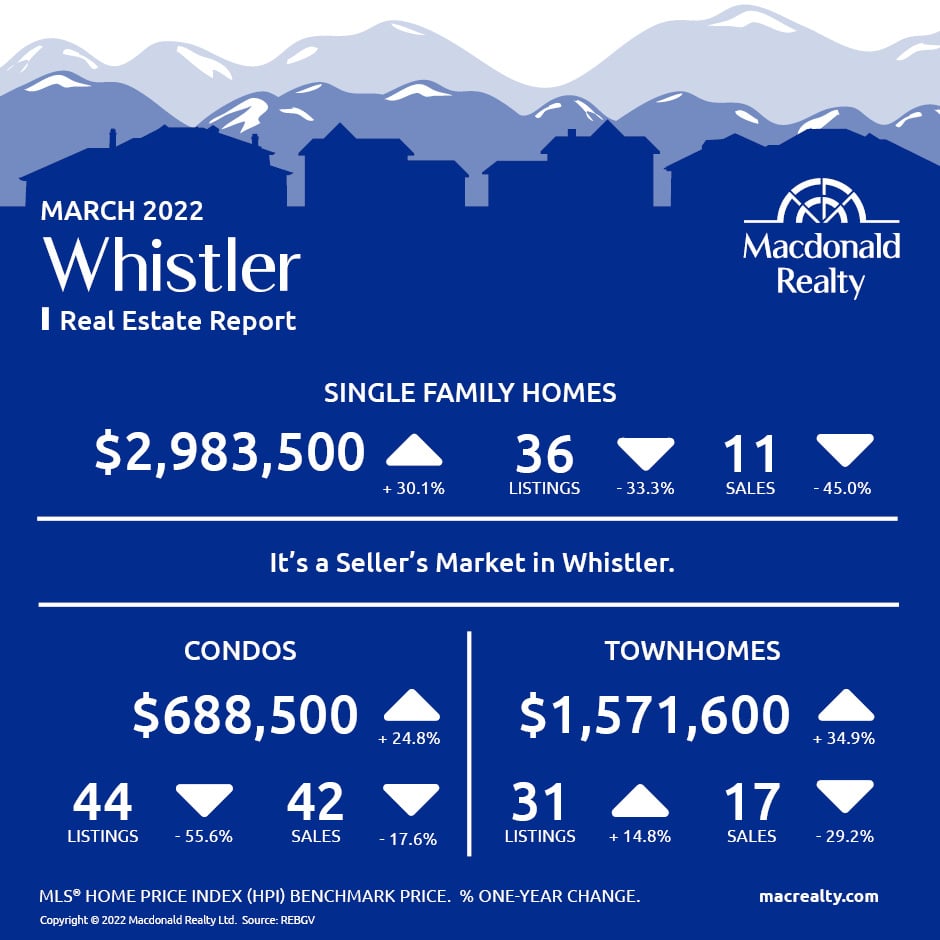
Whistler
In March 2022, there were 11 sales of detached homes and 36 active listings. The benchmark sale price was $2,983,500.
The condo market had 42 sales and 44 active listings at the end of the month. The benchmark sale price was $688,500.
The townhome market had 17 sales and the active listings were 31. The benchmark sale price was $1,571,600.
It’s a Seller’s market for condos and townhomes in Whistler.
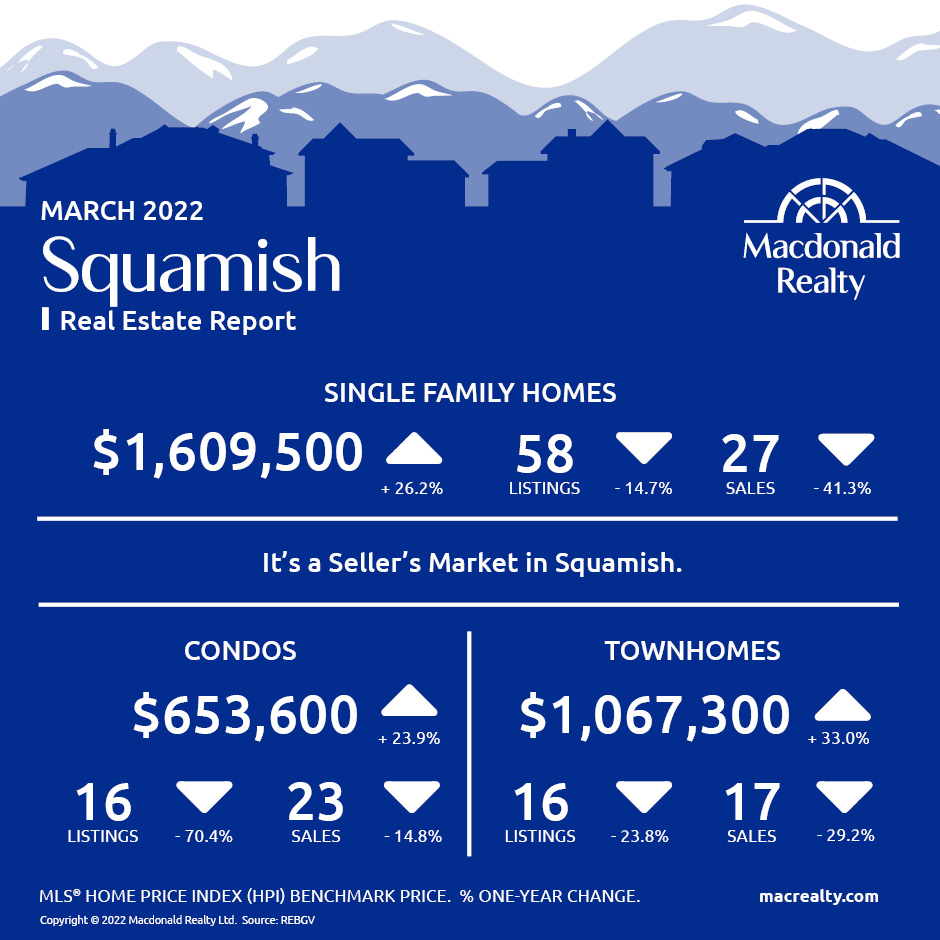
Squamish
In March 2022, there were 27 sales of detached homes and 58 active listings. The benchmark sale price was $1,609,500.
The condo market had 23 sales and 16 active listings at the end of the month. The benchmark sale price was $653,600.
The townhome market had 17 sales and, the active listings were 16. The benchmark sale price was $1,067,300.
It’s a Seller’s Market in Squamish.
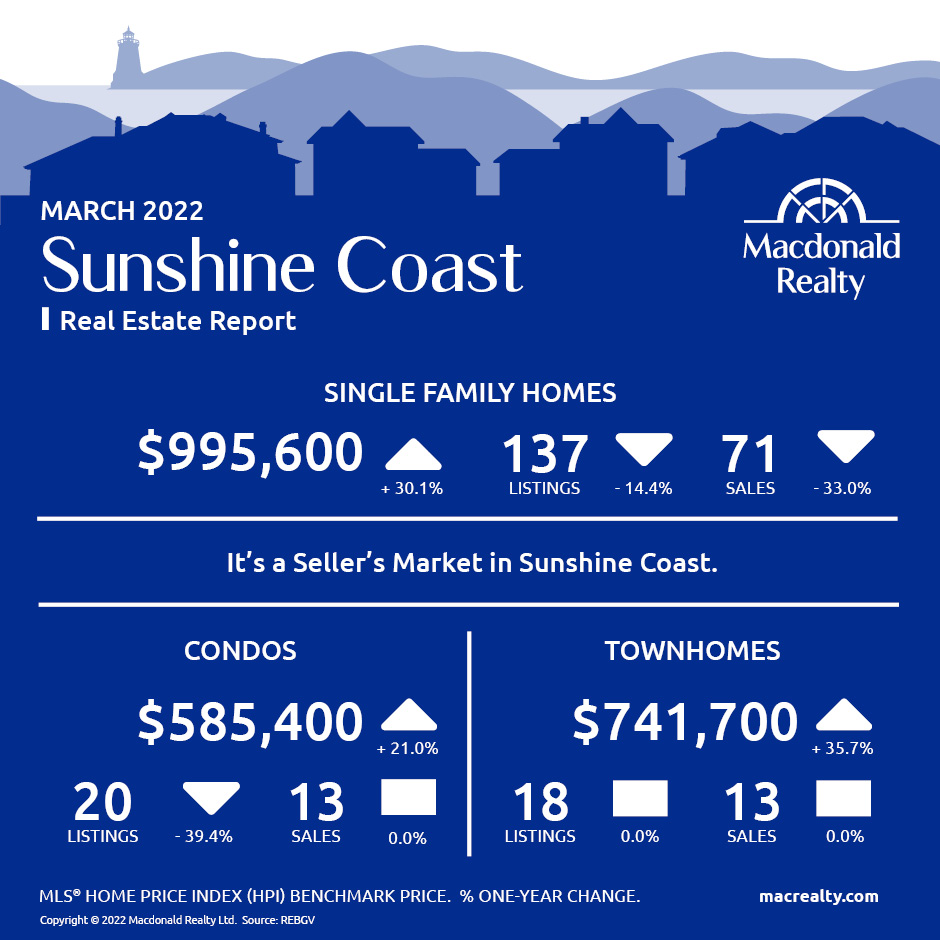
Sunshine Coast
In March 2022, there were 71 sales of detached homes and 137 active listings. The benchmark sale price was $995,600.
The condo market had 13 sales and 20 active listings at the end of the month.
The townhome market had 13 sales and, the active listings were 18.
It’s a Seller’s market in Sunshine Coast.
Looking for more information about the real estate market in specific neighbourhoods in Squamish, Whistler, and Sunshine Coast? Macdonald Realty has offices in Squamish, Whistler, and Sunshine Coast. Please email [email protected] or call 1-877-278-3888 to be matched with a REALTOR® working in your area.
MLS® Home Price Index (HPI) Benchmark Price
Average and median home prices are often misinterpreted, are affected by change in the mix of homes sold, and can swing dramatically from month to month (based on the types and prices of properties that sold in a given month). The MLS® HPI overcomes these shortcomings and uses the concept of a benchmark home, a notional home with common attributes of typical homes in a defined area. Visit www.housepriceindex.ca for more information.
This blog post is based on market data provided by the Real Estate Board of Greater Vancouver (REBGV) www.rebgv.org
by Macrealty Marketing Team | Apr 5, 2022 | Market Updates
April 2022 – Lower Mainland Monthly Update (REBGV & FVREB)
Metro Vancouver & Fraser Valley sales continue to be strong, but show signs of slowing.
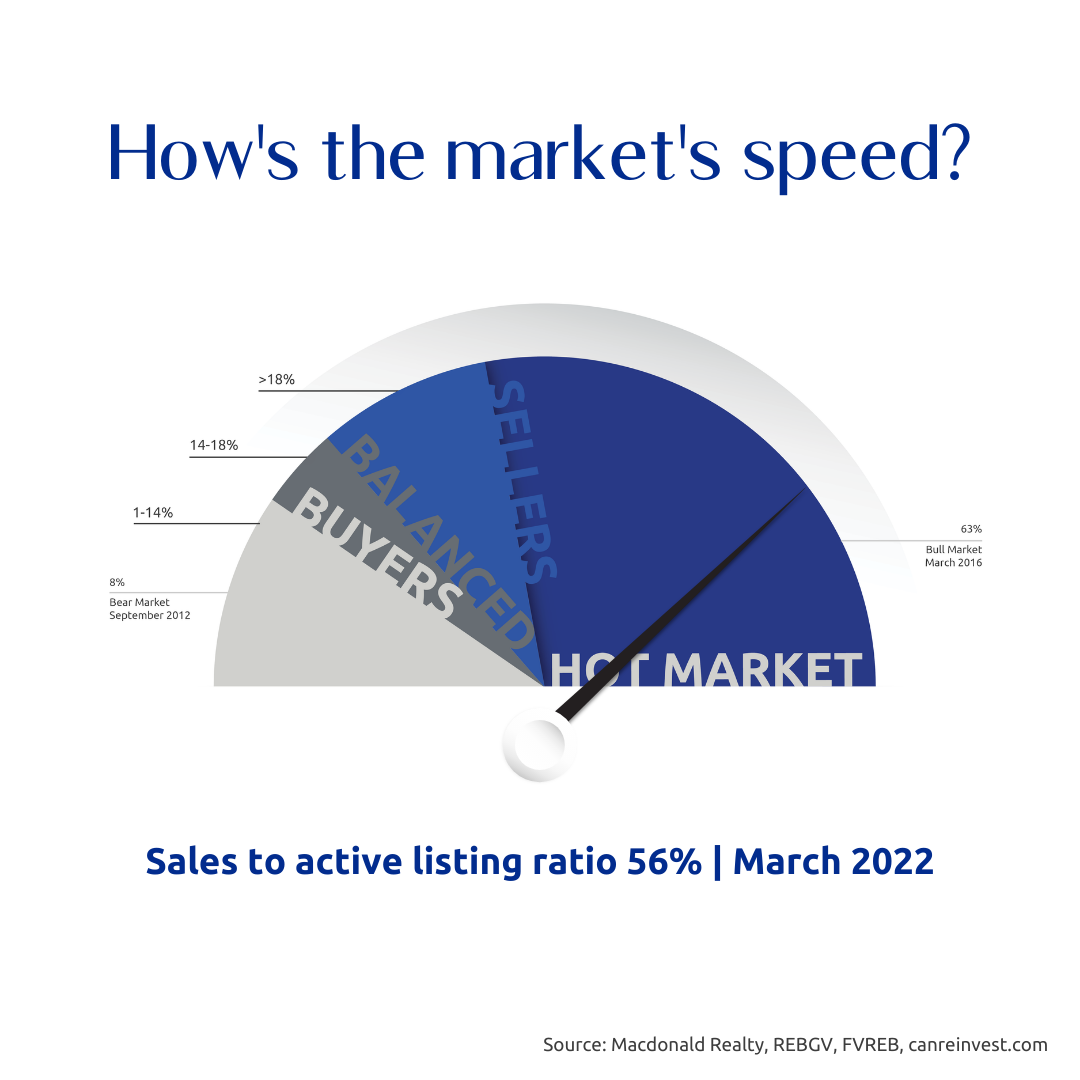
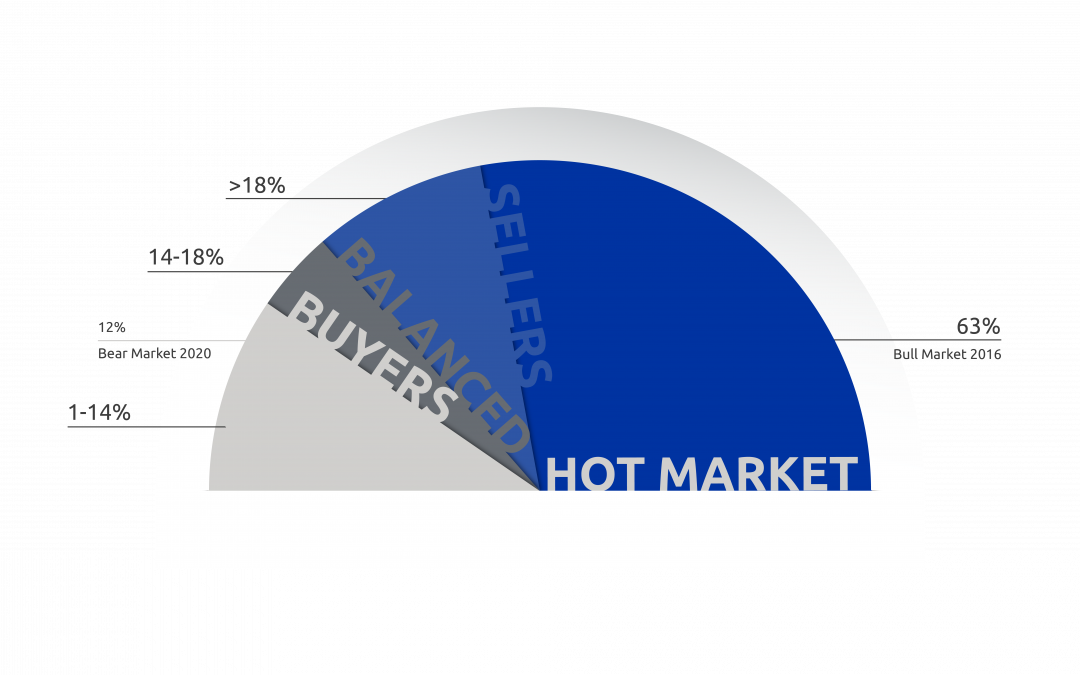
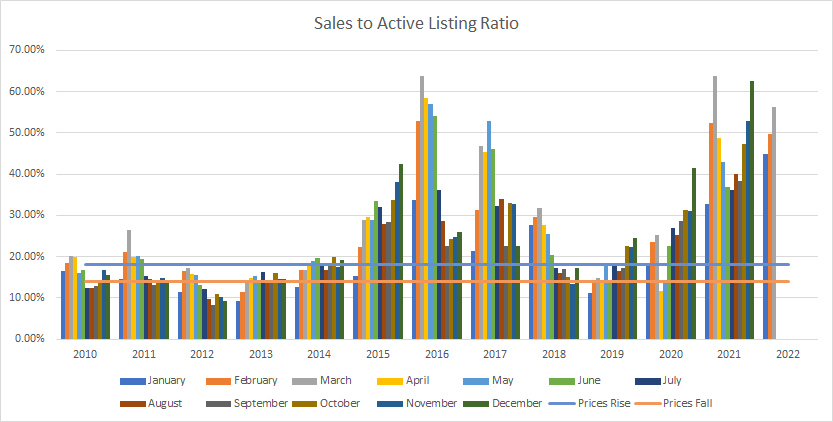
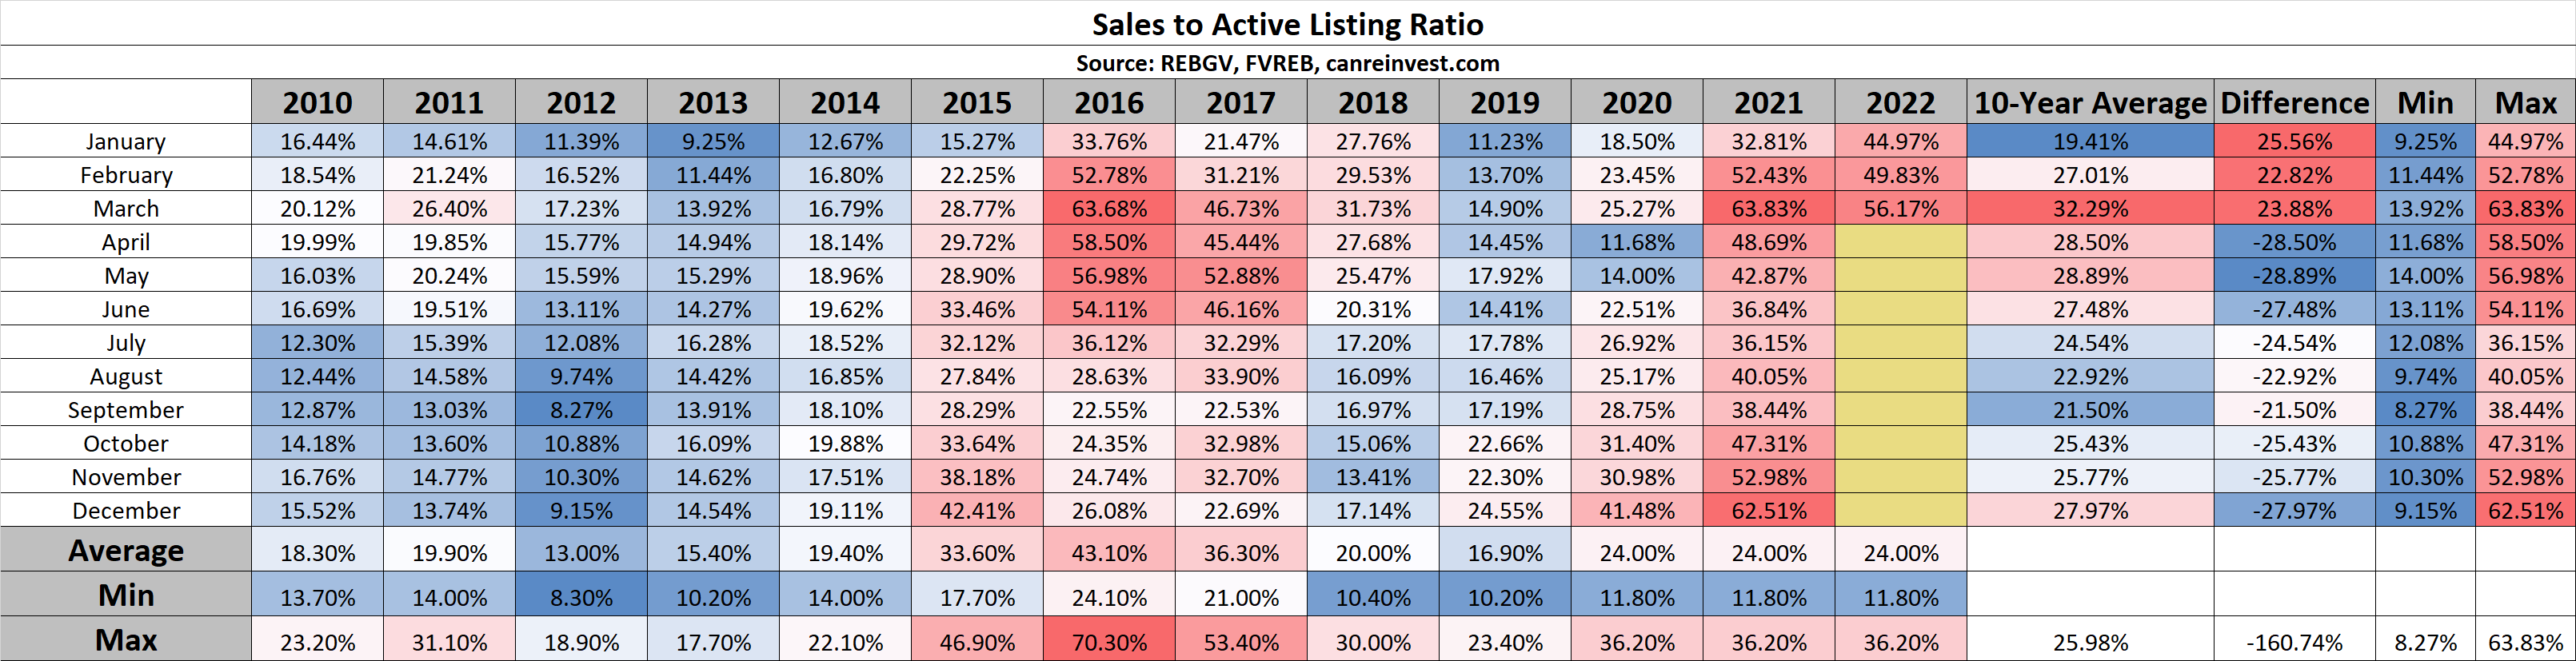
The most reliable indicator of market prices is the Sales to Active Listings Ratio (SAL). This is the ratio between the number of sales in a given month and the number of active listings at month-end.
In hotter markets in BC, a long-term analysis has shown that prices will usually act in the following ways:
- 7+ Months of Inventory (Under 14% SAL): Prices will likely DECLINE
- 5 – 7 Months of Inventory (14% – 18% SAL): Prices will likely be STABLE
- Less than 5.5 Months of Inventory (Over 18% SAL): Prices will likely RISE
Visit this link to learn more about house prices and inventory.
Sales
Sales: Metro Vancouver (combined @rebgv & @fvreb) sales continue to be strong, but show signs of slowing. 3rd highest March on record. 25% lower than in 2021, but 30% higher than the 10-year average
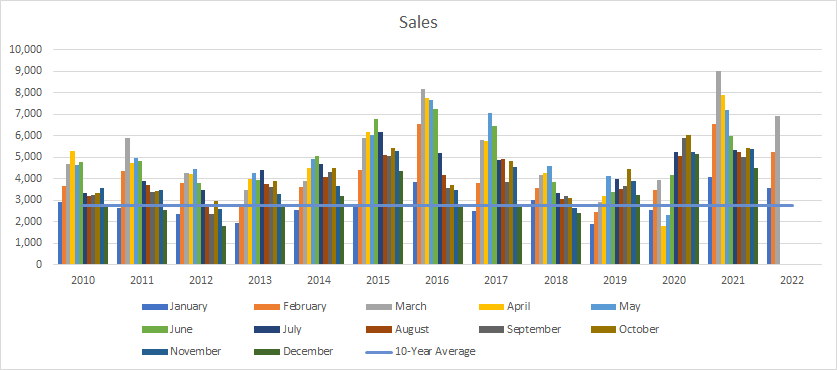
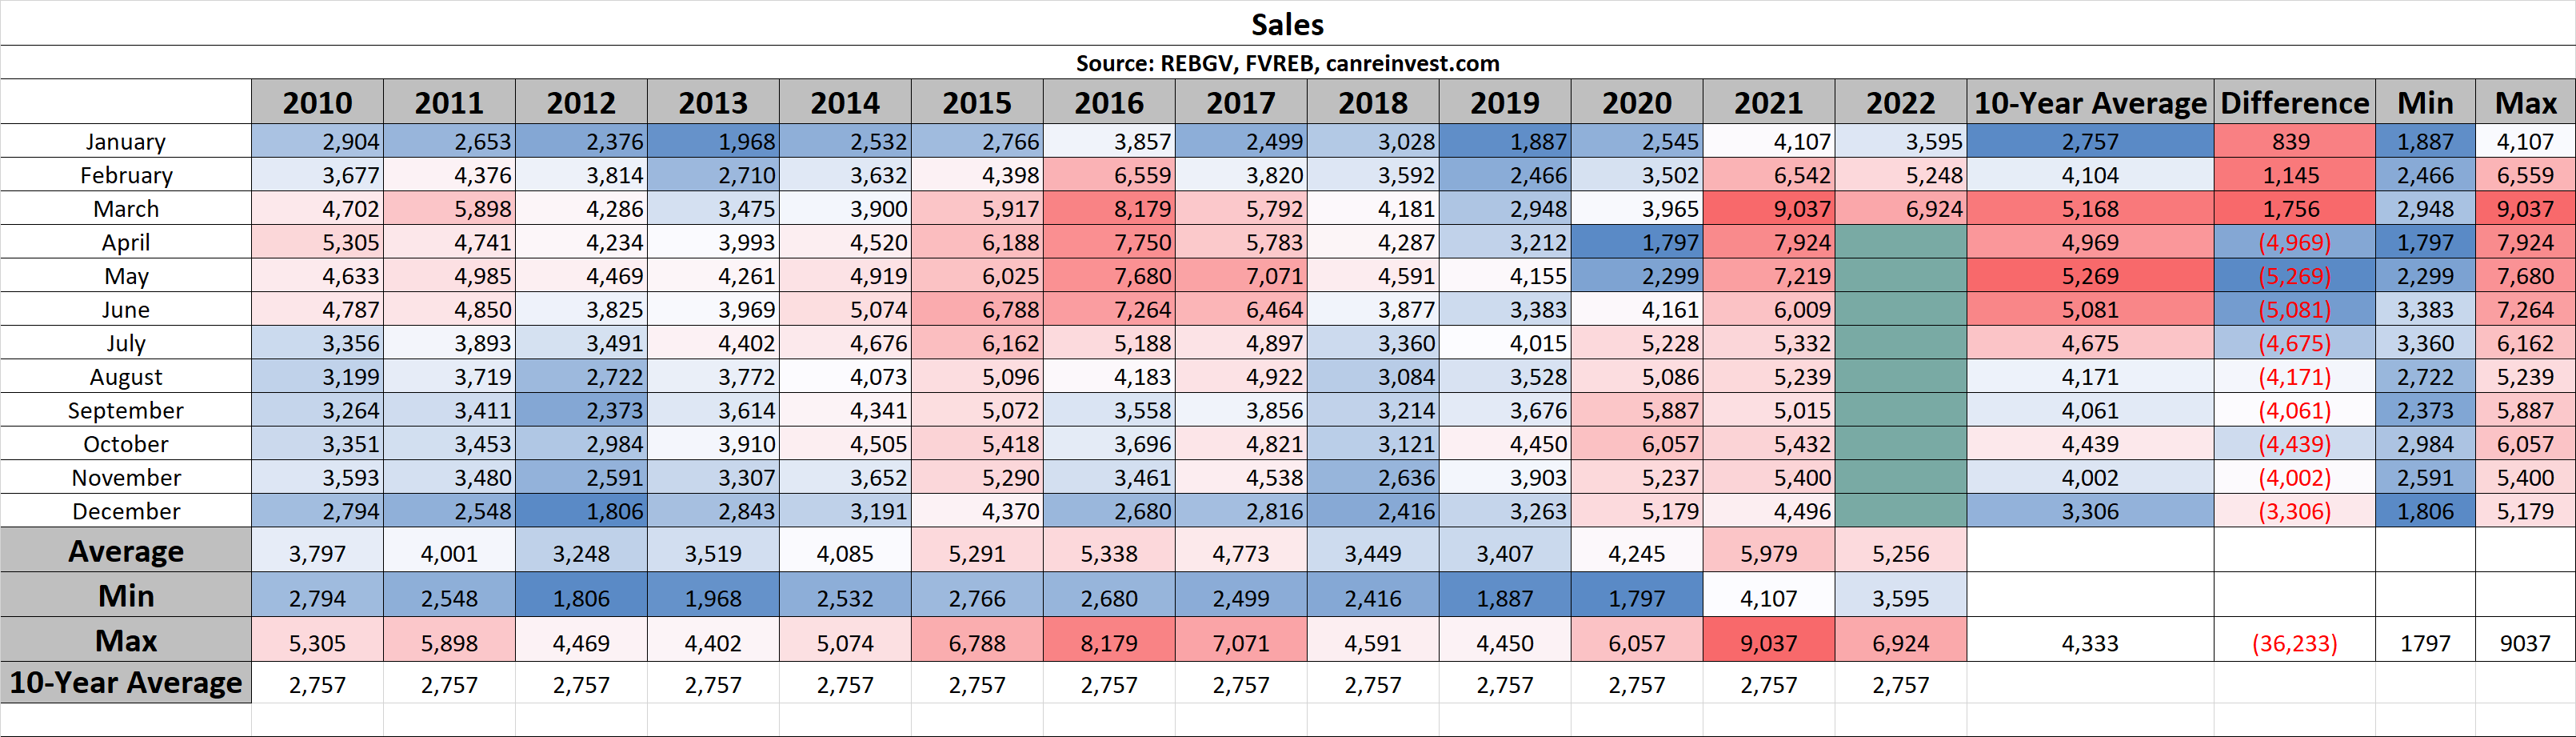
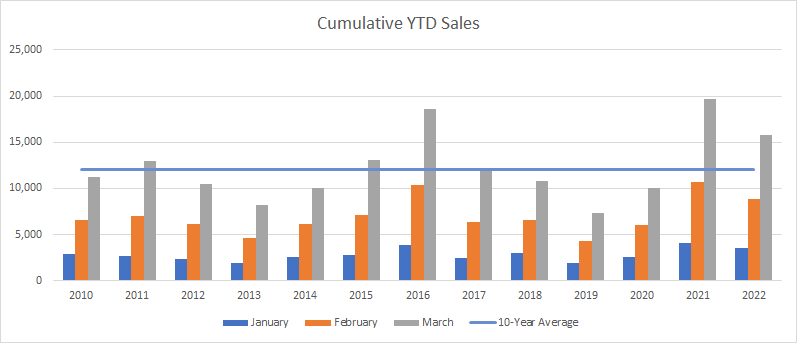
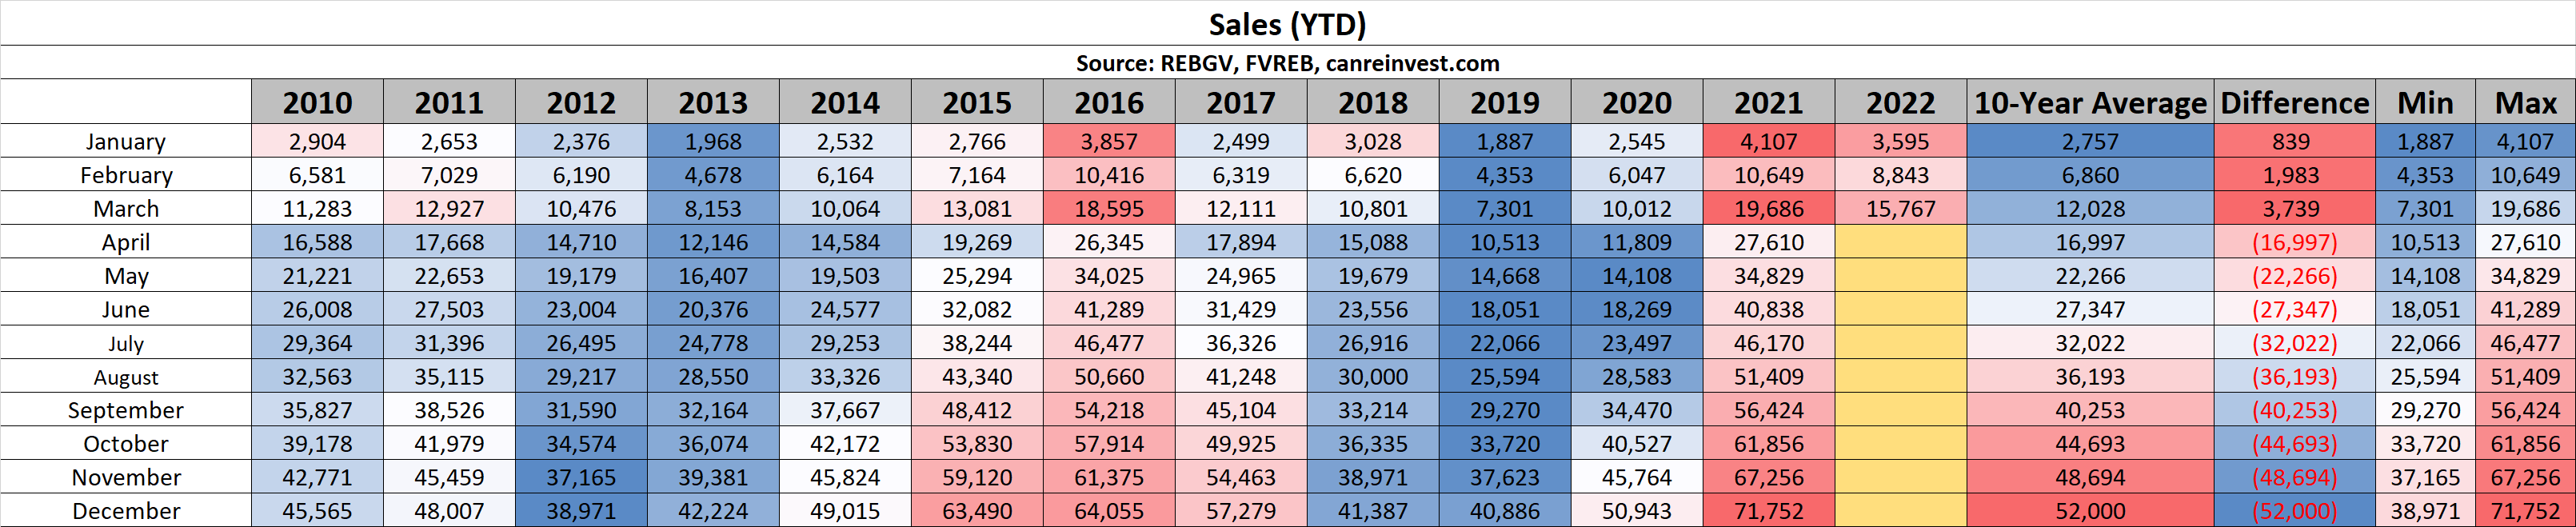
Cumulative Year-to-date Sales
YTD sales have moderated from 2021, but are still the 3rd highest on record (2021 #1; 2016 #2).
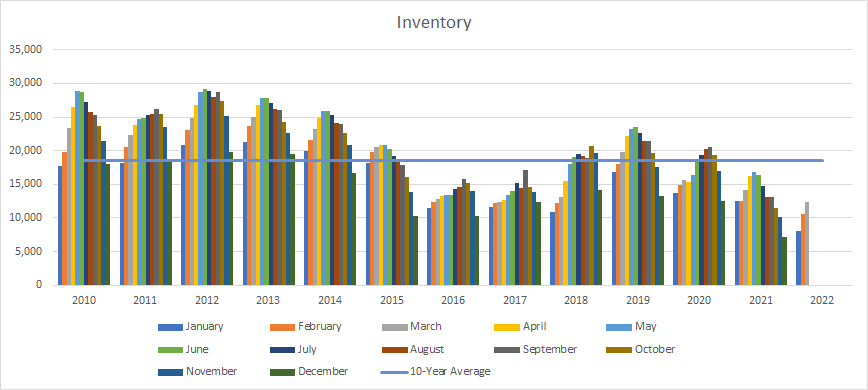
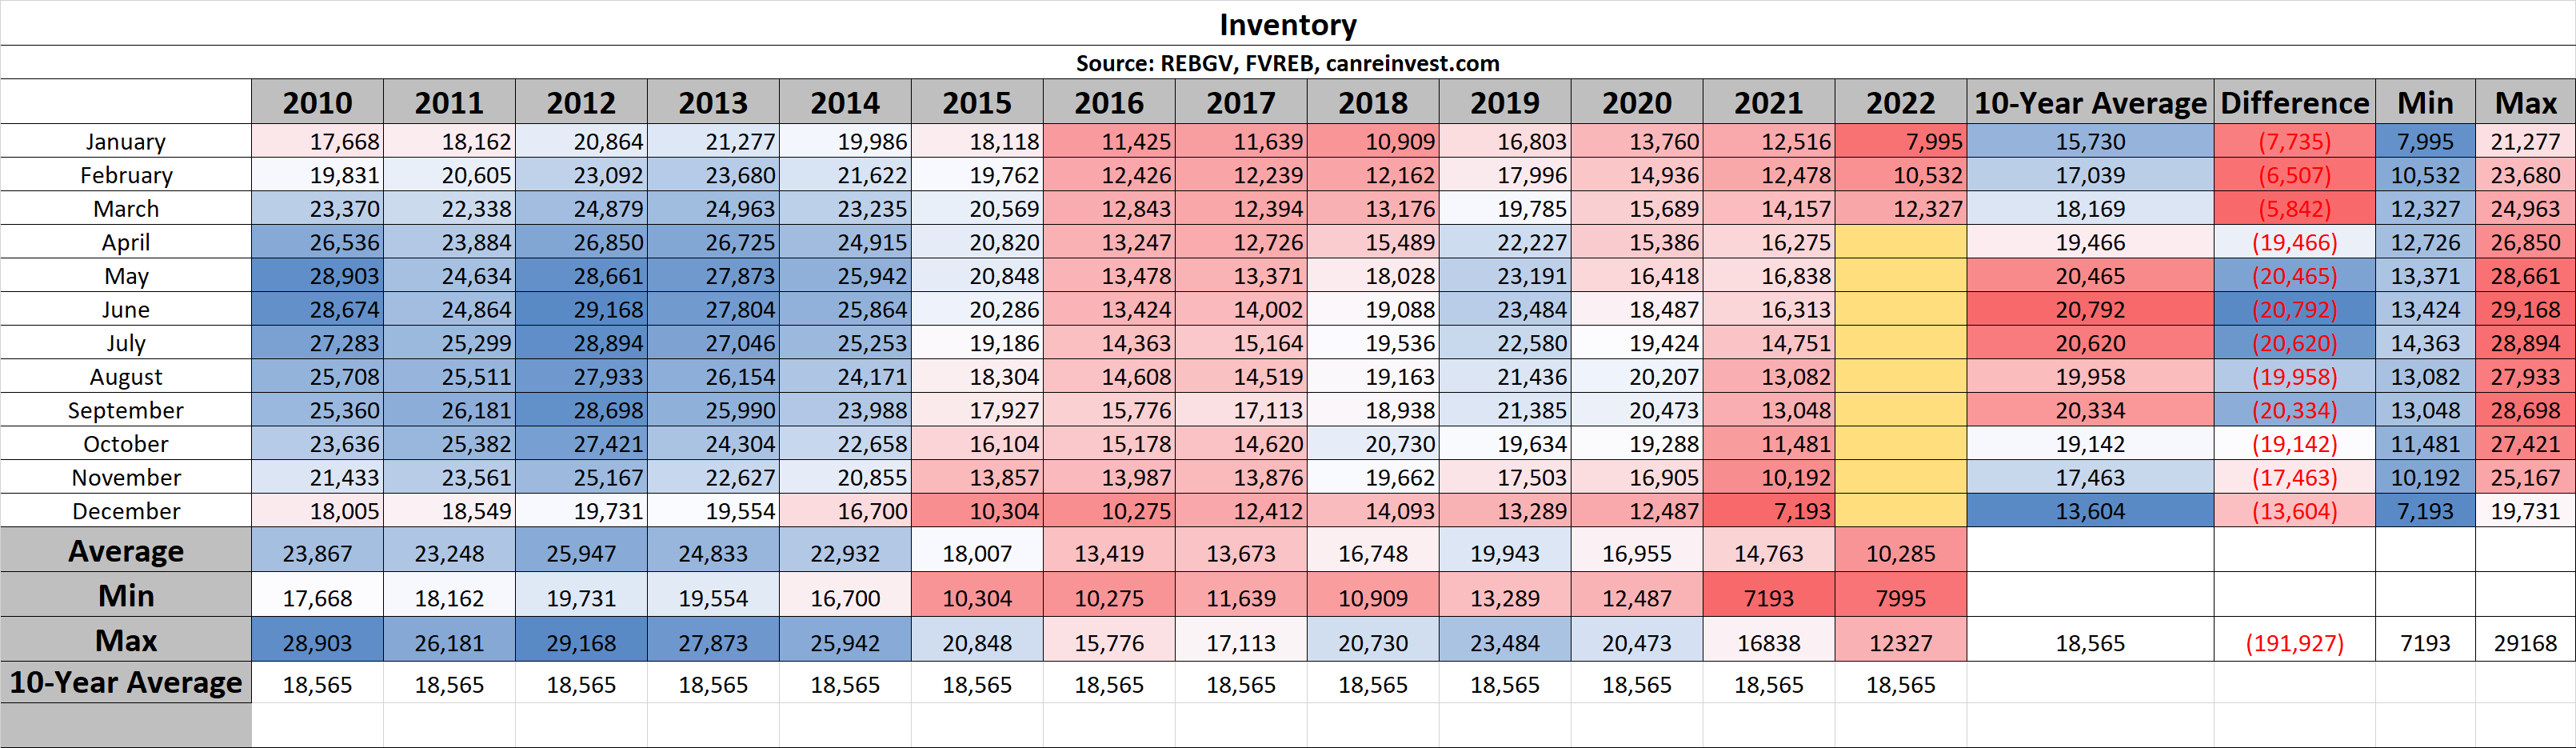
Inventory
Standing inventory continues to be the biggest challenge. Lowest March inventory in a generation. 12,327 active listings are 15% below last year (14,157) and 35% below the 10-year average (18,169).
Sales to Active Listings
With a SAL of 56%, this indicates there is considerable support for higher prices.
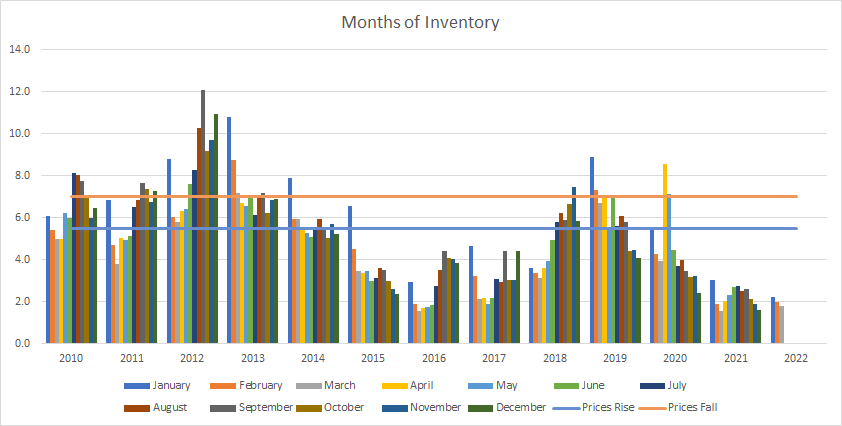
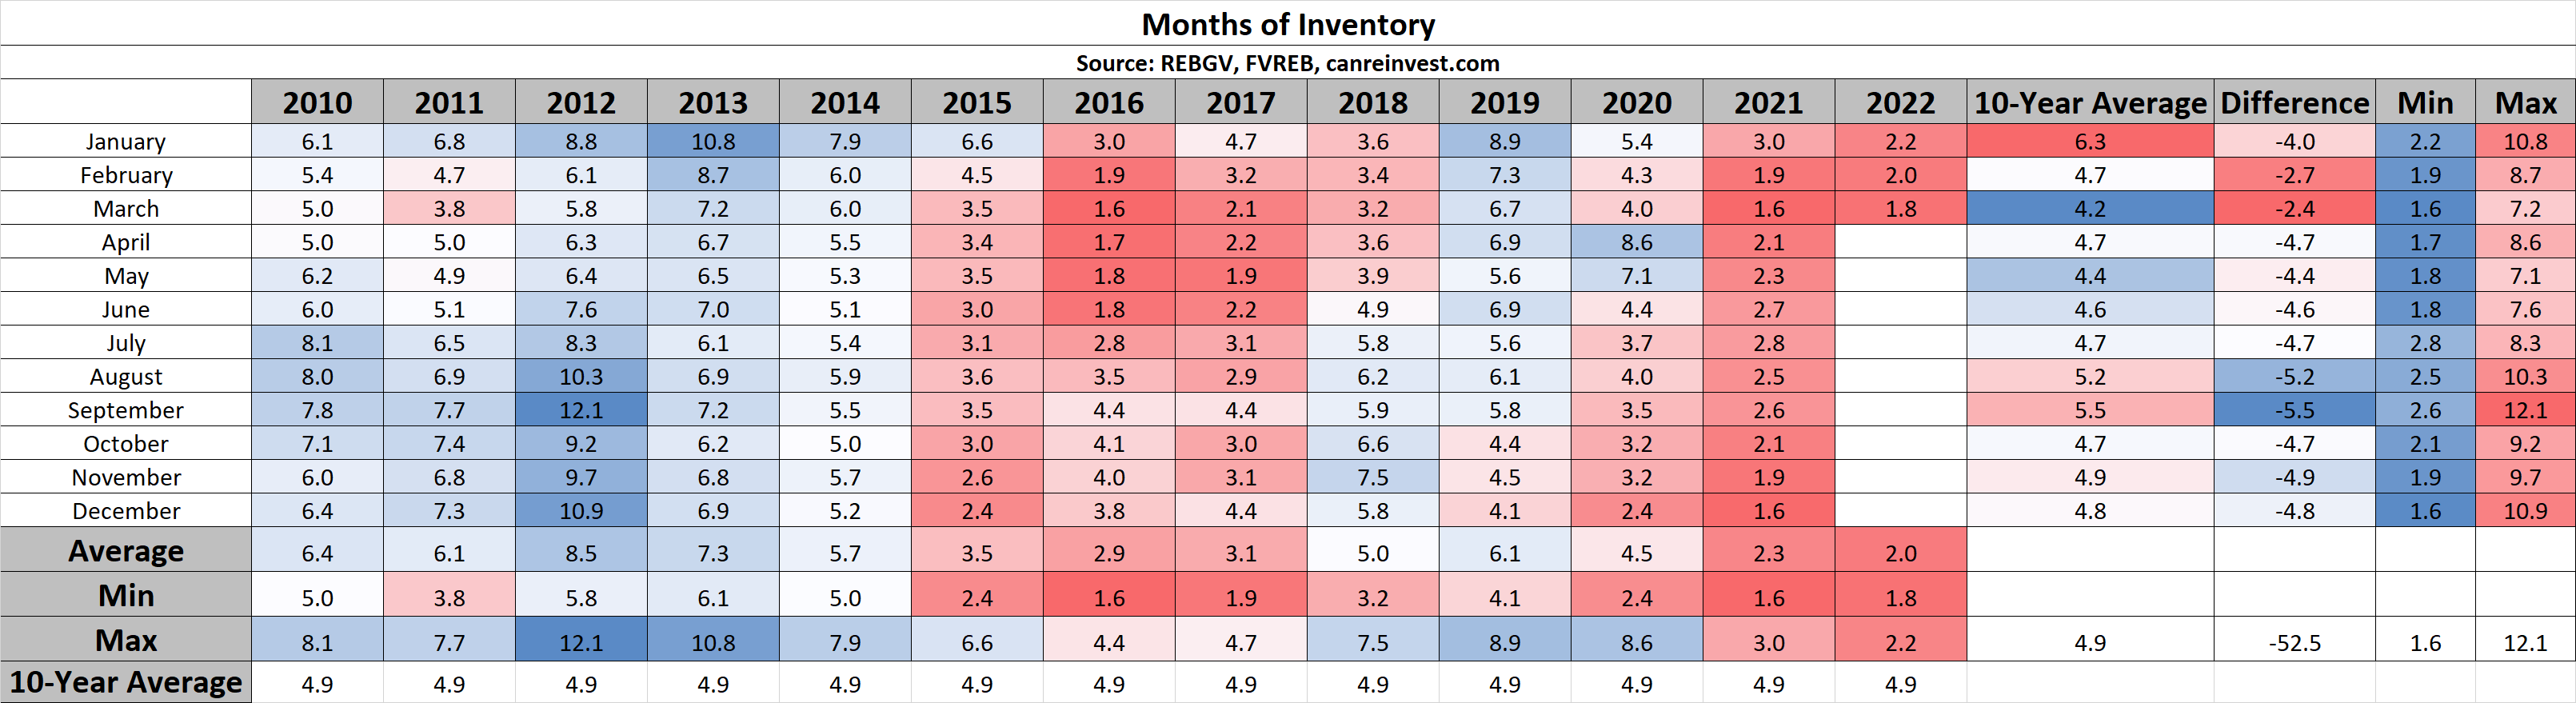
Months of Inventory
Currently, there is only 1.8 months of inventory. Normally, there should be 4-5 months.
Want to learn more about these stats or discuss your move to Macdonald Realty?
Check out careersinbcrealestate.com to connect today!
by Macrealty Marketing Team | Mar 8, 2022 | Market Updates
Here are the latest real estate market statistics from Macdonald Realty on Squamish, Whistler, and Sunshine Coast listings and sales in February 2022.
Find all the infographics related to the January Market Statistics by visiting the Facebook Album.
Whistler
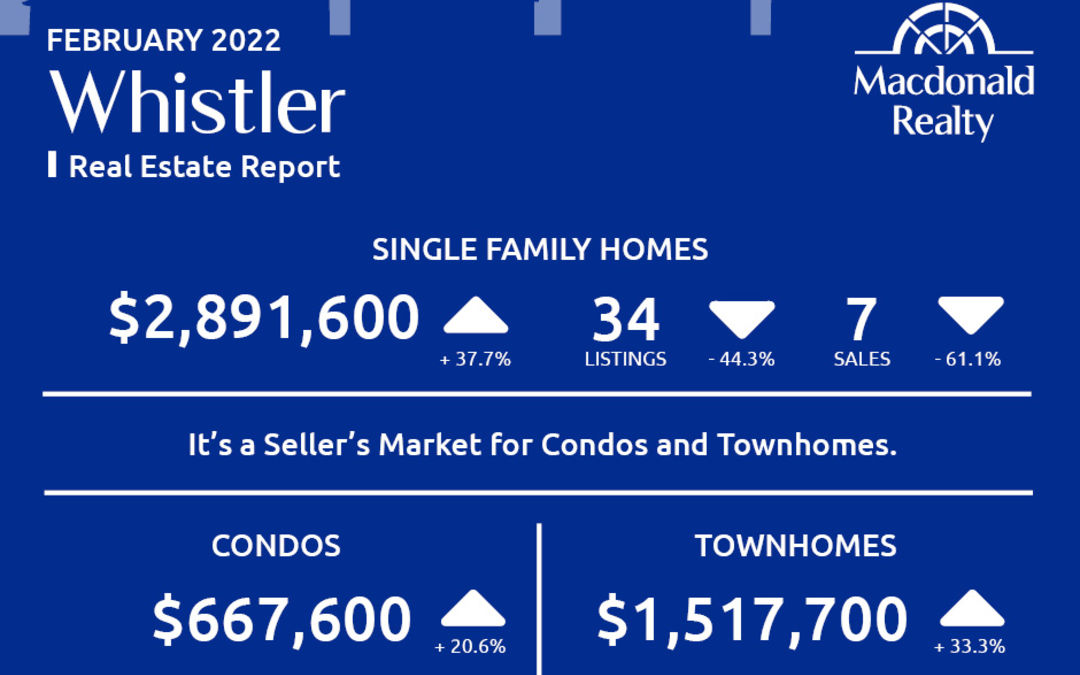
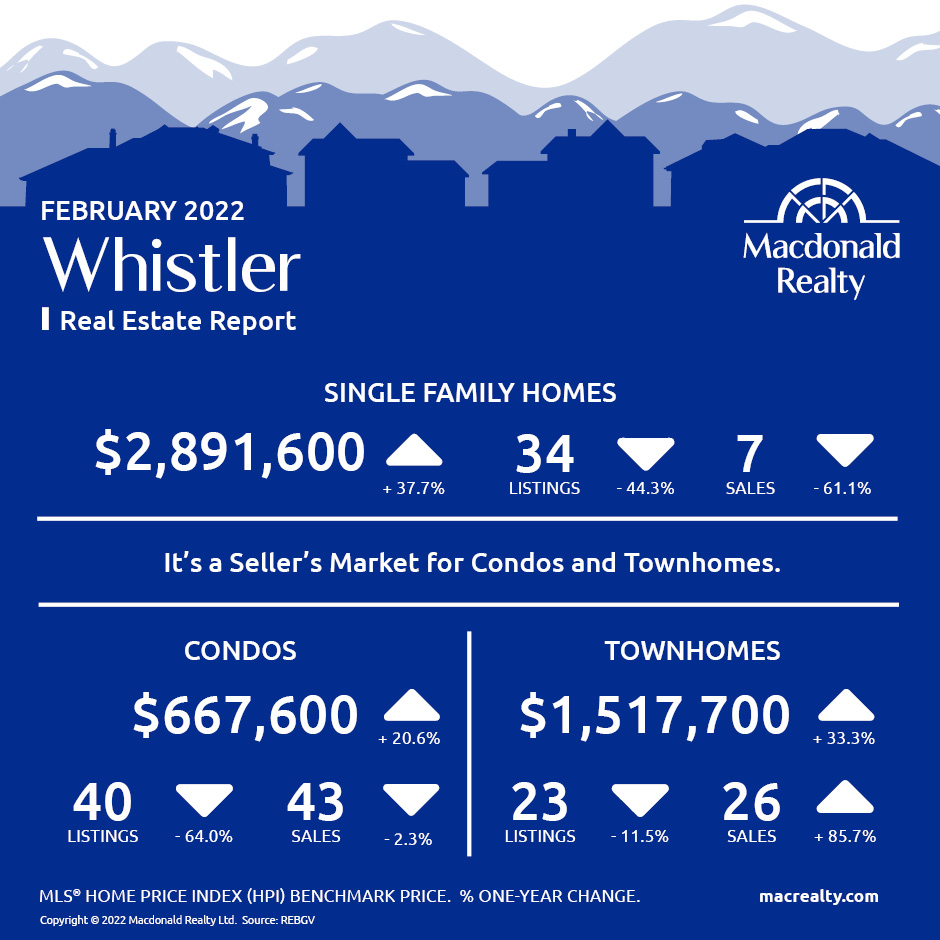
In February 2022, there were 7 sales of detached homes and 34 active listings. The benchmark sale price was $2,891,600.
The condo market had 43 sales and 40 active listings at the end of the month. The benchmark sale price was $667,600.
The townhome market had 26 sales and the active listings were 23. The benchmark sale price was $1,517,700.
It’s a Seller’s market for condos and townhomes in Whistler.
Squamish
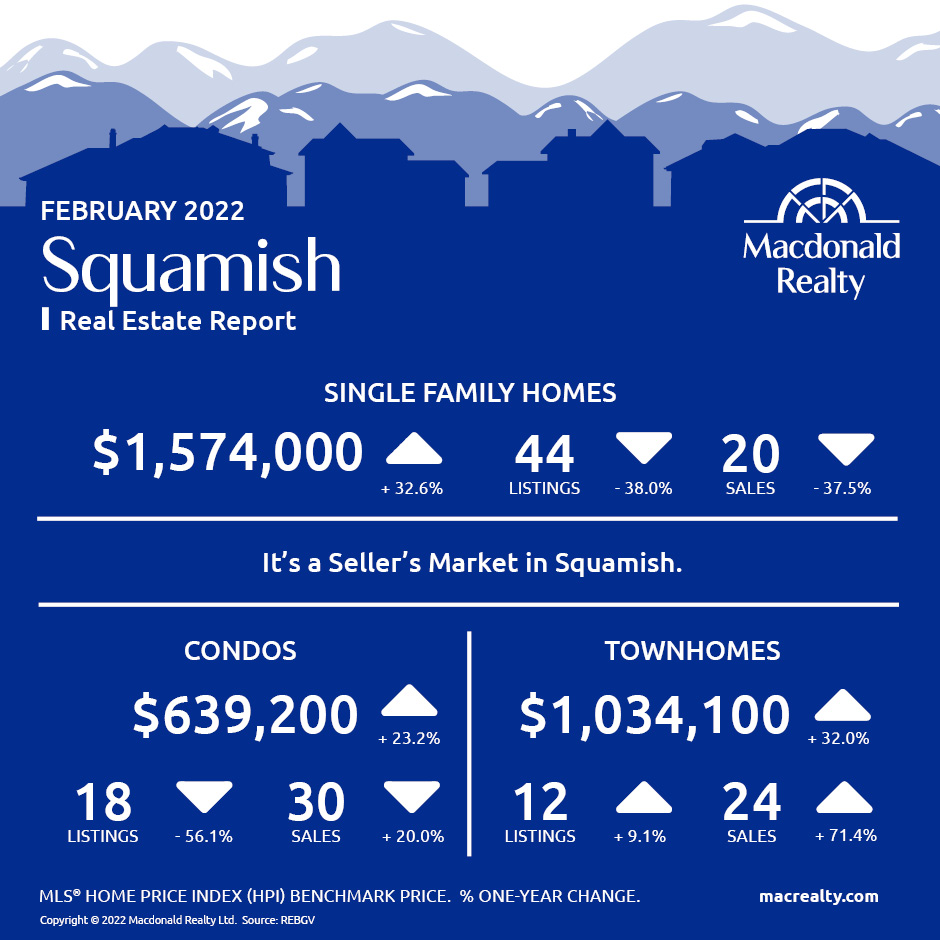
In February 2022, there were 20 sales of detached homes and 44 active listings. The benchmark sale price was $1,574,000.
The condo market had 30 sales and 18 active listings at the end of the month. The benchmark sale price was $639,200.
The townhome market had 24 sales and, the active listings were 12. The benchmark sale price was $1,034,100.
It’s a Seller’s Market in Squamish.
Sunshine Coast
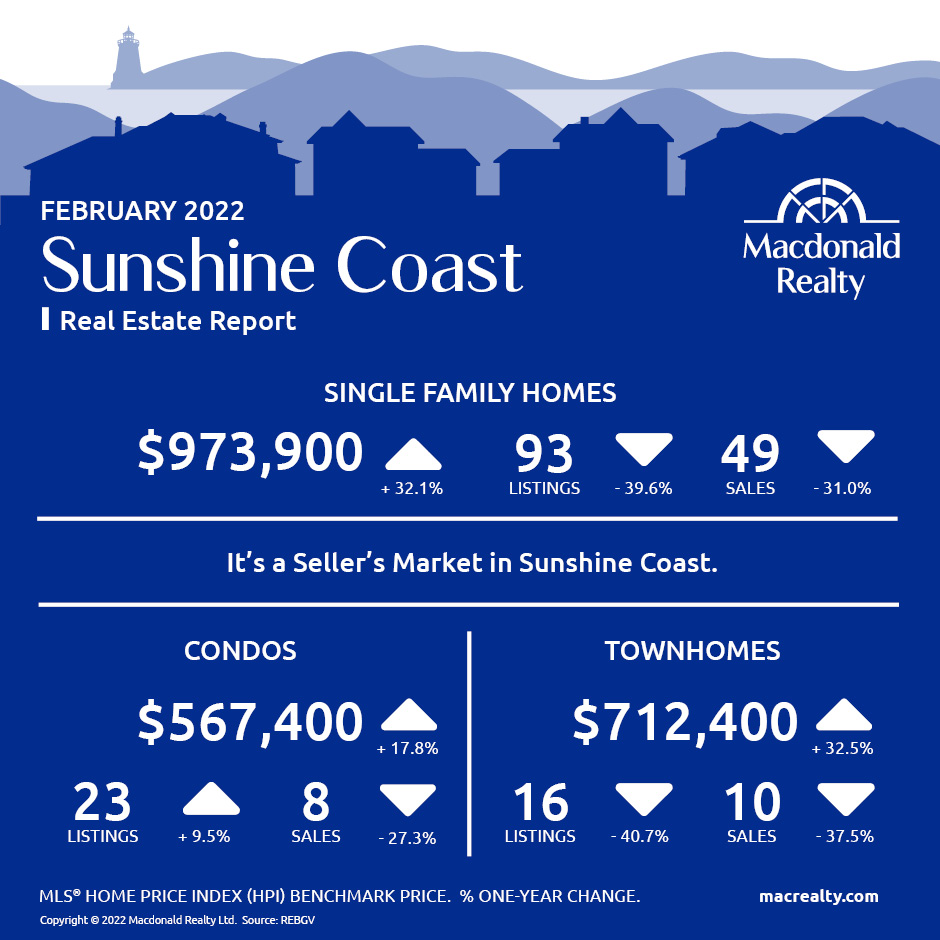
In February 2022, there were 49 sales of detached homes and 93 active listings. The benchmark sale price was $973,900.
The condo market had 8 sales and 23 active listings at the end of the month.
The townhome market had 10 sales and, the active listings were 16.
It’s a Seller’s market in Sunshine Coast.
Looking for more information about the real estate market in specific neighbourhoods in Squamish, Whistler, and Sunshine Coast? Macdonald Realty has offices in Squamish, Whistler, and Sunshine Coast. Please email [email protected] or call 1-877-278-3888 to be matched with a REALTOR® working in your area.
MLS® Home Price Index (HPI) Benchmark Price
Average and median home prices are often misinterpreted, are affected by change in the mix of homes sold, and can swing dramatically from month to month (based on the types and prices of properties that sold in a given month). The MLS® HPI overcomes these shortcomings and uses the concept of a benchmark home, a notional home with common attributes of typical homes in a defined area. Visit www.housepriceindex.ca for more information.
This blog post is based on market data provided by the Real Estate Board of Greater Vancouver (REBGV) www.rebgv.org
by Macrealty Marketing Team | Mar 8, 2022 | Market Updates
Here are the latest real estate market statistics from Macdonald Realty on the Greater Vancouver listings and sales in February 2022. Find all the infographics by visiting the
Facebook Album.
The Metro Vancouver* housing market saw steady home sales activity, modest increases in home listings and continued upward trends in pricing in February.
The Real Estate Board of Greater Vancouver (REBGV) reports that residential home sales in the region totalled 3,424 in February 2022, an 8.1 per cent decrease from the 3,727 sales recorded in February 2021, and a 49.8 per cent increase from the 2,285 homes sold in January 2022.
Last month’s sales were 26.9 per cent above the 10-year February sales average.
“As we prepare to enter what’s traditionally the busiest season of the year, the Metro Vancouver housing market is seeing more historically typical home sale activity and a modest uptick in home listing activity compared to last year,” Taylor Biggar, REBGV Chair said.
There were 5,471 detached, attached and apartment properties newly listed for sale on the Multiple Listing Service® (MLS®) in Metro Vancouver in February 2022. This represents an 8.4 per cent increase compared to the 5,048 homes listed in February 2021 and a 31.2 per cent increase compared to January 2022 when 4,170 homes were listed.
The total number of homes currently listed for sale on the MLS® system in Metro Vancouver is 6,742, a 19.3 per cent decrease compared to February 2021 (8,358) and a 19.1 per cent increase compared to January 2022 (5,663).
The Board also has informed:
“Despite having a higher volume of people listing their homes for sale in February, the region’s housing market remains significantly undersupplied, which has been pushing home prices to new highs month after month,” Biggar said.
*Areas covered by the Real Estate Board of Greater Vancouver include Burnaby, Coquitlam, Maple Ridge, New Westminster, North Vancouver, Pitt Meadows, Port Coquitlam, Port Moody, Richmond, South Delta, Squamish, Sunshine Coast, Vancouver, West Vancouver, and Whistler. Check out the infographics of Squamish, Sunshine Coast and Whistler, HERE.
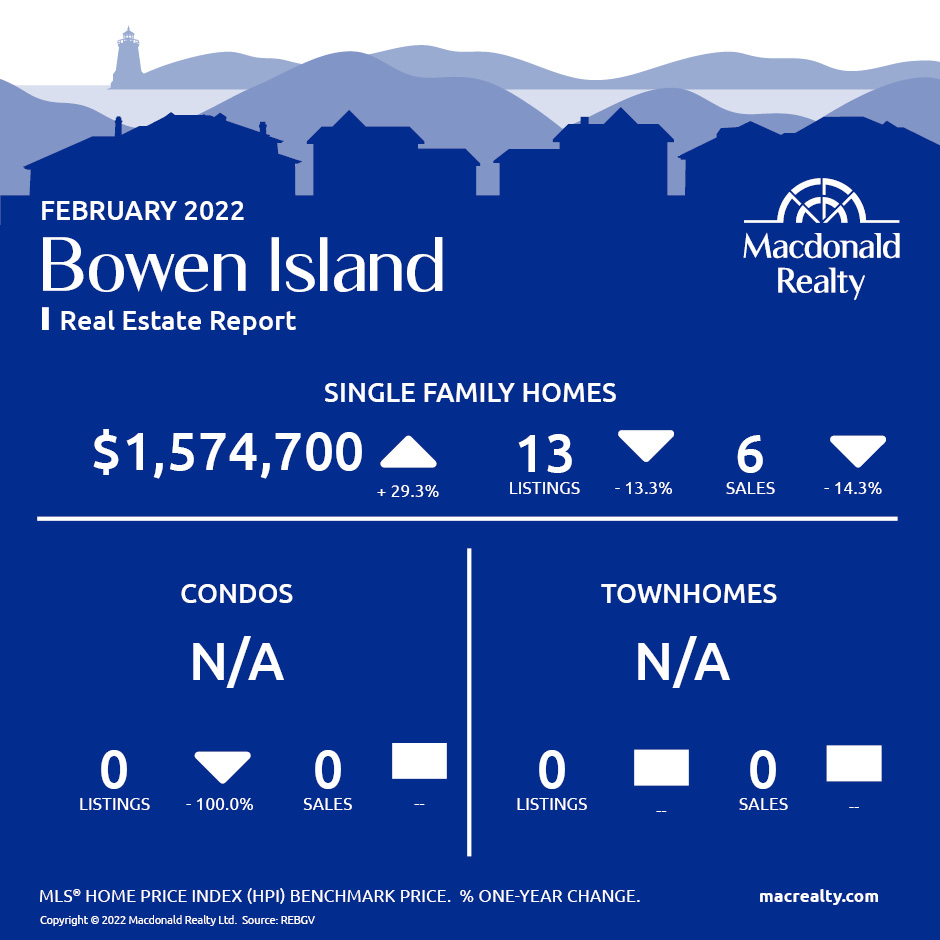
Bowen Island
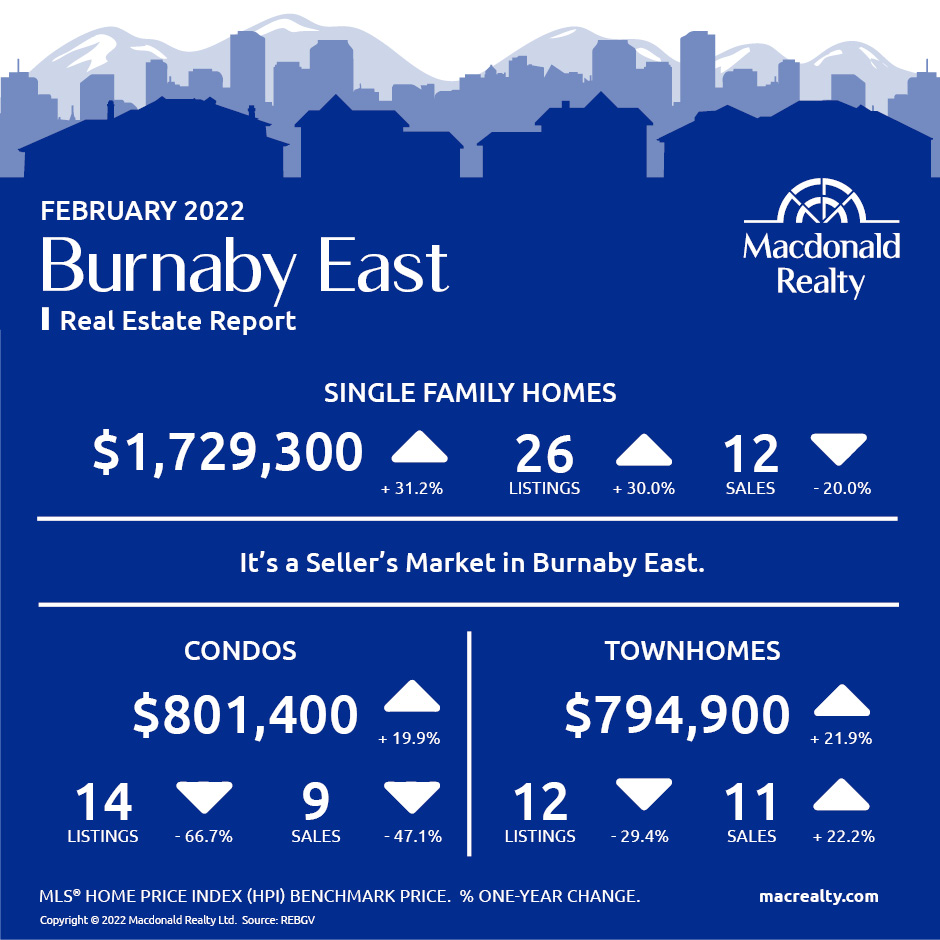
Burnaby East
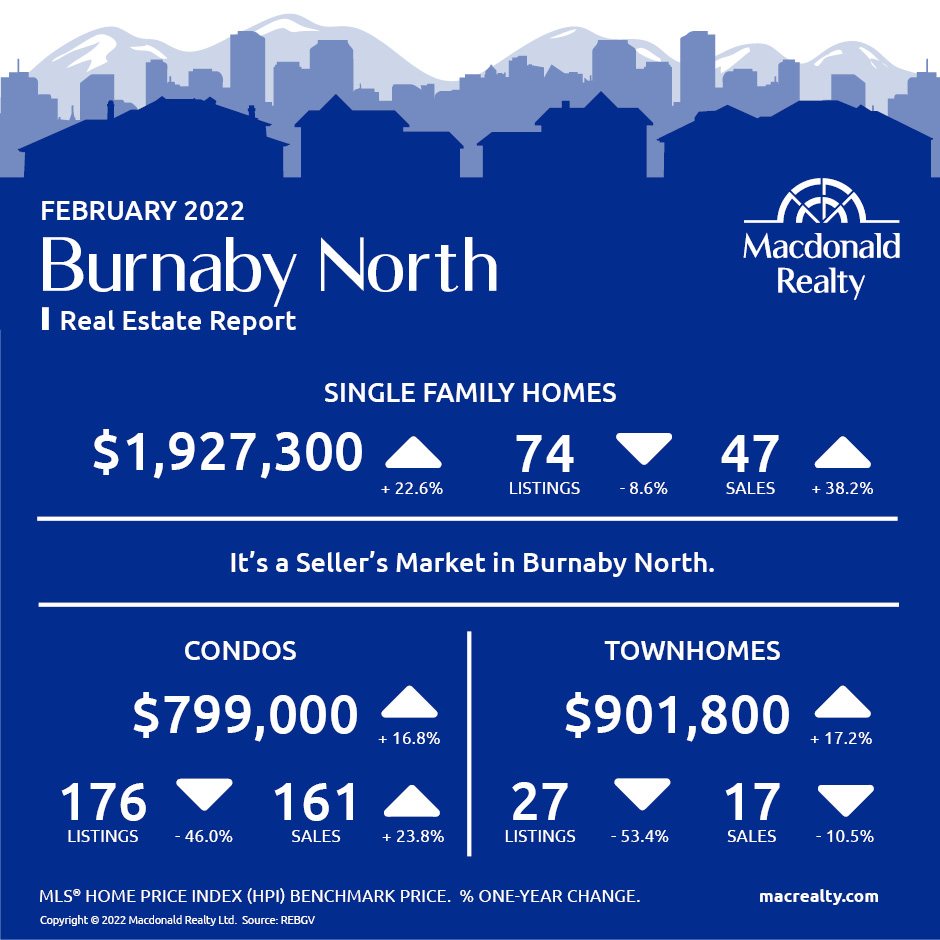
Burnaby North
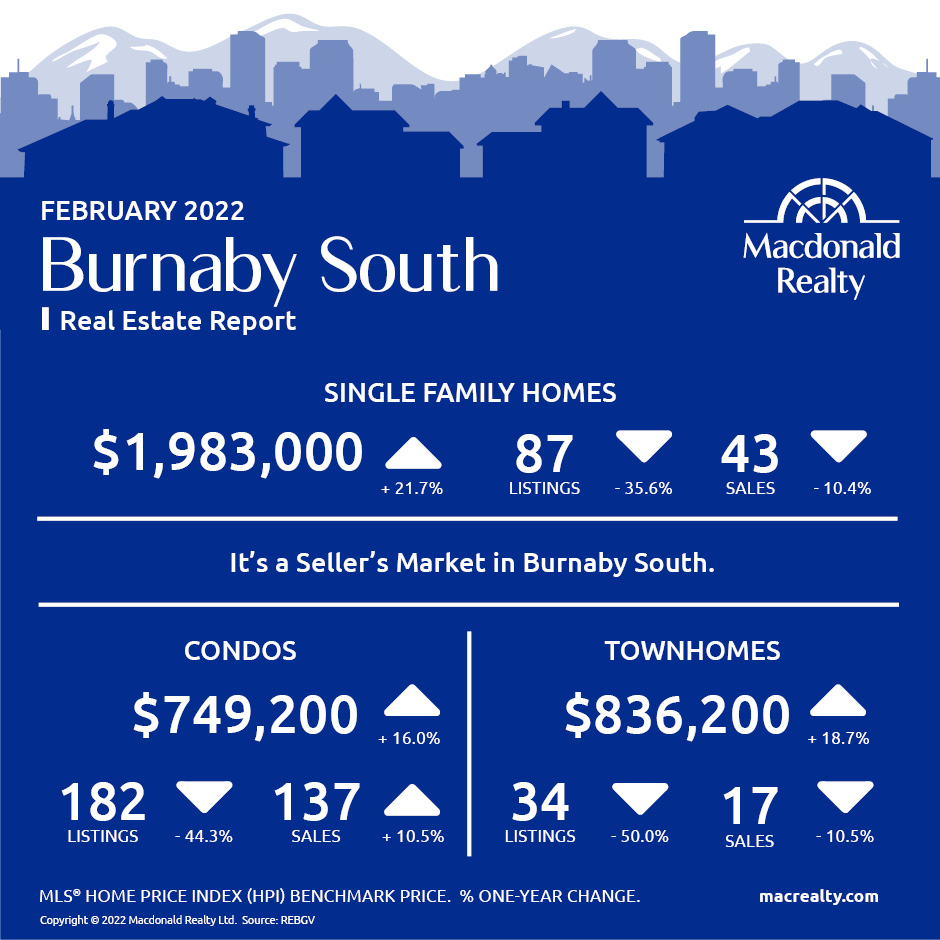
Burnaby South
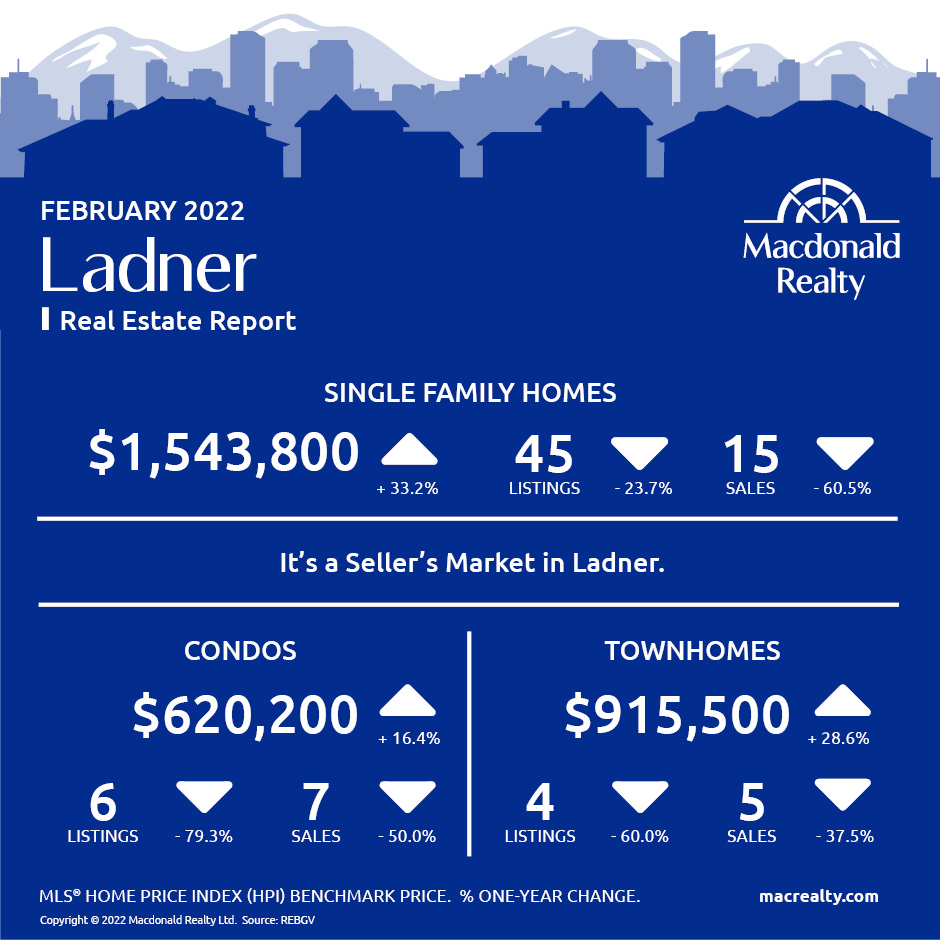
Ladner
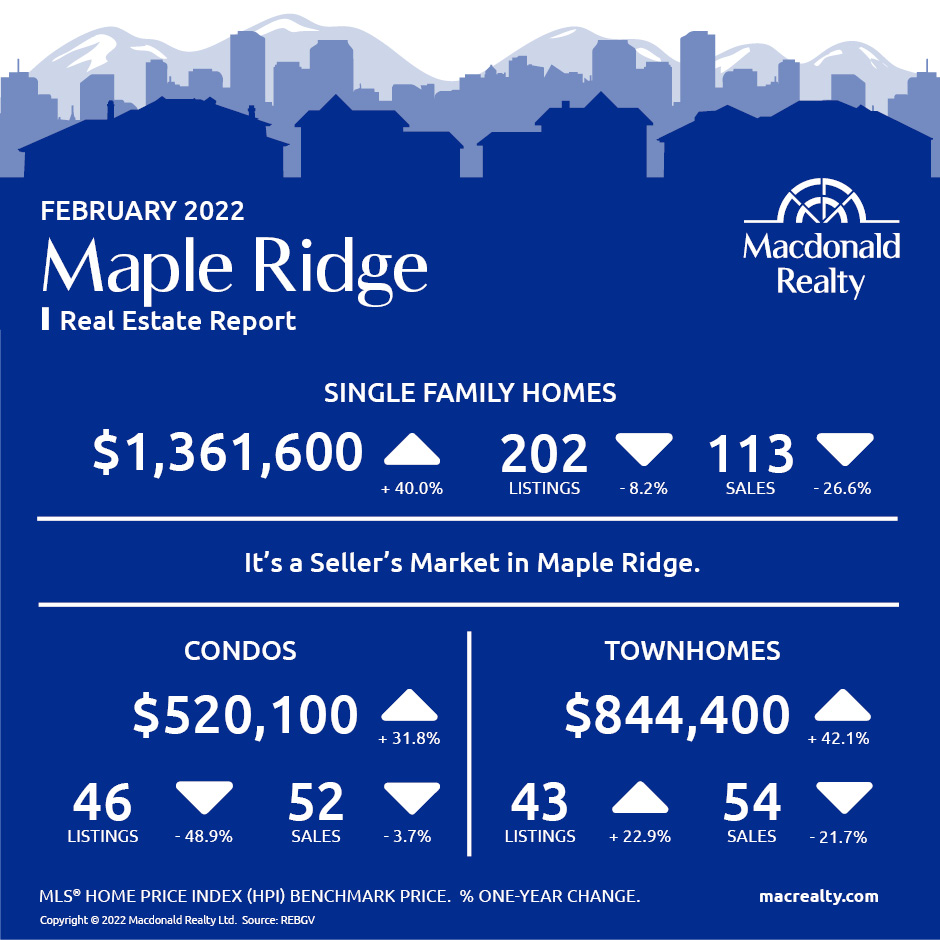
Maple Ridge
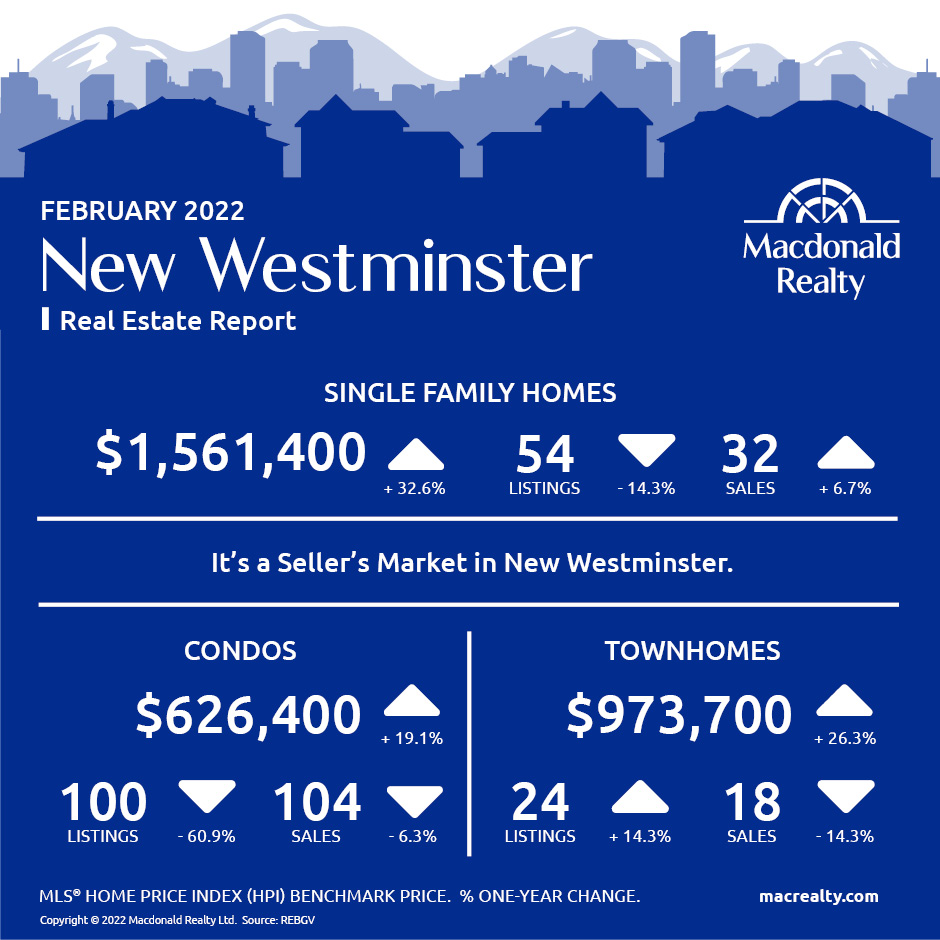
New Westminster
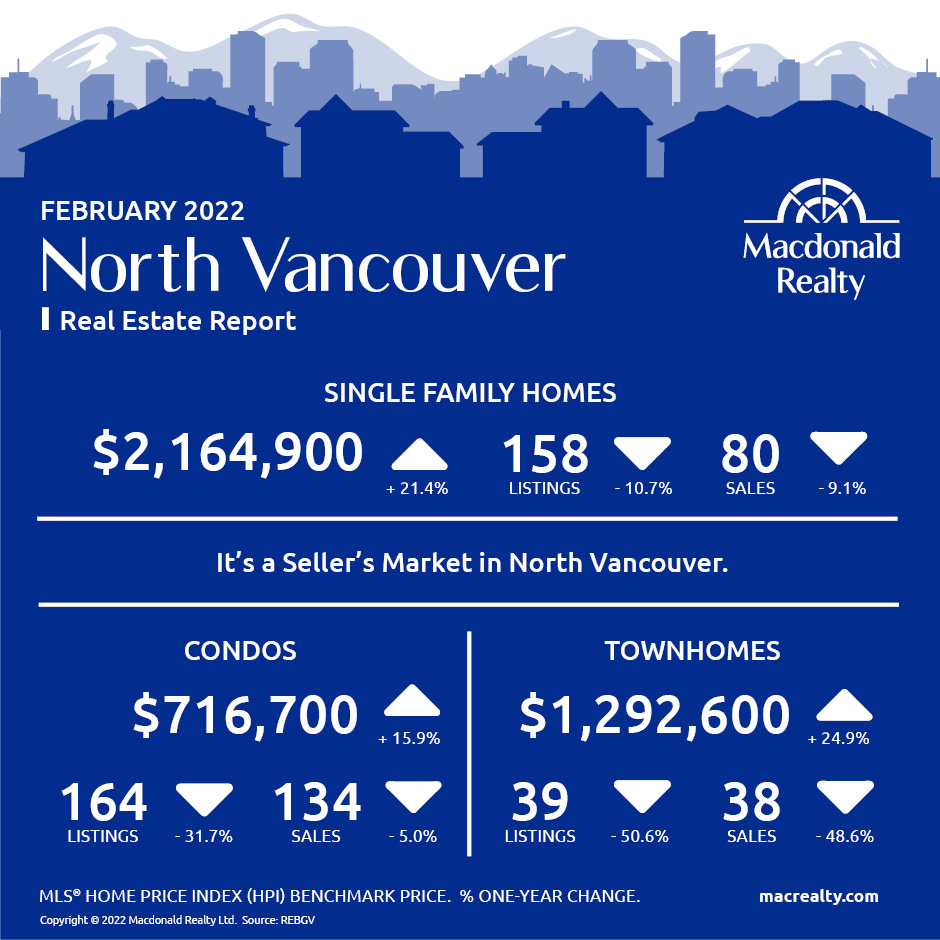
North Vancouver
Pitt Meadows

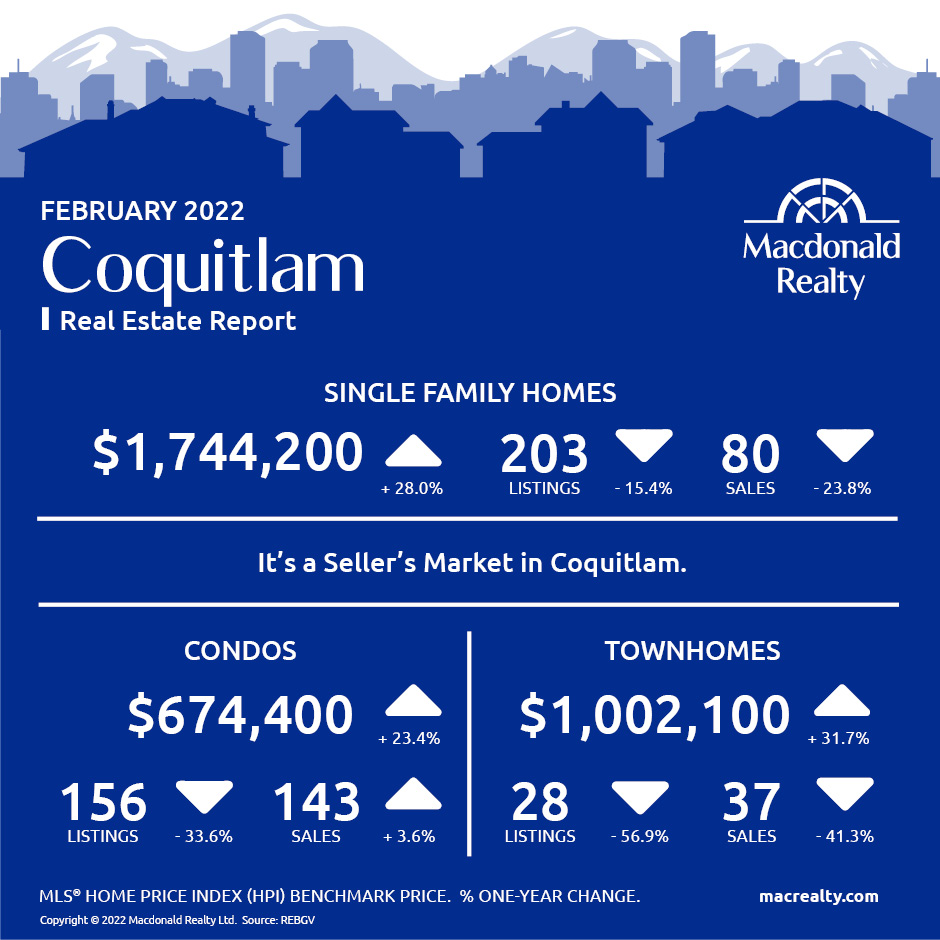
Coquitlam
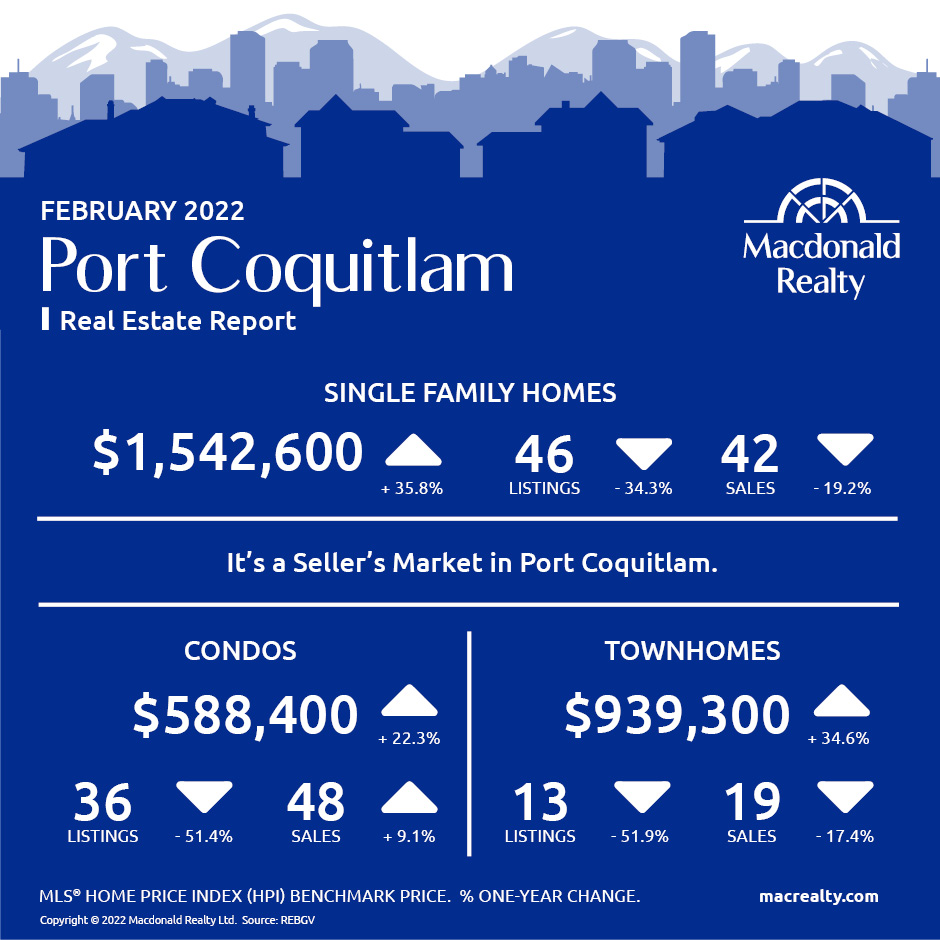
Port Coquitlam
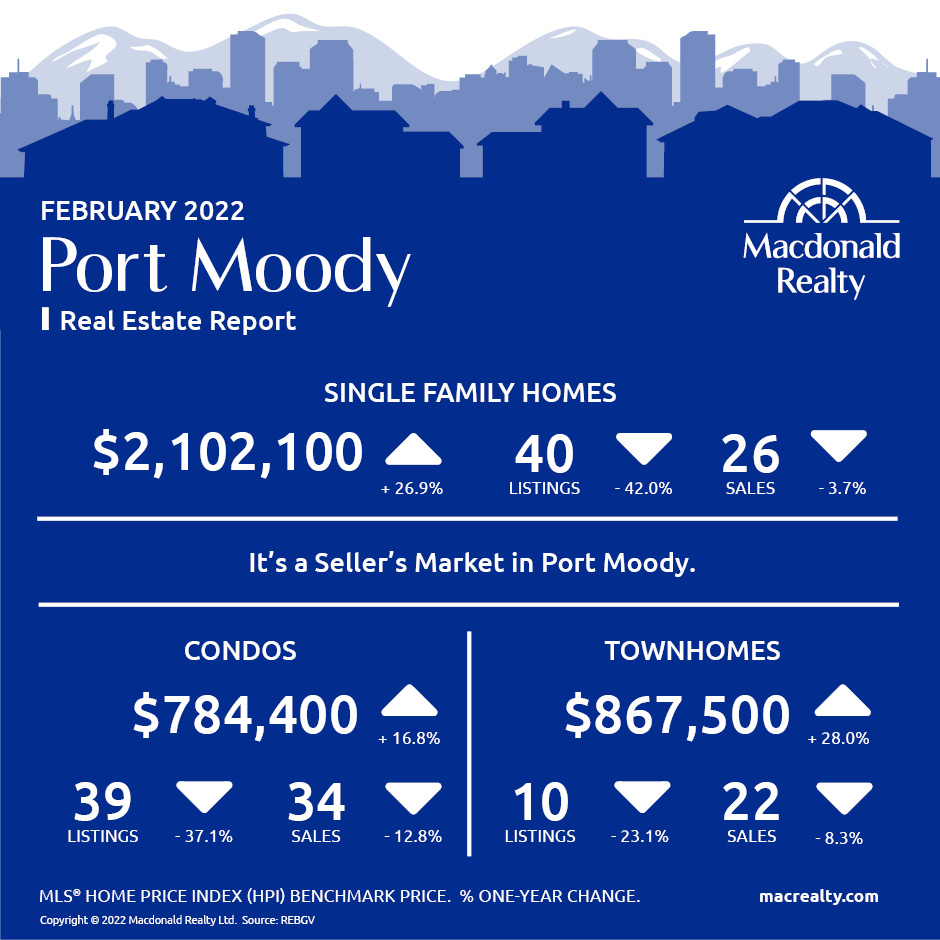
Port Moody
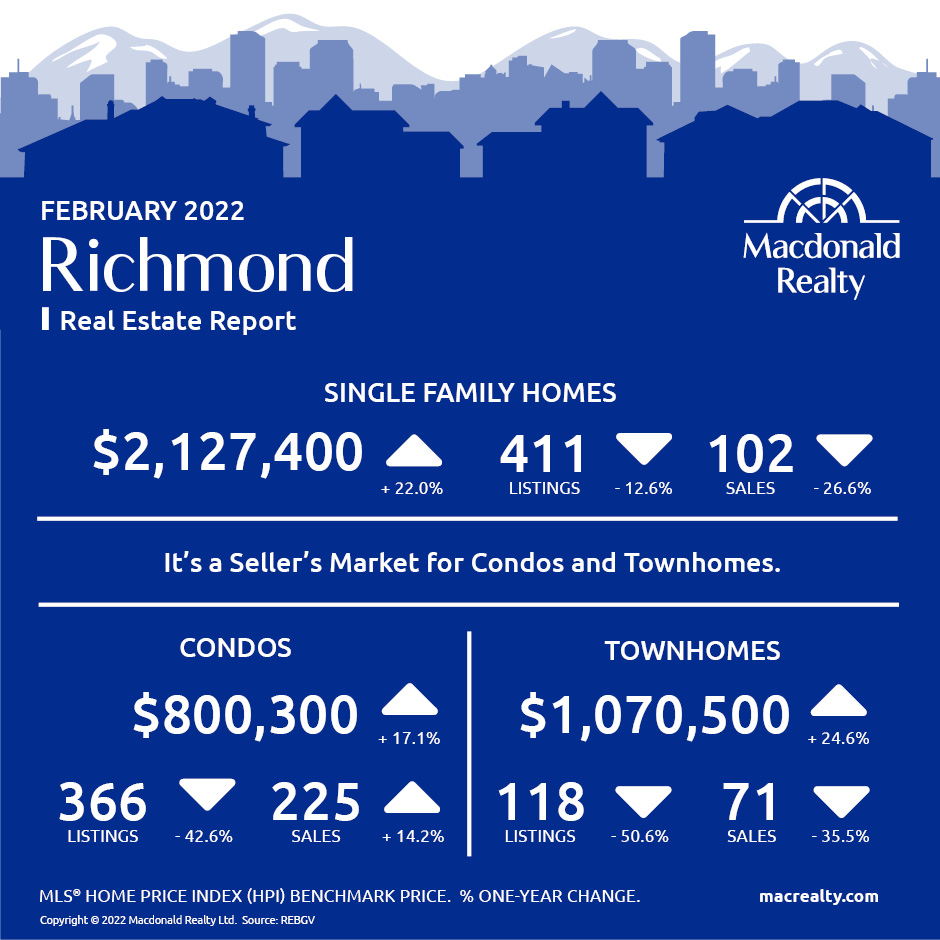
Richmond
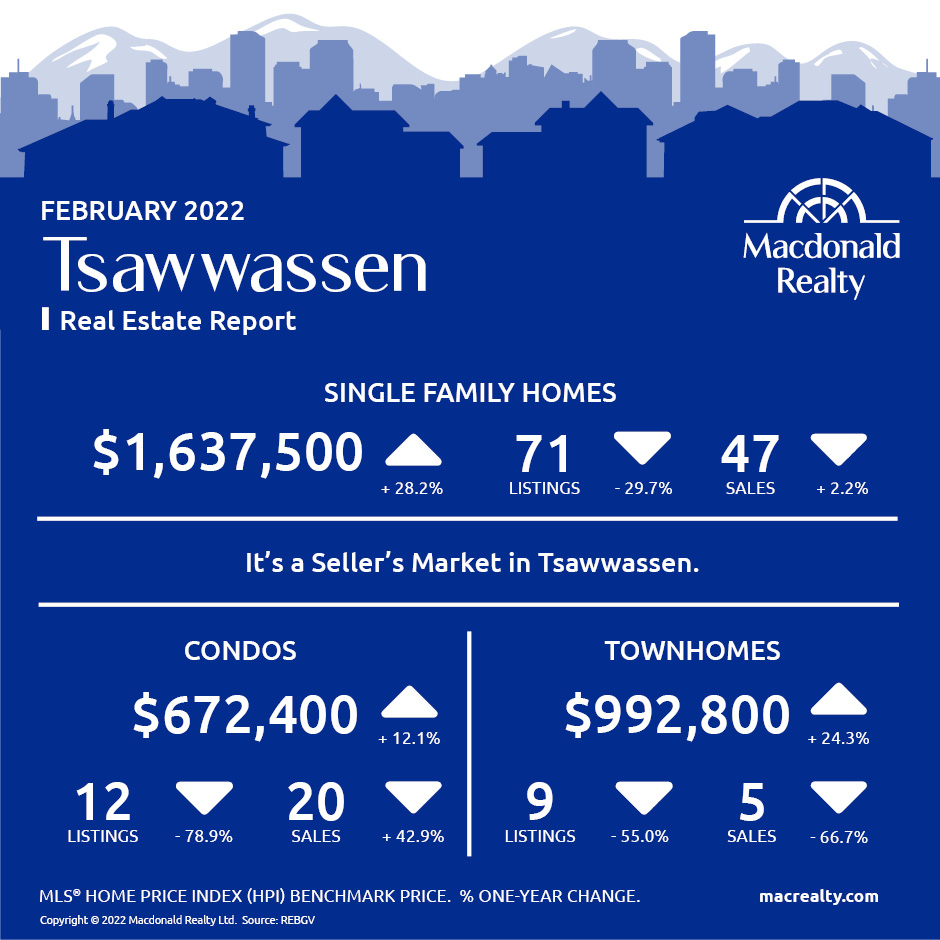
Tsawwassen
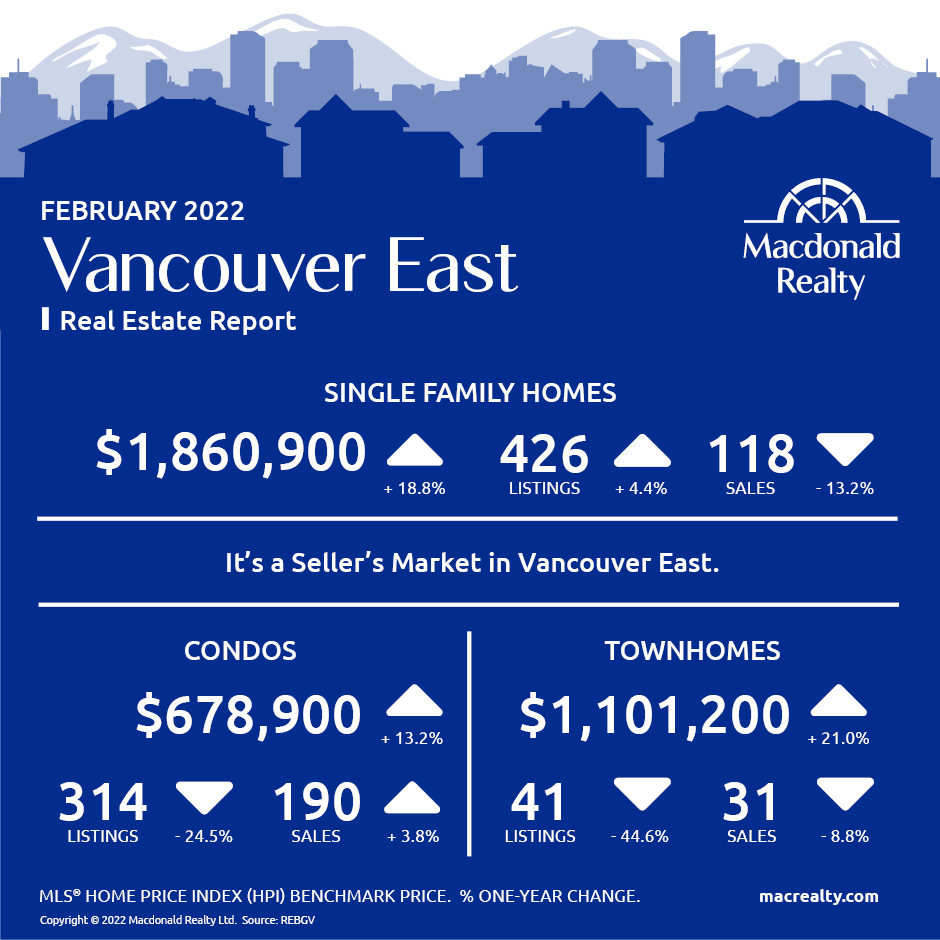
Vancouver East
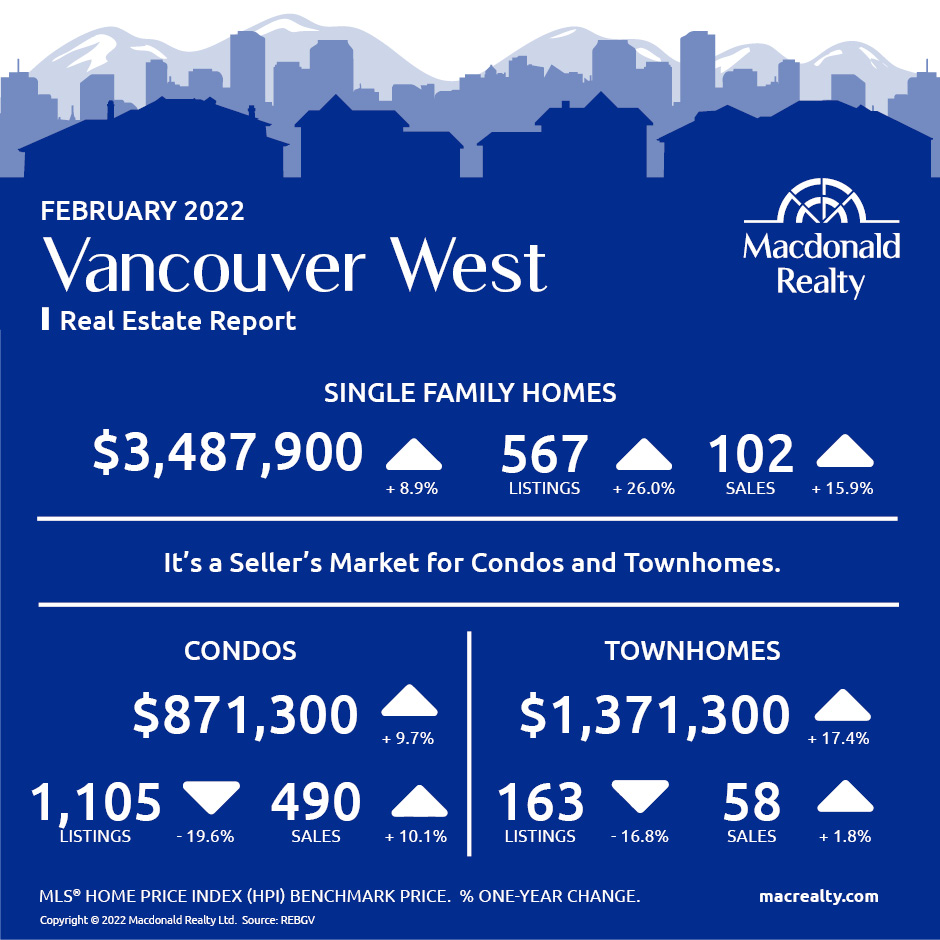
Vancouver West
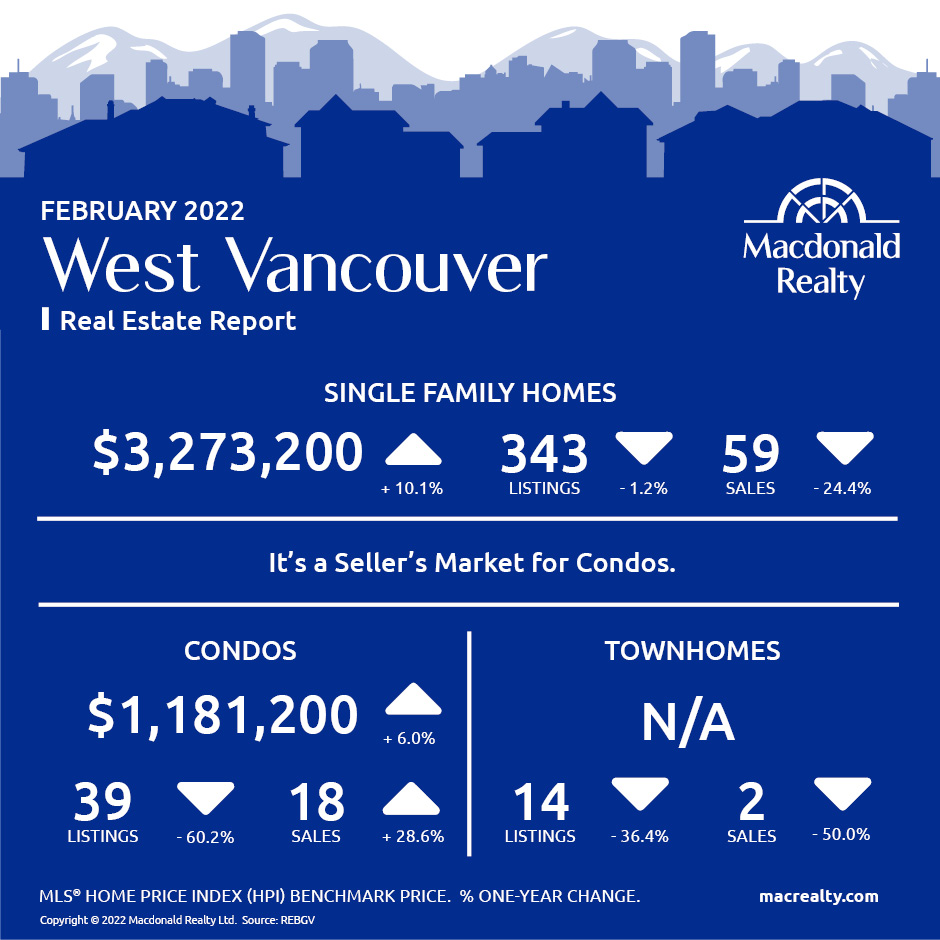
West Vancouver
Looking for more information about the real estate market in specific neighbourhoods in the Greater Vancouver?
Macdonald Realty has offices across the Greater Vancouver. Please email [email protected] or call 1-877-278-3888 to be matched with a REALTOR® working in your area.
MLS® Home Price Index (HPI) Benchmark Price
Average and median home prices are often misinterpreted, are affected by change in the mix of homes sold, and can swing dramatically from month to month (based on the types and prices of properties that sold in a given month). The MLS® HPI overcomes these shortcomings and uses the concept of a benchmark home, a notional home with common attributes of typical homes in a defined area. Visit www.housepriceindex.ca for more information.
This blog post is based on market data provided by the Real Estate Board of Greater Vancouver (REBGV) www.rebgv.org
by Macrealty Marketing Team | Mar 8, 2022 | Market Updates
According to the Fraser Valley Real Estate Board, Buyers of Fraser Valley real estate had significantly more inventory to choose from last month due to a record-breaking volume of new listings received for the month of February.
The Fraser Valley Real Estate Board (FVREB) received 3,742 new listings in February, an increase of 75.3 per cent compared to January, and an increase of 14.6 per cent compared to February of last year. The previous highest February for new listings was 3,283 in 2016.
The Fraser Valley Real Estate Board (FVREB) received 3,742 new listings in February, an increase of 75.3 per cent compared to January, and an increase of 14.6 per cent compared to February of last year. The previous highest February for new listings was 3,283 in 2016.
“Buyers are looking for value for their real estate dollar and the Fraser Valley market still delivers compared to other regions throughout the Lower Mainland,” said Baldev Gill CEO of the Fraser Valley Real Estate Board. “That said, supply fundamentals continue to be the number one issue facing real estate markets in all regions across the province. Until there is a concerted effort to address inventory, buyers will continue to face challenging market conditions.”
In the Fraser Valley region, the average number of days to sell an apartment in February was 12 days, and 11 days for townhomes. Single family detached homes averaged 13 days before selling. The one-year comparison is 35, 21 and 21 respectively.
Find all the infographics related to the February Market Statistics by visiting the Facebook Album.
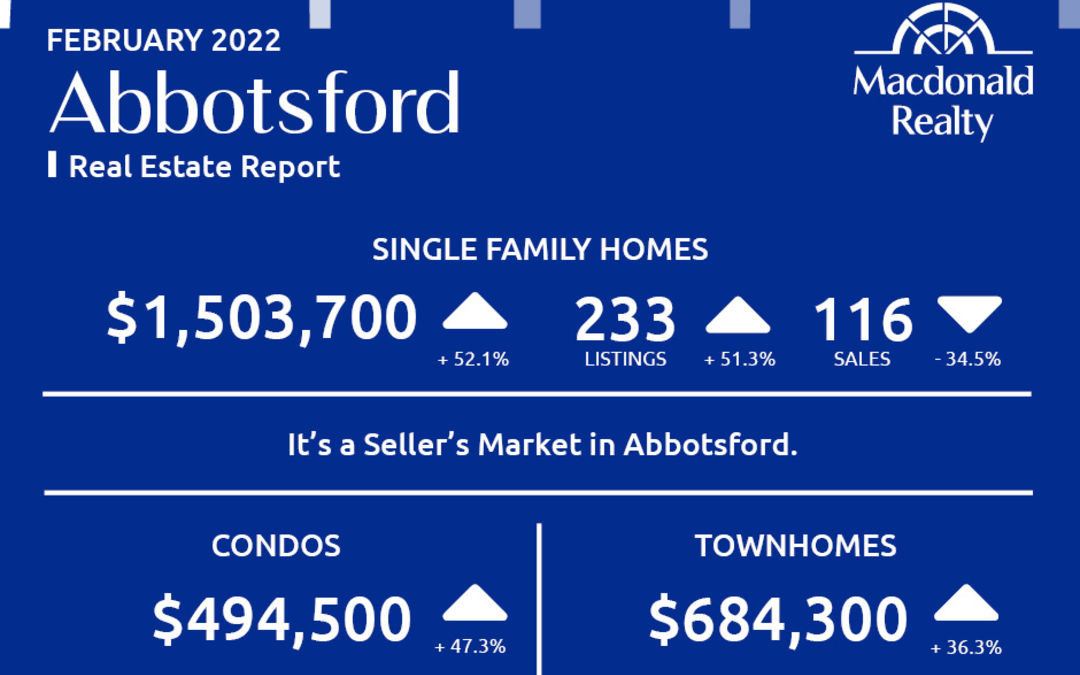
Abbotsford

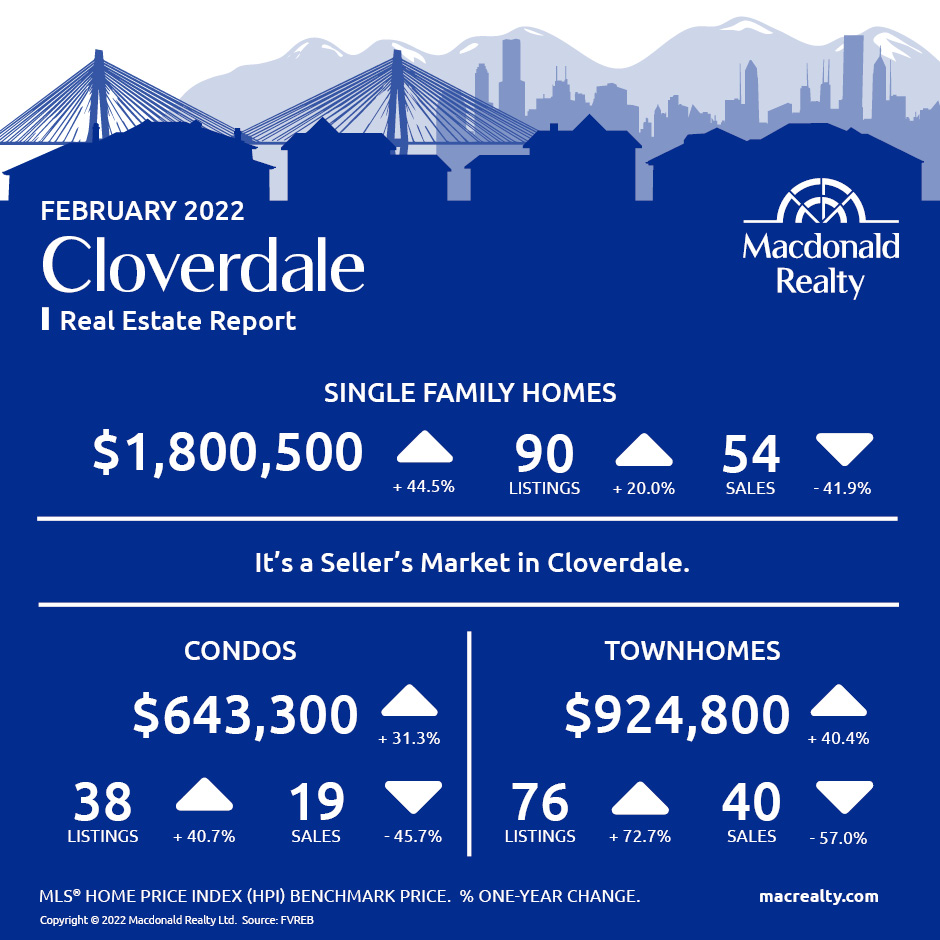
Cloverdale
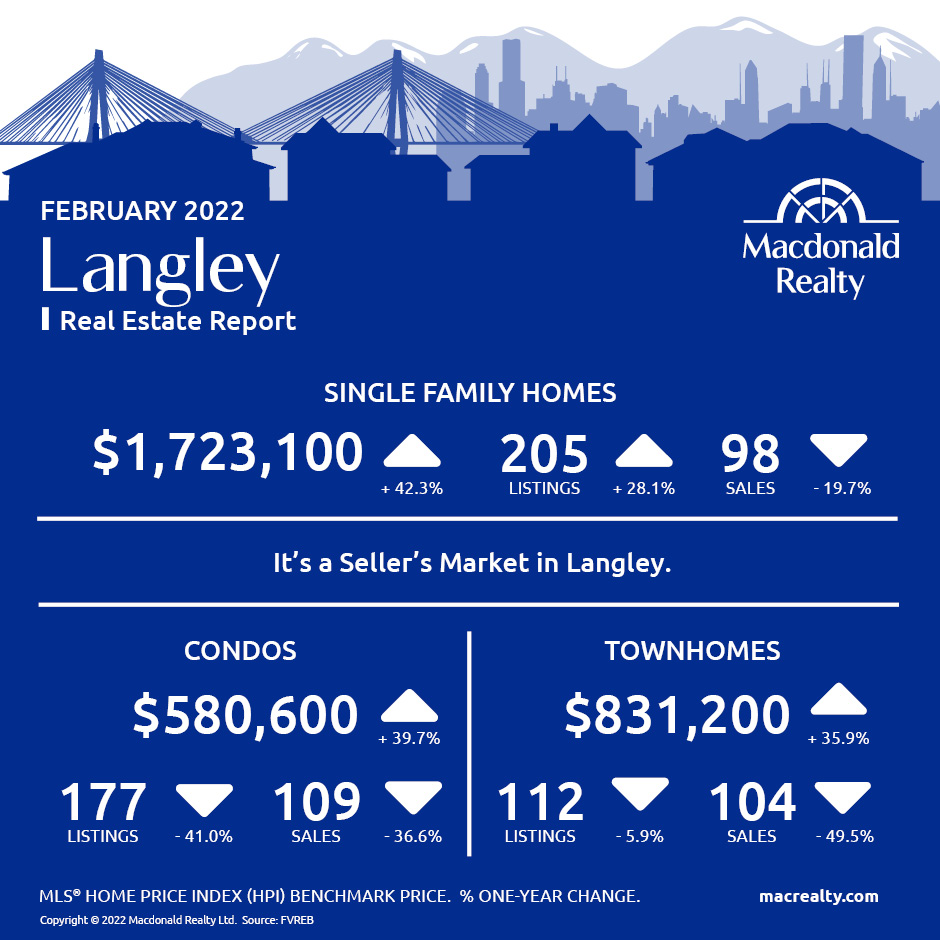
Langley
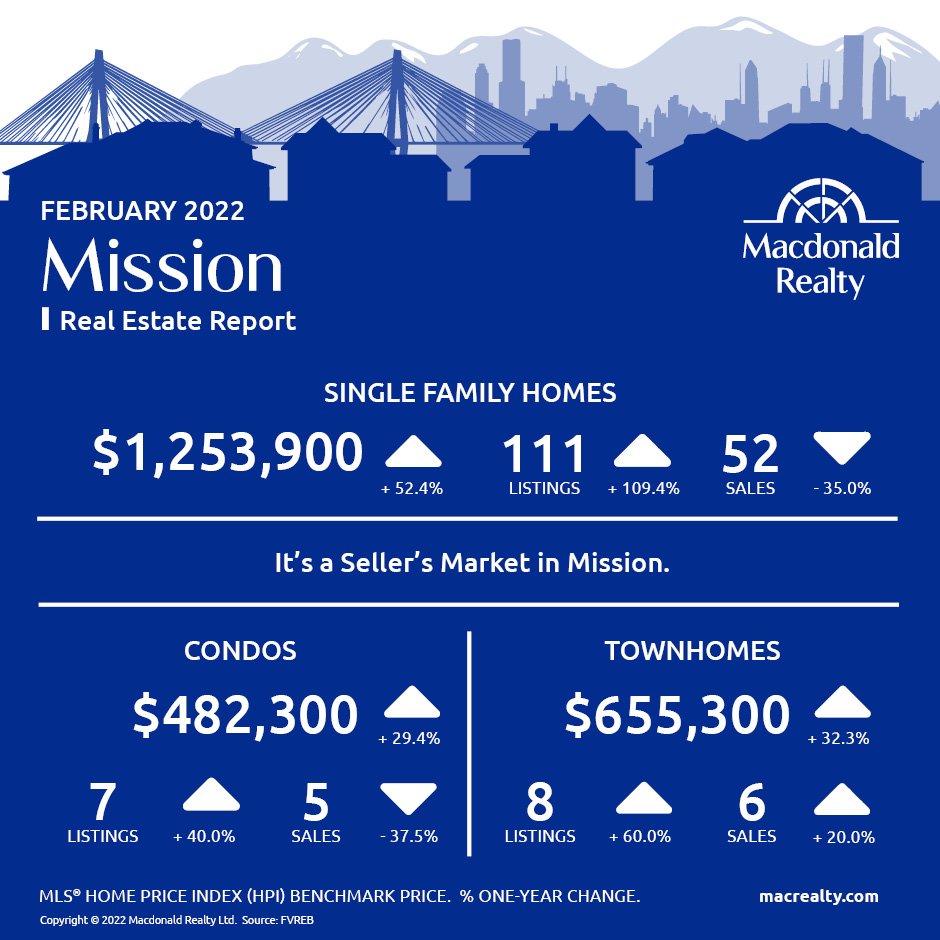
Mission
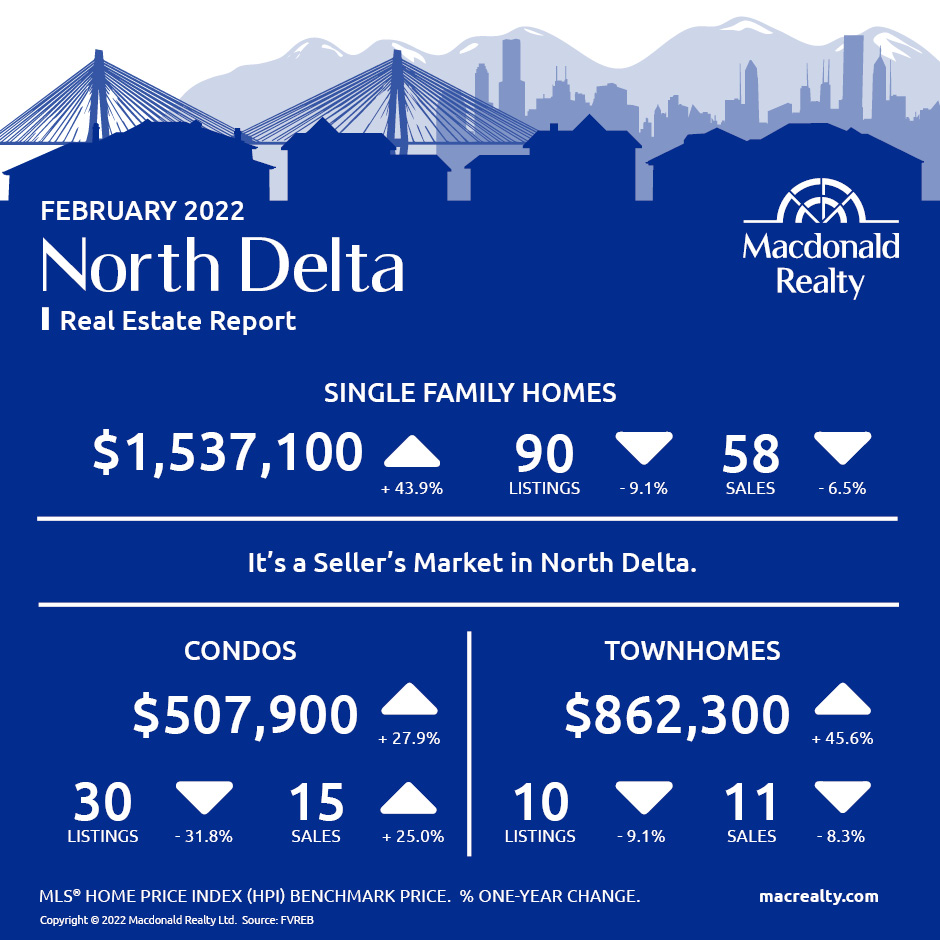
North Delta
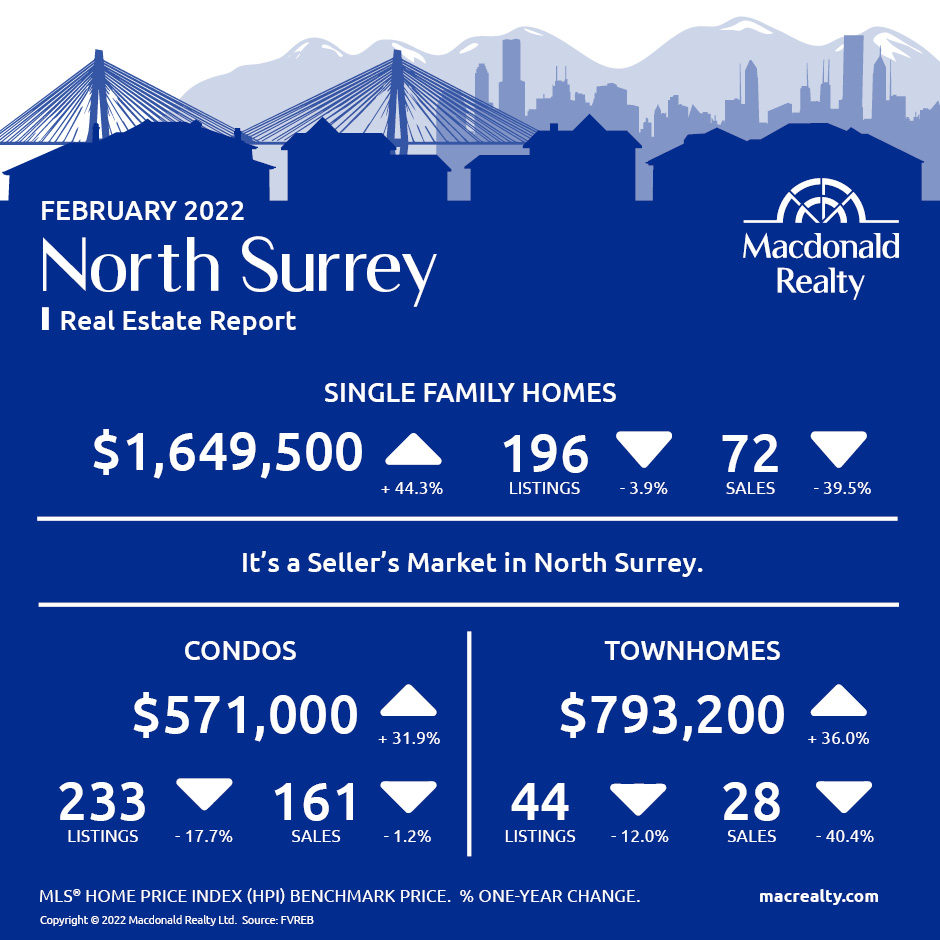
North Surrey
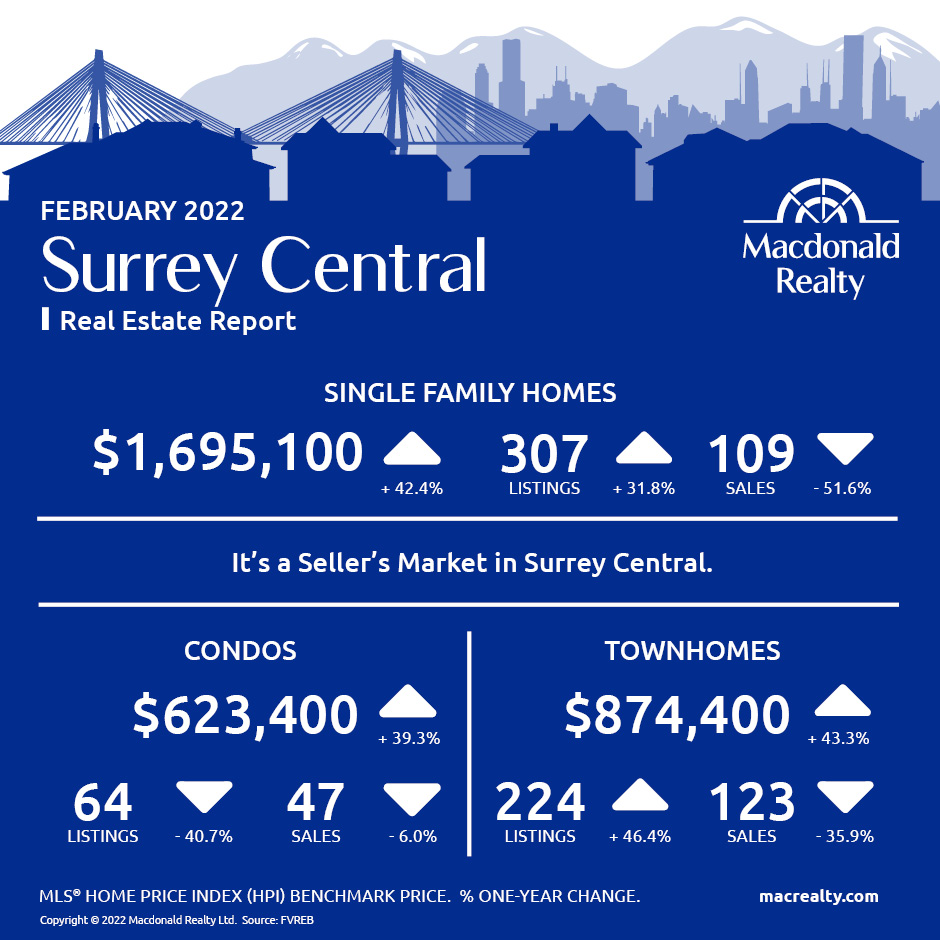
Surrey Central
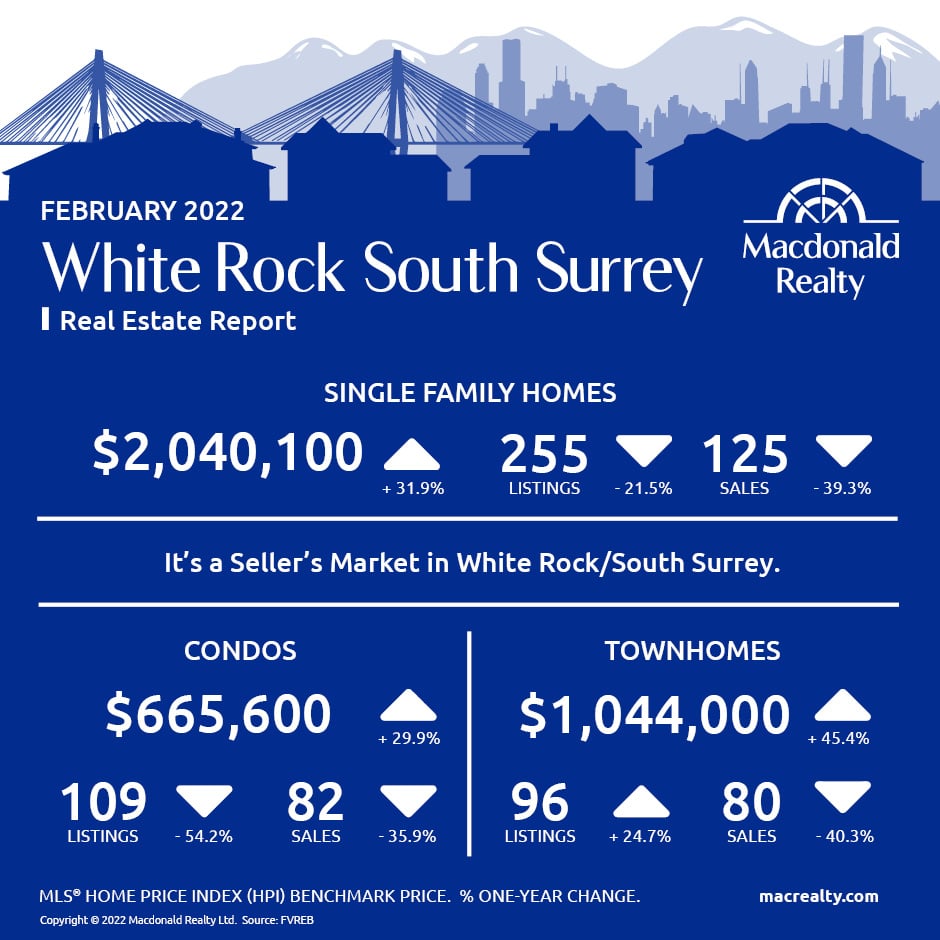
White Rock / South Surrey
Looking for more information about the real estate market in specific neighbourhoods in Surrey, Langley and Fraser Valley?
Macdonald Realty has offices in North Delta, White Rock/South Surrey, and Langley. Please email [email protected] or call 1-877-278-3888 to be matched with a REALTOR® working in your area.
MLS® Home Price Index (HPI) Benchmark Price
Average and median home prices are often misinterpreted, are affected by change in the mix of homes sold, and can swing dramatically from month to month (based on the types and prices of properties that sold in a given month). The MLS® HPI overcomes these shortcomings and uses the concept of a benchmark home, a notional home with common attributes of typical homes in a defined area. Visit www.housepriceindex.ca for more information.
This blog post is based on market data provided by the Fraser Valley Real Estate Board (FVREB) www.fvreb.bc.ca
by Macrealty Marketing Team | Mar 8, 2022 | Market Updates
Here are the latest real estate market statistics from Macdonald Realty on Okanagan listings and sales in February 2022.
Find the infographics by visiting the Facebook Album.
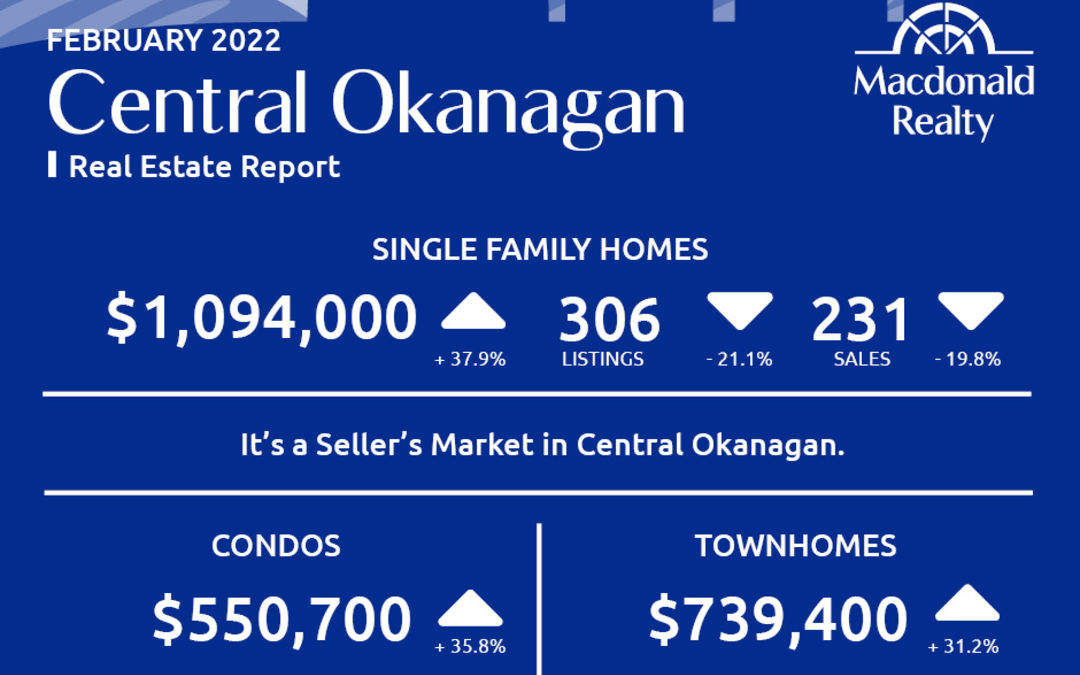
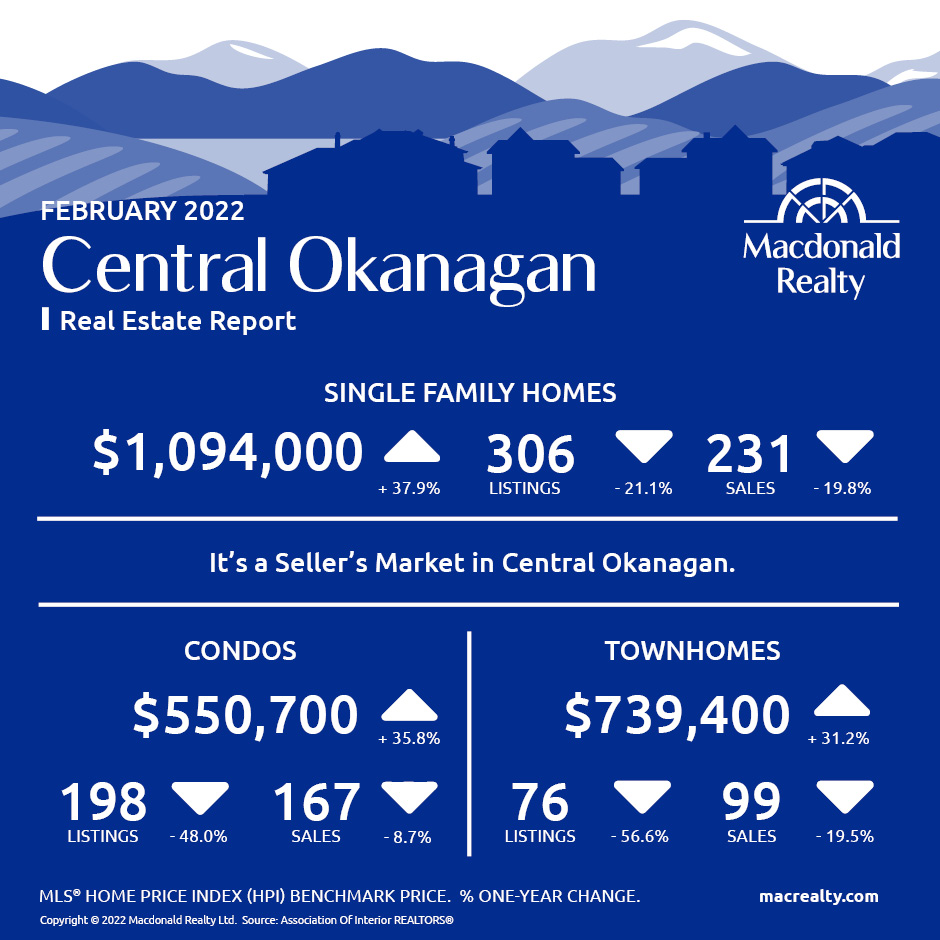
Central Okanagan: Kelowna and Lake Country
There were 231 sales, 306 active listings, and $1,094,000 average sale price for detached homes in the Central Okanagan market, including Kelowna and Lake Country.
The condo market featured 167 sales and 198 active listings at the end of the month. The average sale price was $550,700. Townhome sales were 99, active listings were 76 and the average sale price was $739,400. It’s a seller’s market in Central Okanagan.
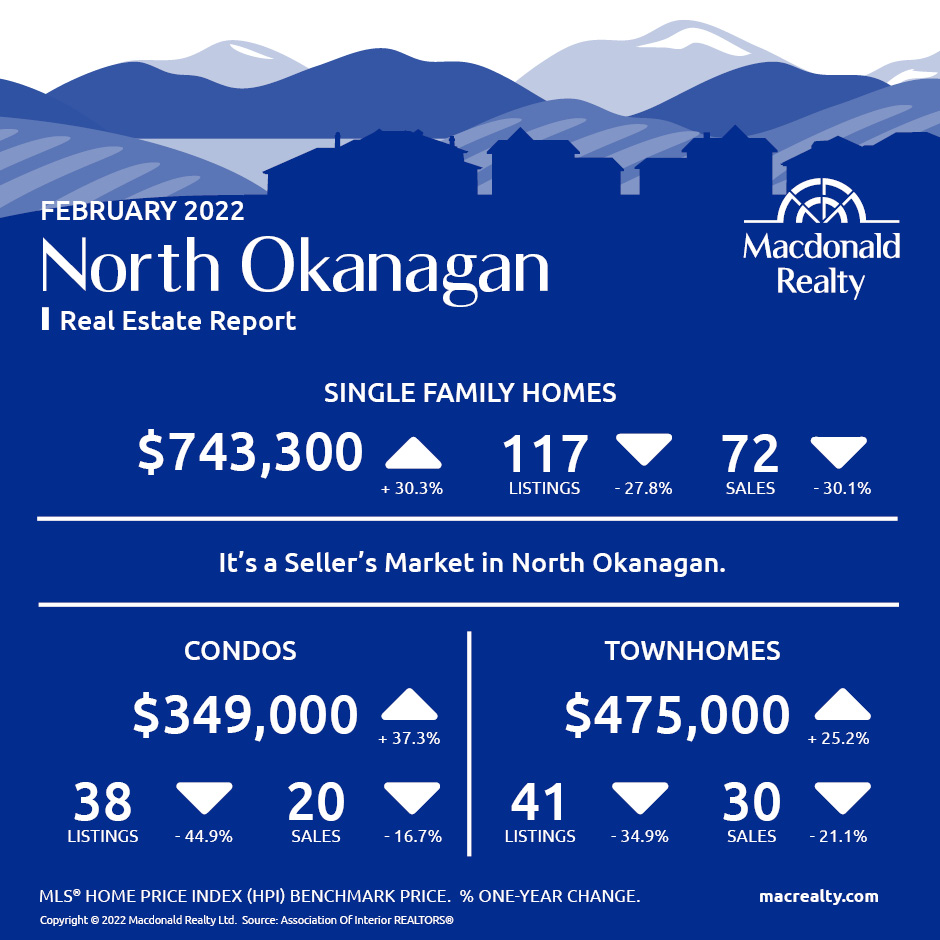
North Okanagan: Vernon and surrounding area
In North Okanagan, including Vernon and the surrounding area and the average sale price was $743,300. At the end of the month, there were 72 sales and 117 active listings. There were 20 sales and 38 active listings for condos. The average sale price was $349,000. In comparison, townhomes featured 30 sales, 41 active listings and a $475,000 average sale price. It’s a seller’s market in North Okanagan.
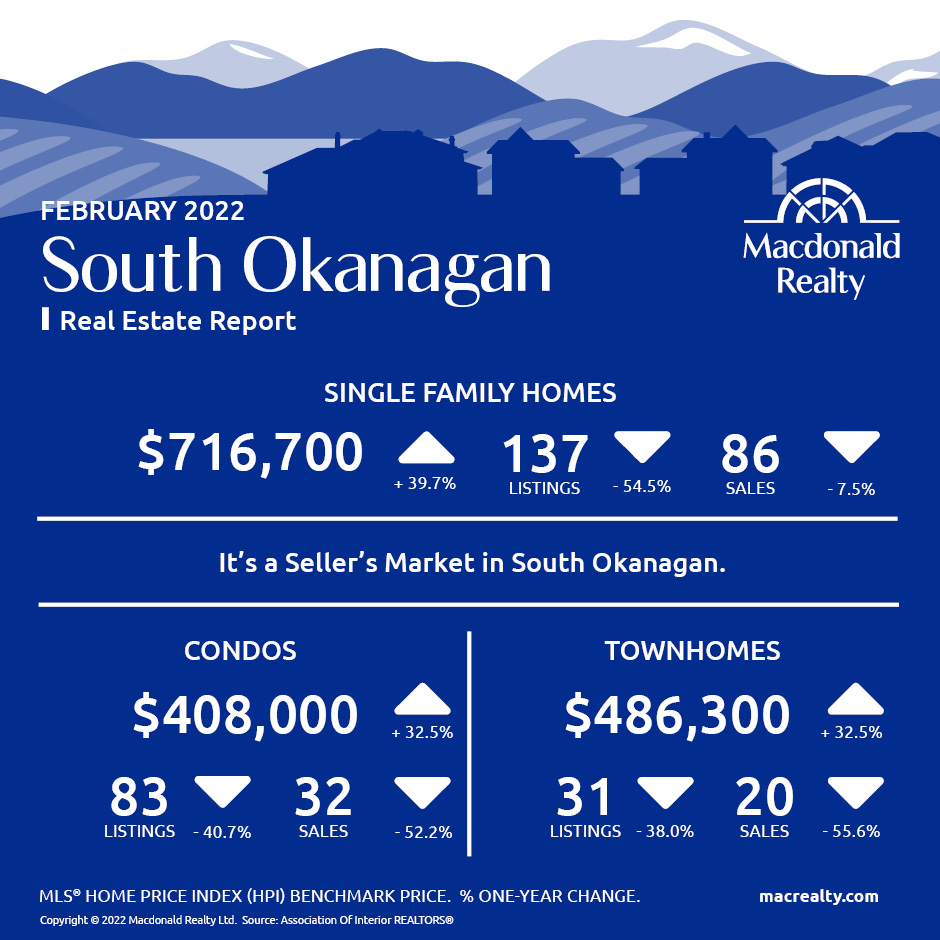
South Okanagan
There were 86 sales, 137 active listings, and $716,700 average sale price for detached homes in the South Okanagan market.
The condo market featured 32 sales and 83 active listings at the end of the month. The average sale price was $408,000. Townhome sales were 20, active listings were 31 and the average sale price was $486,300. It’s a seller’s market in South Okanagan.
Looking for more information about the real estate market in specific neighbourhoods in Okanagan?
Macdonald Realty has offices in Kelowna and across BC. Please email [email protected] or call 1-877-278-3888 to be matched with a REALTOR® working in your area.
This blog post is based on market data provided by the Association Of Interior REALTORS® https://www.interiorrealtors.ca/.