by Macrealty Marketing Team | Jun 3, 2022 | Market Updates
June 2022 – Lower Mainland Monthly Update (REBGV & FVREB)
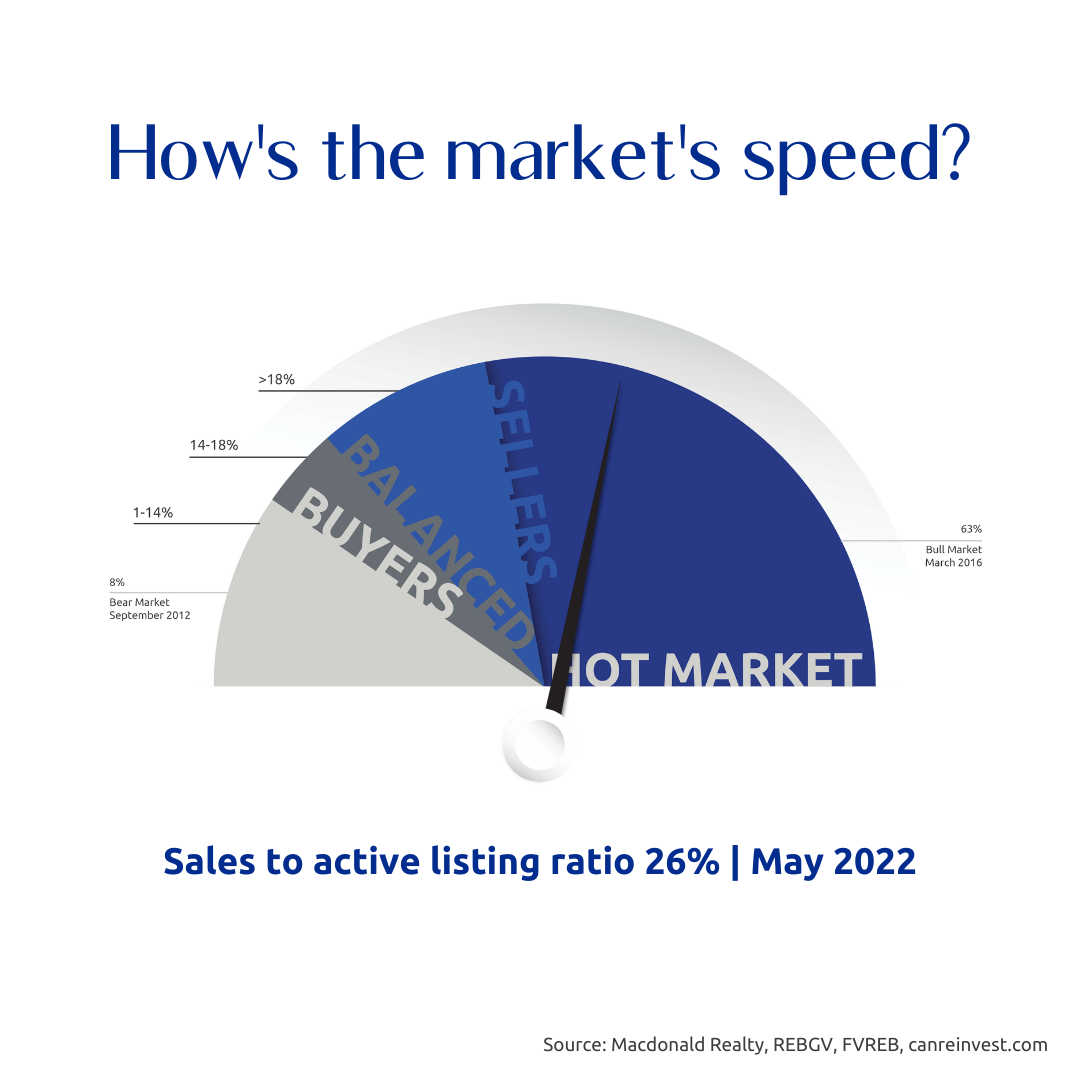
Metro Vancouver & Fraser Valley sales have continued to decelerate.
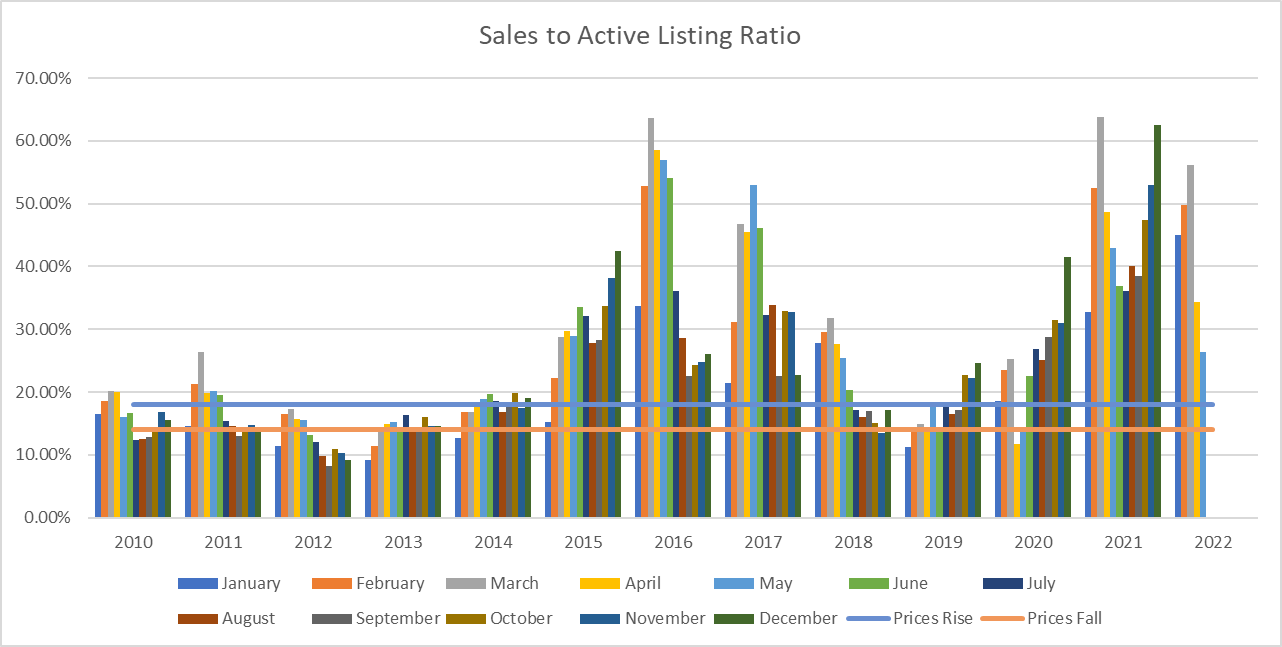
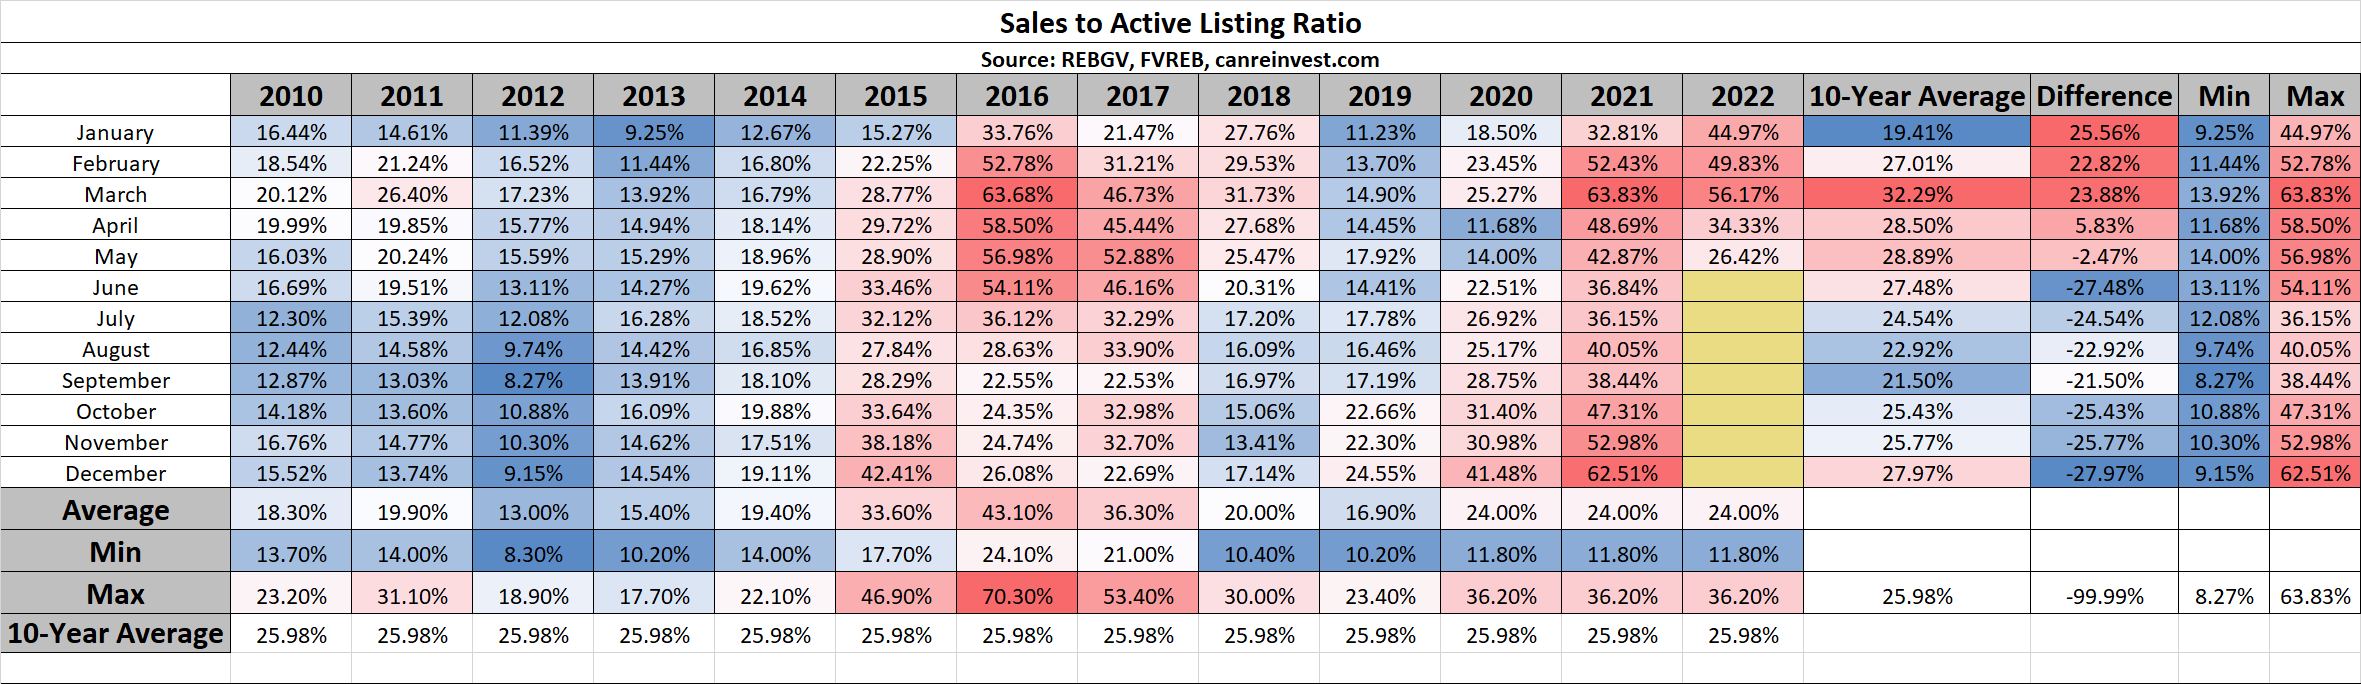
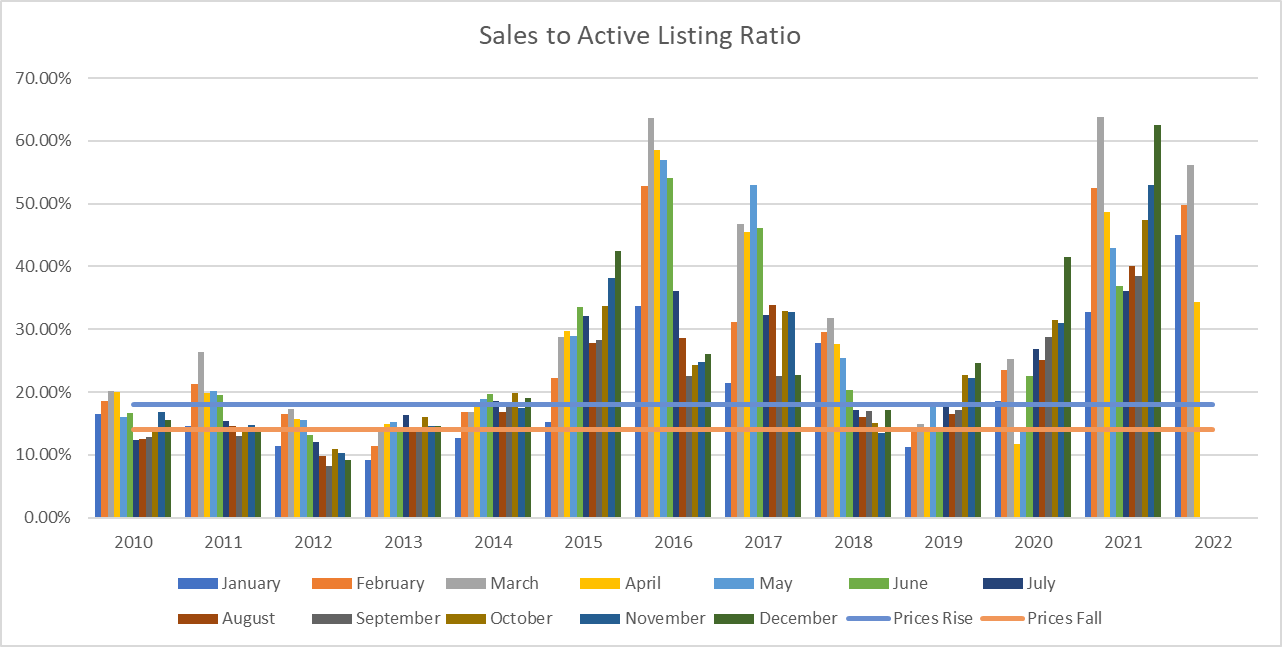
The most reliable indicator of market prices is the Sales to Active Listings Ratio (SAL). This is the ratio between the number of sales in a given month and the number of active listings at month-end.
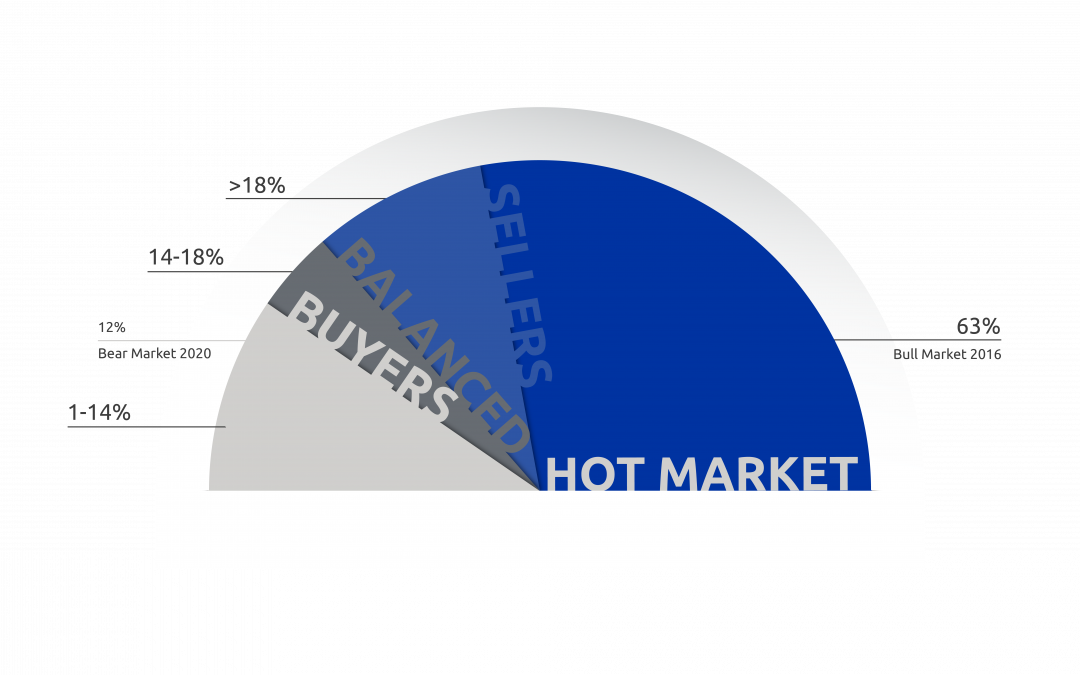
In hotter markets in BC, a long-term analysis has shown that prices will usually act in the following ways:
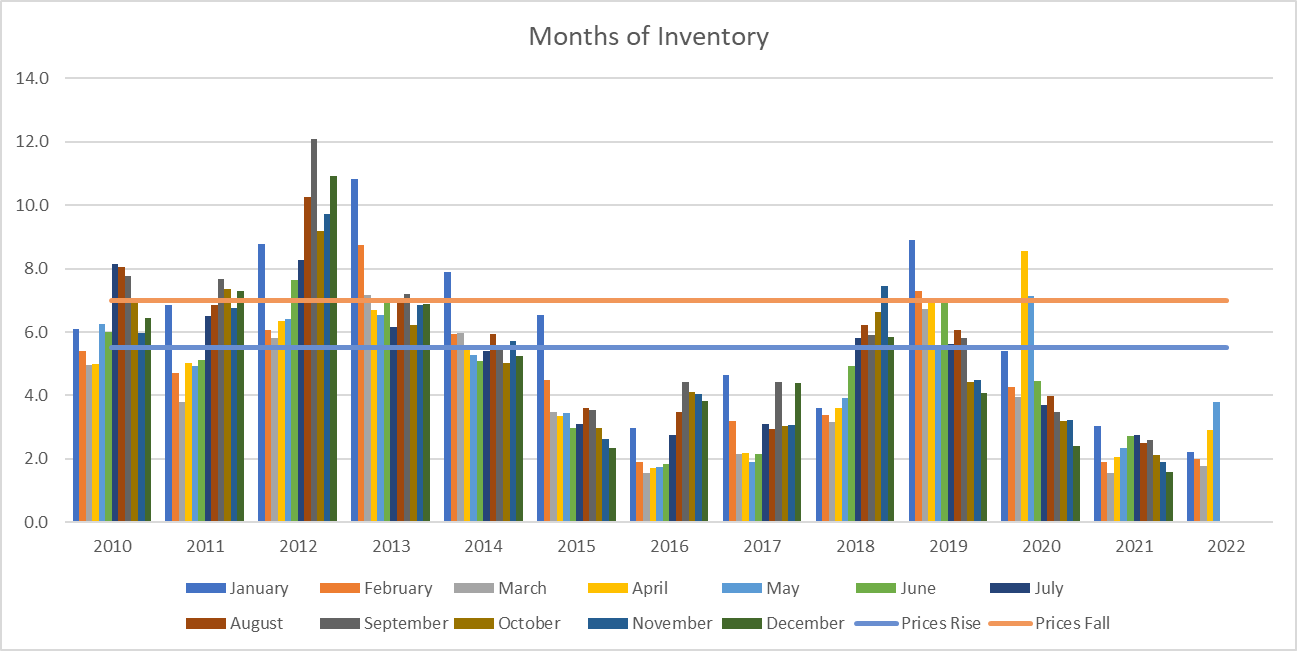
- 7+ Months of Inventory (Under 14% SAL): Prices will likely DECLINE
- 5 – 7 Months of Inventory (14% – 18% SAL): Prices will likely be STABLE
- Less than 5.5 Months of Inventory (Over 18% SAL): Prices will likely RISE
Visit this link to learn more about house prices and inventory.
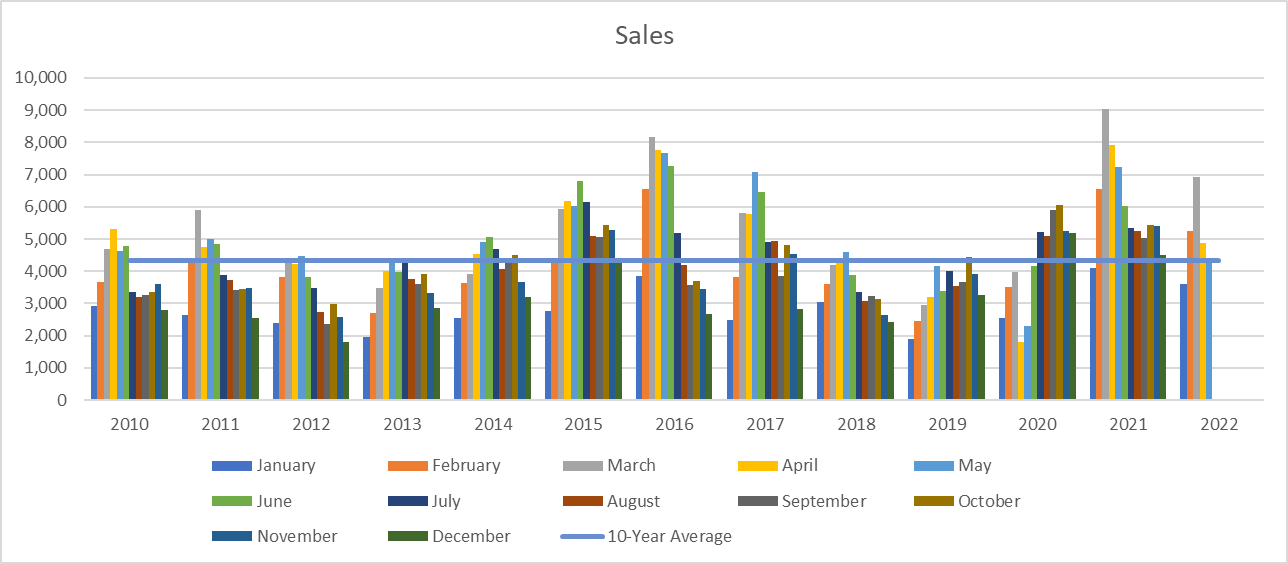
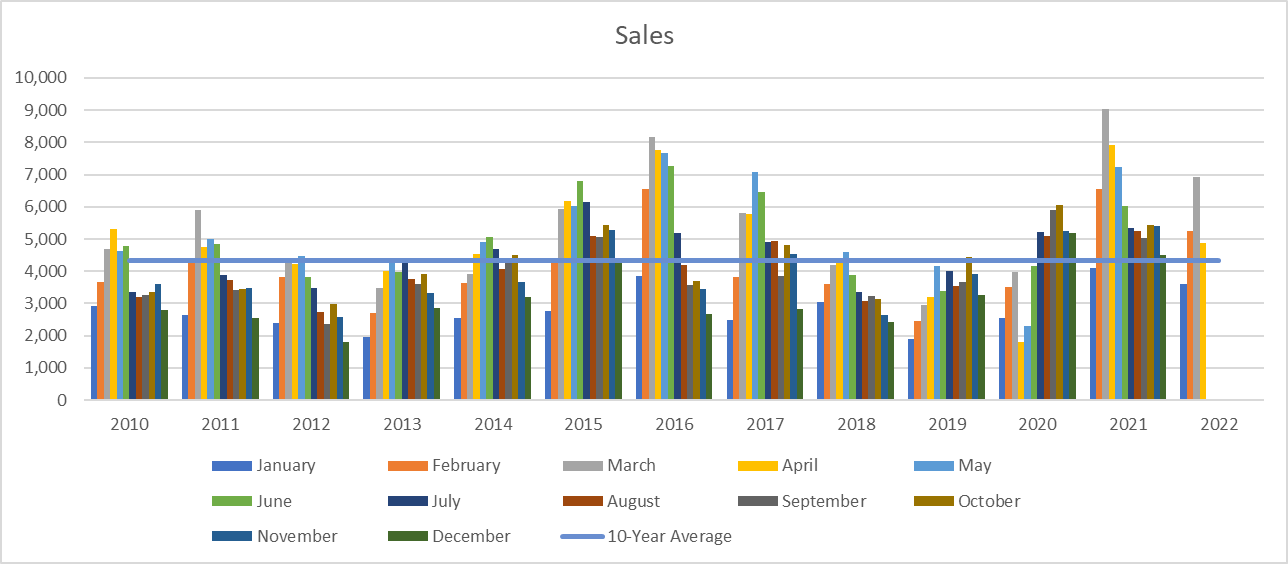
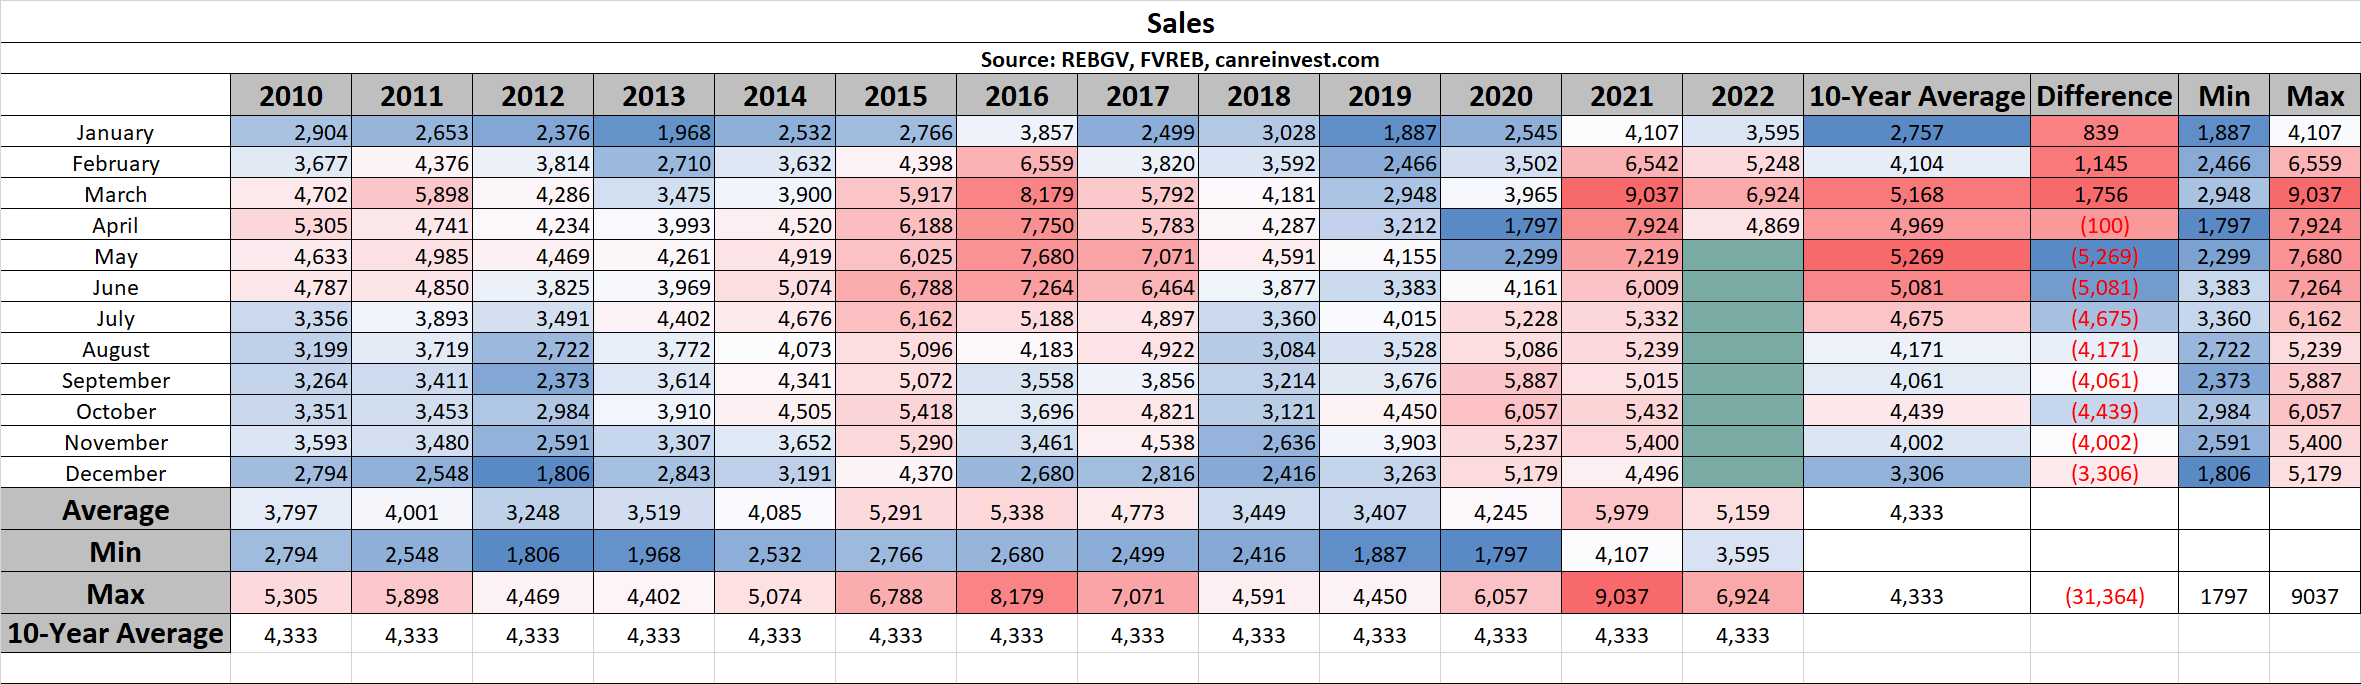
Sales
Sales in the Lower Mainland continue to decelerate. Monthly sales fell below the 10-year average (4,278 sales vs 5,269 average)

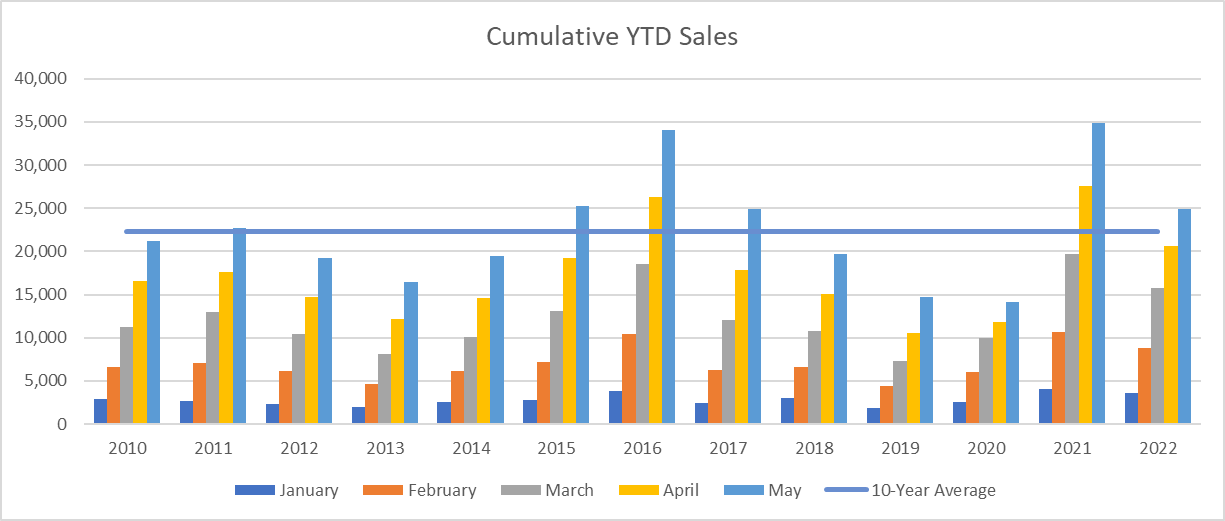
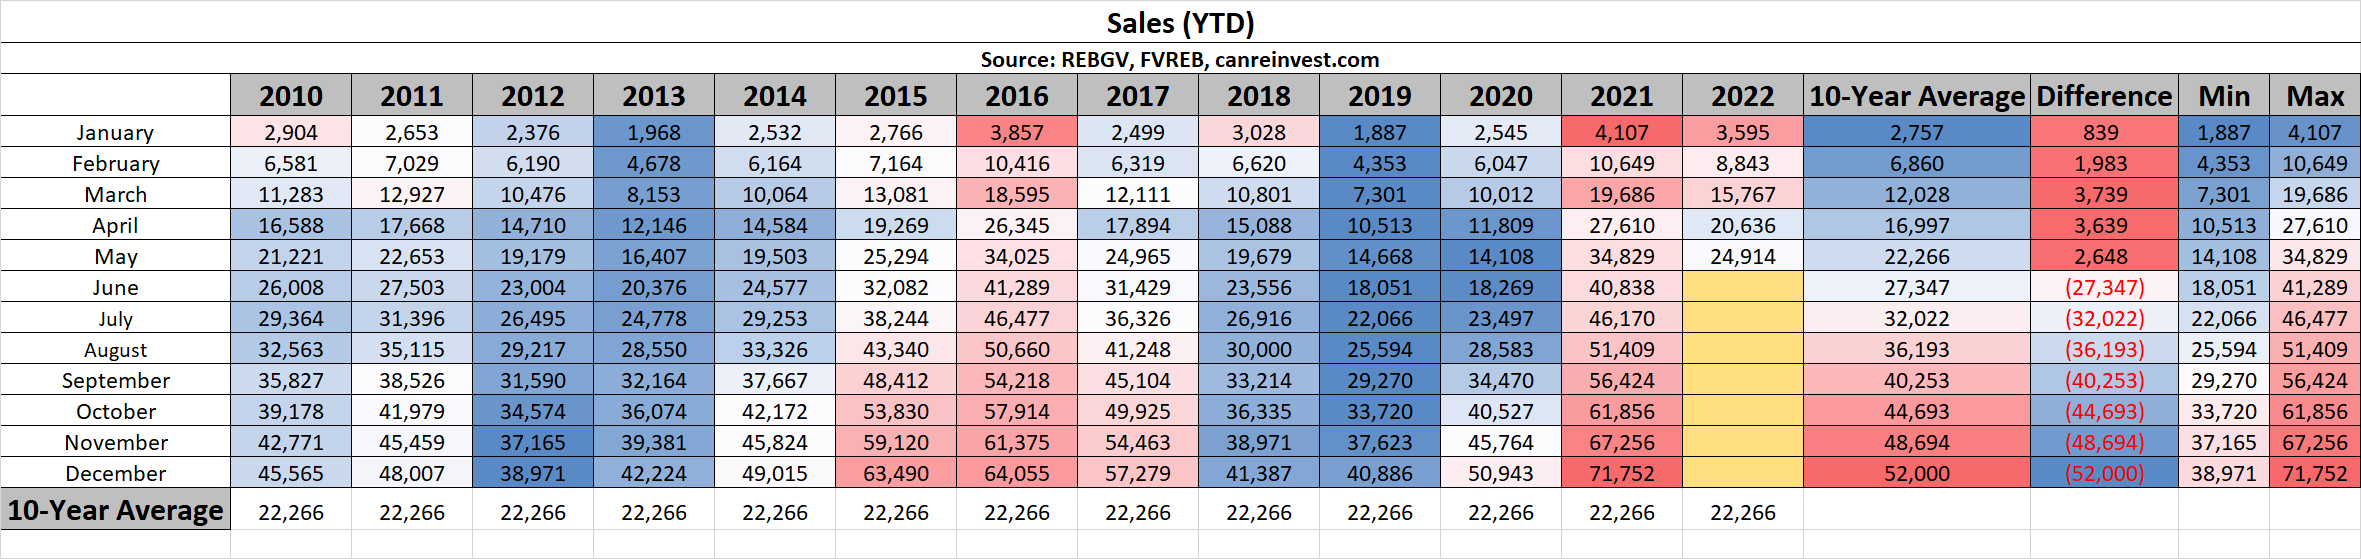
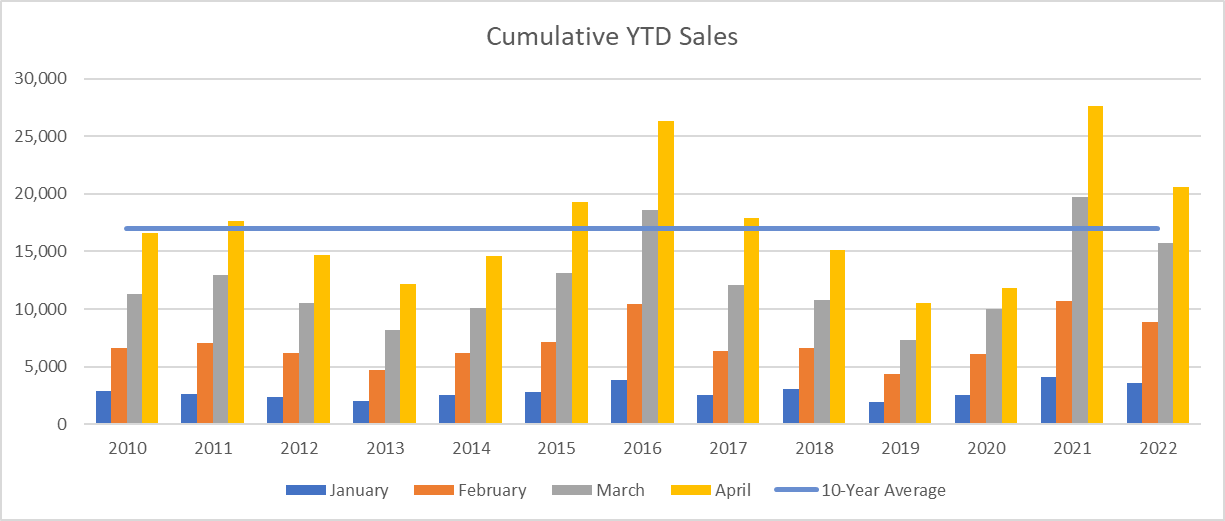
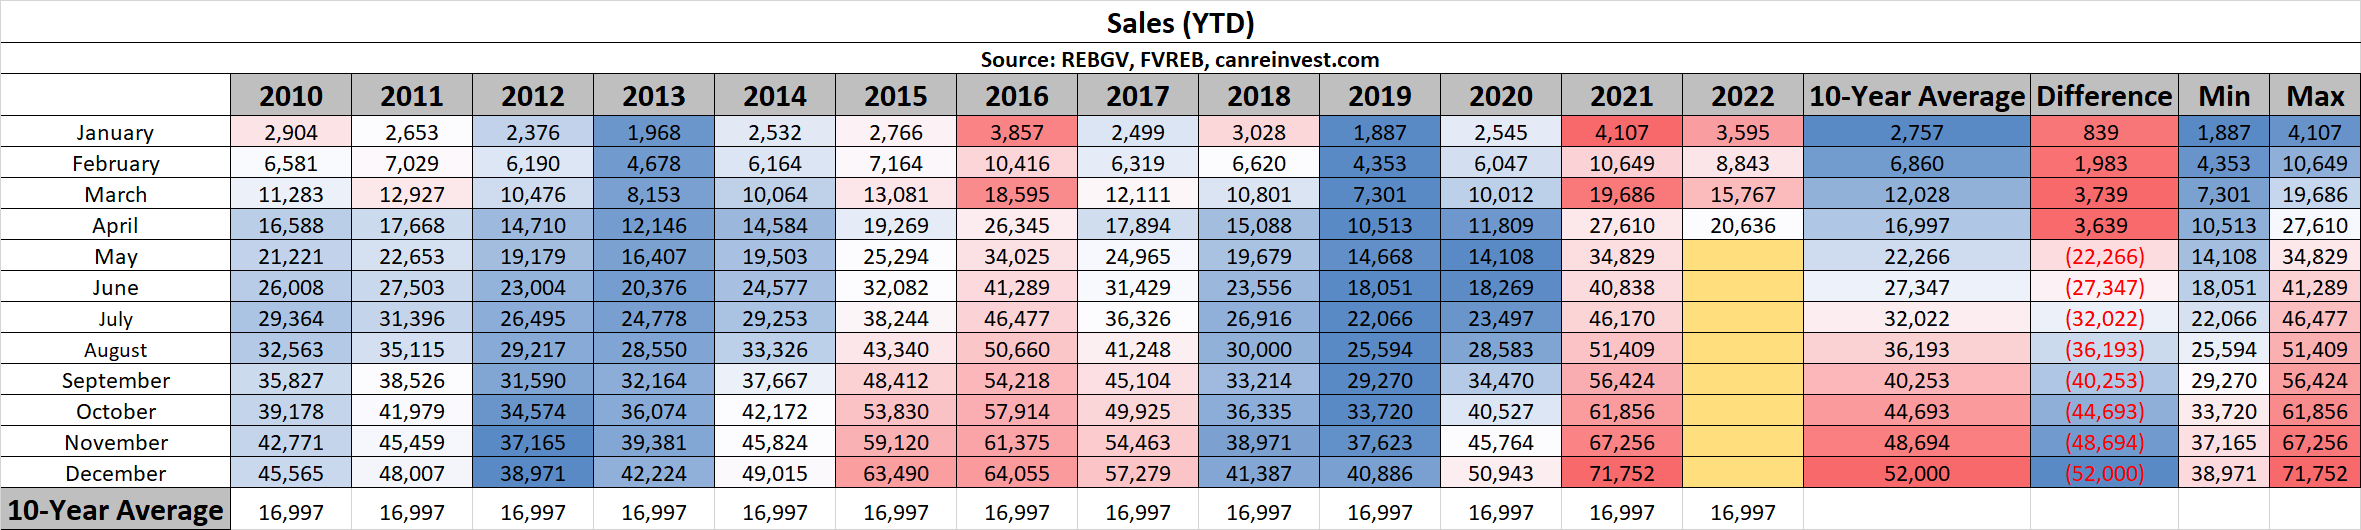
Cumulative Year-to-date Sales
Year-to-Date sales remain above the 10-year average (24,914 sales vs 22,266 average)
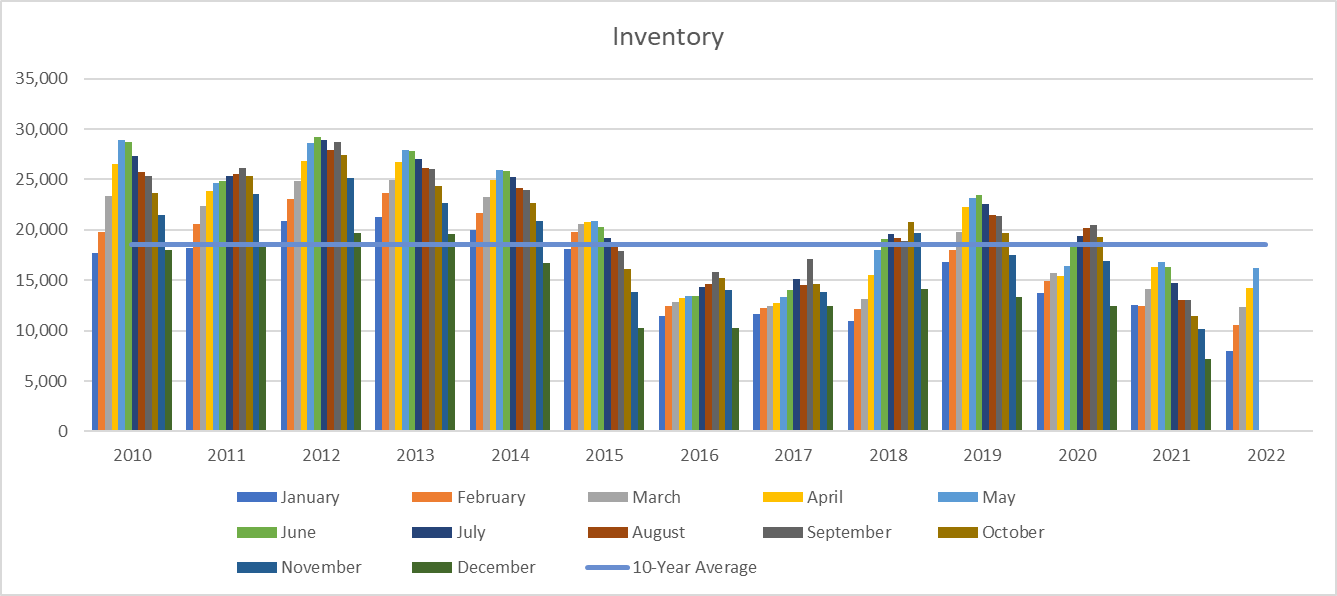
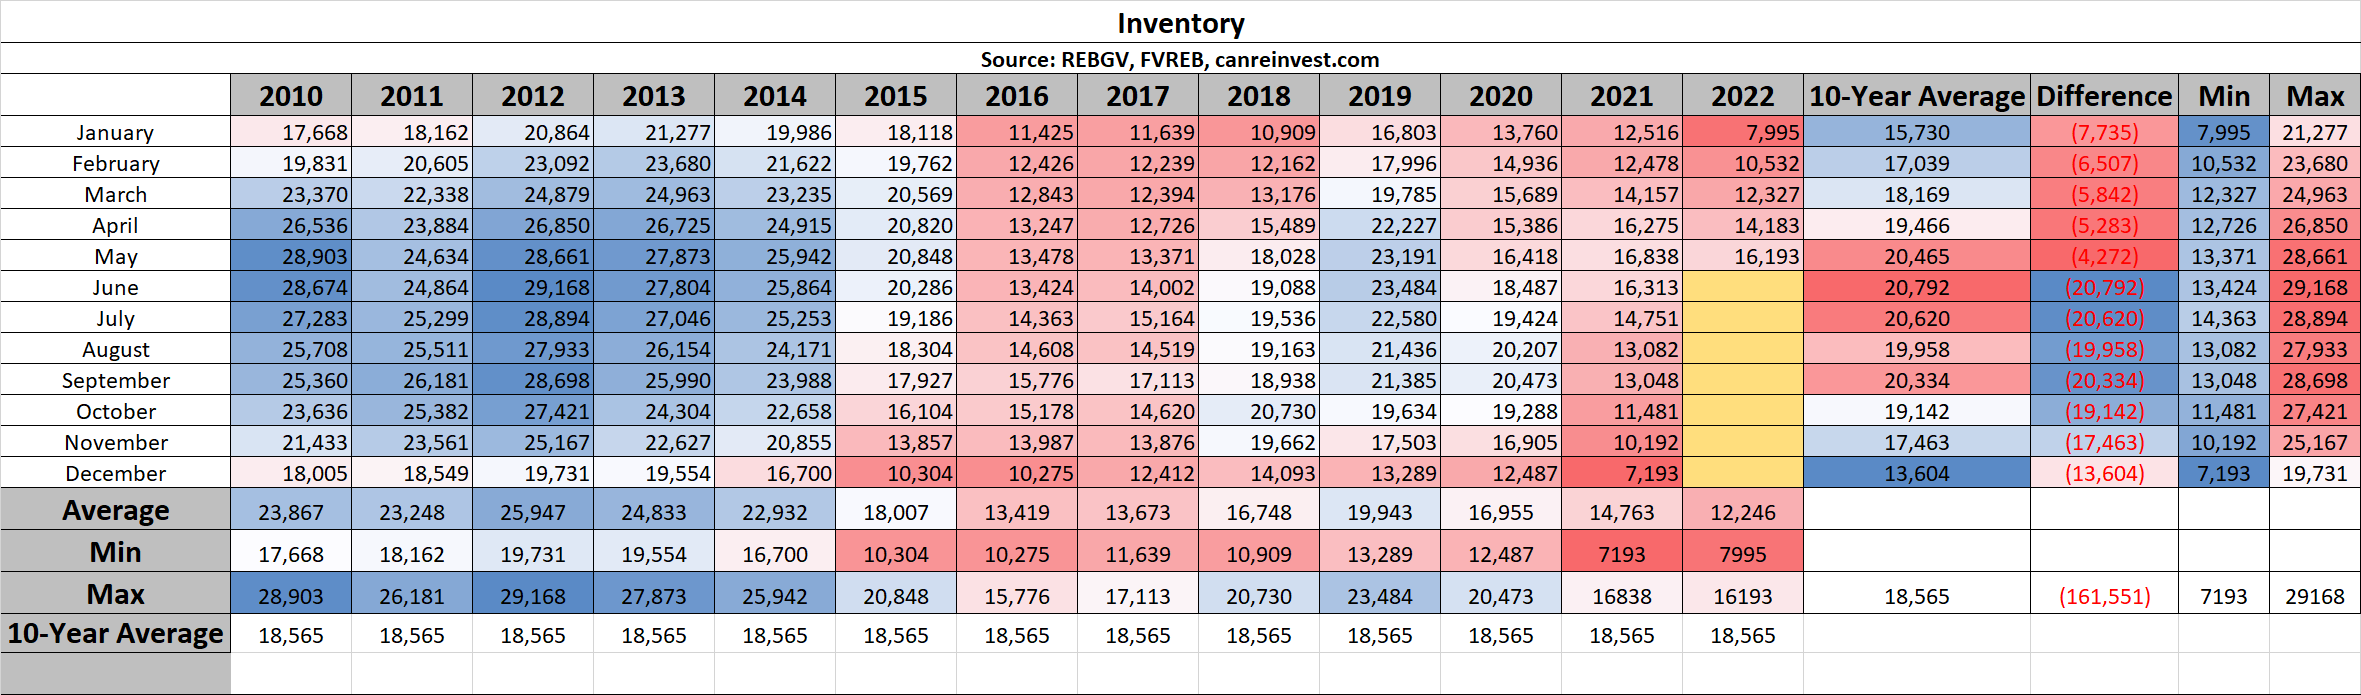
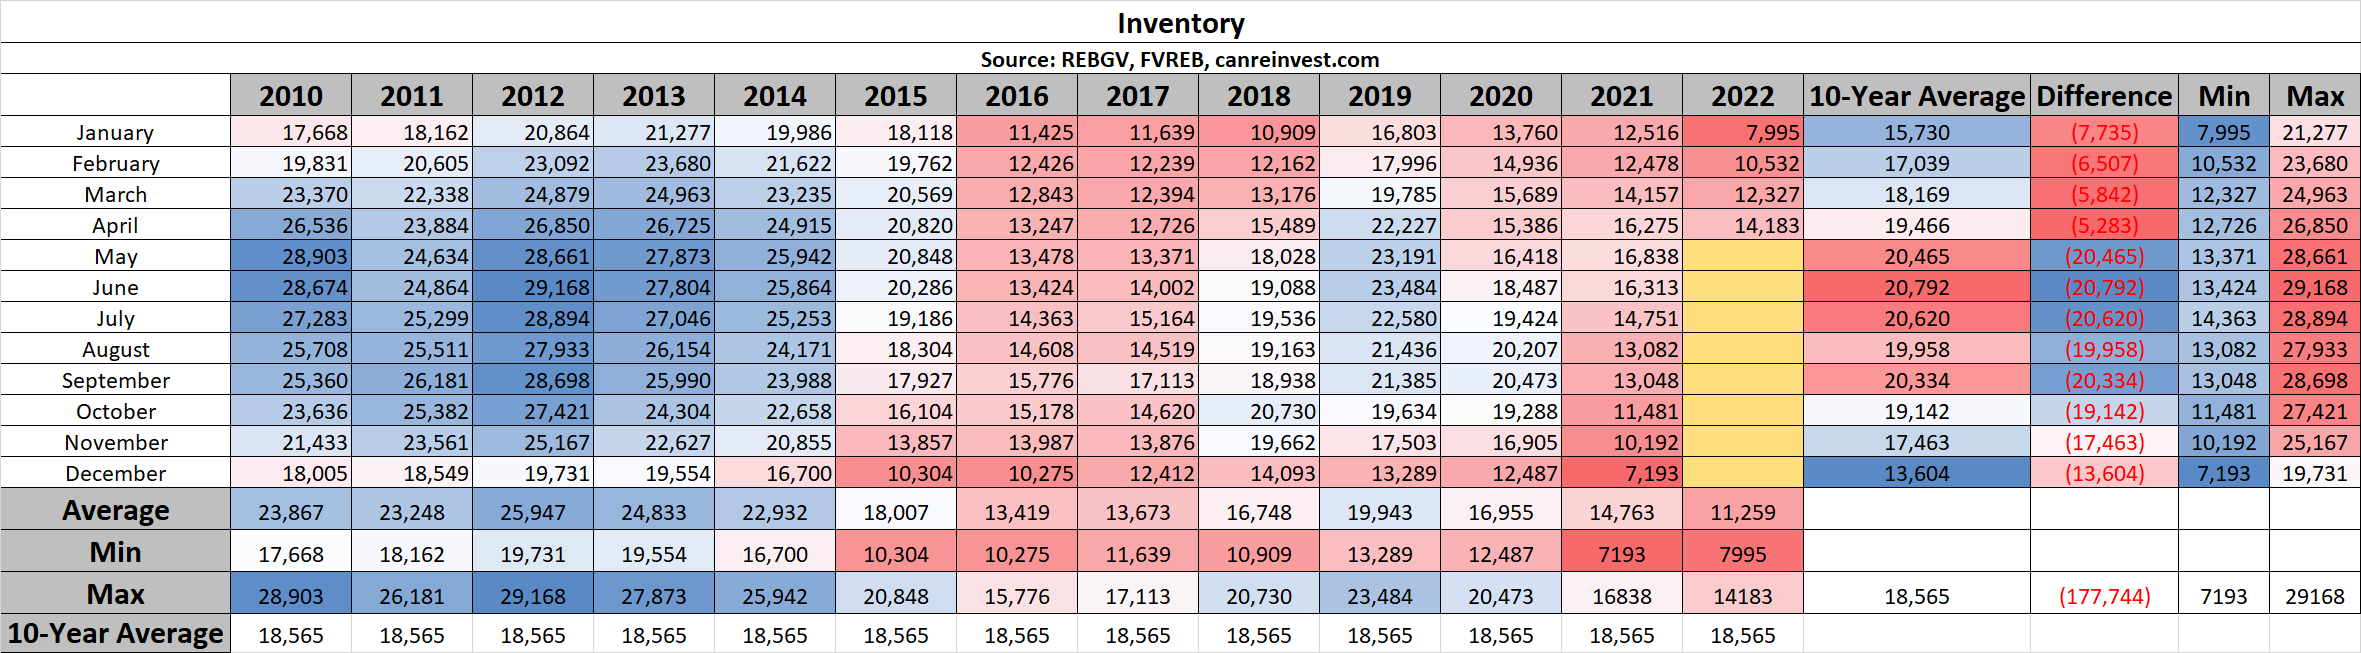
Inventory
Inventory remains stubbornly low, coming in at 20% below the 10-year average (16,193 listings vs 20,465 average)
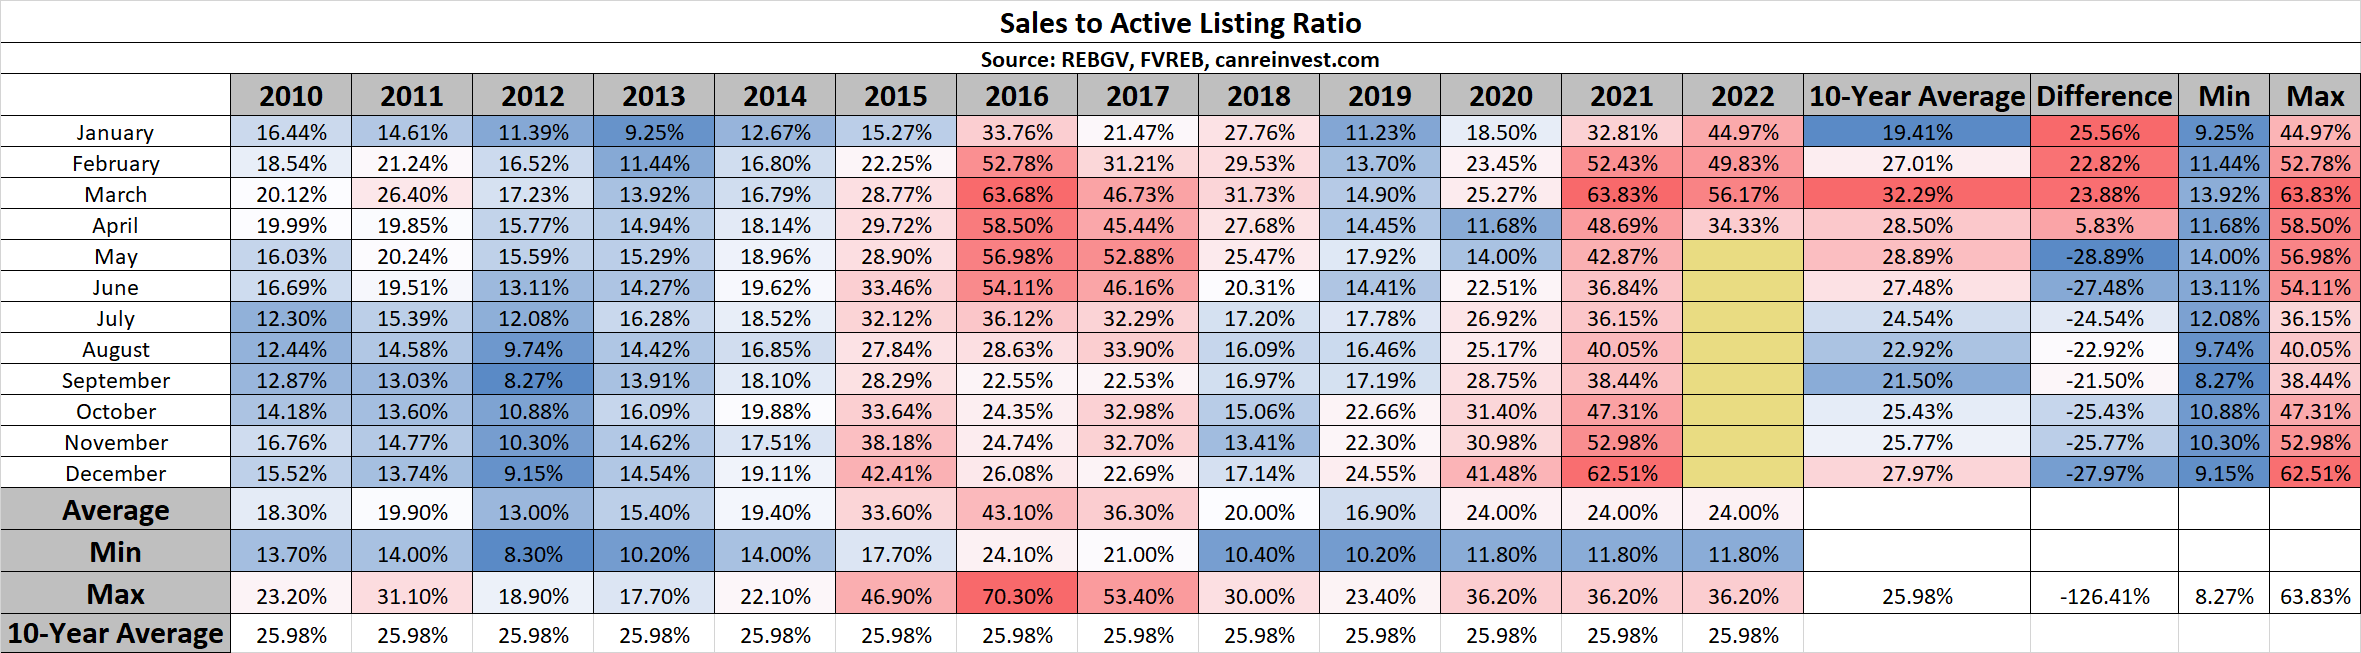
Sales to Active Listings
Sales to Active Listings continues to drop, and now sits at 26%, indicating stabilizing prices.
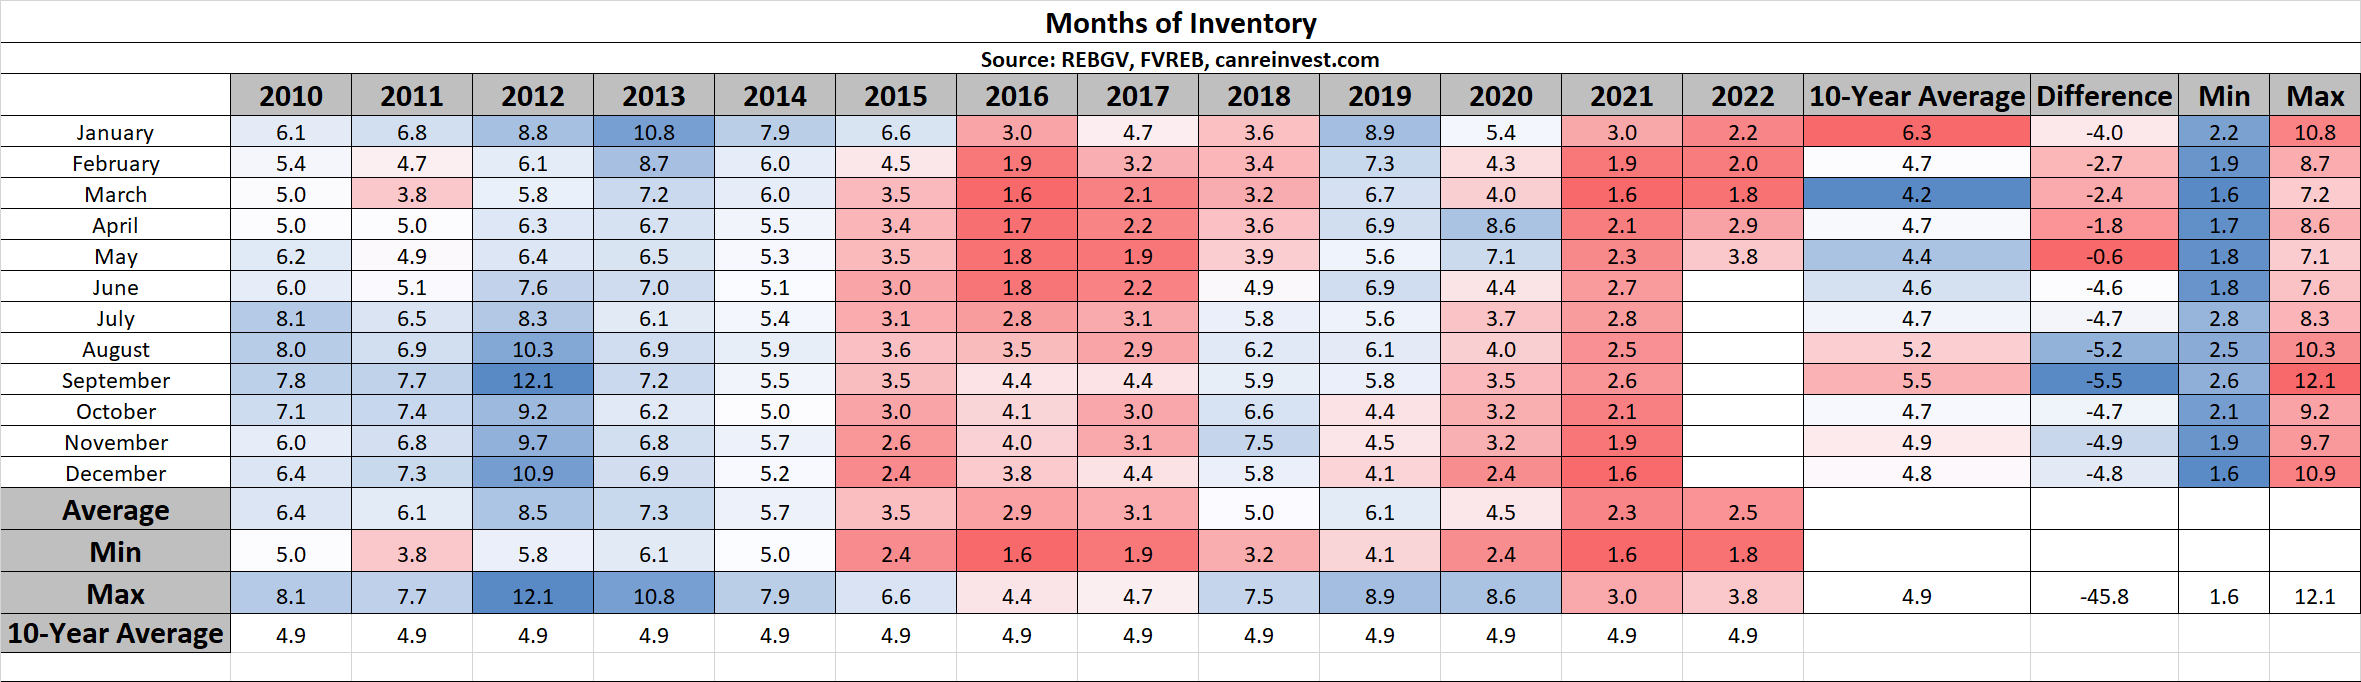
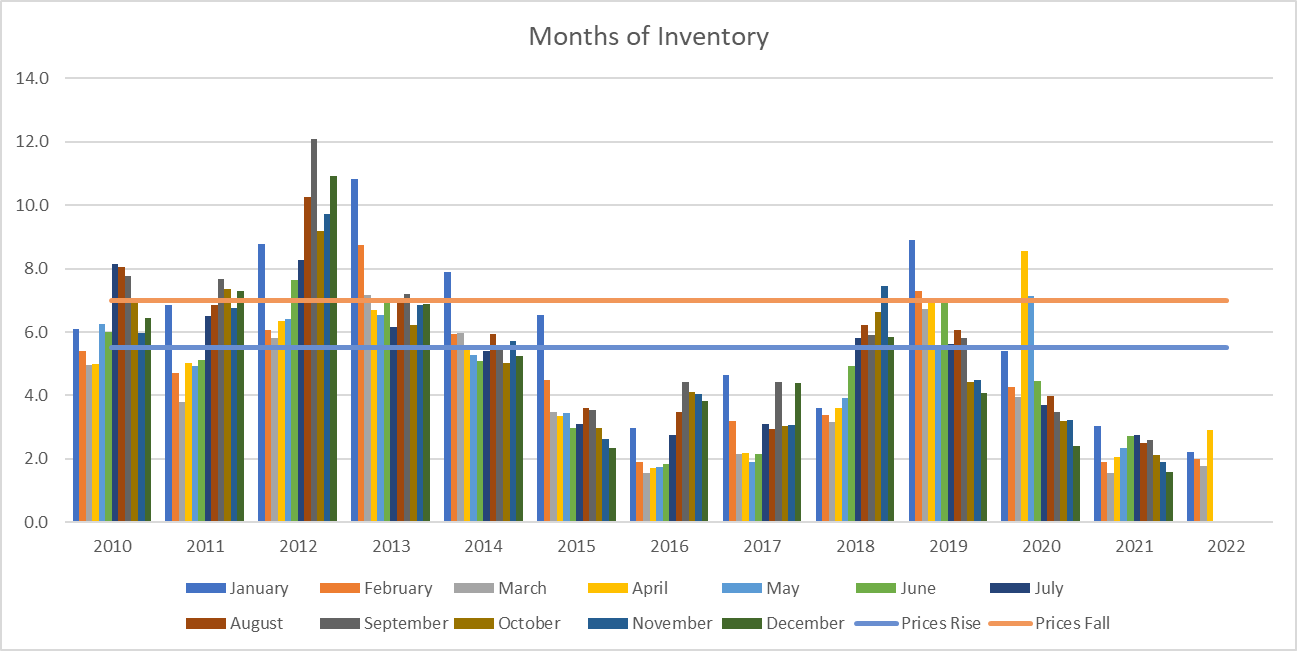
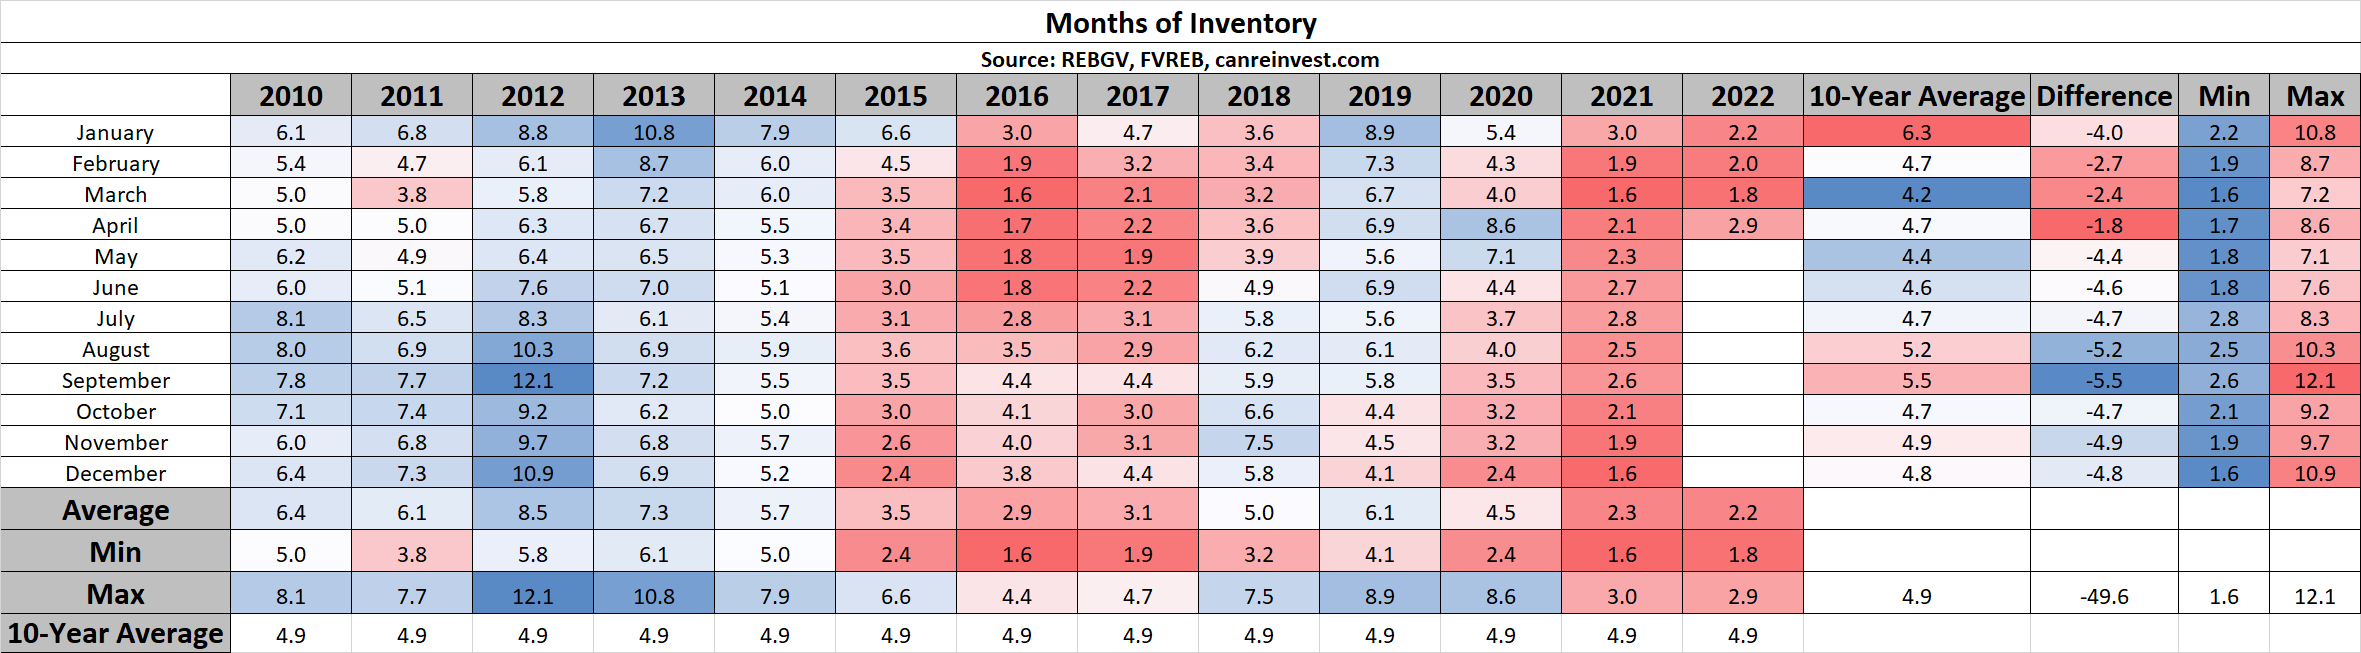
Months of Inventory
Months of Inventory continues to grow, and now sits at 3.8, but still below the 10-year average of 4.4.
Want to learn more about these stats or discuss your move to Macdonald Realty?
Check out careersinbcrealestate.com to connect today!
by Macrealty Marketing Team | Apr 25, 2022 | Market Updates
May 2022 – Lower Mainland Monthly Update (REBGV & FVREB)
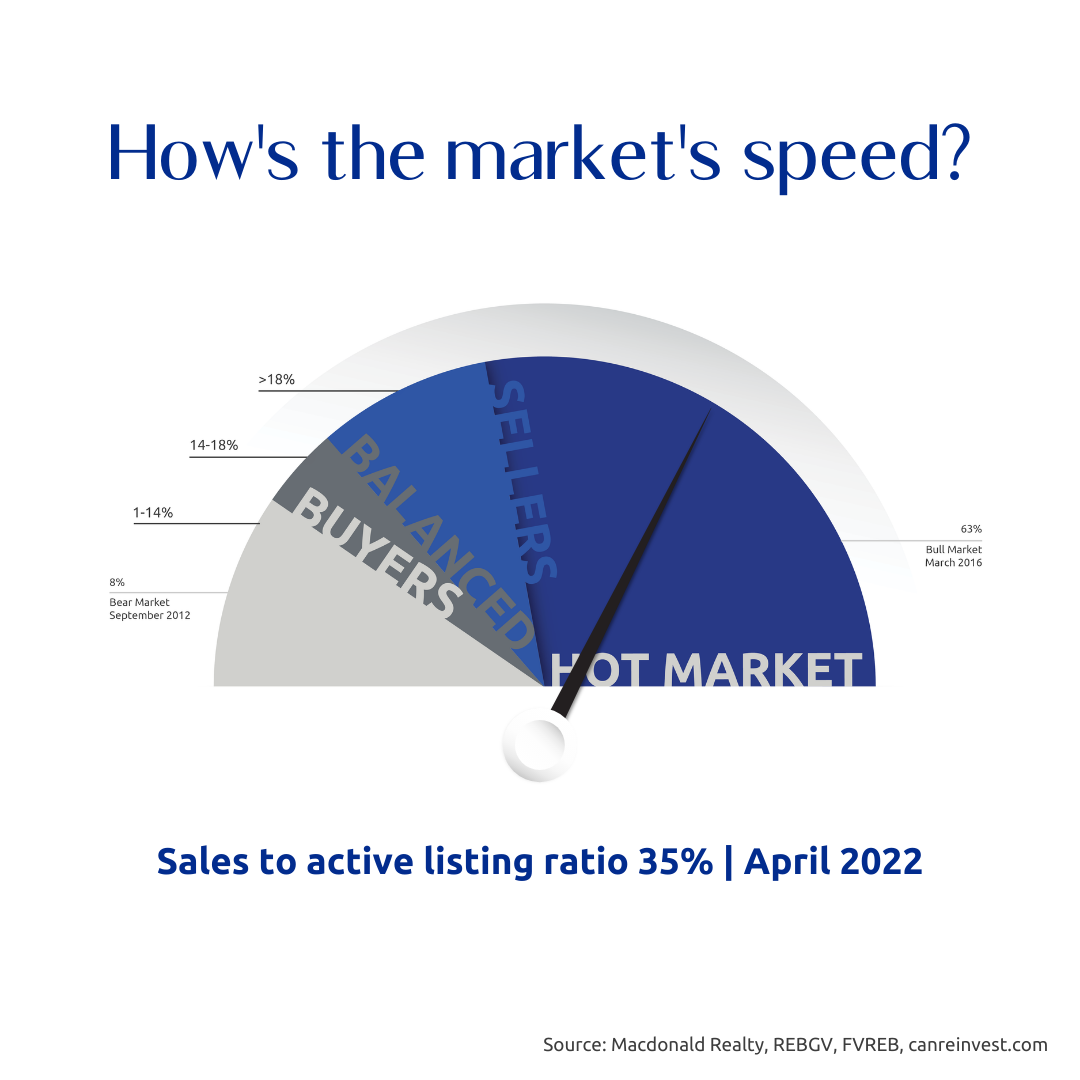
Metro Vancouver & Fraser Valley sales have moderated.
The most reliable indicator of market prices is the Sales to Active Listings Ratio (SAL). This is the ratio between the number of sales in a given month and the number of active listings at month-end.
In hotter markets in BC, a long-term analysis has shown that prices will usually act in the following ways:
- 7+ Months of Inventory (Under 14% SAL): Prices will likely DECLINE
- 5 – 7 Months of Inventory (14% – 18% SAL): Prices will likely be STABLE
- Less than 5.5 Months of Inventory (Over 18% SAL): Prices will likely RISE
Visit this link to learn more about house prices and inventory.
Sales
Sales have moderated in April and are now at the 10-year average (4,869 sales in April vs 4,969 average).
Cumulative Year-to-date Sales
Year-to-Date, we are still 20% above the 10-year average (20,636 sales vs 16,997 average).
Inventory
Inventory in April is no longer the lowest on record, but is still 25% below the 10-year average (14,183 listings vs 19,466 average).

Sales to Active Listings
SAL has dropped from 56% in March to 34% in April. Typically, a SAL of 34% would indicate rising prices, but given the trajectory, it likely means moderating prices.
Months of Inventory
Similarly to SAL, MOI has grown from 1.8 months to 2.9 months (a balanced market is 5.5 – 6.5 months), indicating a still tight, but moderating market.
Want to learn more about these stats or discuss your move to Macdonald Realty?
Check out careersinbcrealestate.com to connect today!
by Macrealty Marketing Team | Apr 8, 2022 | Market Updates
Here are the latest real estate market statistics from Macdonald Realty on Okanagan listings and sales in March 2022.
Find the infographics by visiting the Facebook Album.
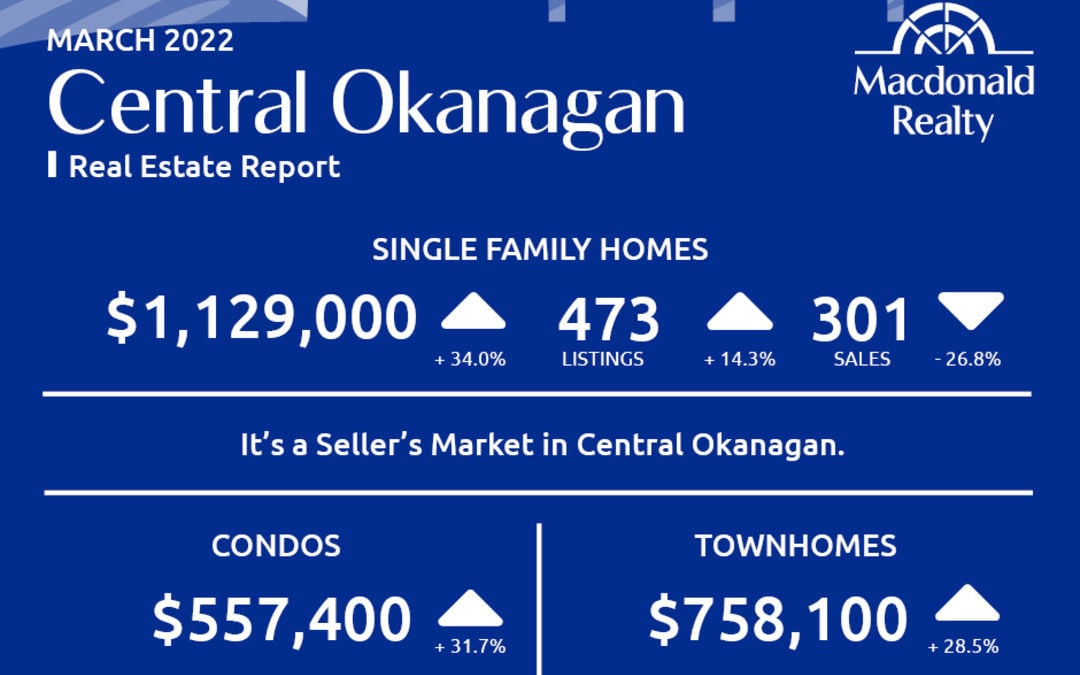
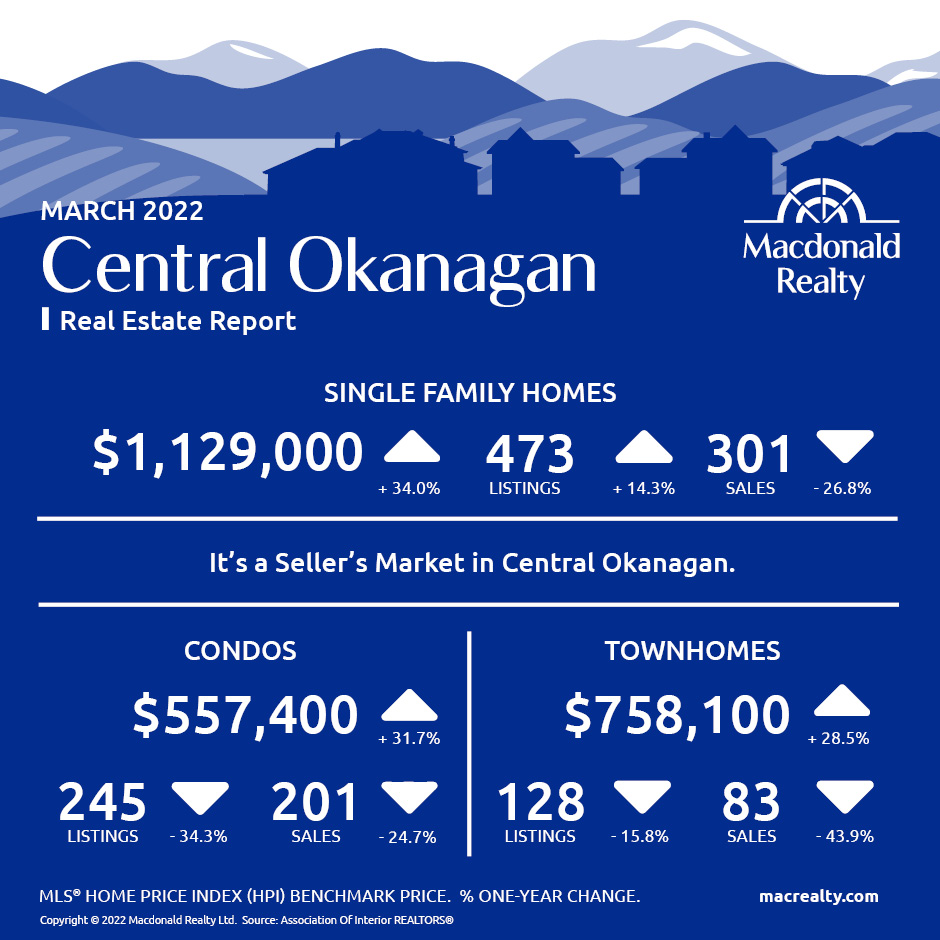
Central Okanagan: Kelowna and Lake Country
There were 301 sales, 473 active listings, and $1,129,000 average sale price for detached homes in the Central Okanagan market, including Kelowna and Lake Country.
The condo market featured 201 sales and 245 active listings at the end of the month. The average sale price was $557,400. Townhome sales were 83, active listings were 128 and the average sale price was $758,100. It’s a seller’s market in Central Okanagan.
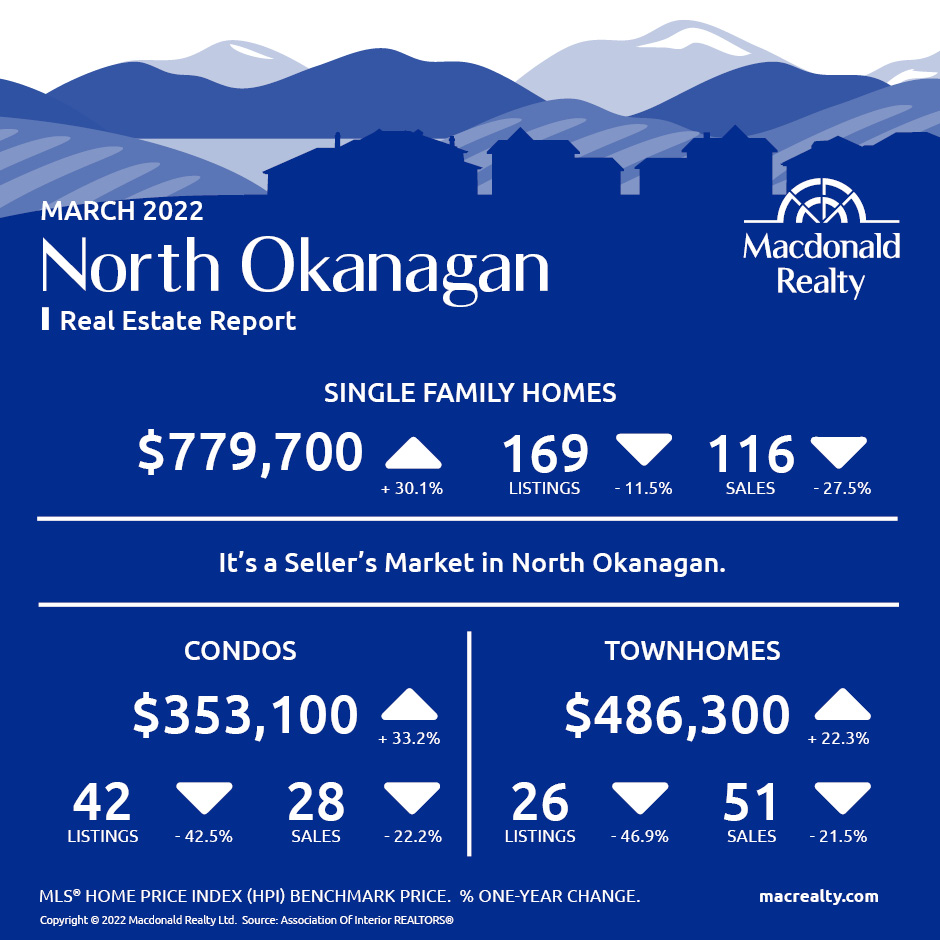
North Okanagan: Vernon and surrounding area
In North Okanagan, including Vernon and the surrounding area and the average sale price was $779,700. At the end of the month, there were 116 sales and 169 active listings. There were 28 sales and 42 active listings for condos. The average sale price was $353,100. In comparison, townhomes featured 51 sales, 26 active listings and a $486,300 average sale price. It’s a seller’s market in North Okanagan.
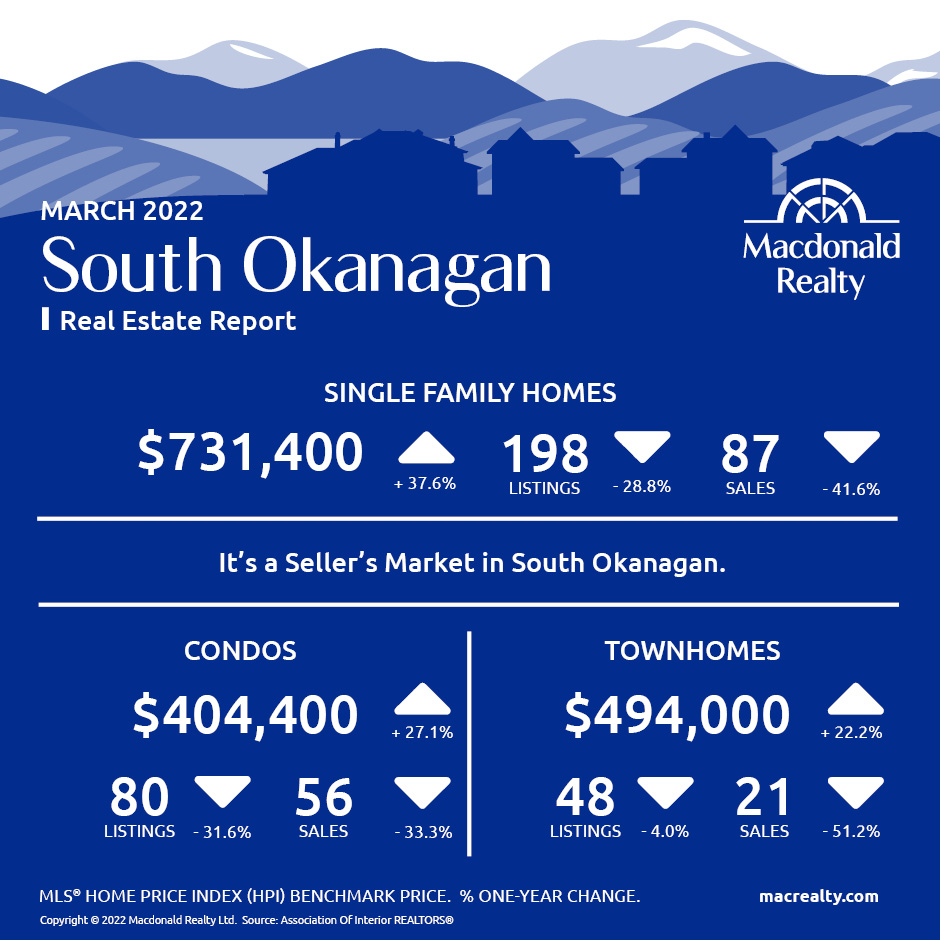
South Okanagan
There were 87 sales, 198 active listings, and $731,400 average sale price for detached homes in the South Okanagan market.
The condo market featured 56 sales and 80 active listings at the end of the month. The average sale price was $404,400. Townhome sales were 21, active listings were 48 and the average sale price was $494,000. It’s a seller’s market in South Okanagan.
Looking for more information about the real estate market in specific neighbourhoods in Okanagan?
Macdonald Realty has offices in Kelowna and across BC. Please email [email protected] or call 1-877-278-3888 to be matched with a REALTOR® working in your area.
This blog post is based on market data provided by the Association Of Interior REALTORS® https://www.interiorrealtors.ca/.
by Macrealty Marketing Team | Apr 8, 2022 | Market Updates
Here are the latest real estate market statistics from Macdonald Realty on Greater Victoria, Saanich Peninsula, Parksville/Qualicum, and Nanaimo listings and sales in March 2022. Find all the infographics related to the March Market Statistics by visiting the Facebook Album.
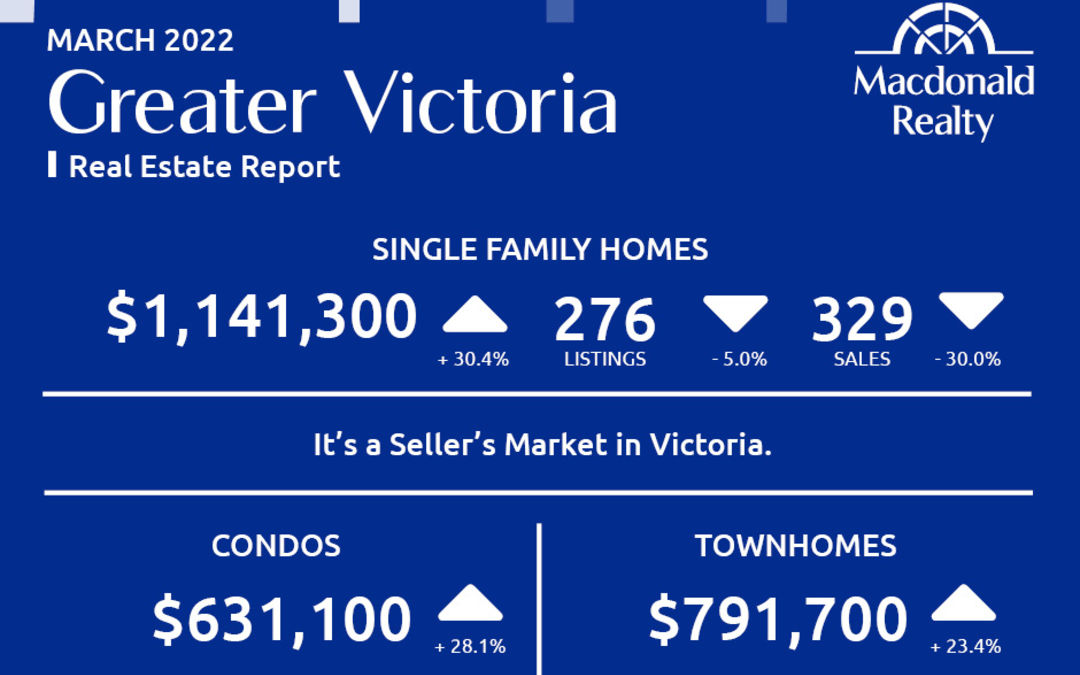
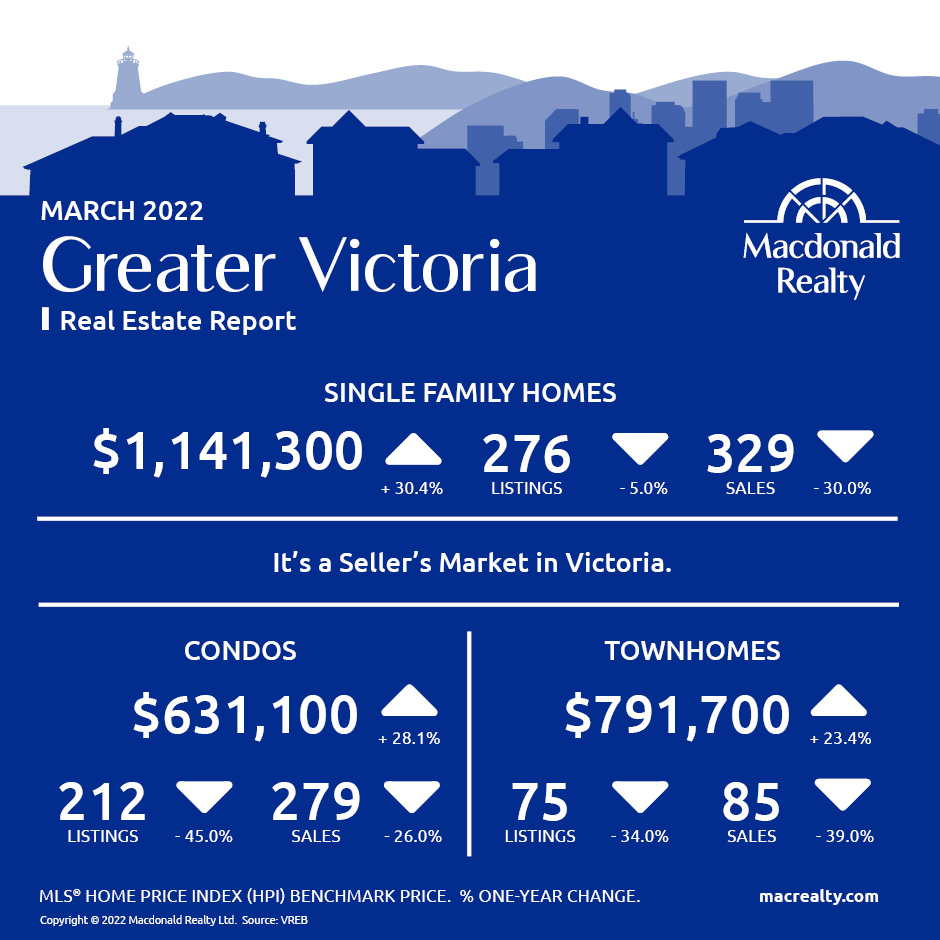
A total of 833 properties sold in the Victoria Real Estate Board region this March, 29 per cent fewer than the 1,173 properties sold in March 2021 but a 16 per cent increase from February 2022. Sales of condominiums were down 26 per cent from March 2021 with 279 units sold. Sales of single family homes decreased 28.2 per cent from March 2021 with 412 sold.
“Once again, we have had a record breaker of a month,” said 2022 Victoria Real Estate Board President Karen Dinnie-Smyth. “This March had the lowest number of active listings we have seen in a month of March – beating last year’s record low. For context, in the past five years the average number of active listings at the end of March is 1,864 properties. This March had just over one thousand properties at month end. We did see more homes come to market this month compared to February – which is a positive sign – but our supply is still so constricted that multiple offers and competition continues, especially in the lower price ranges. We may see a lift in that pressure if more listings come to market over the spring, but since our inventory is so much lower than average, we have a long way to go to find balance.”
Greater Victoria
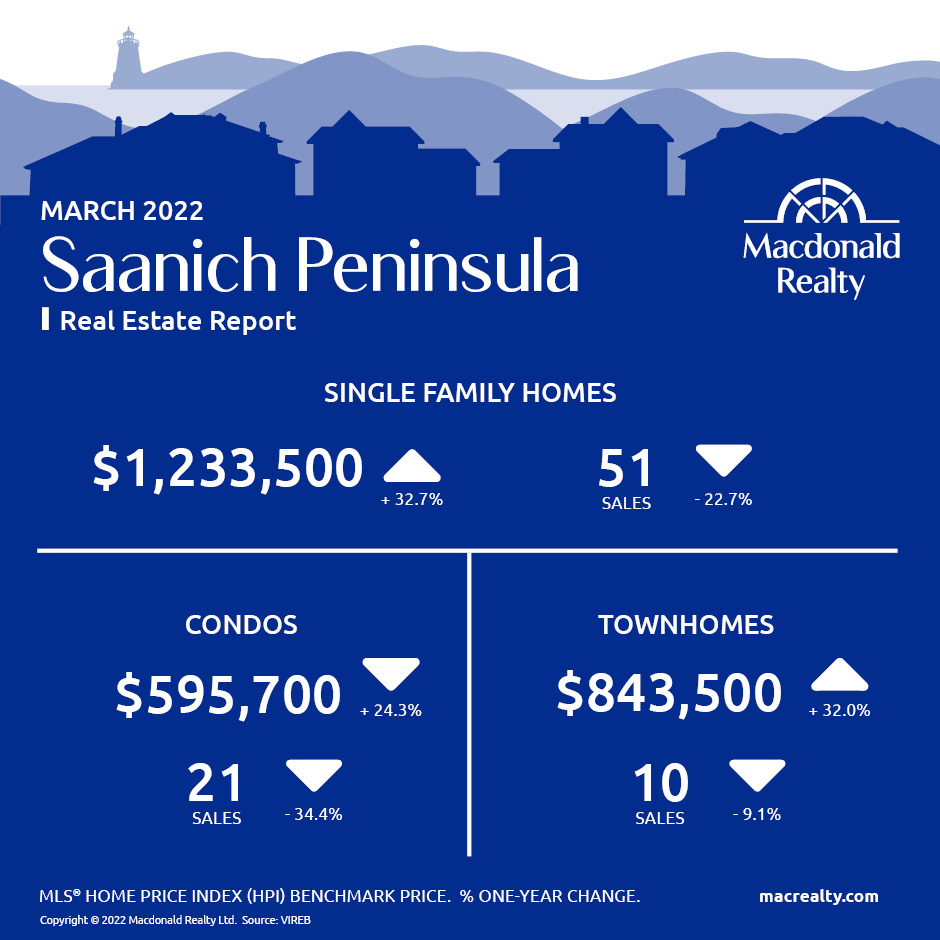
Saanich Peninsula
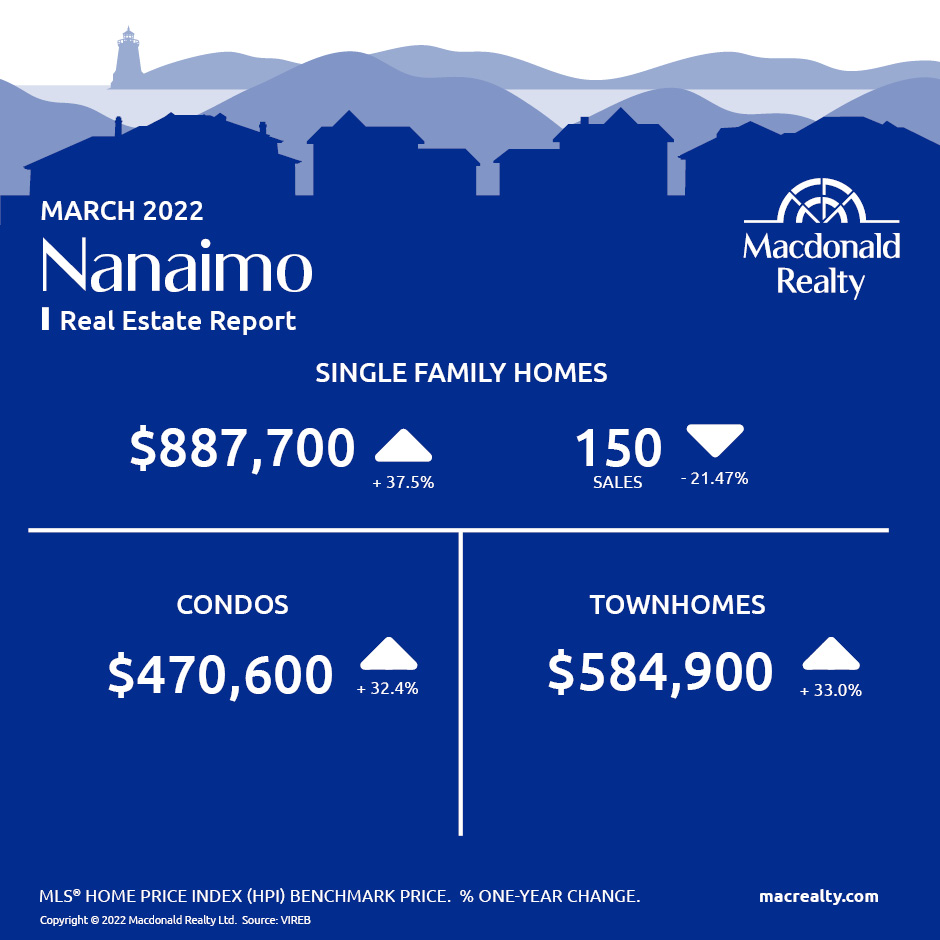
Nanaimo
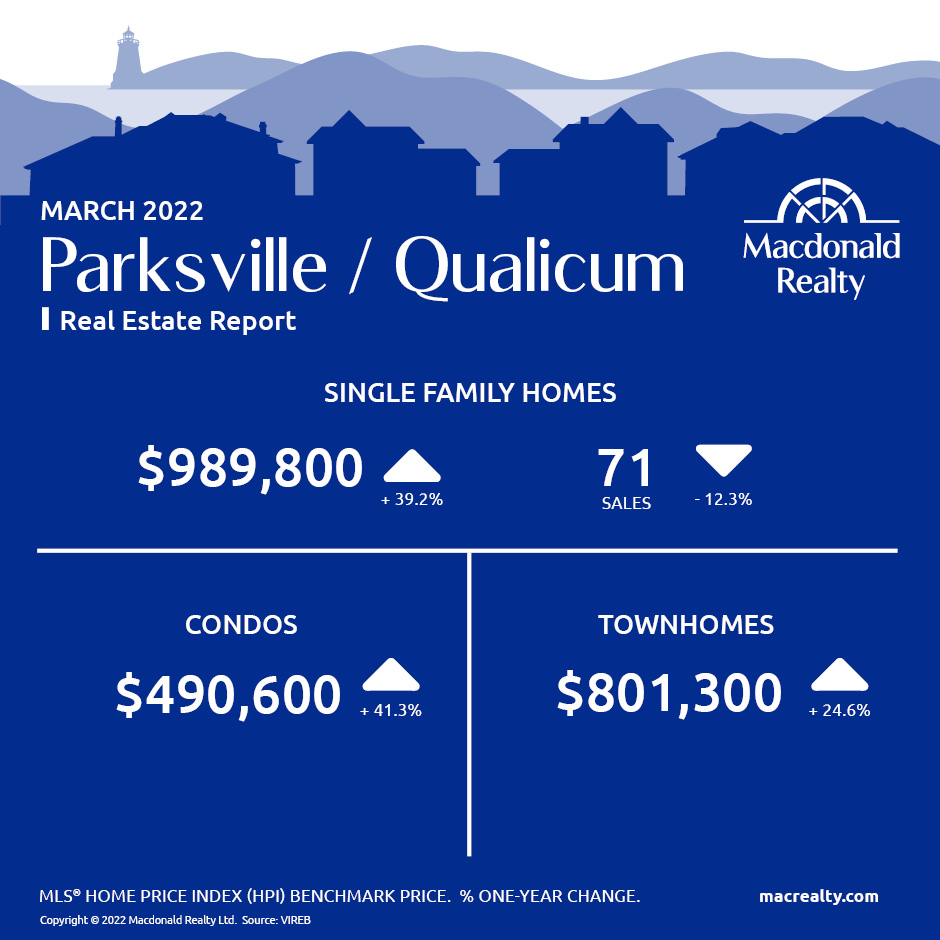
Parksville / Qualicum
Looking for more information about the real estate market in specific neighbourhoods in Victoria, Saanich Peninsula, Parksville, Nanaimo, Vancouver Island and the Gulf Islands?
Macdonald Realty has offices in downtown Victoria, Sidney, Parksville and Salt Spring Island. Please email [email protected] or call 1-877-278-3888 to be matched with a REALTOR® working in your area.
MLS® Home Price Index (HPI) Benchmark Price
Average and median home prices are often misinterpreted, are affected by change in the mix of homes sold, and can swing dramatically from month to month (based on the types and prices of properties that sold in a given month). The MLS® HPI overcomes these shortcomings and uses the concept of a benchmark home, a notional home with common attributes of typical homes in a defined area. Visit www.housepriceindex.ca for more information.
This blog post is based on market data provided by the Victoria Real Estate Board (VREB) www.vreb.org and the Vancouver Island Real Estate Board (VIREB) www.vireb.com. Market data from the VIREB includes listings and sales in Campbell River, Comox Valley, Cowichan Valley Nanaimo, Parksville/Qualicum, Port Alberni/West, North Island, and the Islands.
by Macrealty Marketing Team | Apr 8, 2022 | Market Updates
According to the Fraser Valley Real Estate Board, for the third consecutive month, new listings in the Fraser Valley continued to climb in March giving buyers more to choose from, helping to increase overall active inventory to levels not seen since last July.
Property sales remain robust, as Benchmark prices, the price of a ‘typical’ home, continued to increase month-over-month.
In March, the FVREB processed 2,580 residential and commercial sales on its Multiple Listing Service® (MLS®), a decrease of 22.5 per cent compared to March 2021 and 41.4 per cent more than were processed in February.
Sandra Benz, President of the Board, said of this month’s statistics, “Sales were strong again in March as more new listings continued to come on stream. We’re hopeful this will contribute to a slowing in price growth, which is good news for the home-buying public. Other encouraging signs, such as less open house traffic and fewer multiple offers, may help us get to a more balanced market, however until the fundamental issue of lack of supply is addressed, we won’t see that happen anytime soon.”
The Board received 4,580 new listings in March, a decrease of 10.0 per cent compared to March of last year, and 22.4 per cent more than were processed in February. Total active inventory for March was 4,699, a decrease of 6.2 per cent compared to last year’s 5,012 active listings, however 24.0 per cent higher than last month.
Baldev Gill, Chief Executive Officer of the Board, added, “We may not see the impact of recent interest rate hikes on the market trends until later in 2022. With fixed rates nearly double what they were a year ago, new homebuyers will likely be more impacted than other segments of the home-buying public, as mortgage stress test conditions become more stringent. We hope to see equal efforts from government to address inventory issues to help make housing more affordable.”
Across Fraser Valley, in March, the average number of days to sell a single-family detached home was 12 and a townhome was 14 days. Apartments took, on average, 11 days to sell.
Find all the infographics related to the March Market Statistics by visiting the Facebook Album.
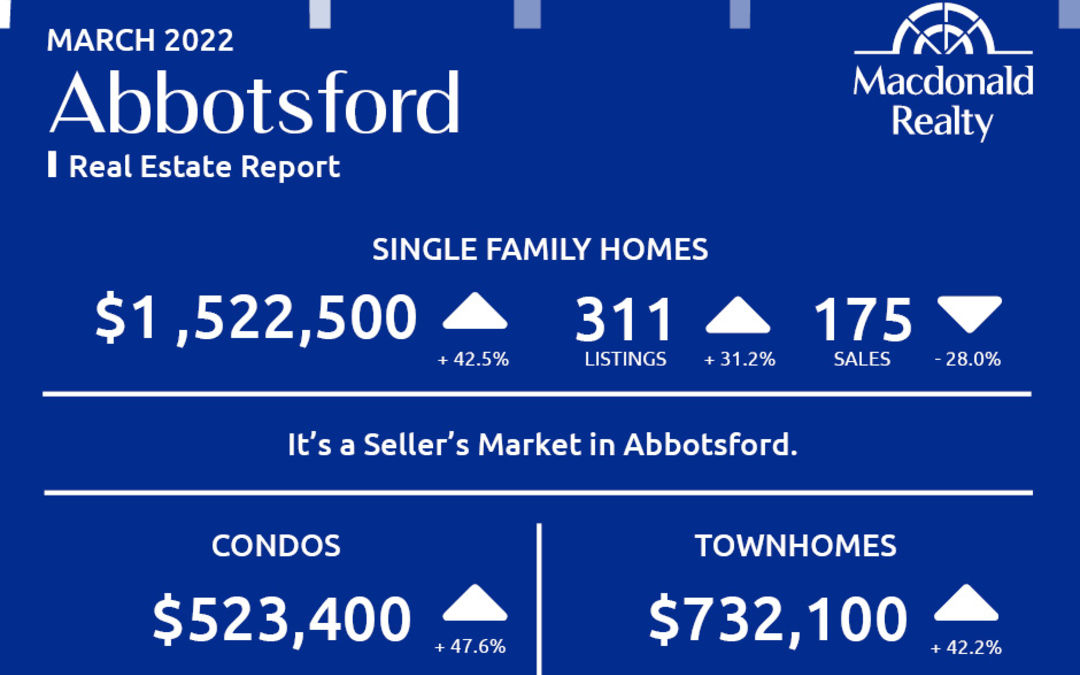
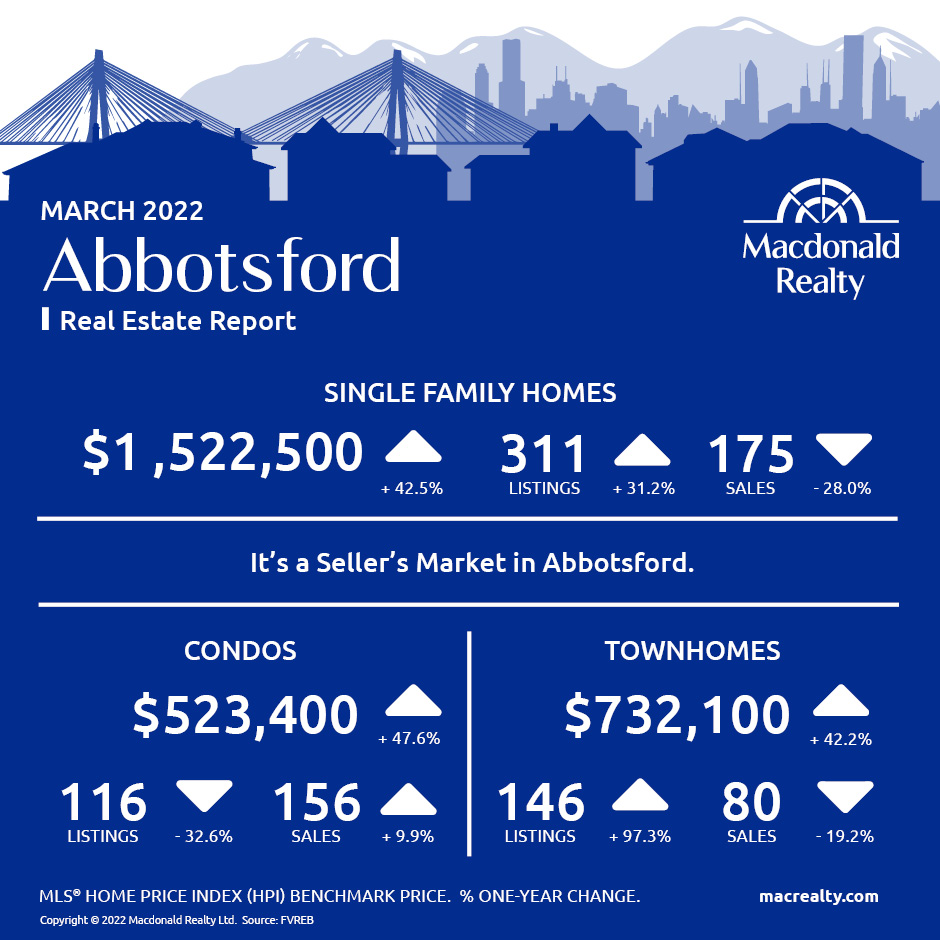
Abbotsford
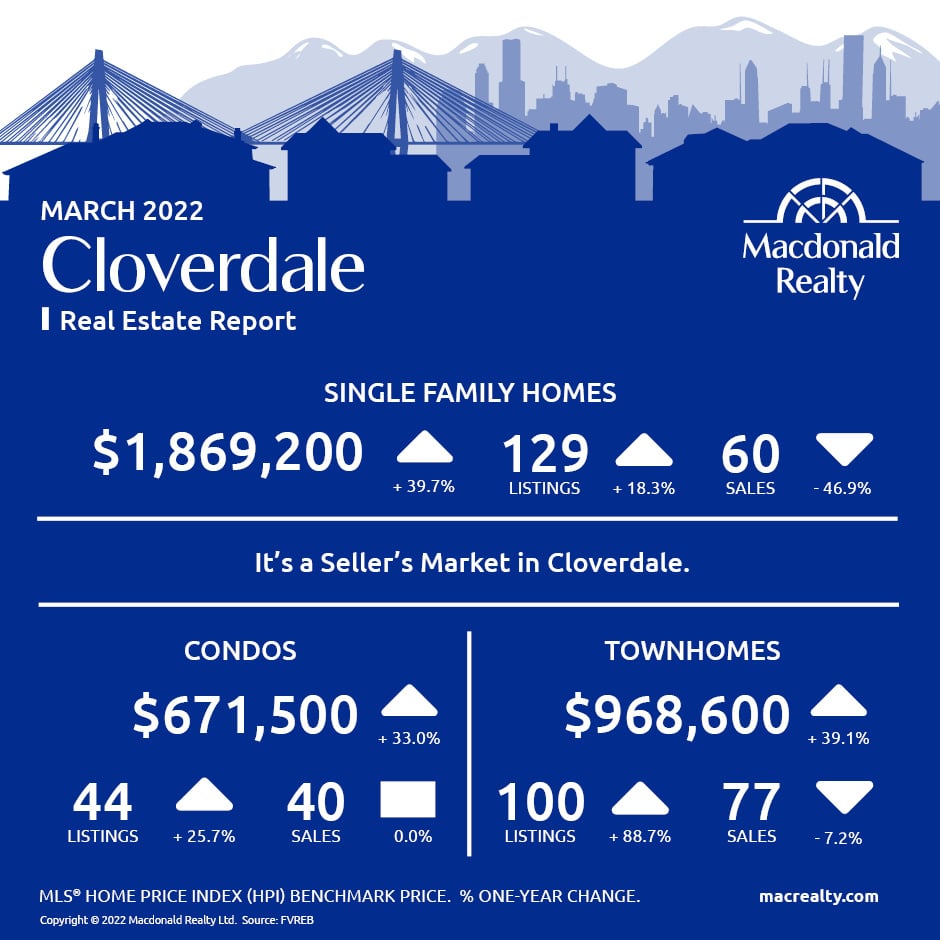
Cloverdale
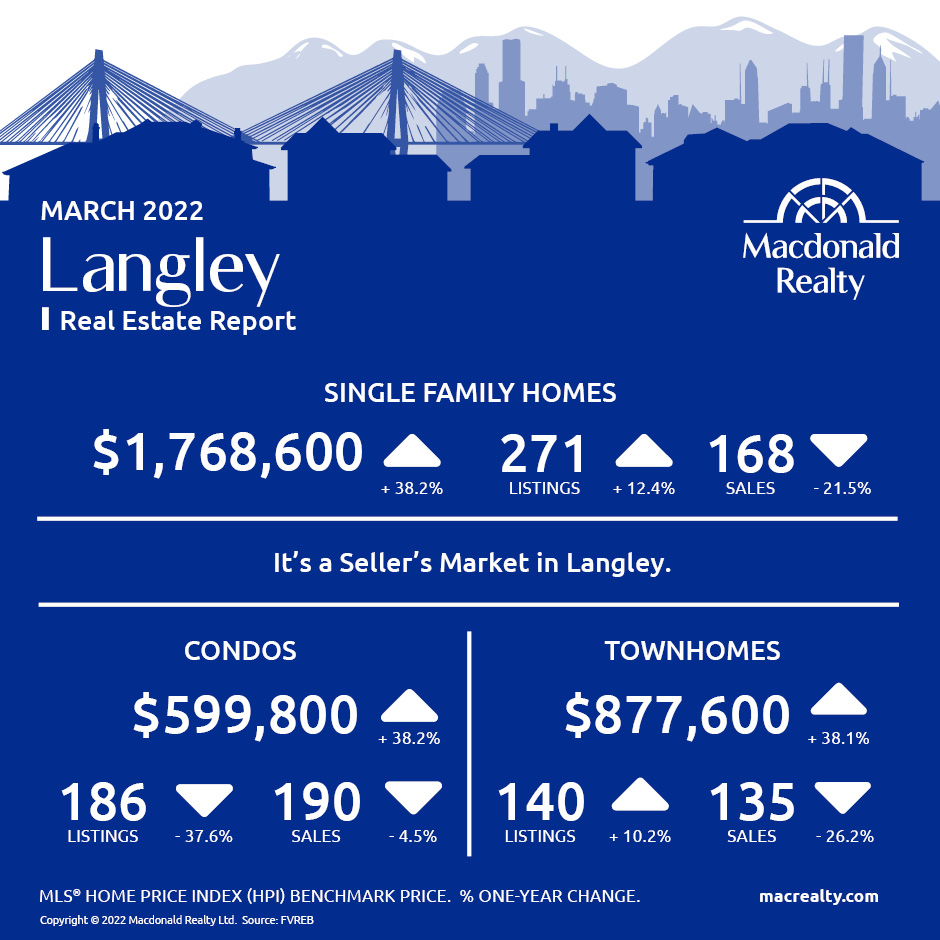
Langley
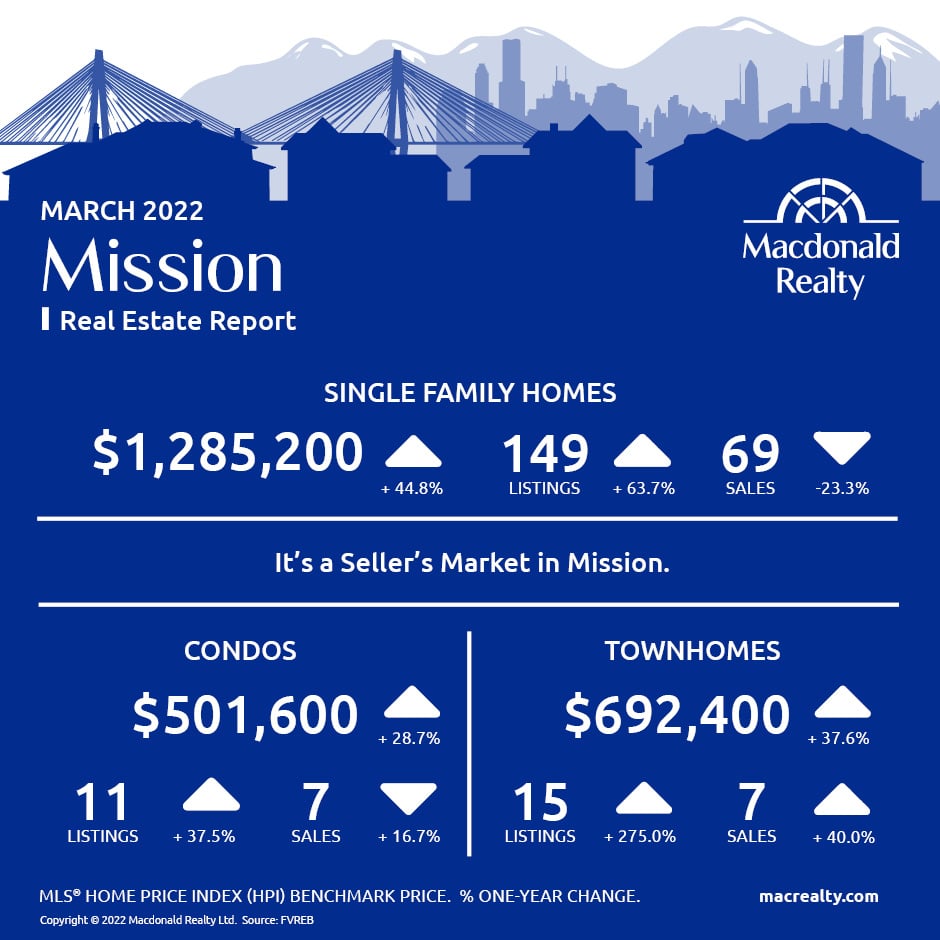
Mission
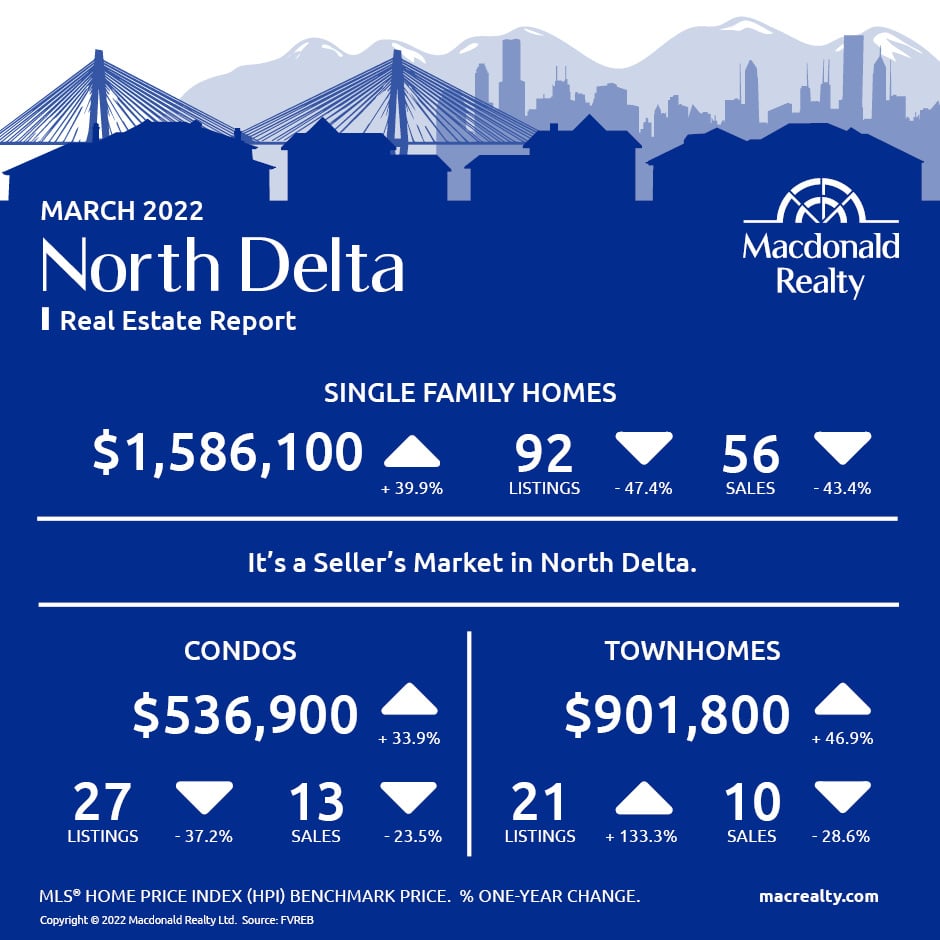
North Delta
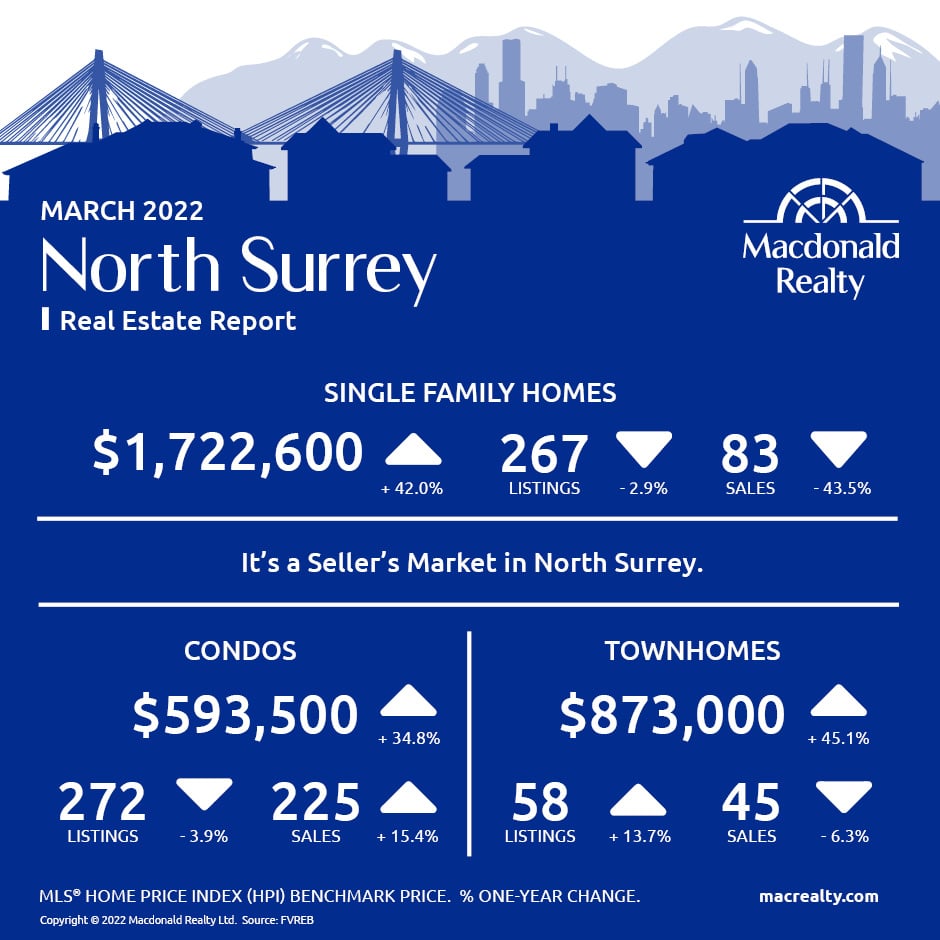
North Surrey
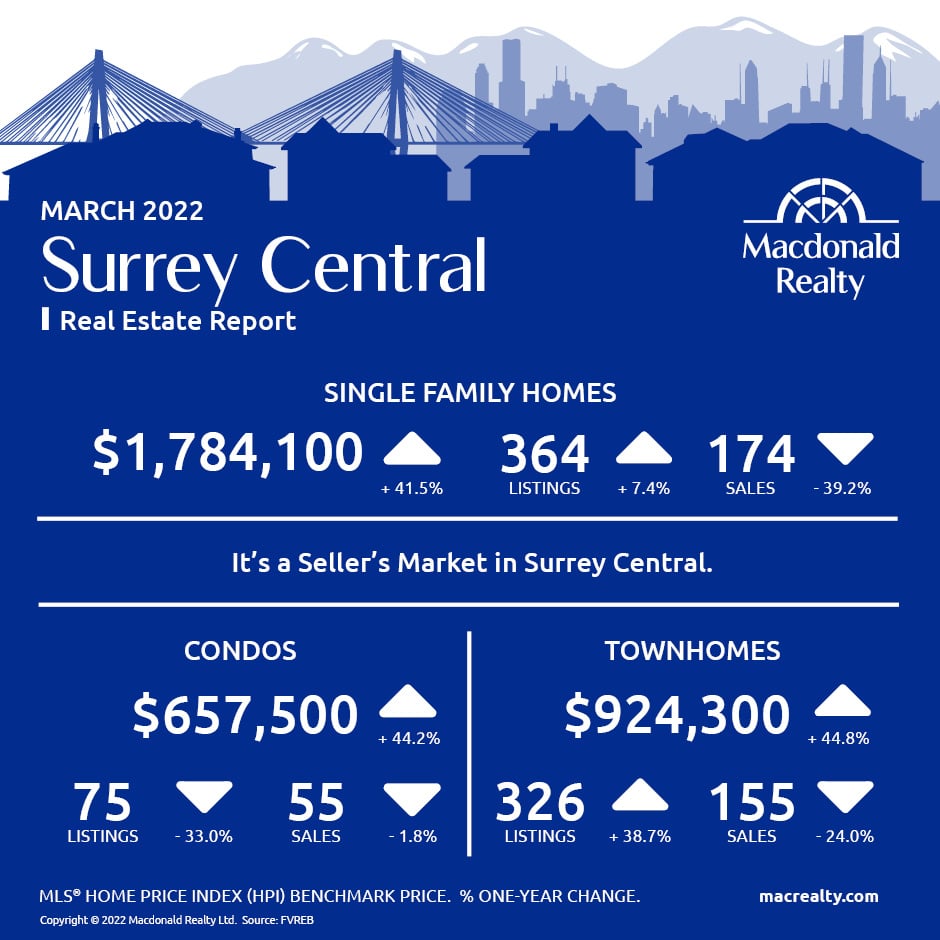
Surrey Central
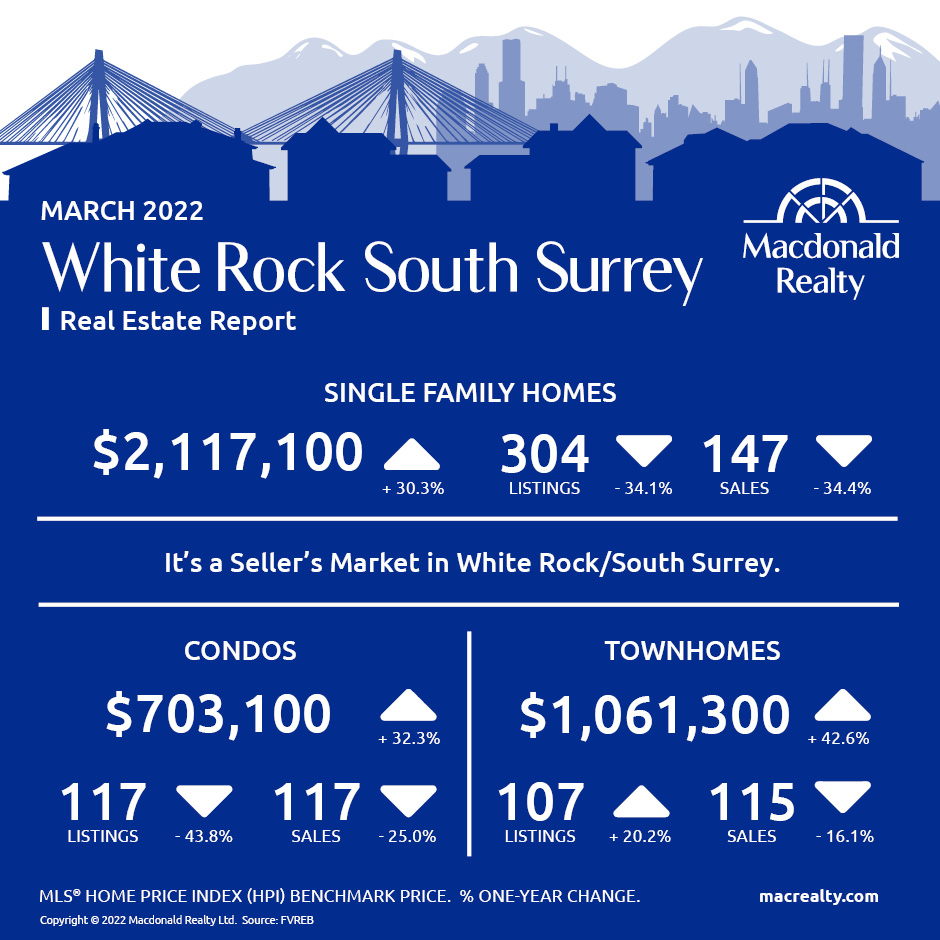
White Rock / South Surrey
Looking for more information about the real estate market in specific neighbourhoods in Surrey, Langley and Fraser Valley?
Macdonald Realty has offices in North Delta, White Rock/South Surrey, and Langley. Please email [email protected] or call 1-877-278-3888 to be matched with a REALTOR® working in your area.
MLS® Home Price Index (HPI) Benchmark Price
Average and median home prices are often misinterpreted, are affected by change in the mix of homes sold, and can swing dramatically from month to month (based on the types and prices of properties that sold in a given month). The MLS® HPI overcomes these shortcomings and uses the concept of a benchmark home, a notional home with common attributes of typical homes in a defined area. Visit www.housepriceindex.ca for more information.
This blog post is based on market data provided by the Fraser Valley Real Estate Board (FVREB) www.fvreb.bc.ca
by Macrealty Marketing Team | Apr 8, 2022 | Market Updates
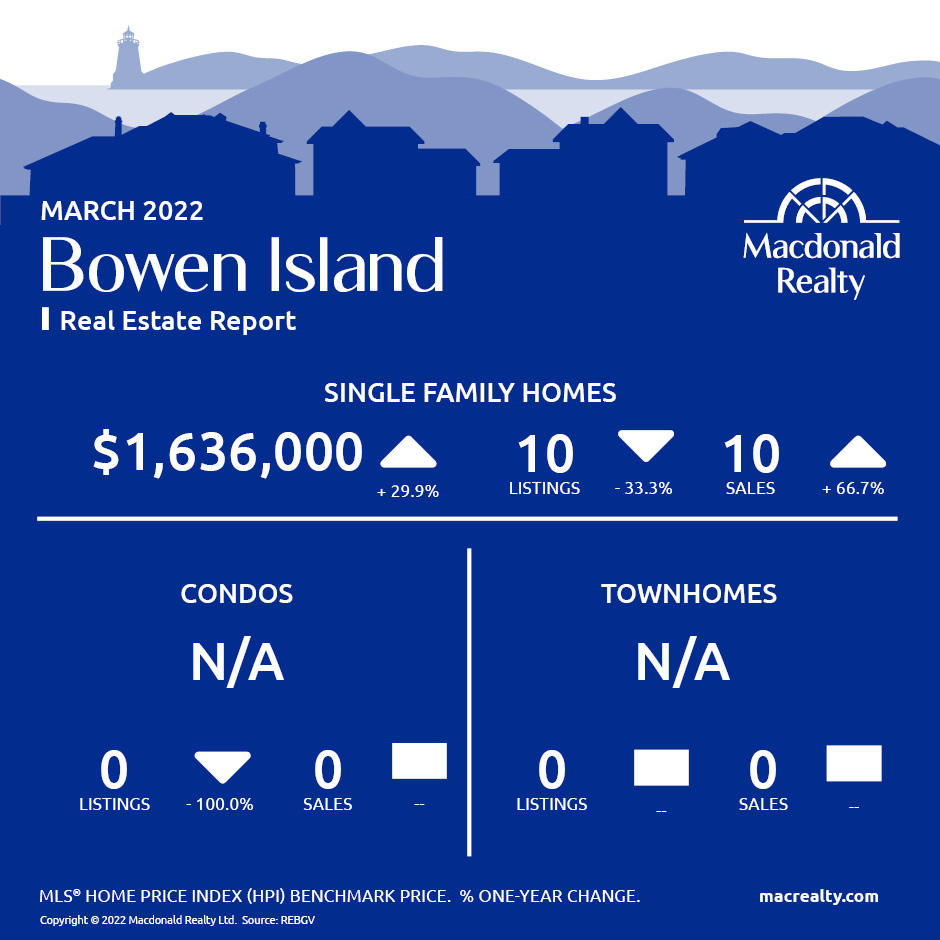
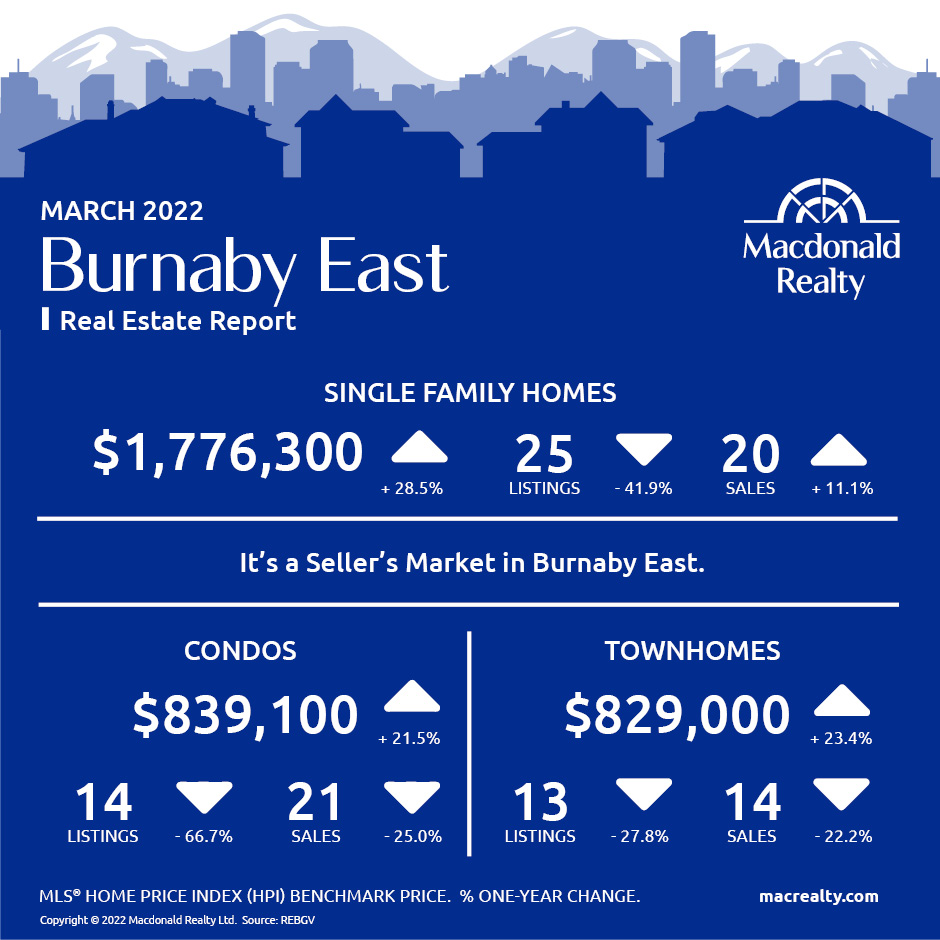
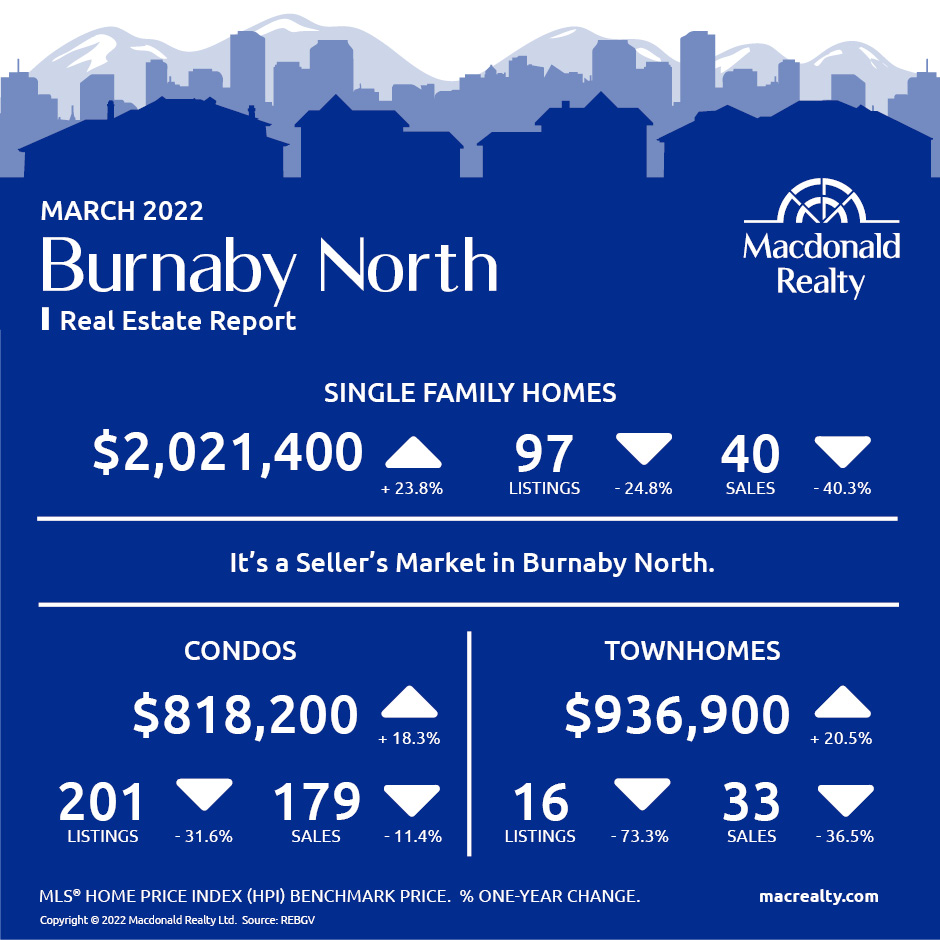
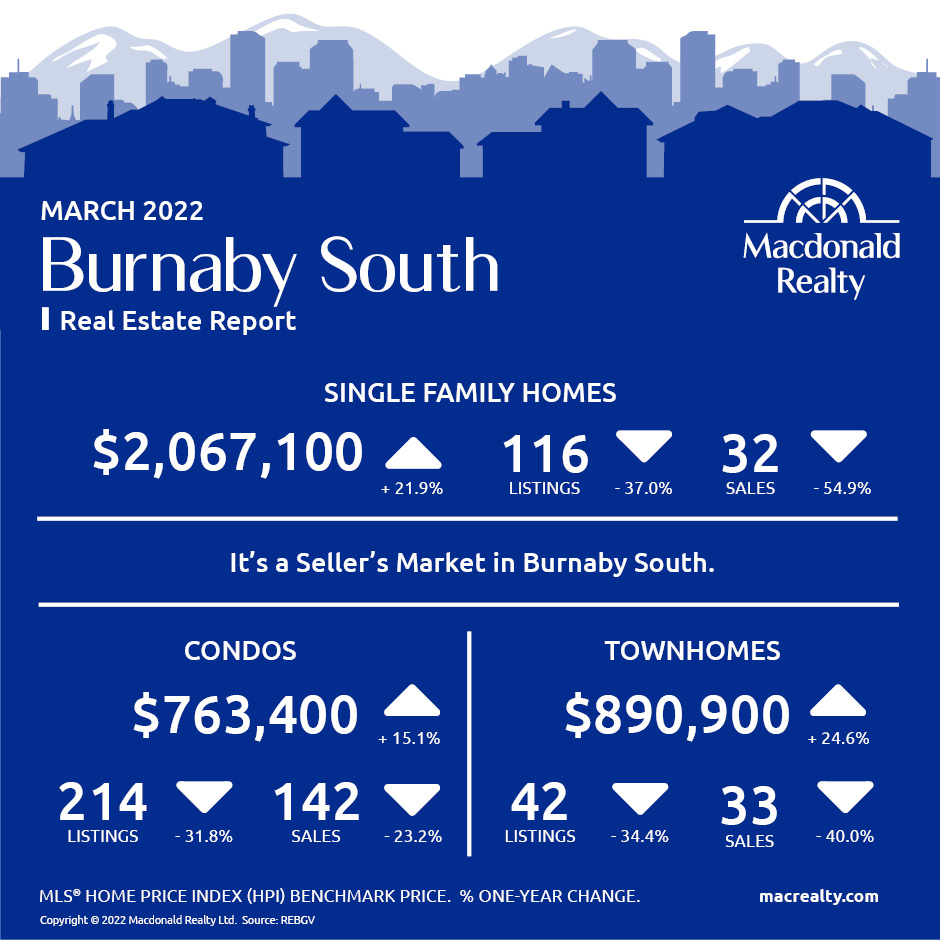
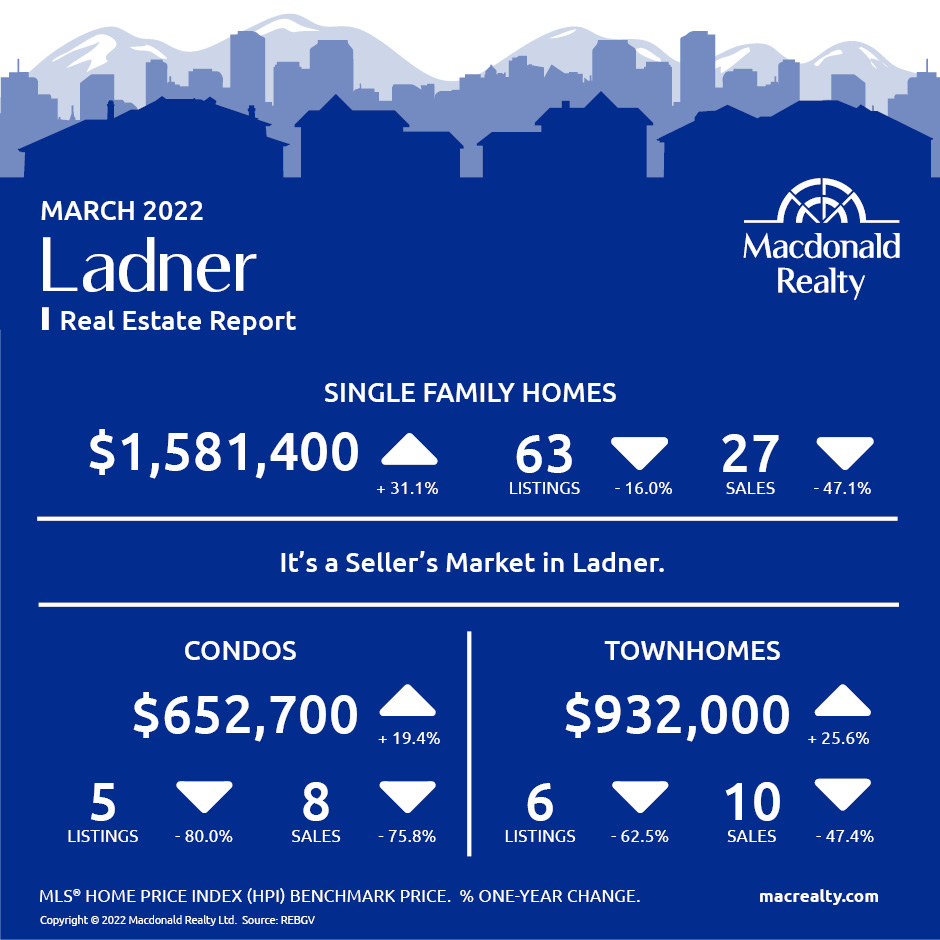
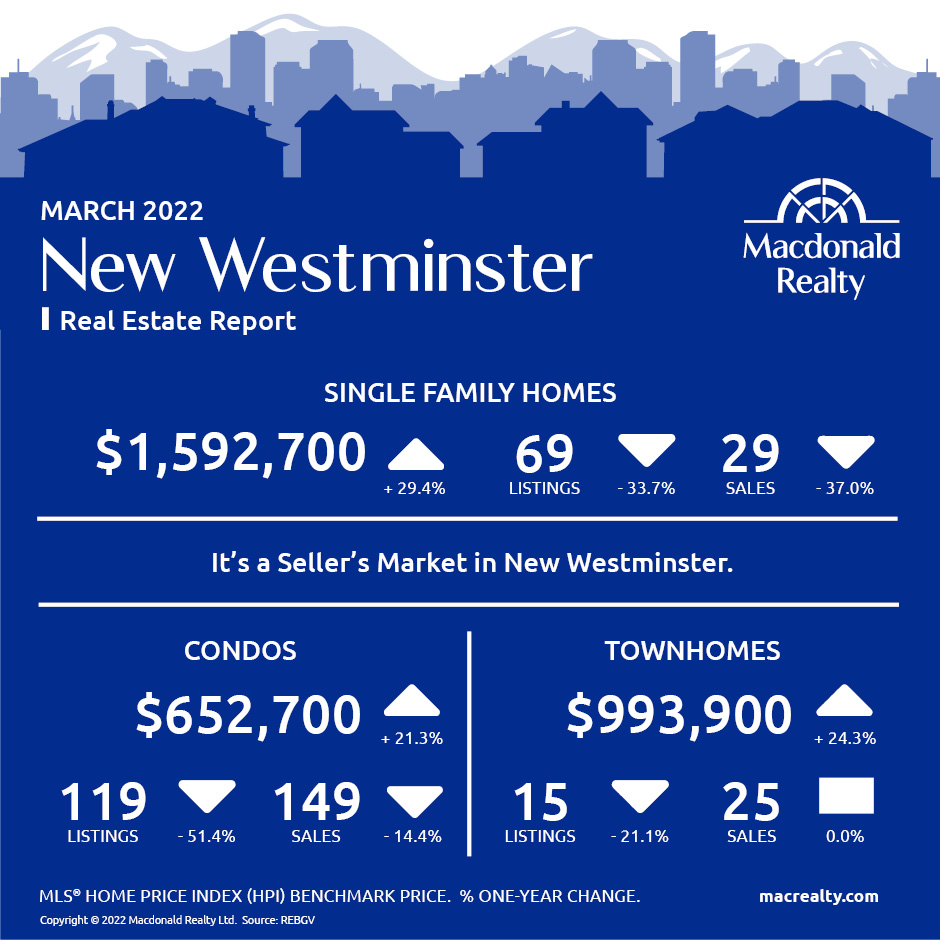
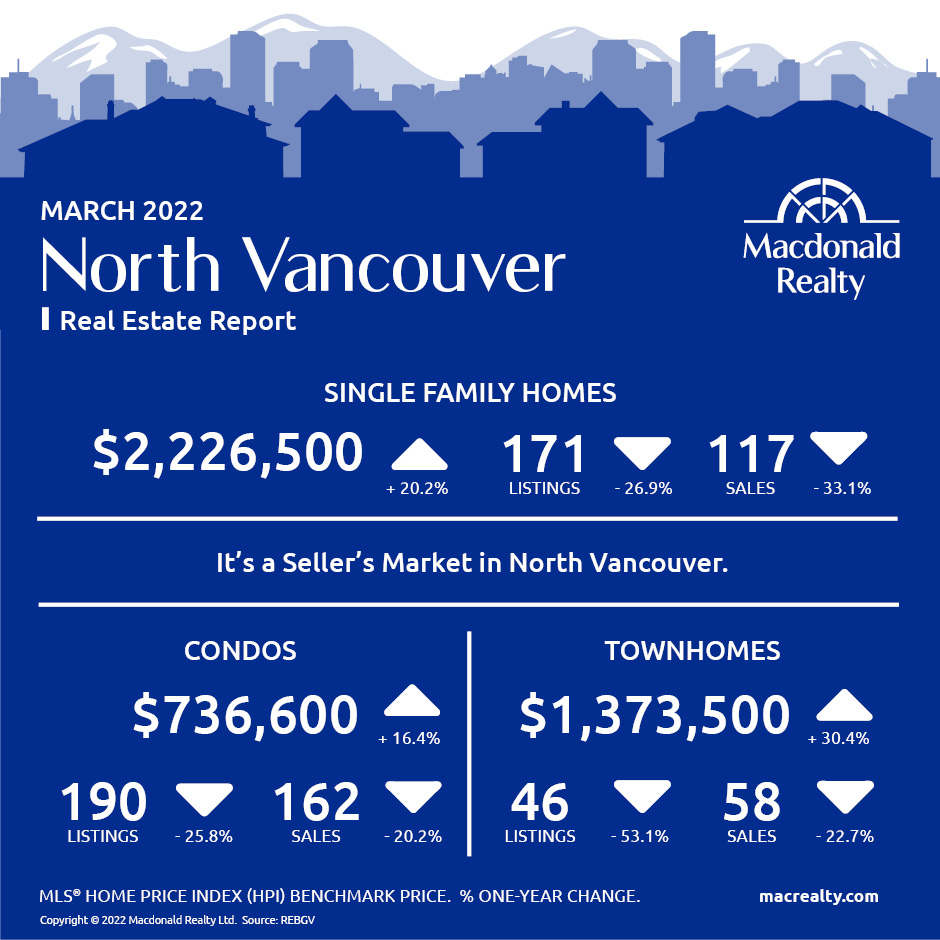
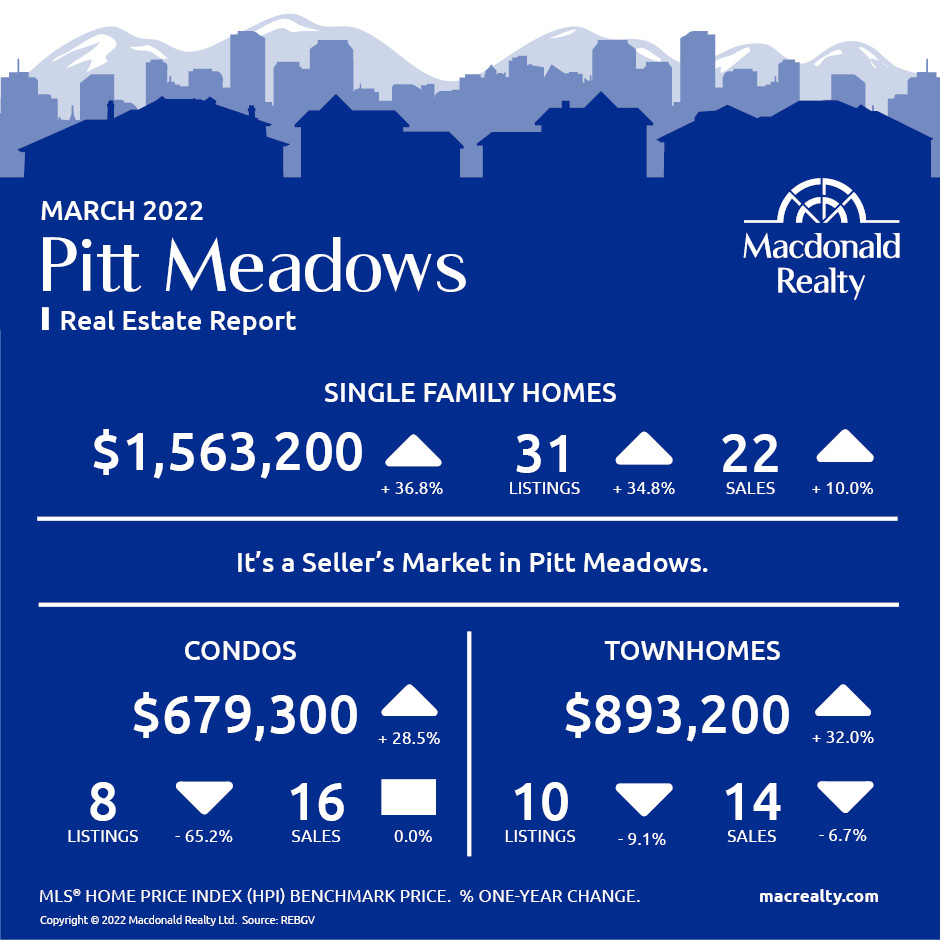
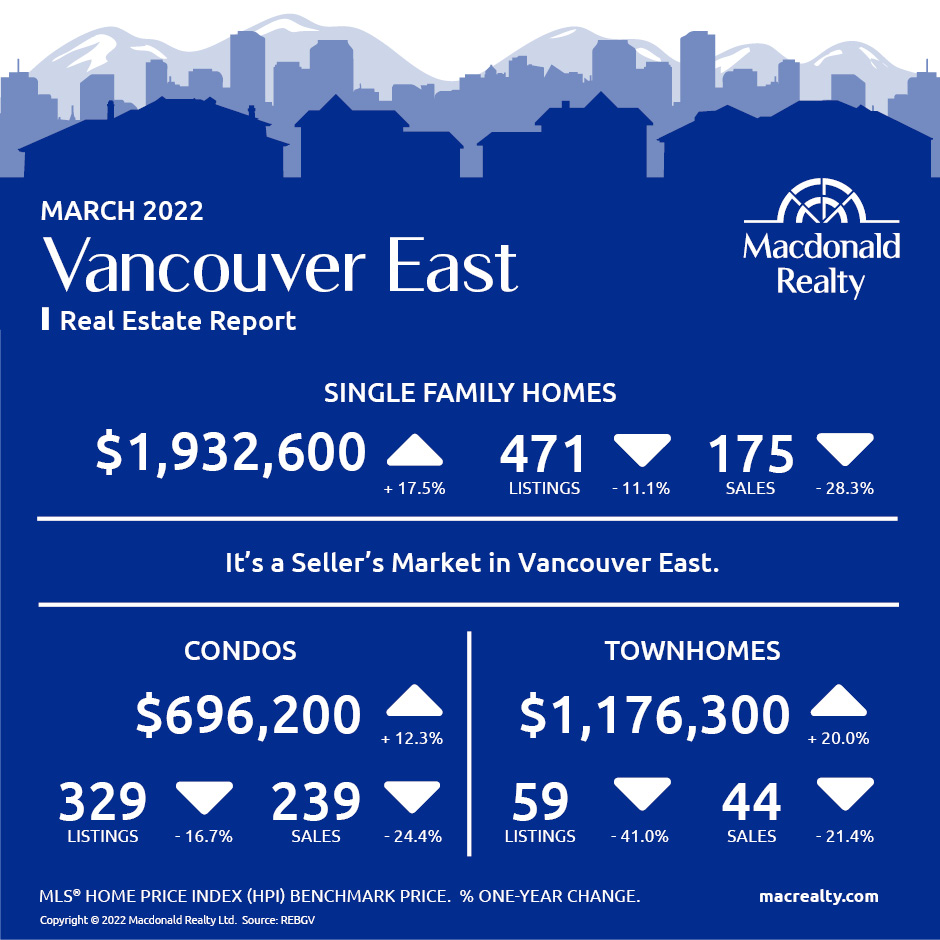
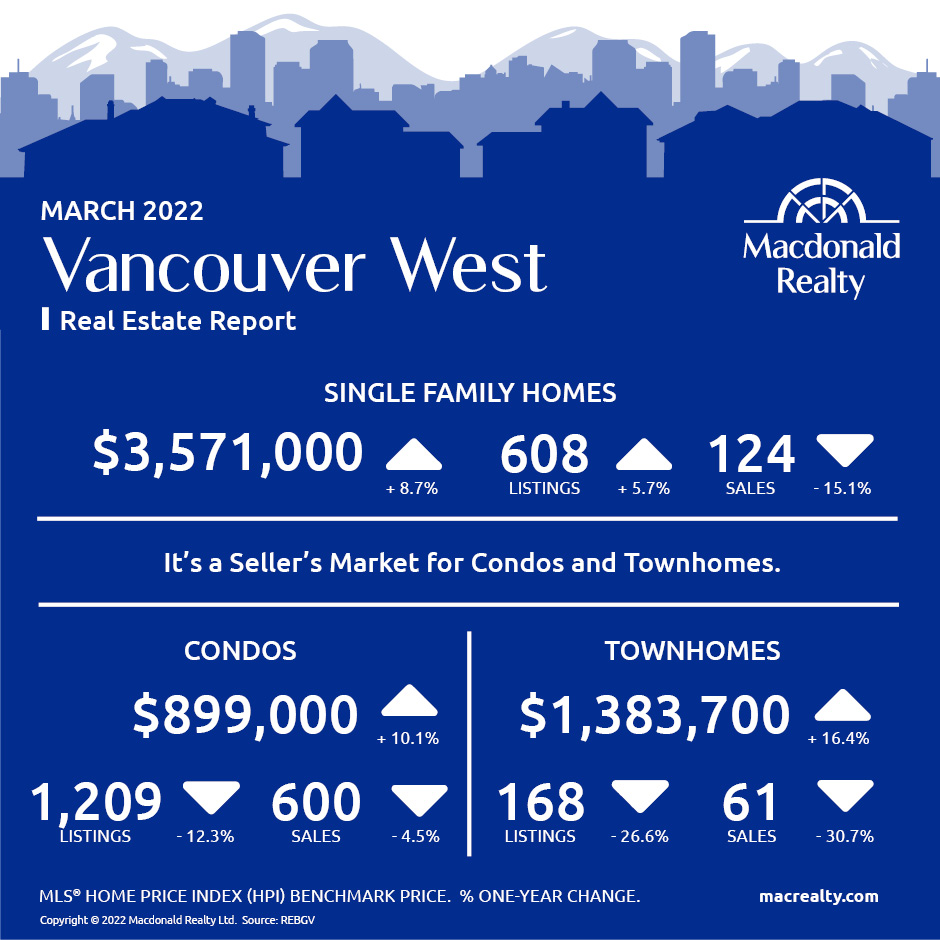
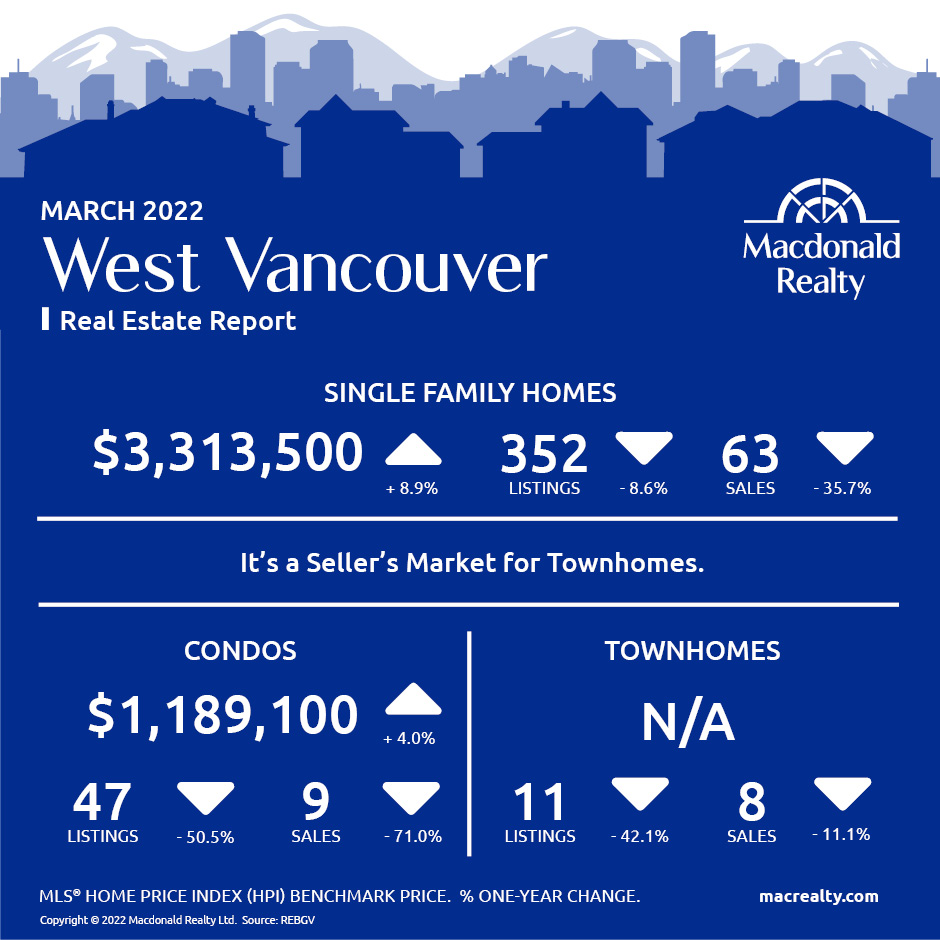
Here are the latest real estate market statistics from Macdonald Realty on the Greater Vancouver listings and sales in March 2022. Find all the infographics by visiting the Facebook Album.
Calmer than last spring’s record pace, Metro Vancouver home buyer demand remains elevated.
While down from last year’s record numbers, home sale activity in Metro Vancouver’s housing market remained elevated in March.
The Real Estate Board of Greater Vancouver (REBGV) reports that residential home sales in the region totalled 4,344 in March 2022, a 23.9 per cent decrease from the 5,708 sales recorded in March 2021, and a 26.9 per cent increase from the 3,424 homes sold in February 2022.
Last month’s sales were 25.5 per cent above the 10-year March sales average.
“March of 2021 was the highest selling month in our history. This year’s activity, while still elevated, is happening at a calmer pace than we experienced 12 months ago,” Daniel John, REBGV Chair said. “Home buyers are keeping a close eye on rising interest rates, hoping to make a move before their locked-in rates expire.”
March of 2021 was the highest selling month in our history. This year’s activity, while still elevated, is happening at a calmer pace than we experienced 12 months ago,” Daniel John, REBGV Chair said. “Home buyers are keeping a close eye on rising interest rates, hoping to make a move before their locked-in rates expire.
March of 2021 was the highest selling month in our history. This year’s activity, while still elevated, is happening at a calmer pace than we experienced 12 months ago,” Daniel John, REBGV Chair said. “Home buyers are keeping a close eye on rising interest rates, hoping to make a move before their locked-in rates expire.
The Board also has informed:
“We’re still seeing upward pressure on prices across all housing categories in the region. Lack of supply is driving this pressure,” John said. “The number of homes listed for sale on our MLS® system today is less than half of what’s needed to shift the market into balanced territory.”
*Areas covered by the Real Estate Board of Greater Vancouver include Burnaby, Coquitlam, Maple Ridge, New Westminster, North Vancouver, Pitt Meadows, Port Coquitlam, Port Moody, Richmond, South Delta, Squamish, Sunshine Coast, Vancouver, West Vancouver, and Whistler. Check out the infographics of Squamish, Sunshine Coast and Whistler, HERE.
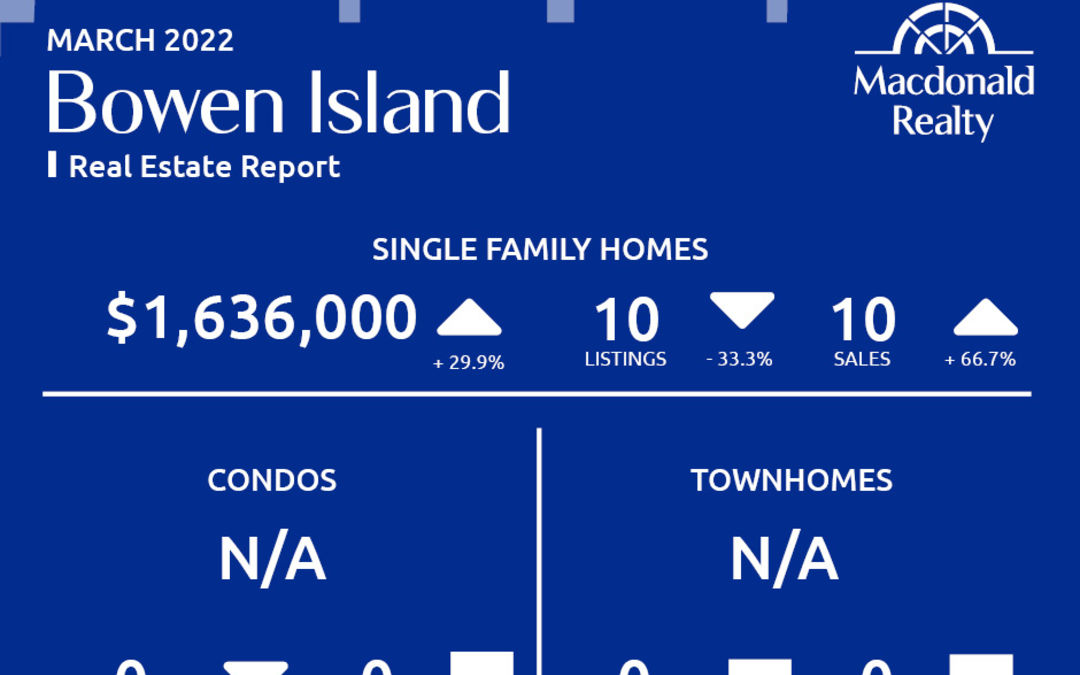
Bowen Island
Burnaby East
Burnaby North
Burnaby South
Ladner
Maple Ridge

New Westminster
North Vancouver
Pitt Meadows
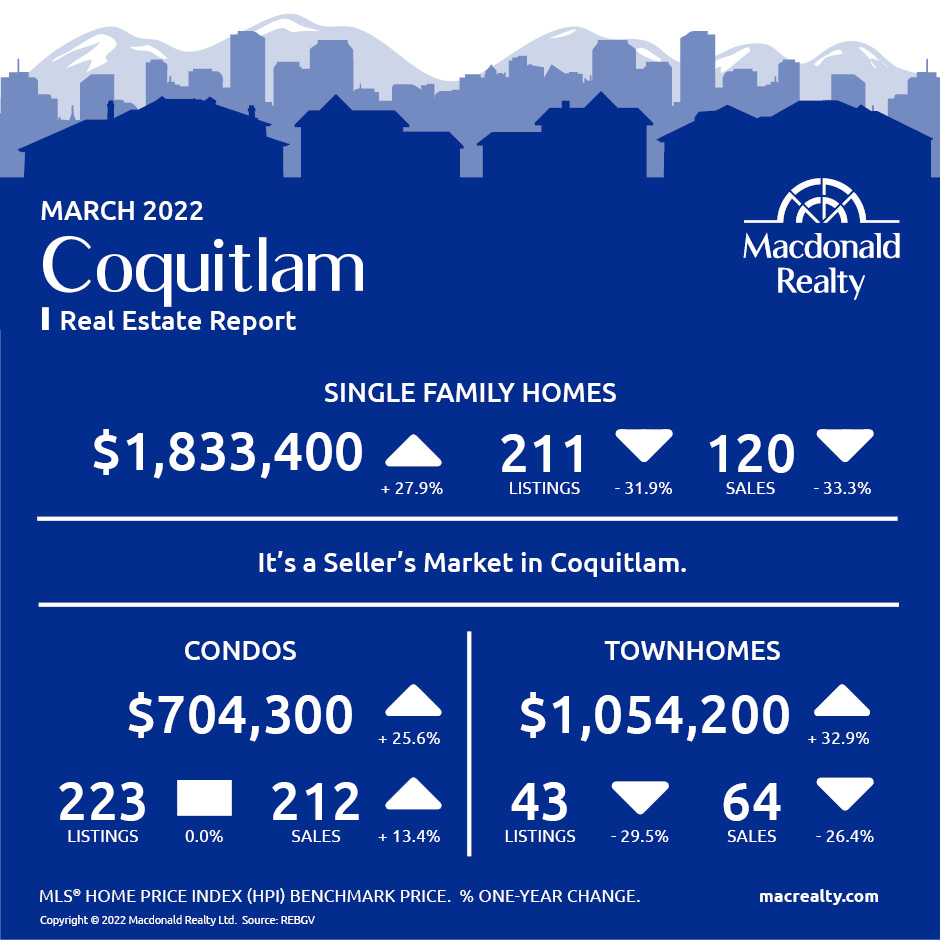
Coquitlam
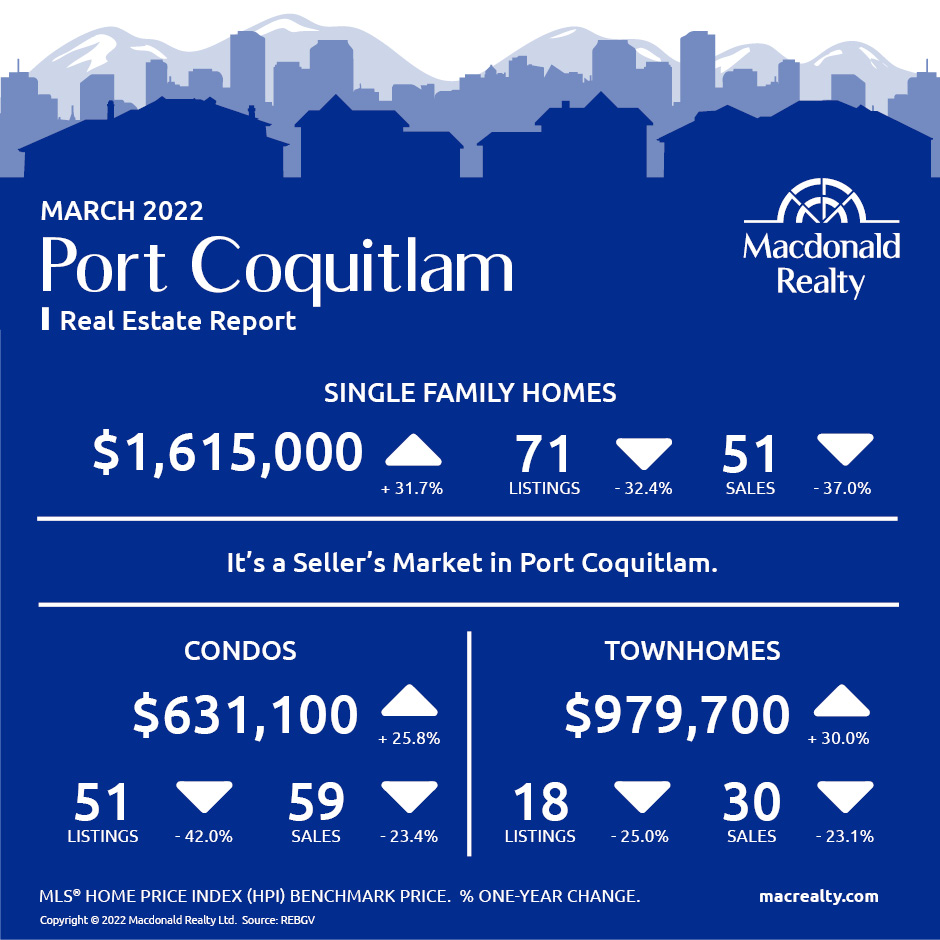
Port Coquitlam
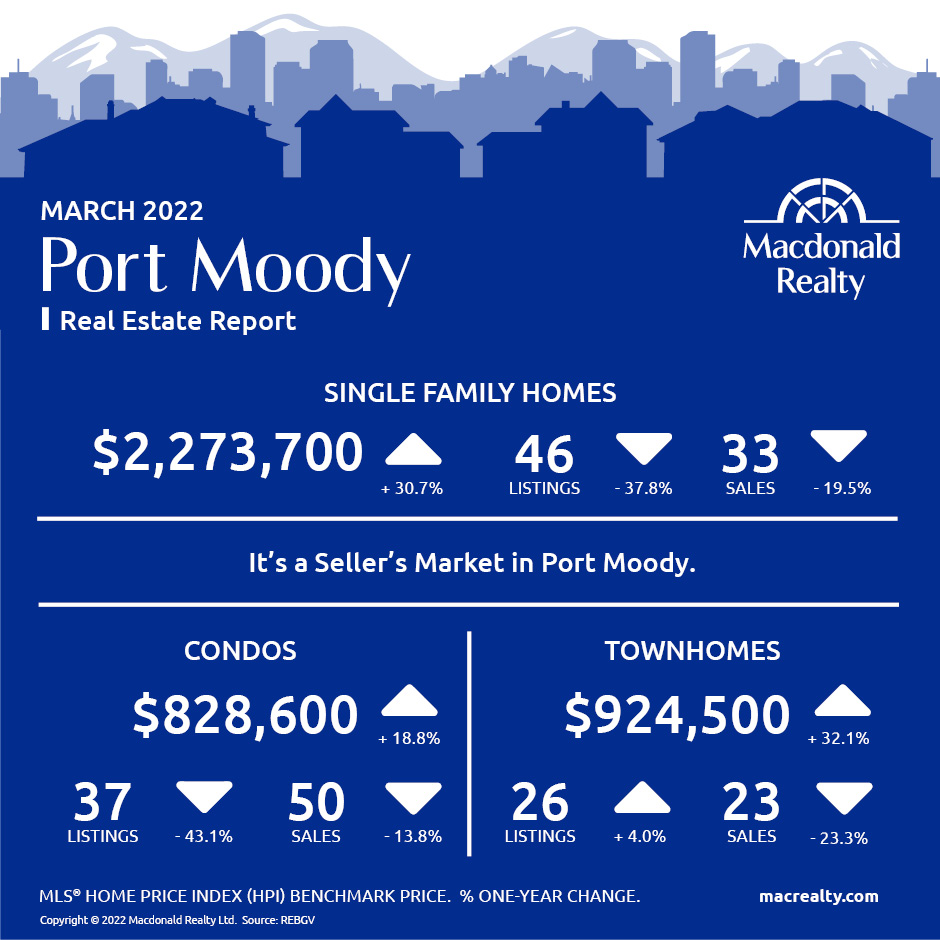
Port Moody
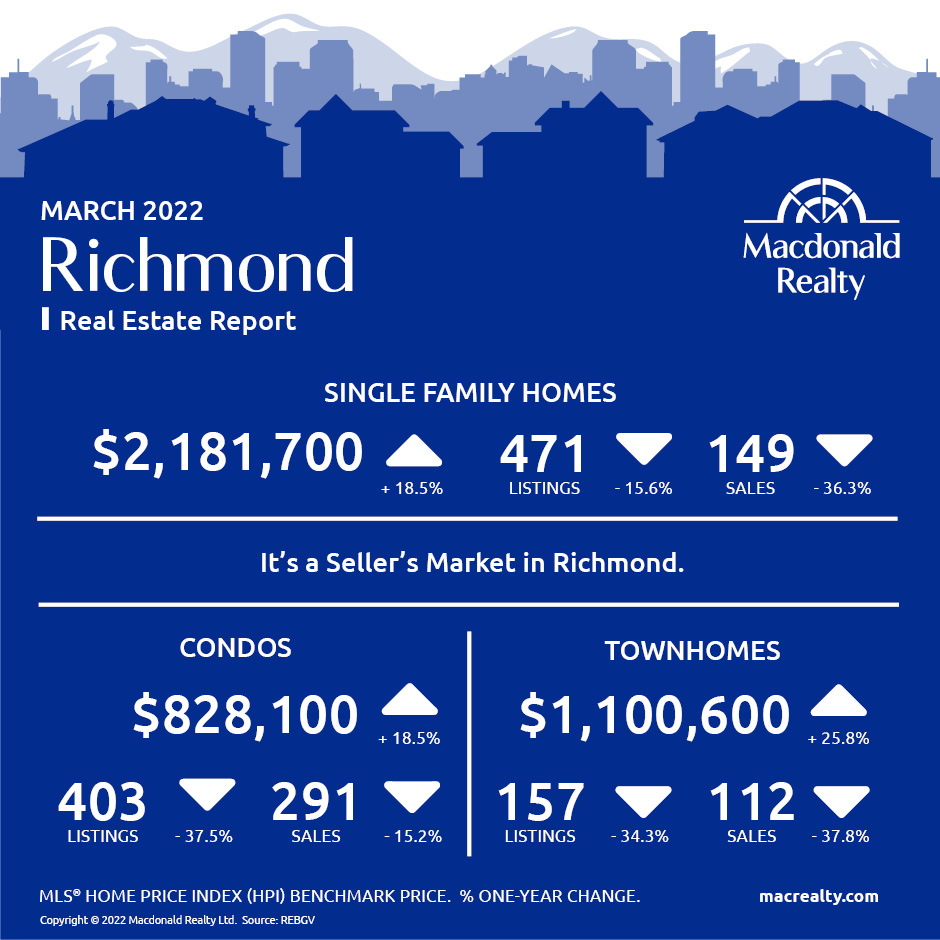
Richmond
Tsawwassen

Vancouver East
Vancouver West
West Vancouver
Looking for more information about the real estate market in specific neighbourhoods in the Greater Vancouver?
Macdonald Realty has offices across the Greater Vancouver. Please email [email protected] or call 1-877-278-3888 to be matched with a REALTOR® working in your area.
MLS® Home Price Index (HPI) Benchmark Price
Average and median home prices are often misinterpreted, are affected by change in the mix of homes sold, and can swing dramatically from month to month (based on the types and prices of properties that sold in a given month). The MLS® HPI overcomes these shortcomings and uses the concept of a benchmark home, a notional home with common attributes of typical homes in a defined area. Visit www.housepriceindex.ca for more information.
This blog post is based on market data provided by the Real Estate Board of Greater Vancouver (REBGV) www.rebgv.org