by Macrealty Marketing Team | Sep 7, 2021 | Market Updates
According to the Fraser Valley Real Estate Board home sales in the Fraser Valley region remained elevated in August reaching the second-highest sales ever for the month against a backdrop of decreasing supply.
The Board released the report saying they have processed a total of 2,087 property sales on its Multiple Listing Service® (MLS®) in August, an increase of 4.0 per cent compared to July and a 2.4 per cent increase compared to the same month last year. Sales remained unusually high for the month; second only to August of 2005.
As informed by the Board Larry Anderson, President of the Board, said, “Home buyers are facing one of the worst supply shortages in Fraser Valley history. Our sales are over 30 per cent above normal, while our housing stock is at levels last seen in the early 80s.”To put our supply and demand situation in perspective, for every 100 townhomes on the market in August, Fraser Valley REALTORS® sold 94. The single-family detached and condo markets also remained in strong seller’s market territory. Persistent demand and lack of supply continues to put upward pressure on home prices.”
According to the Board release In August, they received 2,107 new listings, a decrease of 36.3 per cent compared to last year, and a decrease of 13.3 per cent compared to July 2021. The month ended with total active inventory sitting at 4,077, a 16.8 per cent decrease compared to July, and 44.9 per cent fewer than August 2020.
Baldev Gill, Chief Executive Officer of the Board, added, “To improve affordability, the BC government introduced the foreign buyers’ tax in 2016 and the federal government introduced the mortgage stress test two years later. And yet, in the last five years, the price of a typical detached home in the Fraser Valley has increased by 50 per cent. “Those measures did not address the core issue, which is insufficient supply to meet the rise in our population growth. All levels of government must work together to correct the structural housing shortage.”
Across Fraser Valley, in August, the average number of days to sell a single-family detached home was 29 and a townhome was 19 days. Apartments took, on average, 29 days to sell.
Find all the infographics related to the April Market Statistics by visiting the Facebook Album.
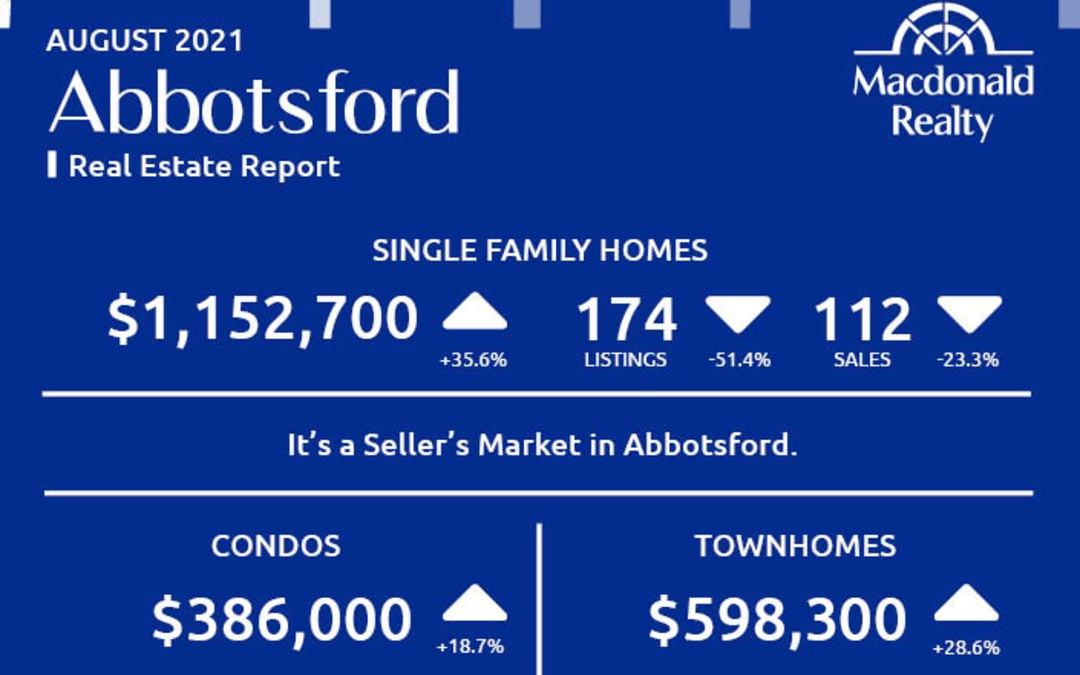
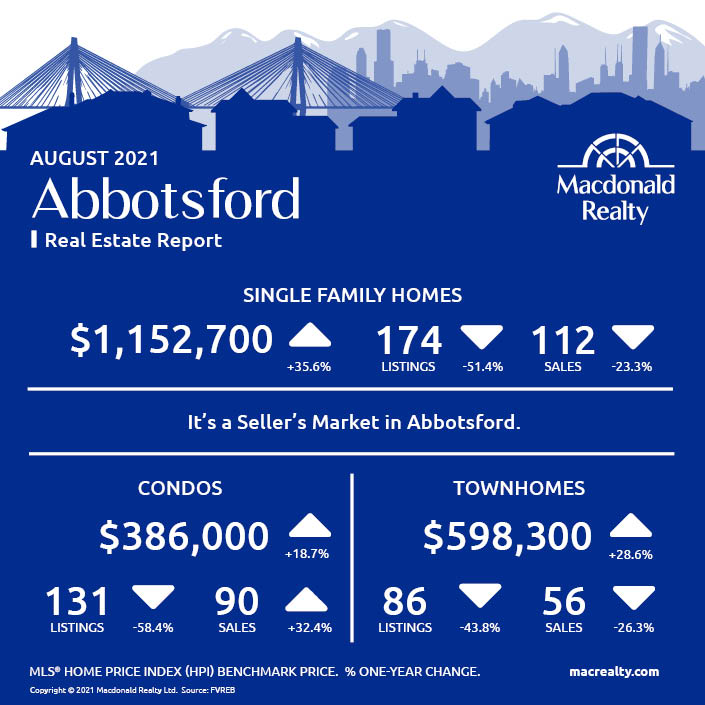
Abbotsford
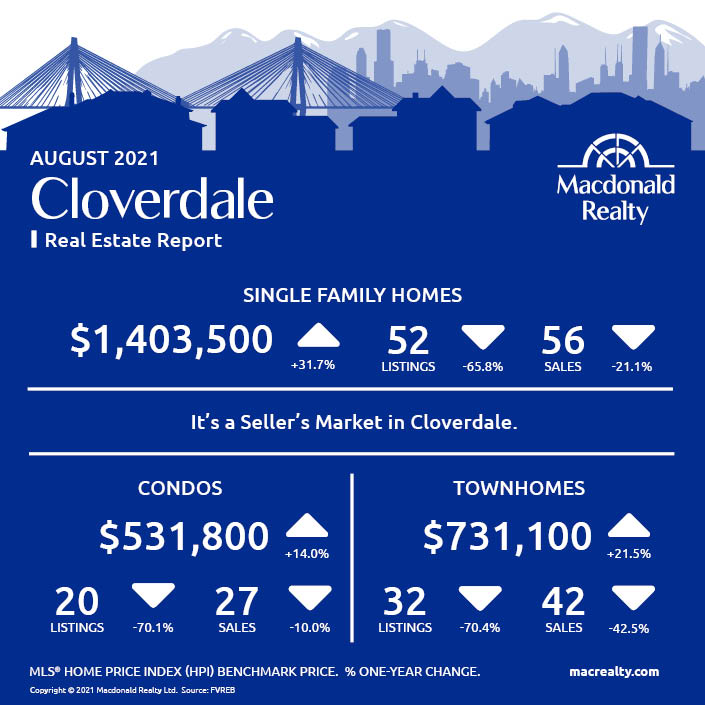
Cloverdale
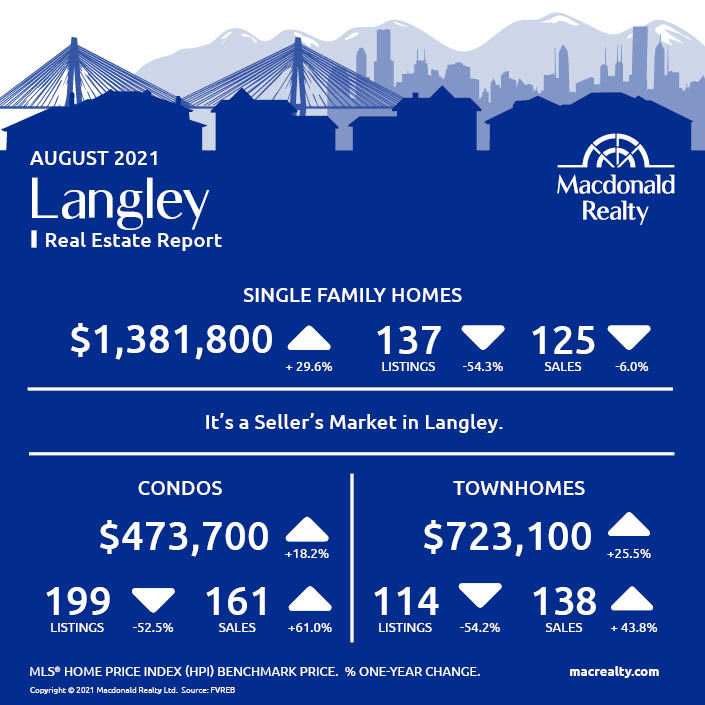
Langley
Mission

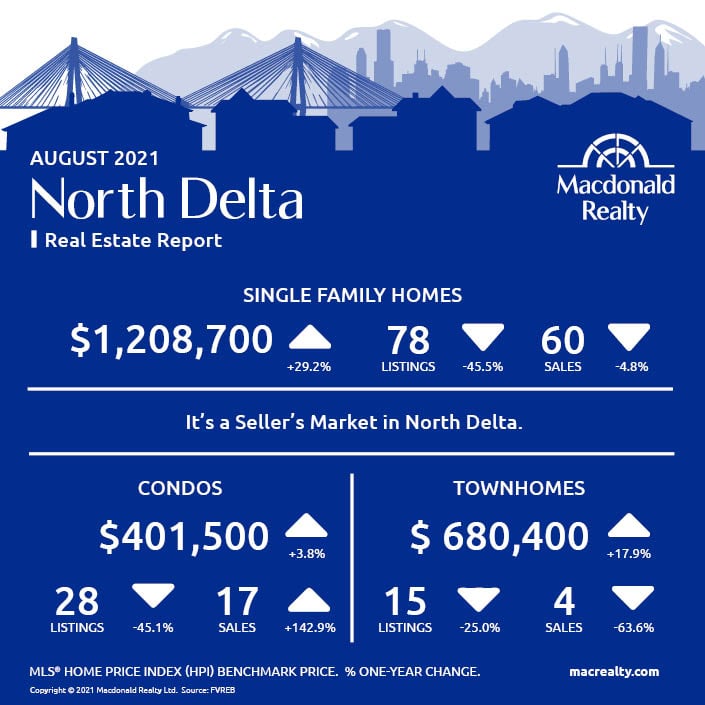
North Delta
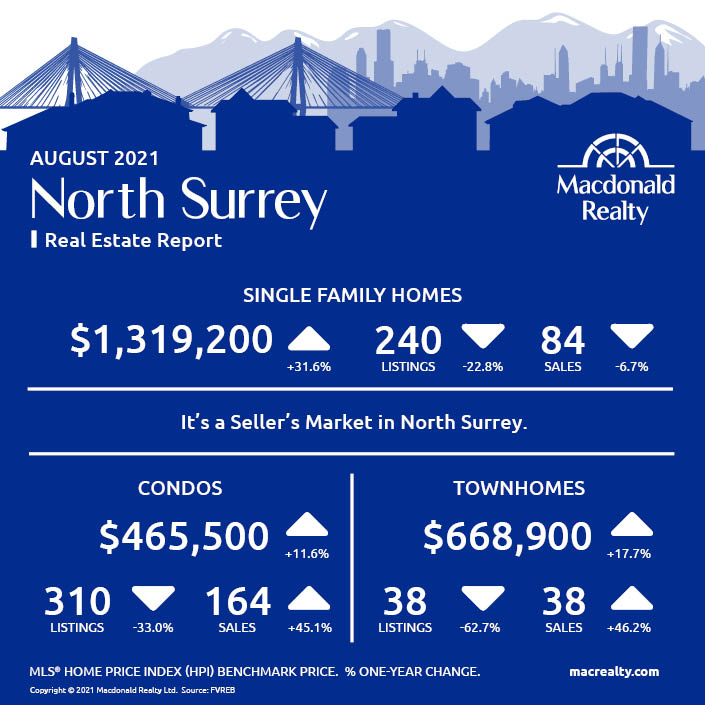
North Surrey
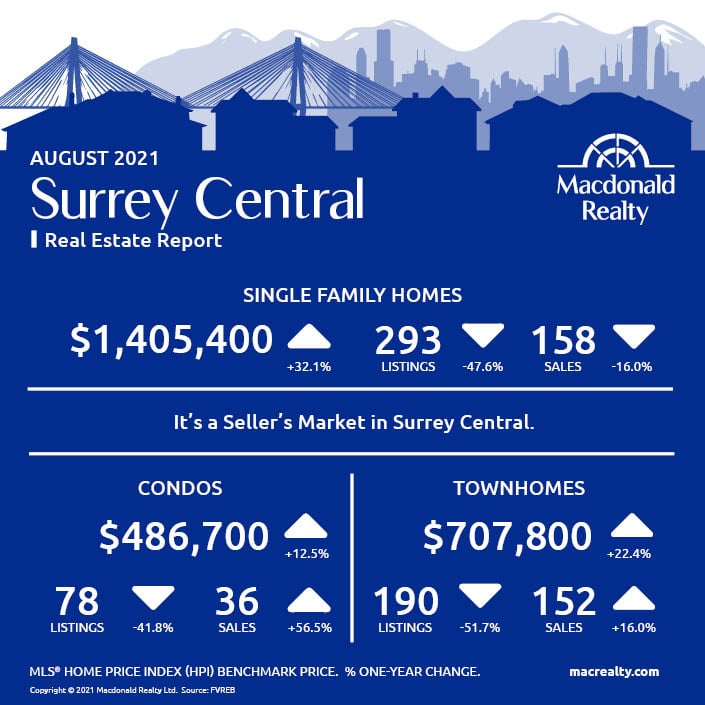
Surrey Central
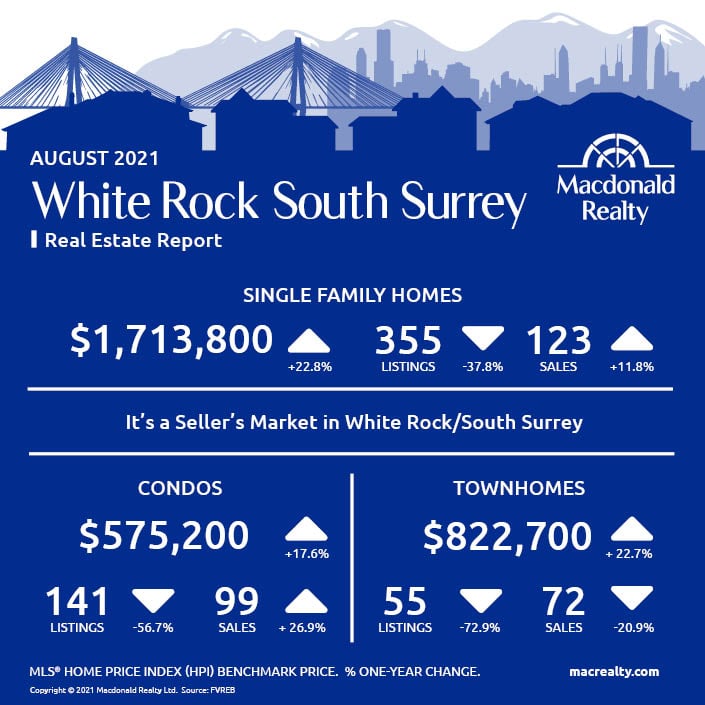
White Rock / South Surrey
Looking for more information about the real estate market in specific neighbourhoods in Surrey, Langley and Fraser Valley?
Macdonald Realty has offices in North Delta, White Rock/South Surrey, and Langley. Please email [email protected] or call 1-877-278-3888 to be matched with a REALTOR® working in your area.
MLS® Home Price Index (HPI) Benchmark Price
Average and median home prices are often misinterpreted, are affected by change in the mix of homes sold, and can swing dramatically from month to month (based on the types and prices of properties that sold in a given month). The MLS® HPI overcomes these shortcomings and uses the concept of a benchmark home, a notional home with common attributes of typical homes in a defined area. Visit www.housepriceindex.ca for more information.
This blog post is based on market data provided by the Fraser Valley Real Estate Board (FVREB) www.fvreb.bc.ca
by Macrealty Marketing Team | Sep 7, 2021 | Market Updates
Here are the latest real estate market statistics from Macdonald Realty on Greater Victoria, Parksville/Qualicum, and Nanaimo listings and sales in August 2021.
Find all the infographics related to the April Market Statistics by visiting the Facebook Album.
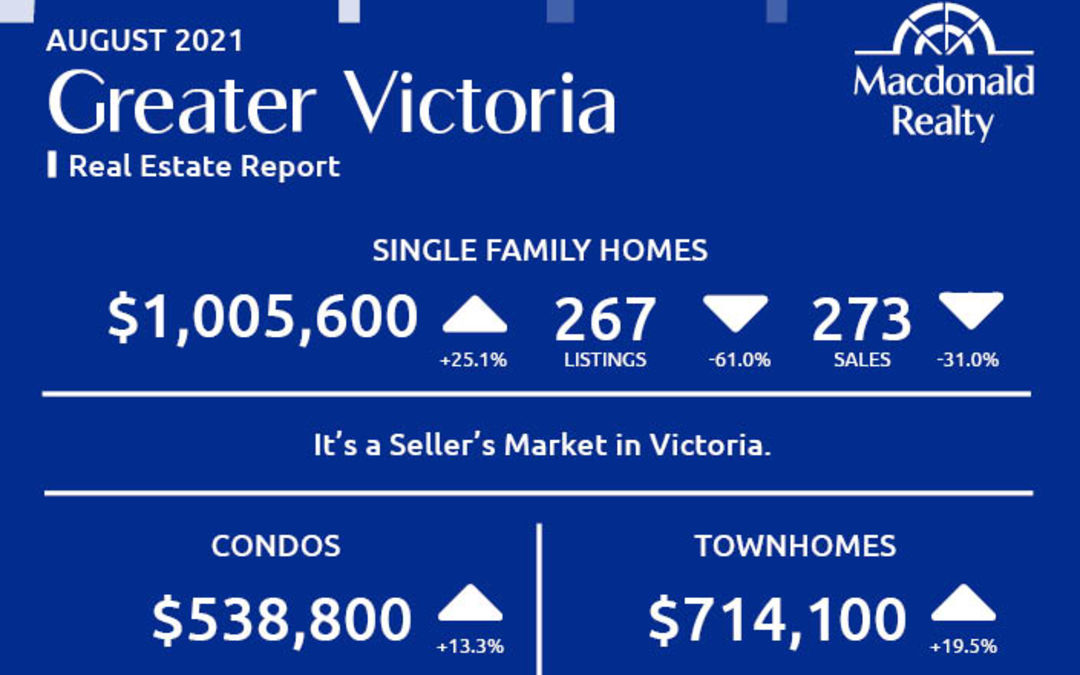
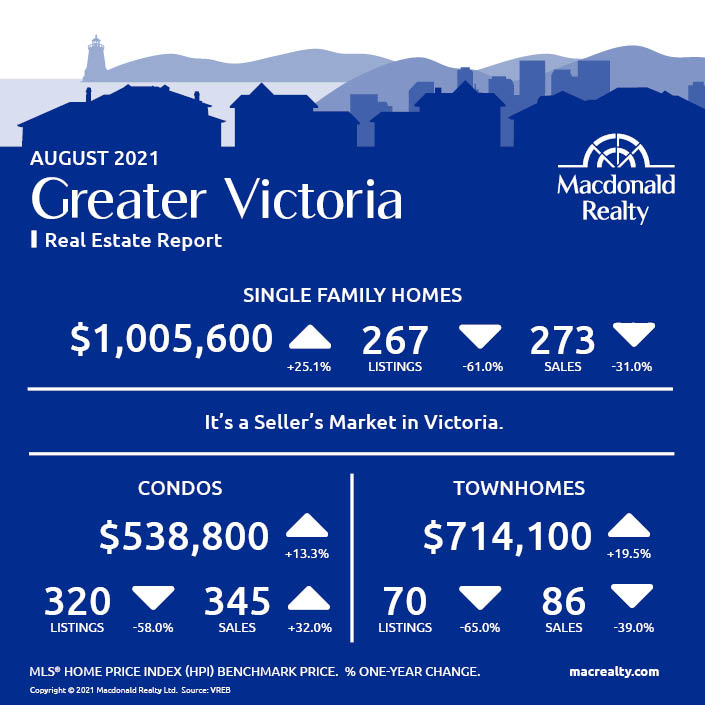
Greater Victoria
According to the Victoria Real Estate Board housing market continues to adapt to long-term lack of supply.
A total of 831 properties sold in the Victoria Real Estate Board region this August, 15.1 per cent fewer than the 979 properties sold in August 2020 and 0.5 per cent fewer than the previous month of July. Condominium sales were up 31.7 per cent from August 2020 with 345 units sold. 21.5 per cent more condominiums sold in August 2021 than in the previous month of July. Sales of single family homes were down 29.9 per cent from August 2020 with 357 sold. 9.8 per cent fewer single family homes sold in August 2021 than in the previous month of July.
“Year over year numbers might indicate a slowing of our market, but there are two important factors to consider,” said Victoria Real Estate Board President David Langlois. “The first is that our market is starved for inventory. It should come as no surprise that with half the available inventory of last August we sold fewer homes this August. Without the significant lack of inventory we’re experiencing, sales would most certainly have been comparable to, if not greater than, last August. The second factor is that the previous ten-year running average for sales in the month of August is 675 properties, so with 831 properties changing hands this August, it is clear that our market remains very robust and that lack of supply is the biggest issue impacting attainability for our community.”
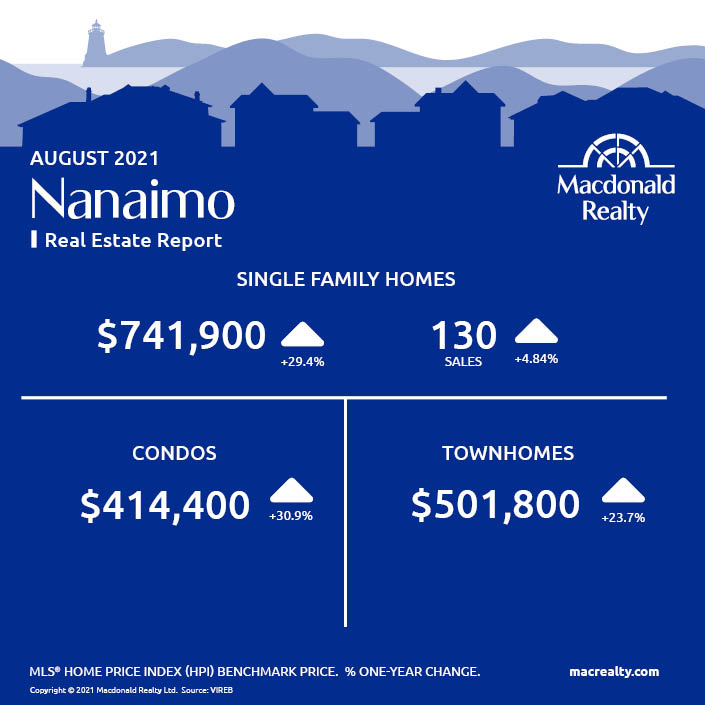
Nanaimo
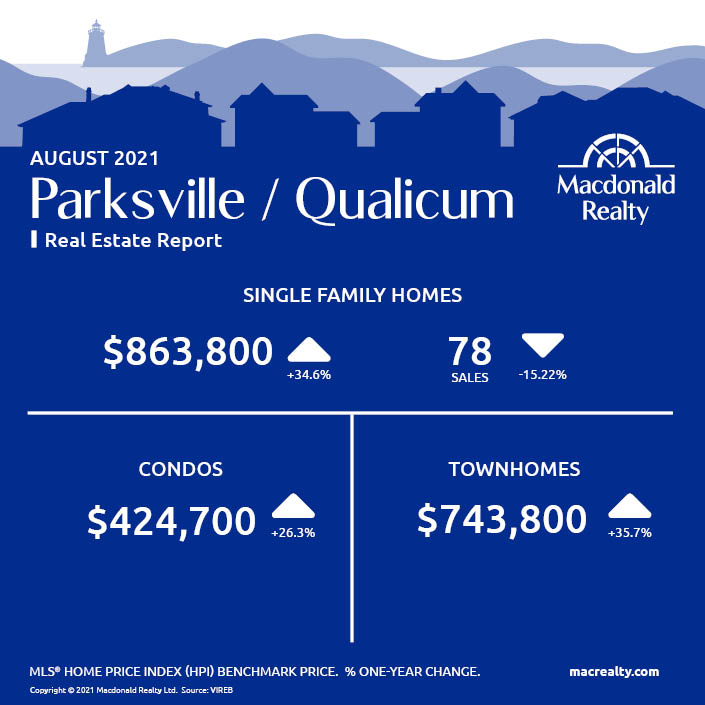
Parksville / Qualicum
Looking for more information about the real estate market in specific neighbourhoods in Victoria, Parksville, Nanaimo, Vancouver Island and the Gulf Islands?
Macdonald Realty has offices in downtown Victoria, Sidney, Parksville and Salt Spring Island. Please email [email protected] or call 1-877-278-3888 to be matched with a REALTOR® working in your area.
MLS® Home Price Index (HPI) Benchmark Price
Average and median home prices are often misinterpreted, are affected by change in the mix of homes sold, and can swing dramatically from month to month (based on the types and prices of properties that sold in a given month). The MLS® HPI overcomes these shortcomings and uses the concept of a benchmark home, a notional home with common attributes of typical homes in a defined area. Visit www.housepriceindex.ca for more information.
This blog post is based on market data provided by the Victoria Real Estate Board (VREB) www.vreb.org and the Vancouver Island Real Estate Board (VIREB) www.vireb.com. Market data from the VIREB includes listings and sales in Campbell River, Comox Valley, Cowichan Valley Nanaimo, Parksville/Qualicum, Port Alberni/West, North Island, and the Islands.
by Macrealty Marketing Team | Aug 6, 2021 | Market Updates
Here are the latest real estate market statistics from Macdonald Realty on Squamish, Whistler, and Sunshine Coast listings and sales in July 2021.
Find all the infographics related to the May Market Statistics by visiting the Facebook Album.
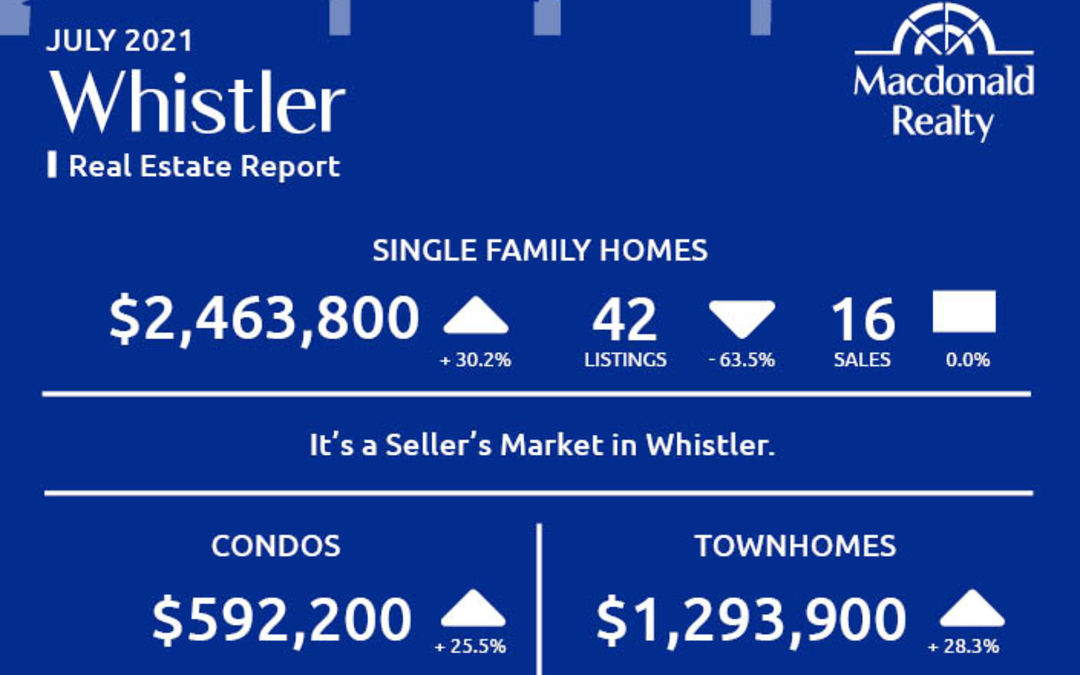
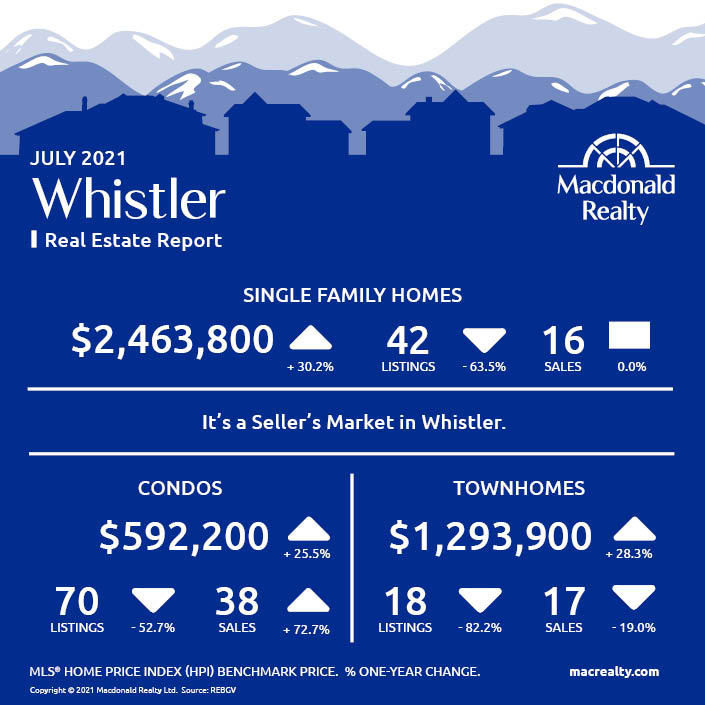
Whistler
In July 2021, there were 16 sales of detached homes and 42 active listings. The benchmark sale price was $2,463,800.
The condo market had 38 sales and 70 active listings at the end of the month. The benchmark sale price was $592,200.
The townhome market had 17 sales and, the active listings were 18. The benchmark sale price was $1,293,900.
It’s a Seller’s market in Whistler.
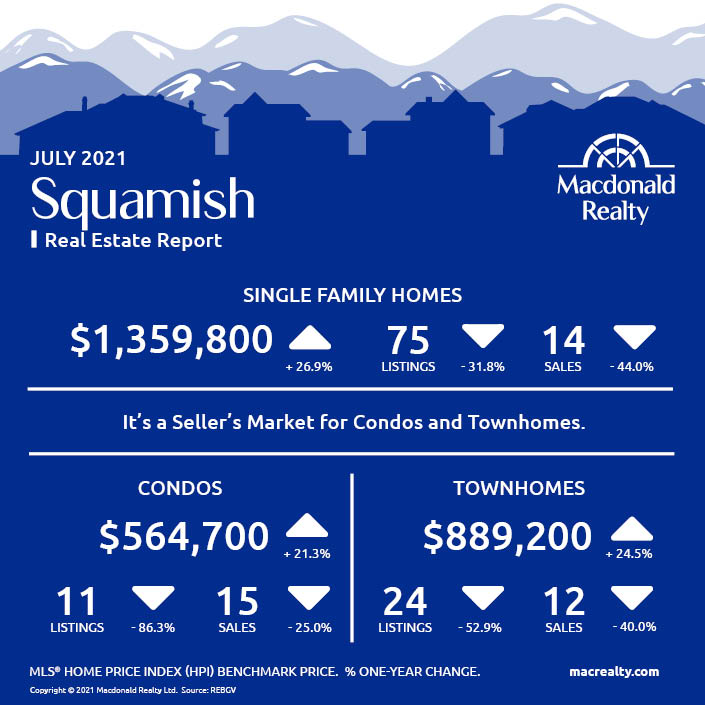
Squamish
In July 2021, there were 14 sales of detached homes and 75 active listings. The benchmark sale price was $1,359,800.
The condo market had 15 sales and 11 active listings at the end of the month. The benchmark sale price was $564,700.
The townhome market had 12 sales and, the active listings were 24. The benchmark sale price was $889,200.
It’s a Seller’s Market for Condos and Townhomes in Squamish.
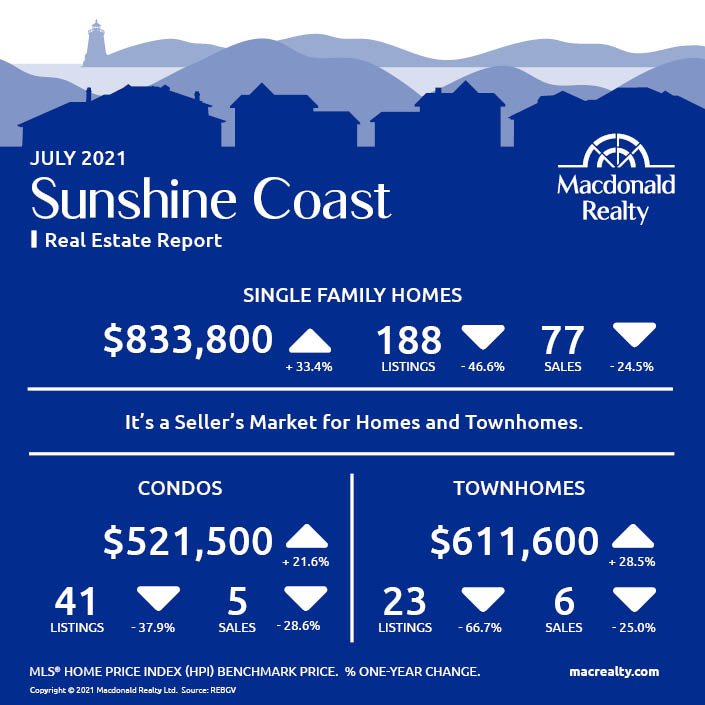
Sunshine Coast
In July 2021, there were 77 sales of detached homes and 188 active listings. The benchmark sale price was $833,800.
The condo market had 5 sales and 41 active listings at the end of the month.
The townhome market had 6 sales and, the active listings were 23.
It’s a Seller’s market for Homes and Townhomes in Sunshine Coast.
Looking for more information about the real estate market in specific neighbourhoods in Squamish, Whistler, and Sunshine Coast? Macdonald Realty has offices in Squamish, Whistler, and Sunshine Coast. Please email [email protected] or call 1-877-278-3888 to be matched with a REALTOR® working in your area.
MLS® Home Price Index (HPI) Benchmark Price
Average and median home prices are often misinterpreted, are affected by change in the mix of homes sold, and can swing dramatically from month to month (based on the types and prices of properties that sold in a given month). The MLS® HPI overcomes these shortcomings and uses the concept of a benchmark home, a notional home with common attributes of typical homes in a defined area. Visit www.housepriceindex.ca for more information.
This blog post is based on market data provided by the Real Estate Board of Greater Vancouver (REBGV) www.rebgv.org
by Macrealty Marketing Team | Aug 6, 2021 | Market Updates
Here are the latest real estate market statistics from Macdonald Realty on the Greater Vancouver listings and sales in July 2021.
Find all the infographics by visiting the Facebook Album.
Metro Vancouver’s* housing market saw more moderate sales, listings and pricing trends in July compared to the heightened activity experienced throughout much of the pandemic.
“Moderation was the name of the game in July,” said REBGV’s economist Keith Stewart. “Home sales and listings fell in line with typical seasonal patterns as summer got going in earnest in July. On top of moderating market activity, price growth has leveled off in most areas and home types.”
As released by the Board:
“Low housing supply remains a fundamental factor in Metro Vancouver’s housing market,” Stewart said. “Home sales remain above average and we’re starting to see price increases relent as well. Going forward, the supply of homes for sale will be among the most critical factors to watch. This will determine the next direction for house price trends.”
*Areas covered by the Real Estate Board of Greater Vancouver include: Burnaby, Coquitlam, Maple Ridge, New Westminster, North Vancouver, Pitt Meadows, Port Coquitlam, Port Moody, Richmond, South Delta, Squamish, Sunshine Coast, Vancouver, West Vancouver, and Whistler. Check out the infographics of Squamish, Sunshine Coast and Whitler, HERE.
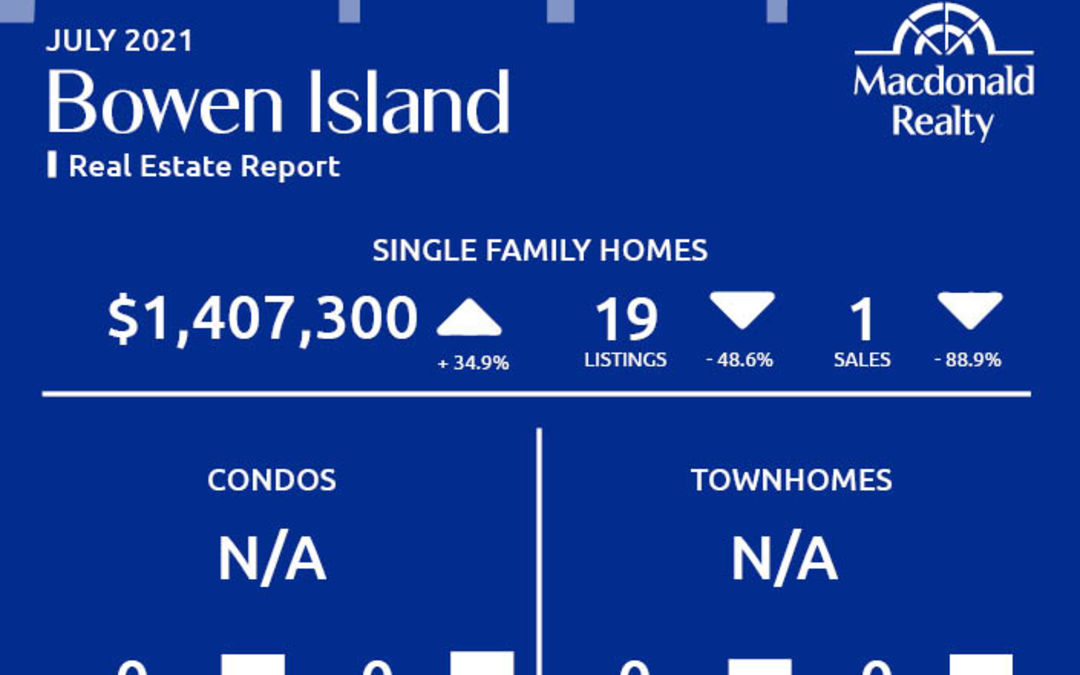
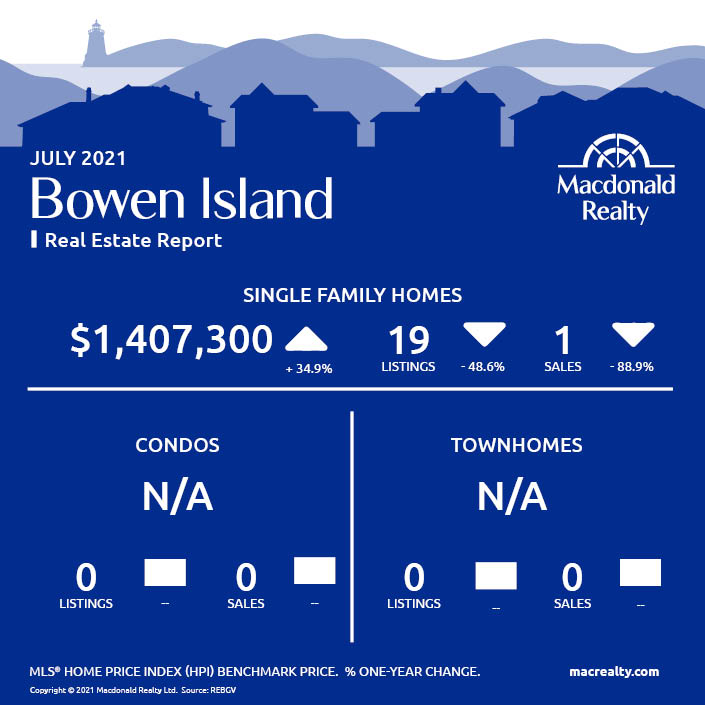
Bowen Island
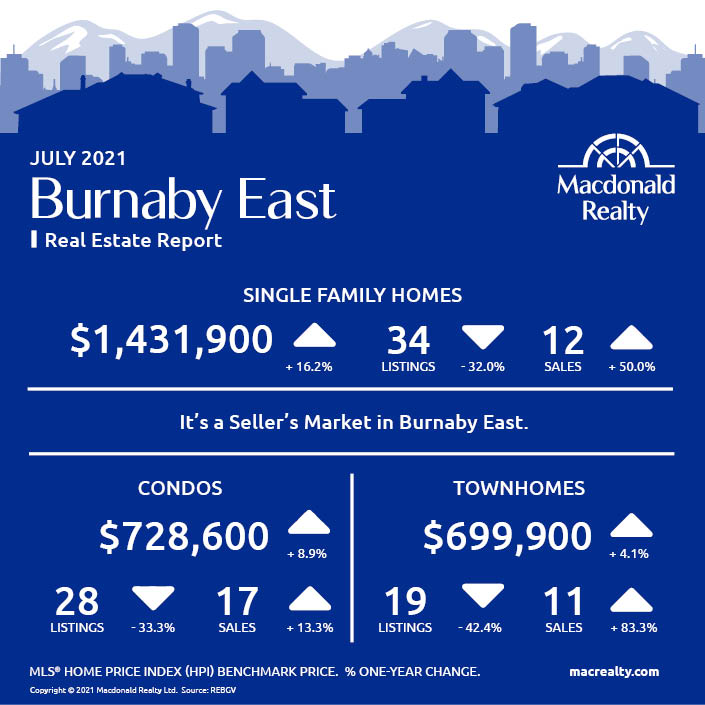
Burnaby East
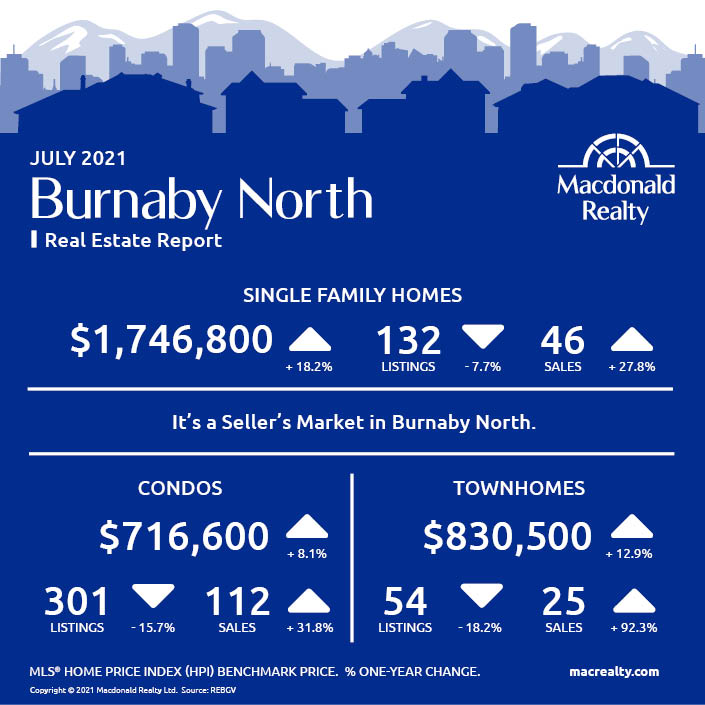
Burnaby North
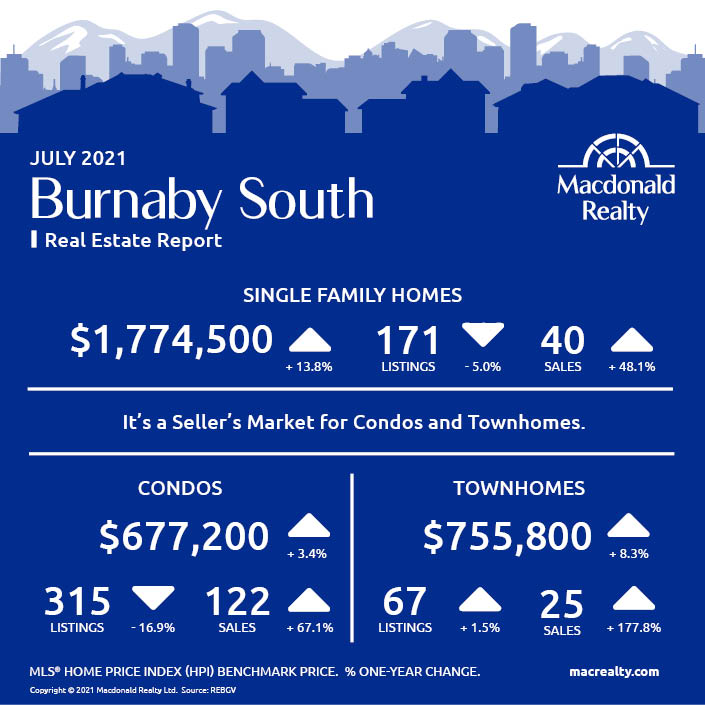
Burnaby South
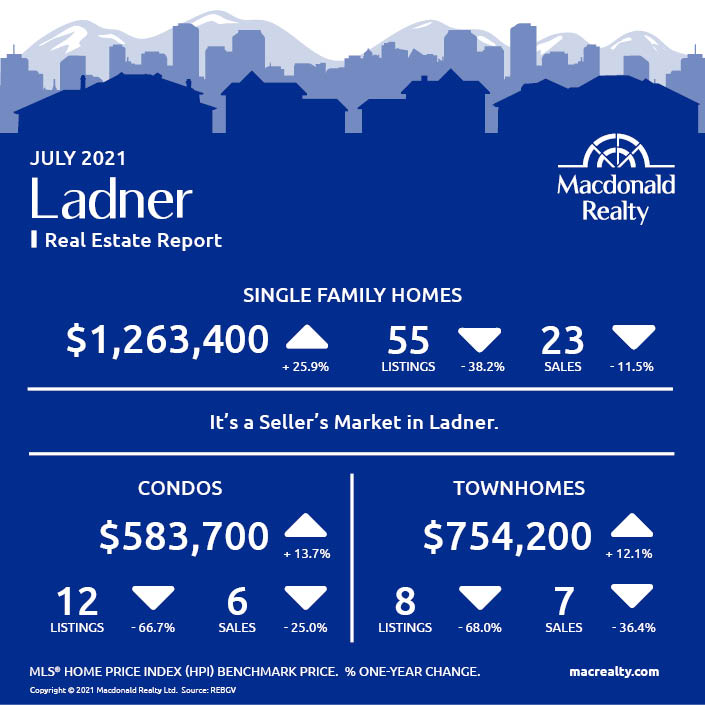
Ladner
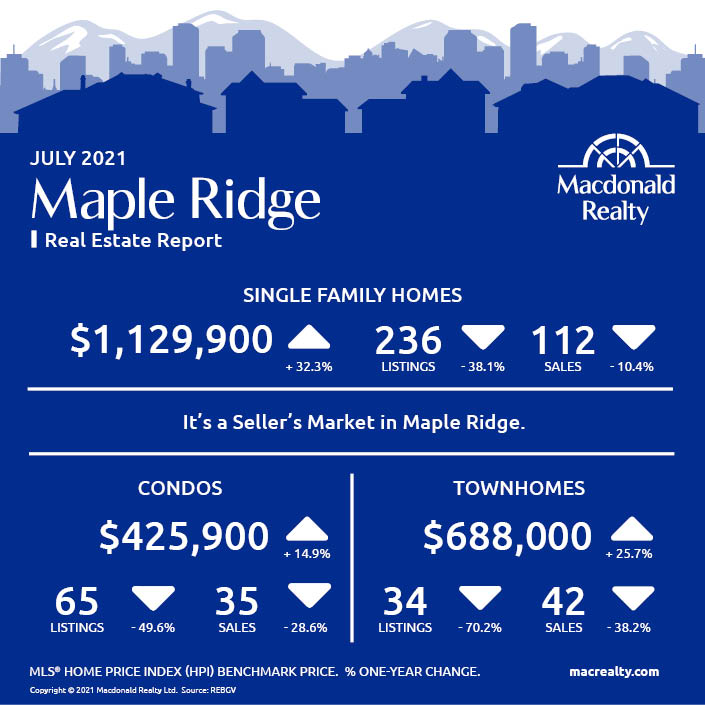
Maple Ridge
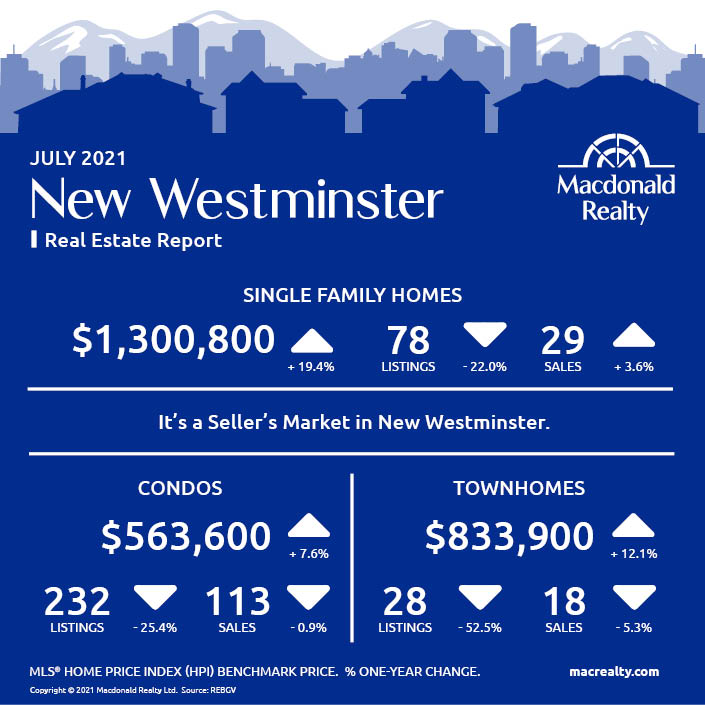
New Westminster
North Vancouver

Pitt Meadows

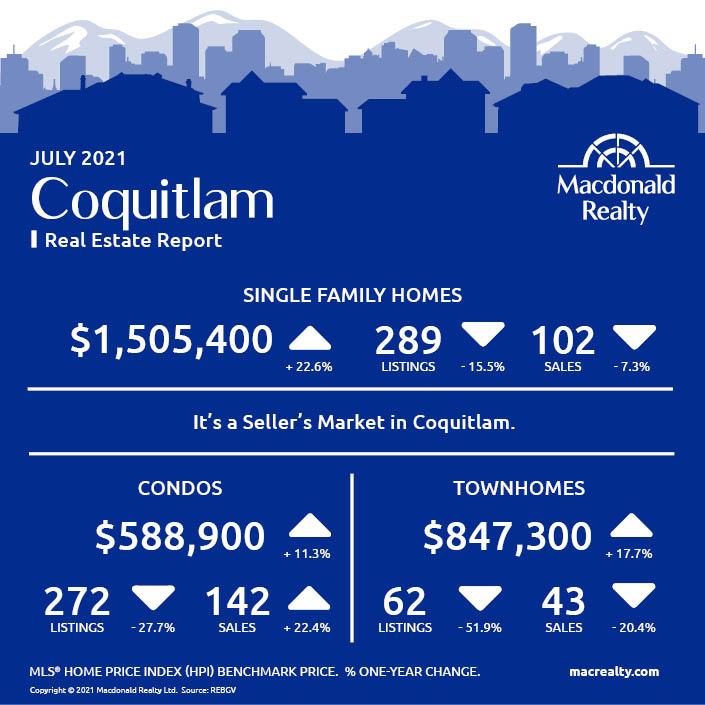
Coquitlam
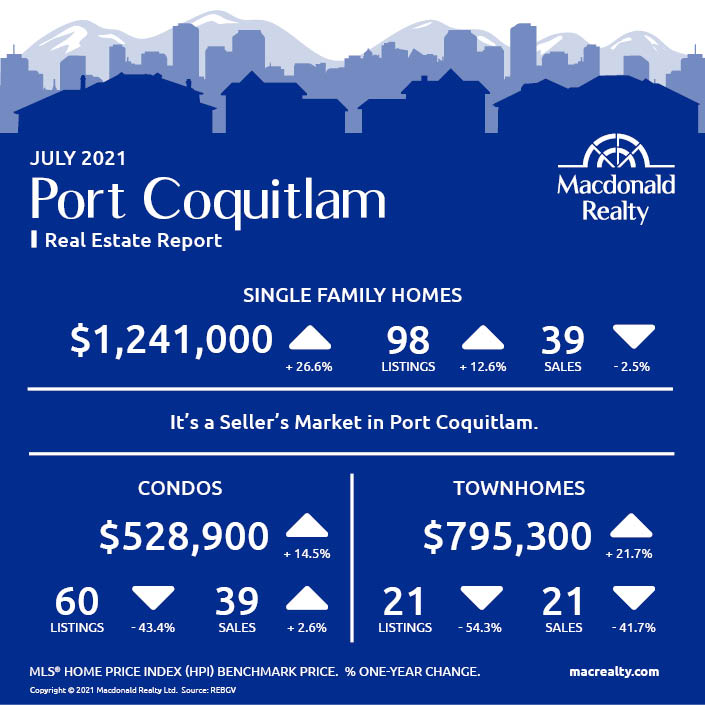
Port Coquitlam
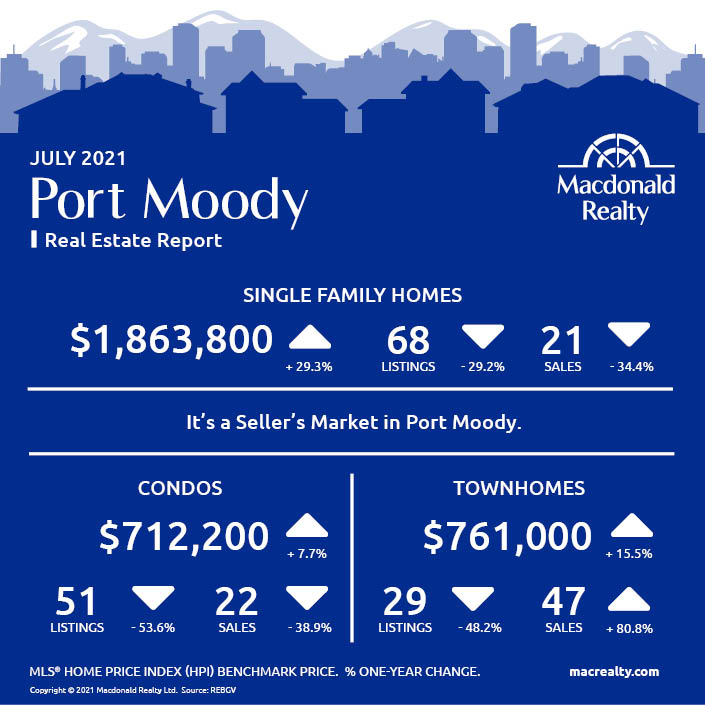
Port Moody
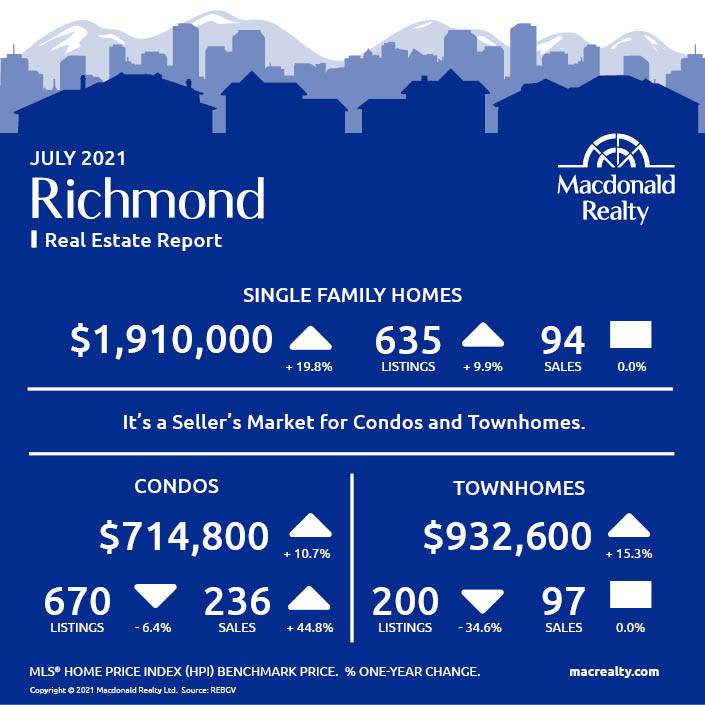
Richmond
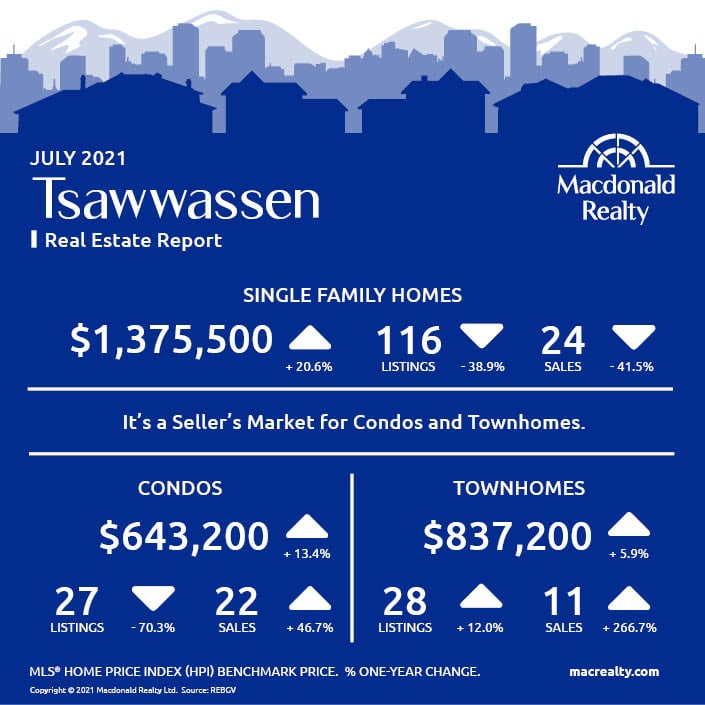
Tsawwassen
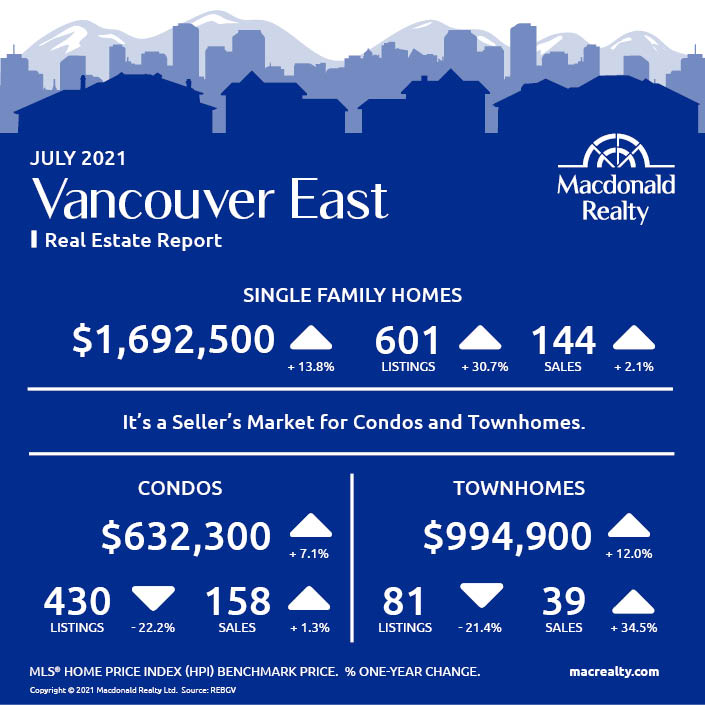
Vancouver East
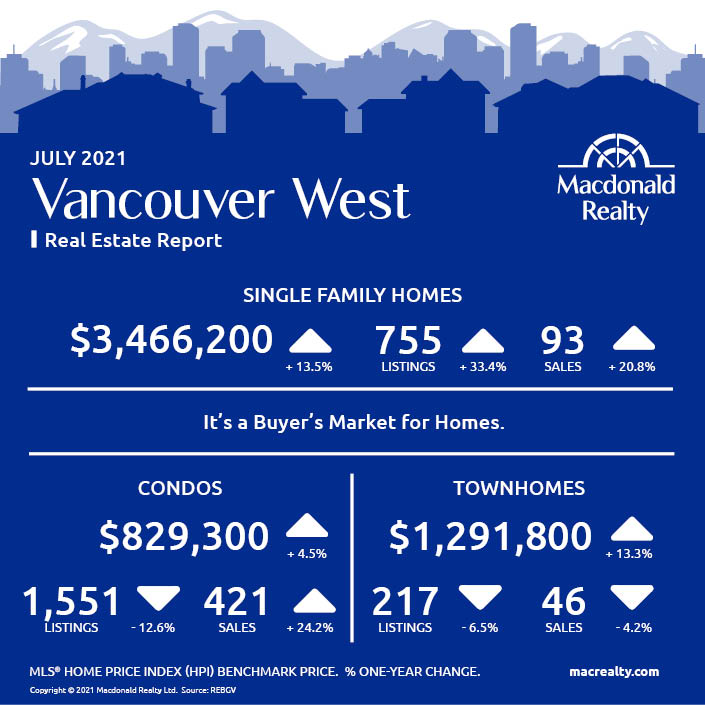
Vancouver West
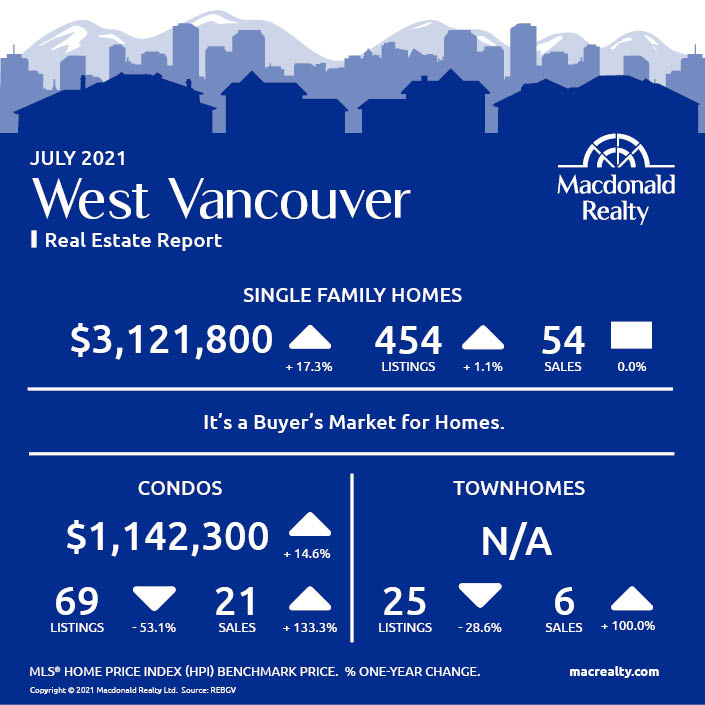
West Vancouver
Looking for more information about the real estate market in specific neighbourhoods in the Greater Vancouver?
Macdonald Realty has offices across the Greater Vancouver. Please email [email protected] or call 1-877-278-3888 to be matched with a REALTOR® working in your area.
MLS® Home Price Index (HPI) Benchmark Price
Average and median home prices are often misinterpreted, are affected by change in the mix of homes sold, and can swing dramatically from month to month (based on the types and prices of properties that sold in a given month). The MLS® HPI overcomes these shortcomings and uses the concept of a benchmark home, a notional home with common attributes of typical homes in a defined area. Visit www.housepriceindex.ca for more information.
This blog post is based on market data provided by the Real Estate Board of Greater Vancouver (REBGV) www.rebgv.org
by Macrealty Marketing Team | Aug 6, 2021 | Market Updates
According to the Fraser Valley Real Estate Board home sales in the Fraser Valley region remained steady in July.
The Board processed a total of 2,006 property sales on its Multiple Listing Service® (MLS®) in July, a decrease of 11 per cent compared to June and a 4.5 per cent decrease compared to the same month last year. Sales continued to remain above normal for July – 15 per cent above the ten-year average.
As released by the Board Larry Anderson, President of the Board, said, “A summer slowdown is typical. We anticipated that once people could travel and enjoy family time safely, they would do so, and we couldn’t be happier for everyone.
“Demand for homes in our region, however, remains above average – for fourteen months we have been in a seller’s market for Fraser Valley detached homes, townhomes and condos – and yet for the last four months, new listings in our region have been decreasing.”
Find all the infographics related to the April Market Statistics by visiting the Facebook Album.
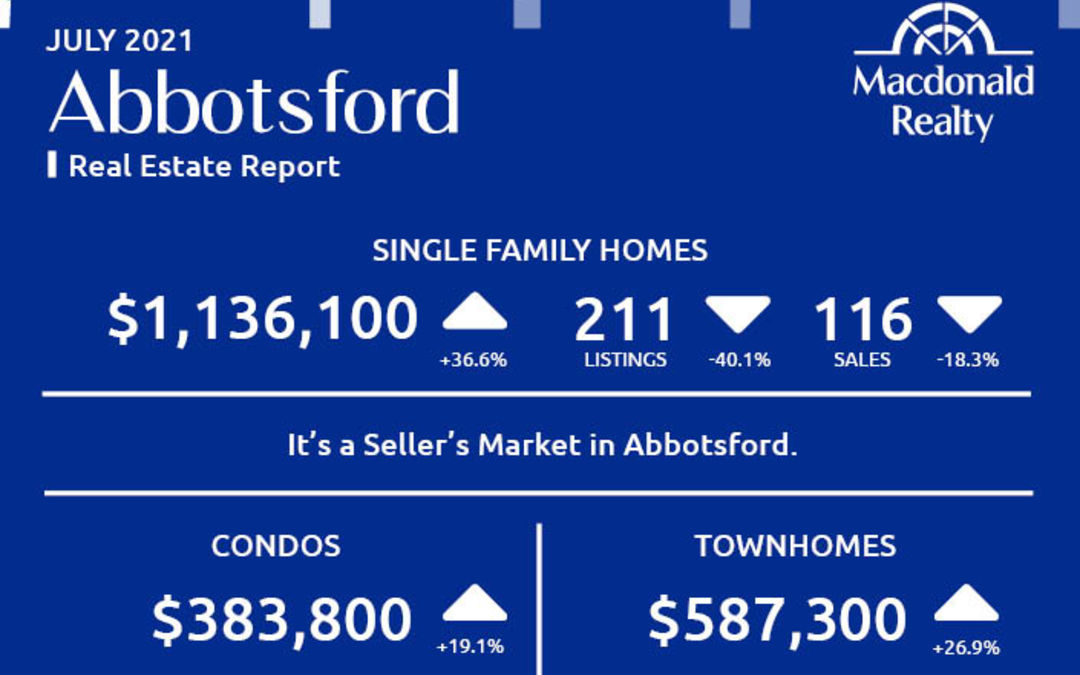
Abbotsford

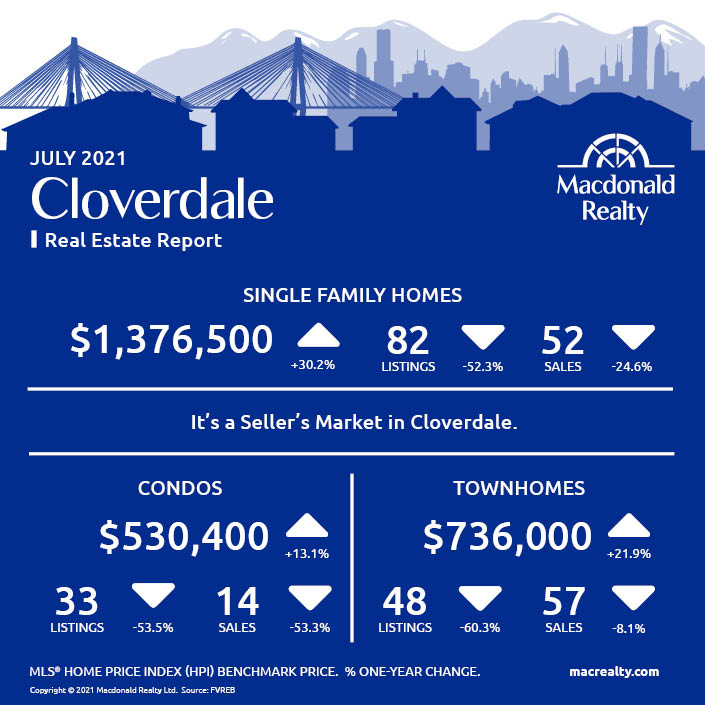
Cloverdale
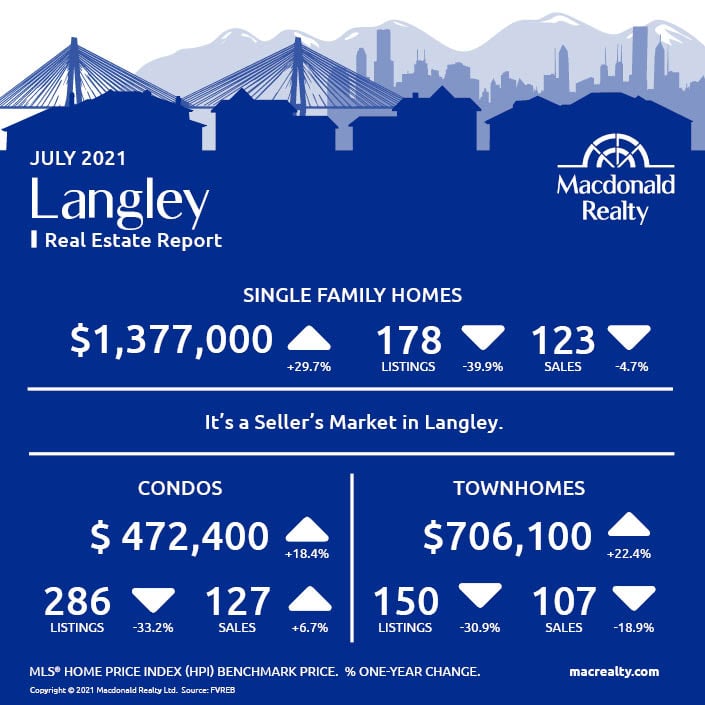
Langley
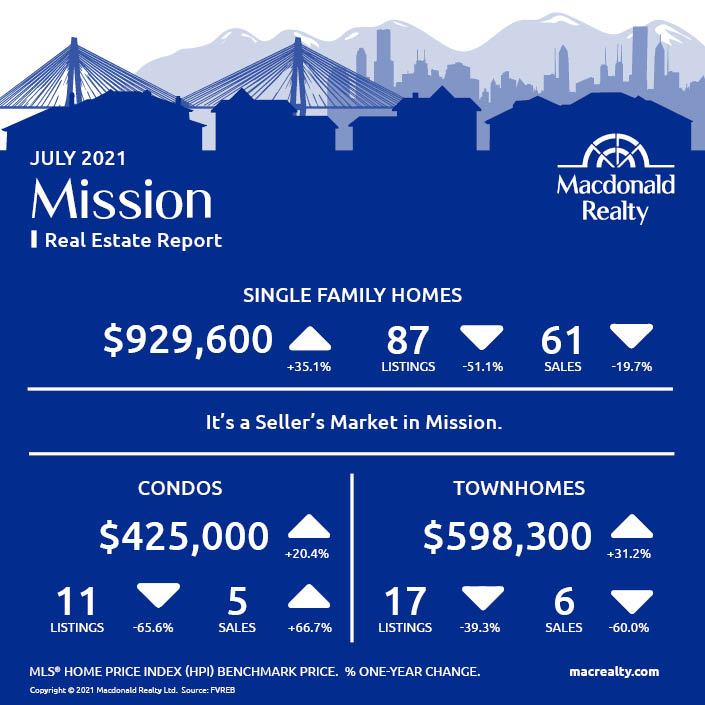
Mission
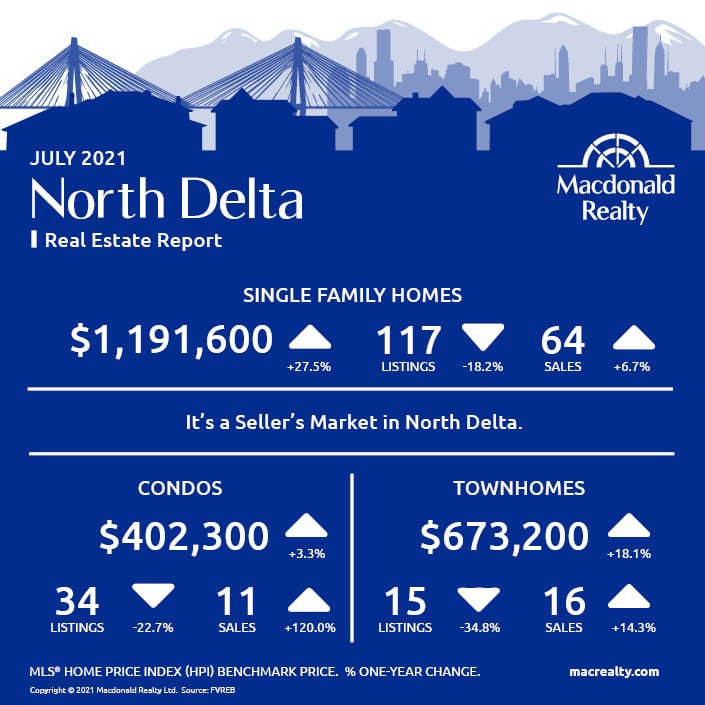
North Delta
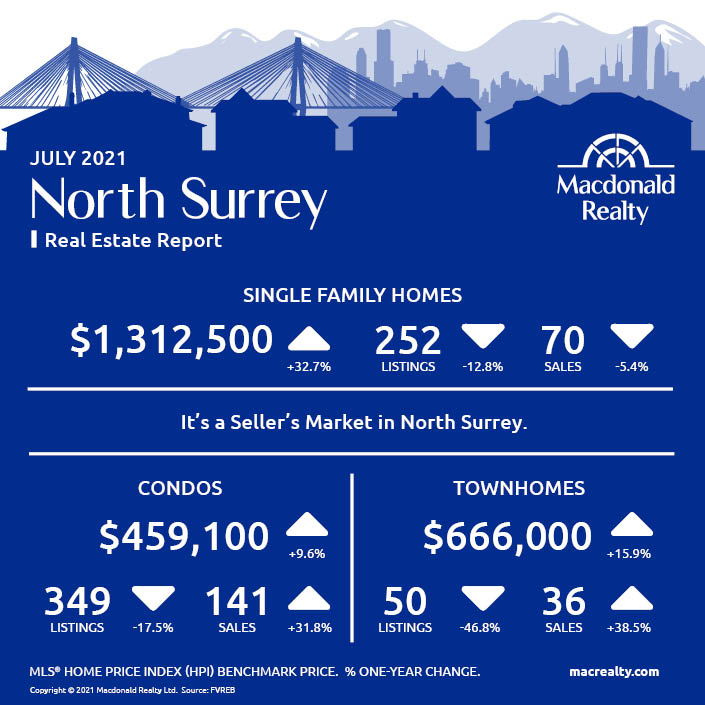
North Surrey
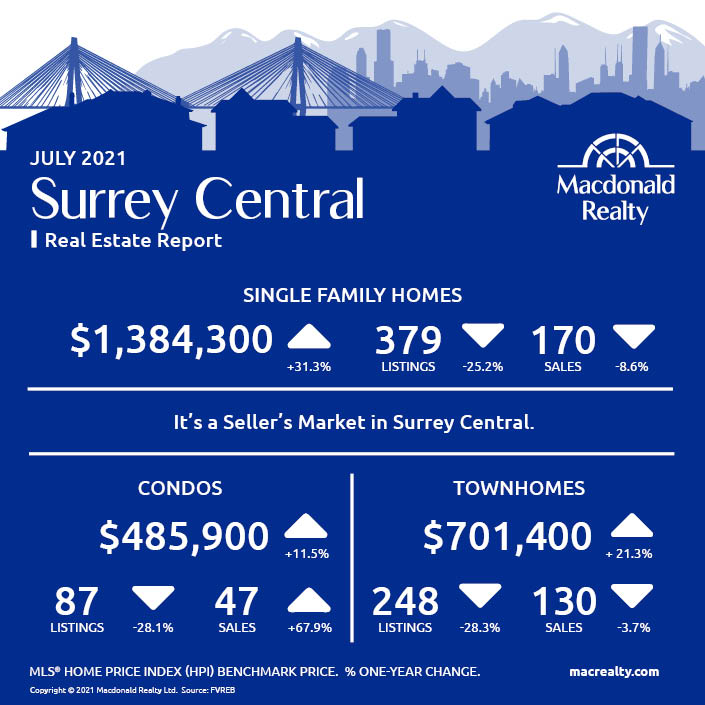
Surrey Central
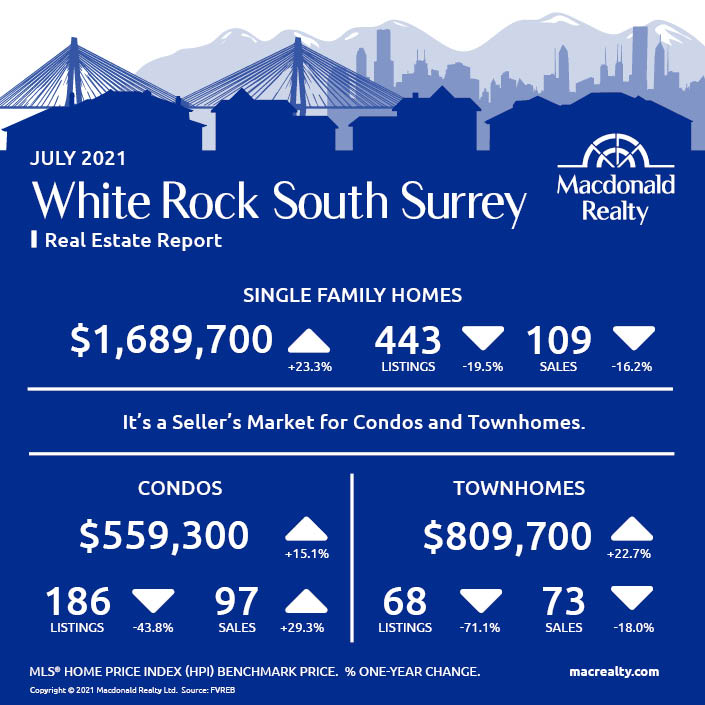
White Rock / South Surrey
Looking for more information about the real estate market in specific neighbourhoods in Surrey, Langley and Fraser Valley?
Macdonald Realty has offices in North Delta, White Rock/South Surrey, and Langley. Please email [email protected] or call 1-877-278-3888 to be matched with a REALTOR® working in your area.
MLS® Home Price Index (HPI) Benchmark Price
Average and median home prices are often misinterpreted, are affected by change in the mix of homes sold, and can swing dramatically from month to month (based on the types and prices of properties that sold in a given month). The MLS® HPI overcomes these shortcomings and uses the concept of a benchmark home, a notional home with common attributes of typical homes in a defined area. Visit www.housepriceindex.ca for more information.
This blog post is based on market data provided by the Fraser Valley Real Estate Board (FVREB) www.fvreb.bc.ca
by Macrealty Marketing Team | Aug 6, 2021 | Market Updates
Here are the latest real estate market statistics from Macdonald Realty on Okanagan listings and sales in July 2021.
Find the infographics by visiting the Facebook Album.
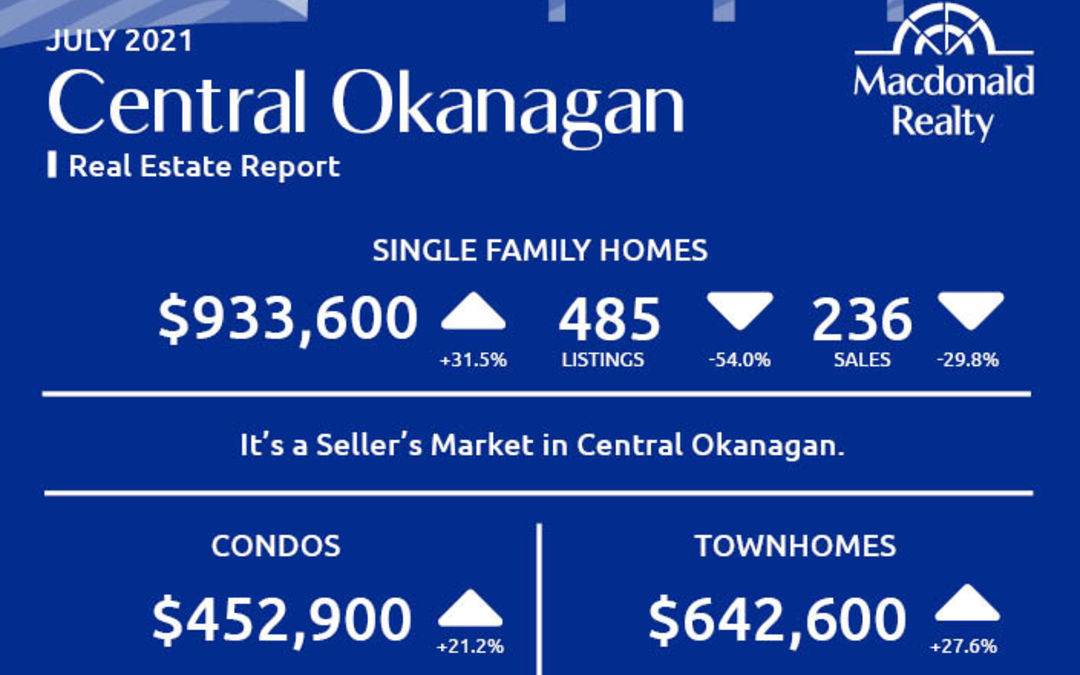
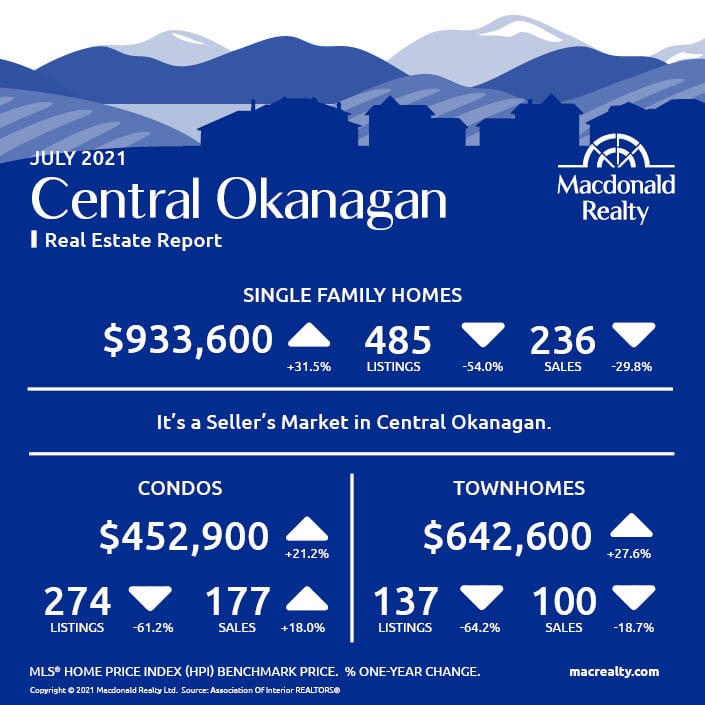
Central Okanagan: Kelowna and Lake Country
There were 236 sales, 485 active listings, and $933,600 average sale price for detached homes in the Central Okanagan market, including Kelowna and Lake Country.
The condo market featured 177 sales and 274 active listings at the end of the month. The average sale price was $452,900.
Townhome sales were 100, active listings were 137 and the average sale price was $642,600.
It’s a seller’s market in Central Okanagan.
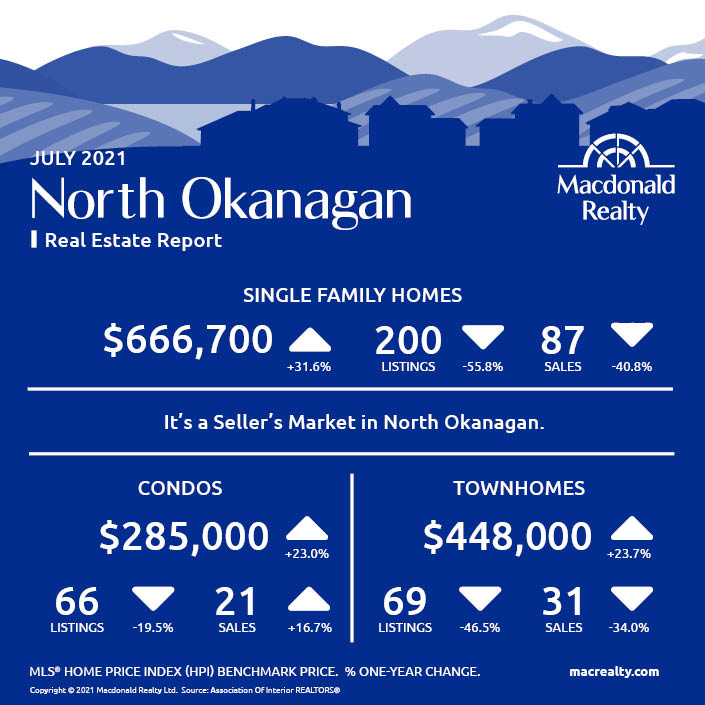
North Okanagan: Vernon and surrounding area
In North Okanagan, including Vernon and the surrounding area and the average sale price was $666,700. At the end of the month, there were 87 sales and 200 active listings.
There were 21 sales and 66 active listings for condos. The average sale price was $285,000.
In comparison, townhomes featured 31 sales, 69 active listings and a $448,400 average sale price.
It’s a seller’s market in North Okanagan.
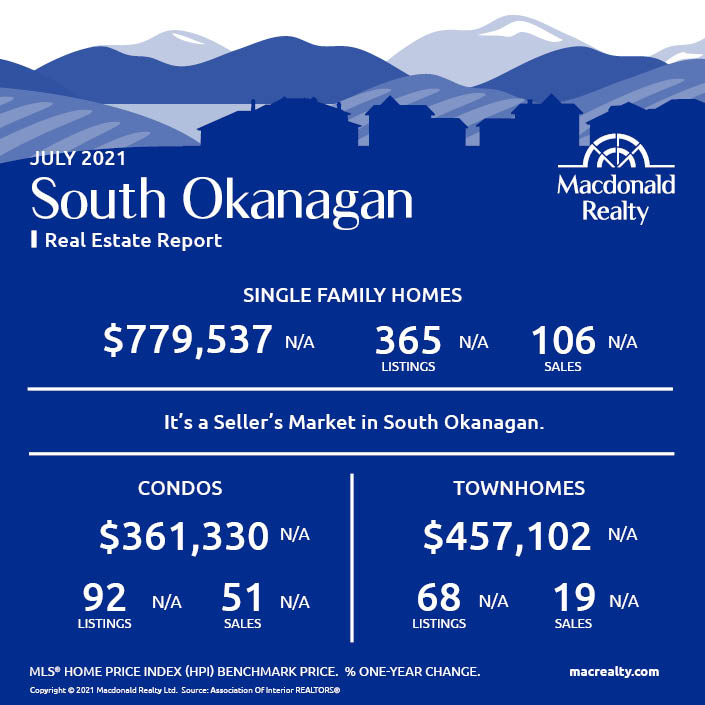
South Okanagan
There were 106 sales, 365 active listings, and $779,537 average sale price for detached homes in the South Okanagan market.
The condo market featured 51 sales and 92 active listings at the end of the month. The average sale price was $361,330.
Townhome sales were 19, active listings were 68 and the average sale price was $457,102.
It’s a seller’s market in South Okanagan.
Looking for more information about the real estate market in specific neighbourhoods in Okanagan?
Macdonald Realty has offices in Kelowna and across BC. Please email [email protected] or call 1-877-278-3888 to be matched with a REALTOR® working in your area.
This blog post is based on market data provided by the Association Of Interior REALTORS® https://www.interiorrealtors.ca/.

