
by Macrealty Marketing Team | Jun 7, 2021 | Market Updates
Here are the latest real estate market statistics from Macdonald Realty on the Greater Vancouver listings and sales in MAY 2021.
Find all the infographics by visiting the Facebook Album.
The Real Estate Board of Greater Vancouver (REBGV) reports that residential home sales in the region totalled 4,268 in May 2021, a 187.4 per cent increase from the 1,485 sales recorded in May 2020, and a 13 per cent decrease from the 4,908 homes sold in April 2021.
Last month’s sales were 27.7 per cent above the 10-year May sales average.
“While home sale and listing activity remained above our long-term averages in May, conditions moved back from the record-setting pace experienced throughout Metro Vancouver in March and April of this year,” Keith Stewart, REBGV economist said. “With a little less intensity in the market today than we saw earlier in the spring, home sellers need to ensure they’re working with their REALTOR® to price their homes based on current market conditions.”
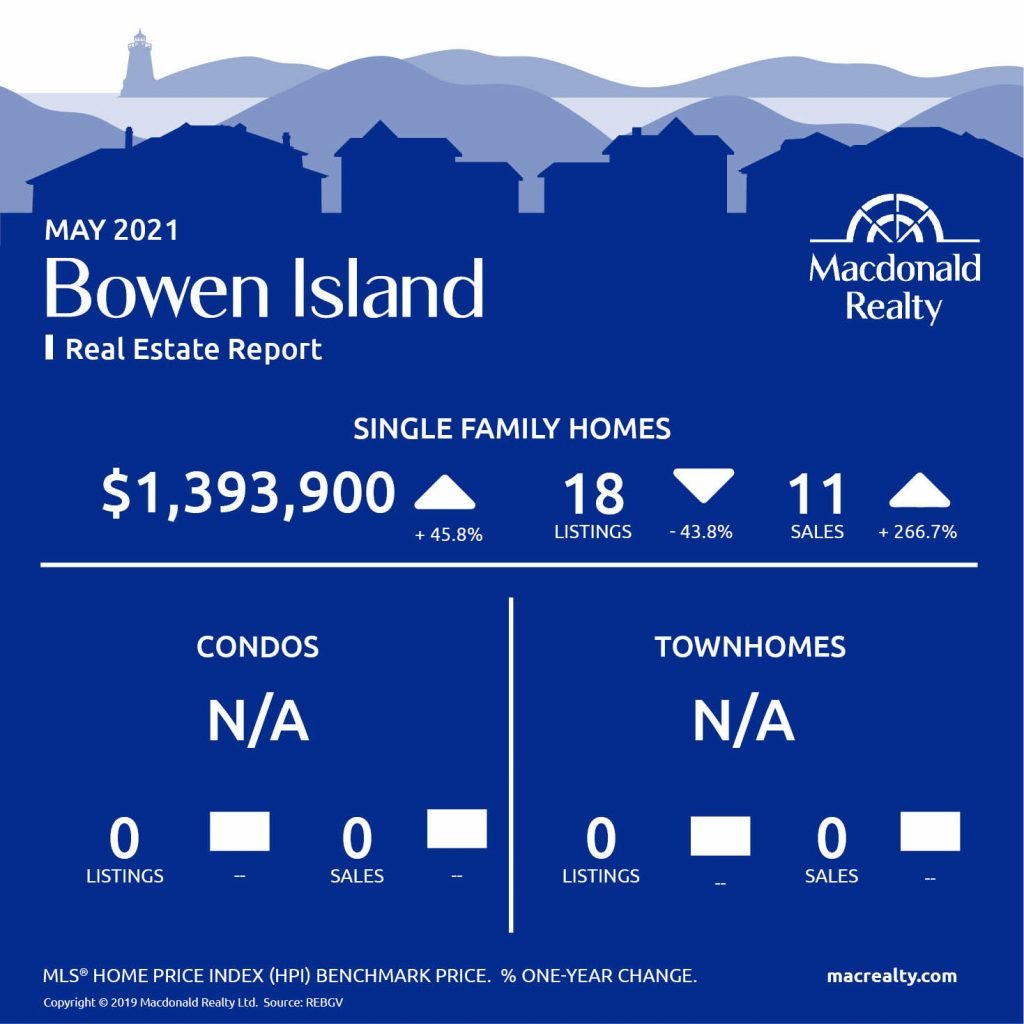
Bowen Island
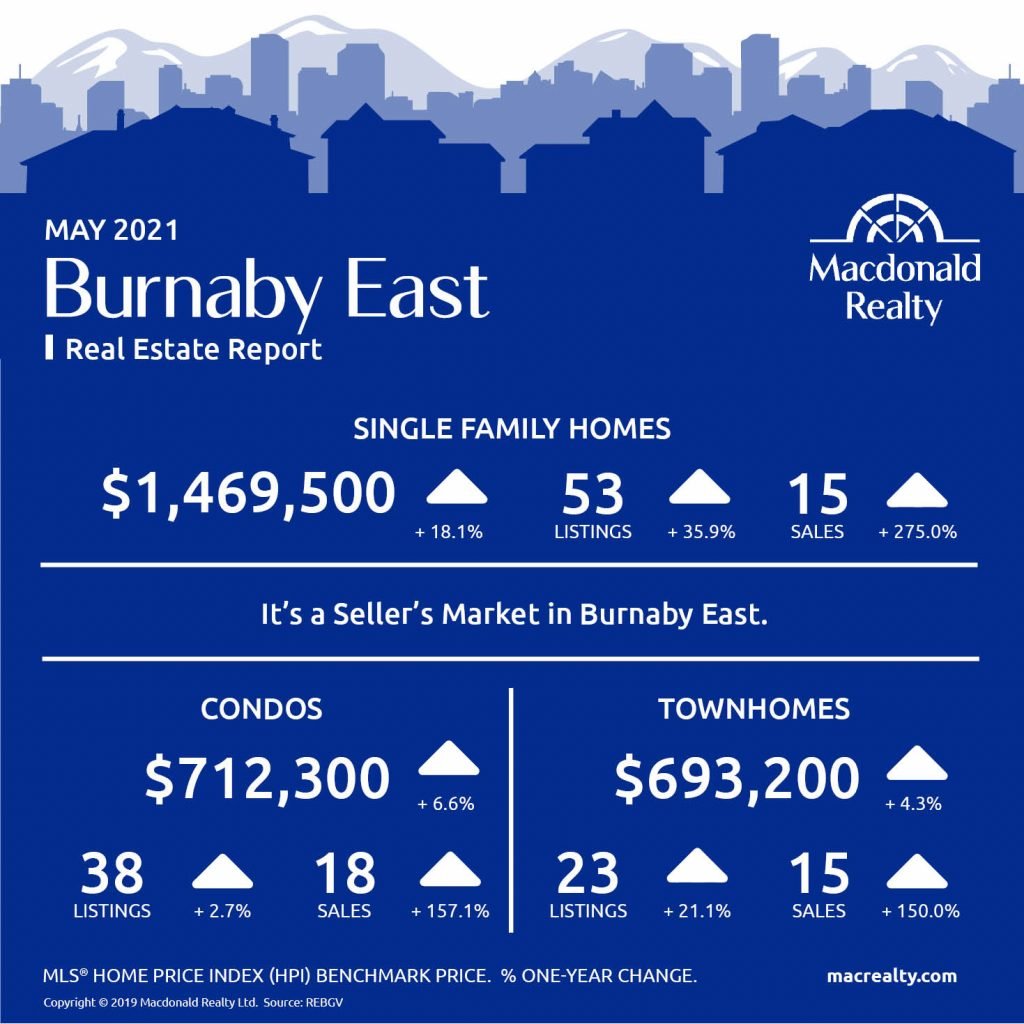
Burnaby East
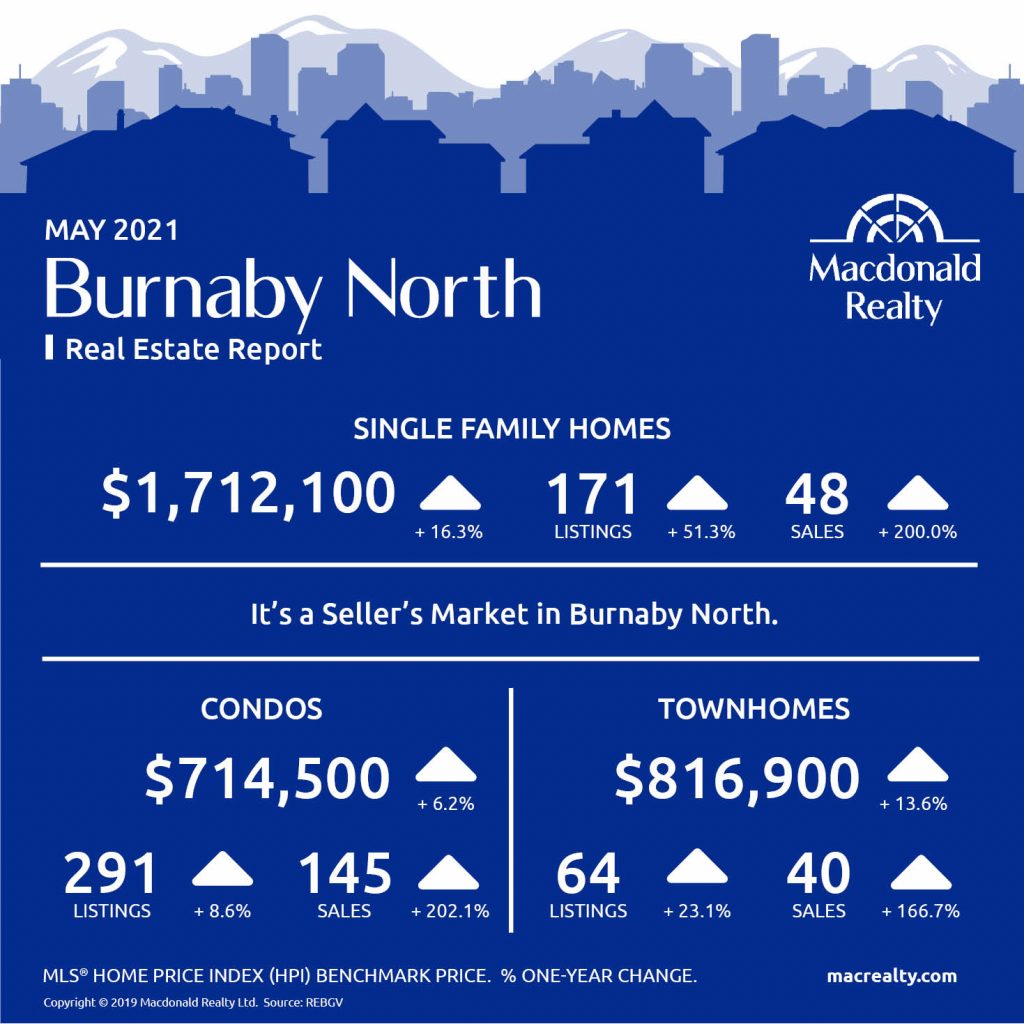
Burnaby North
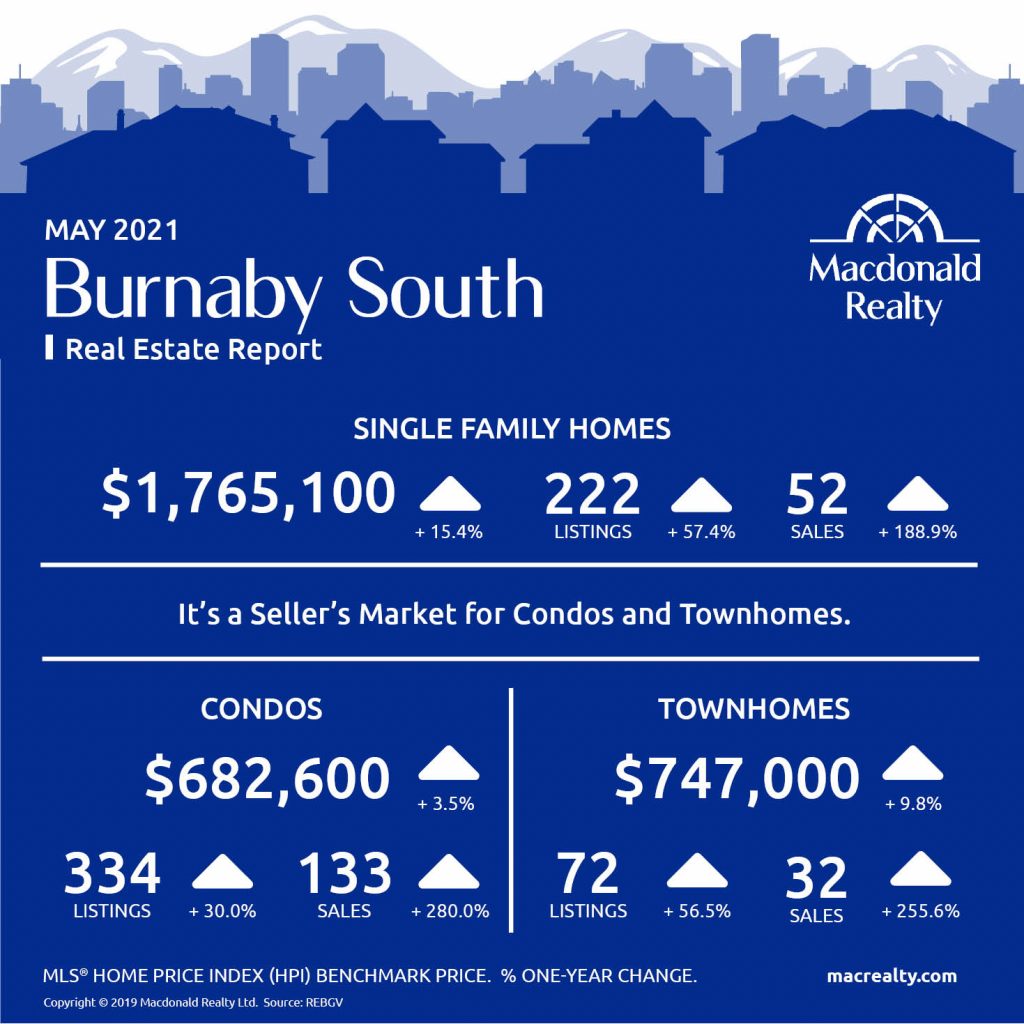
Burnaby South
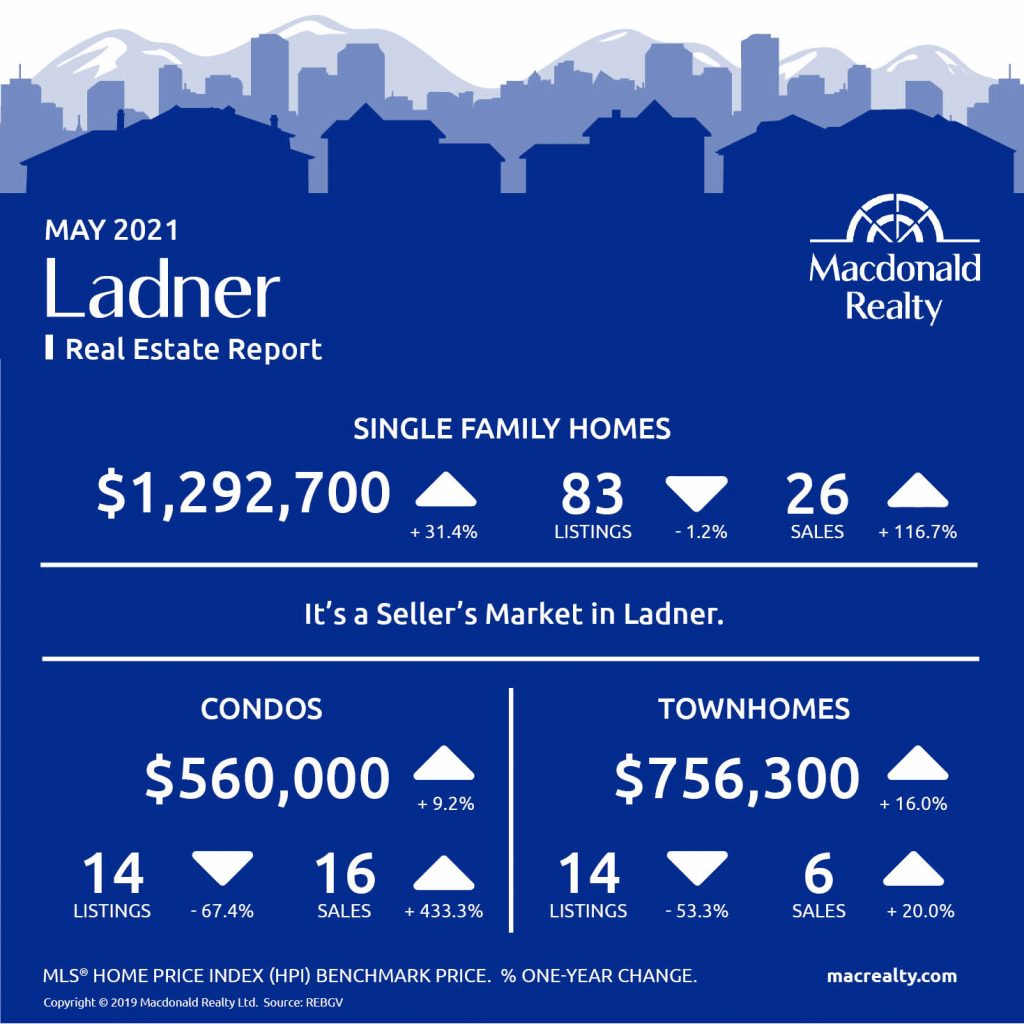
Ladner
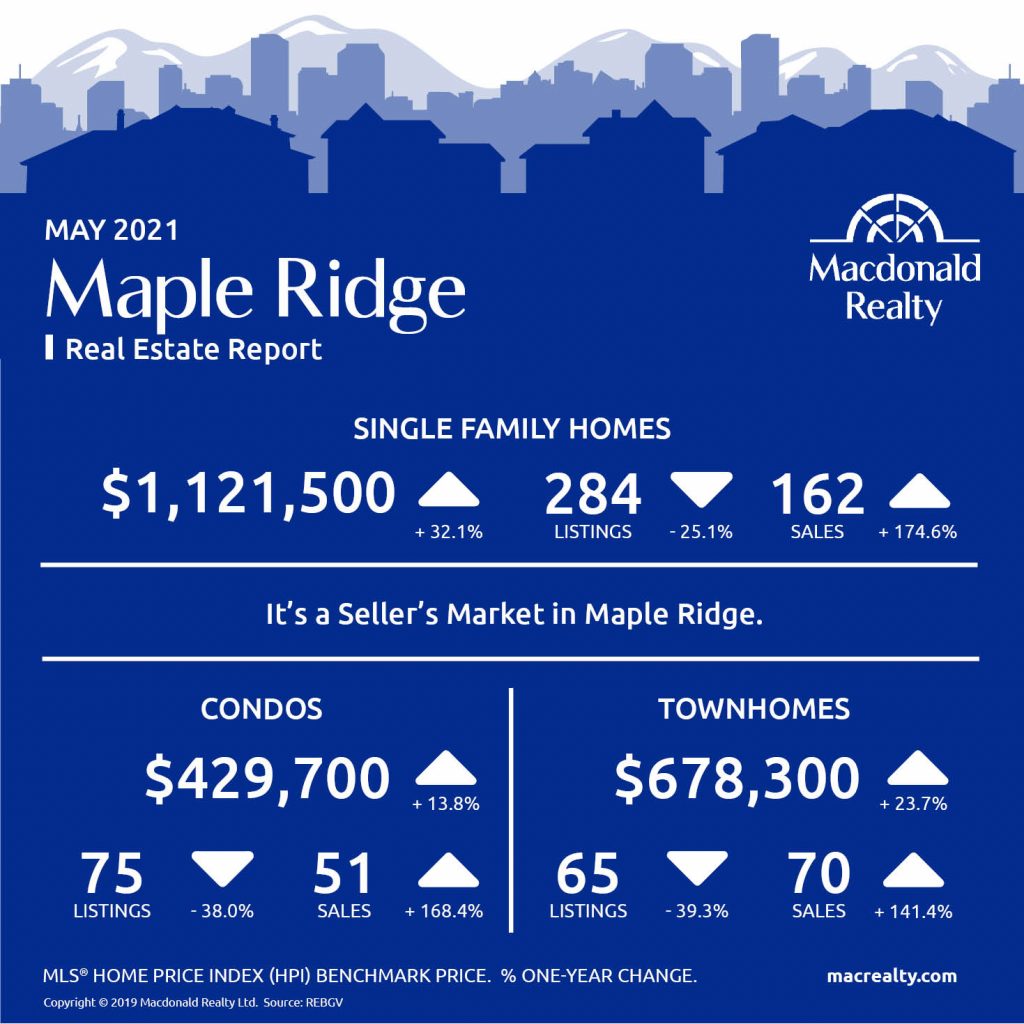
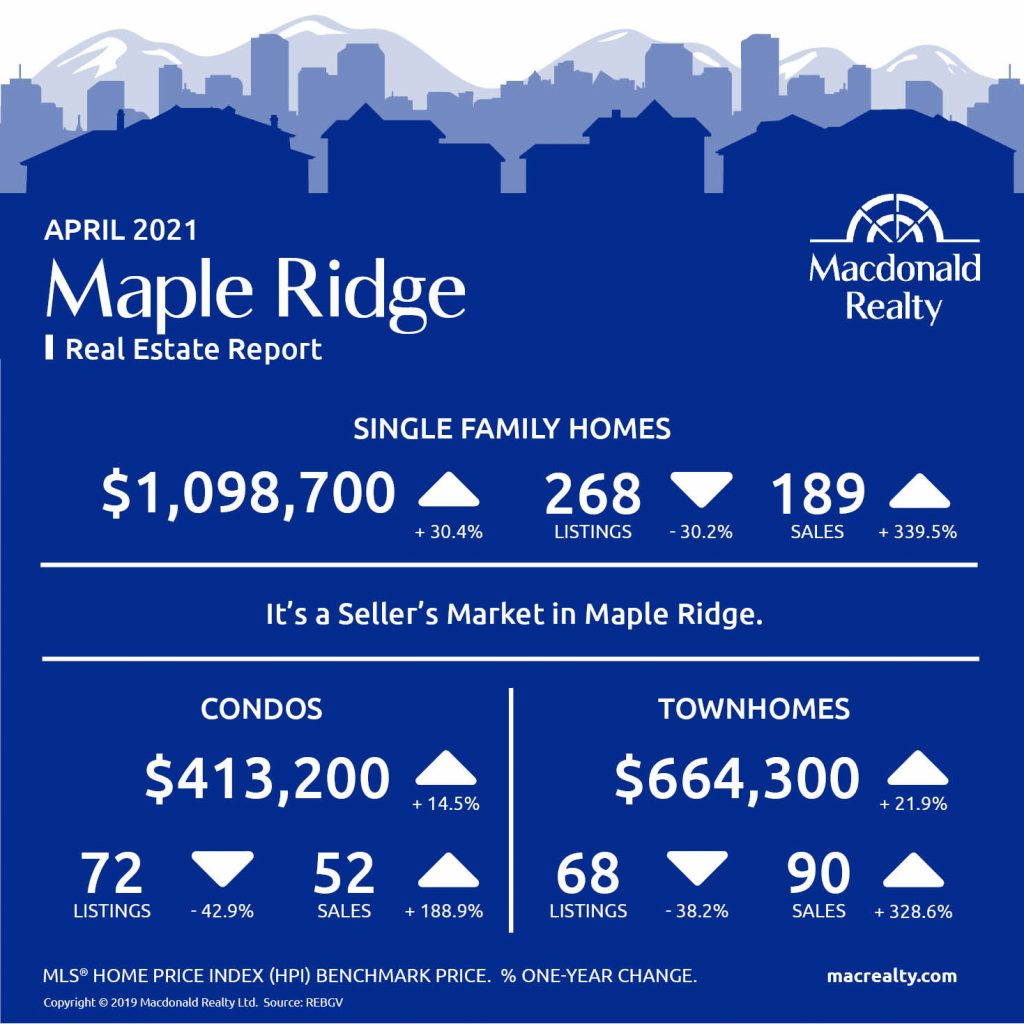
Maple Ridge
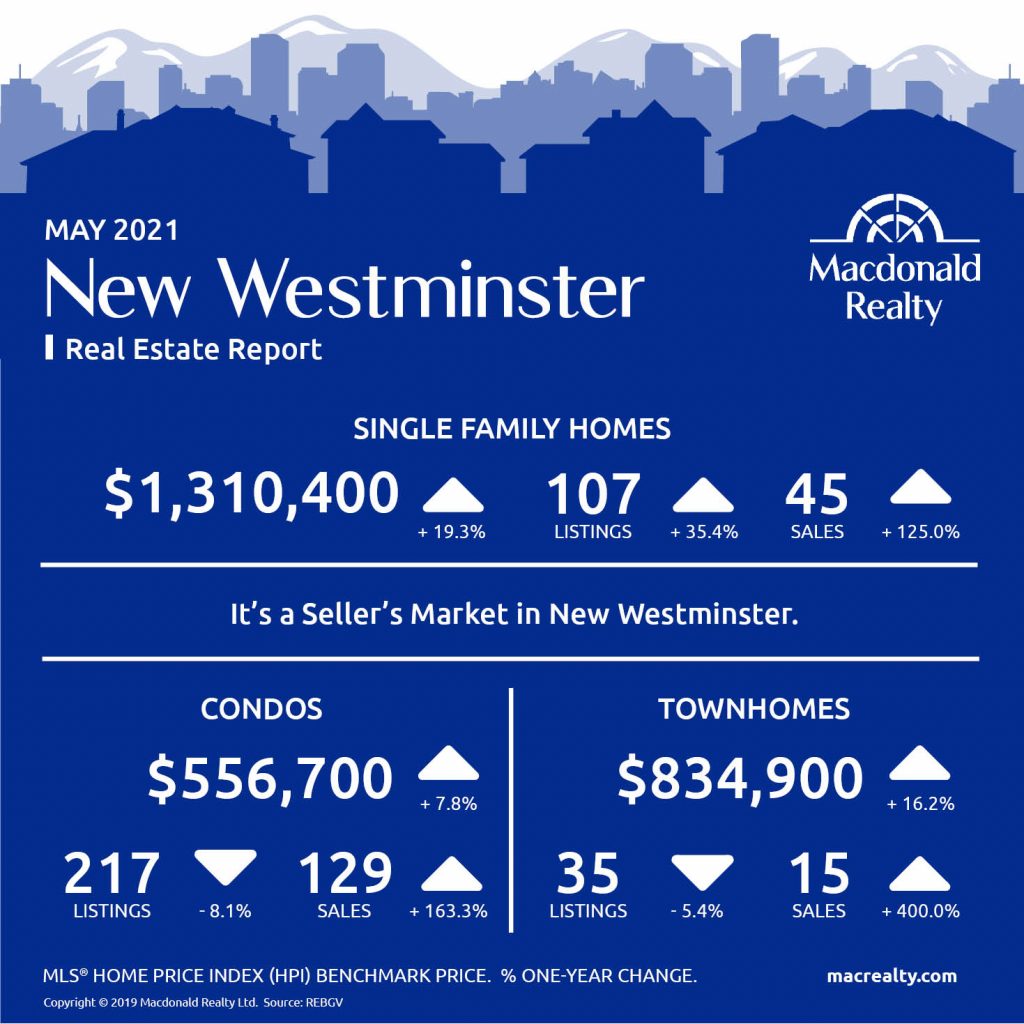
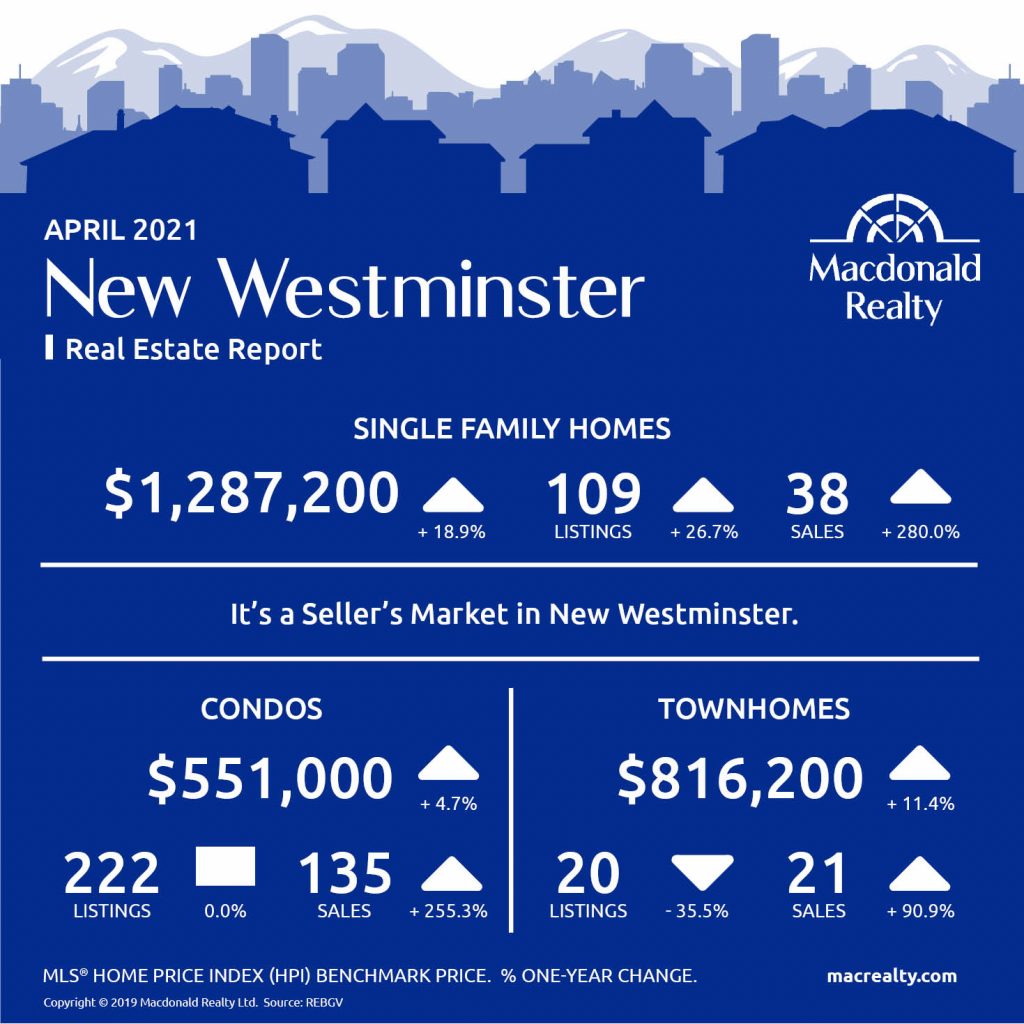
New Westminster
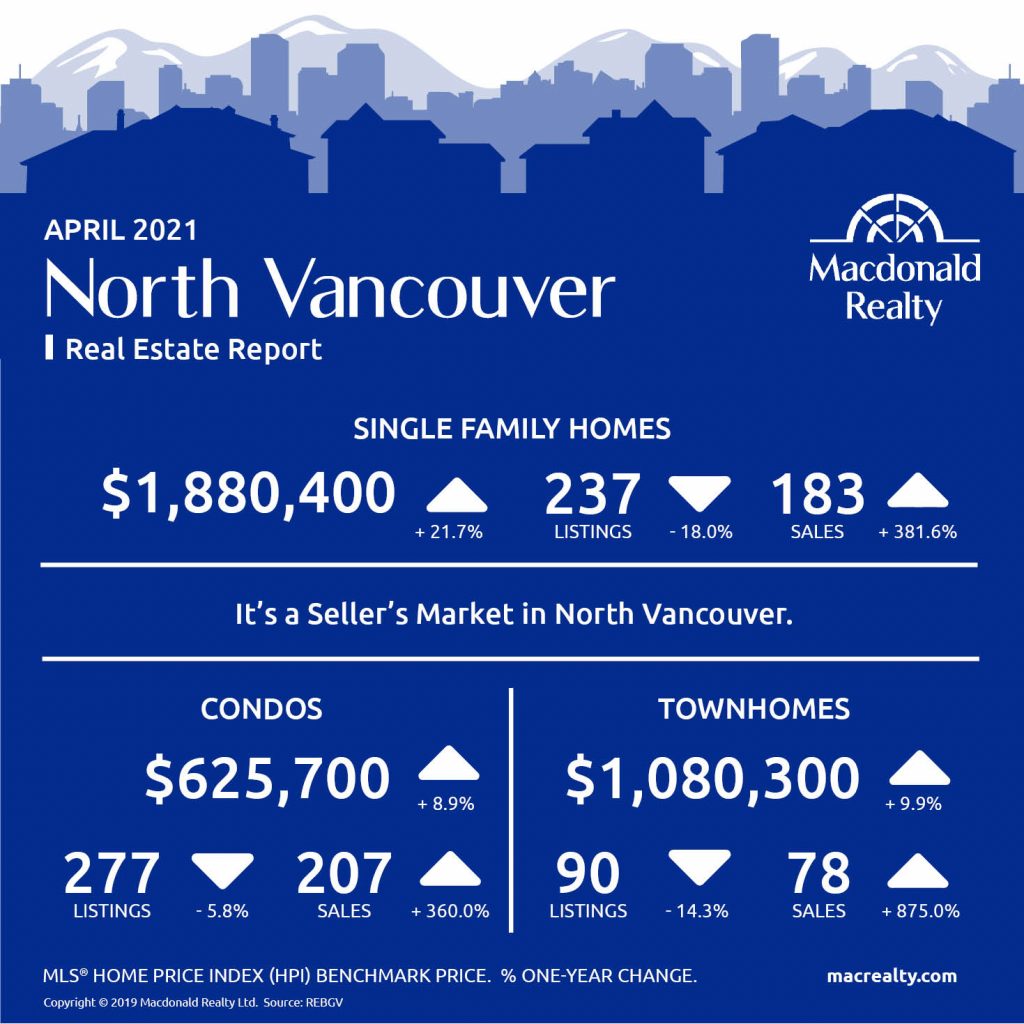
North Vancouver

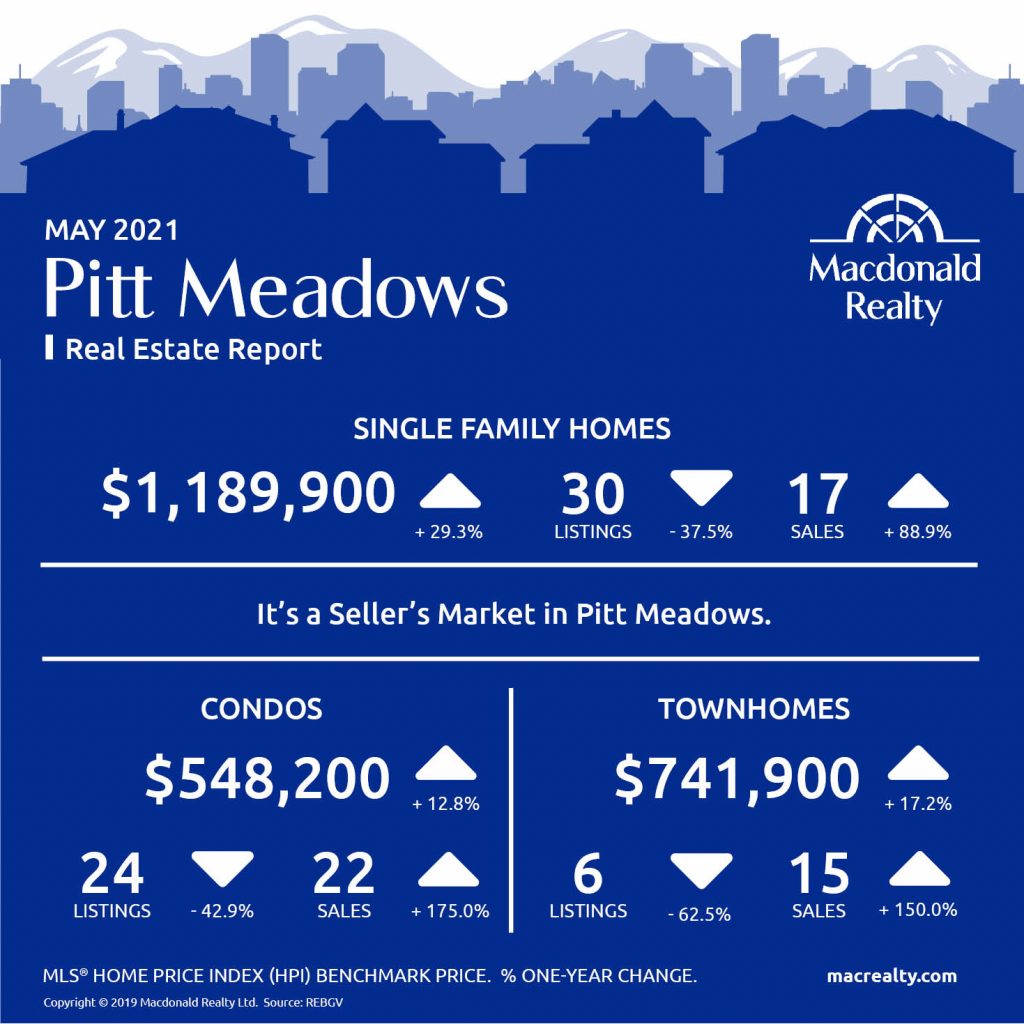
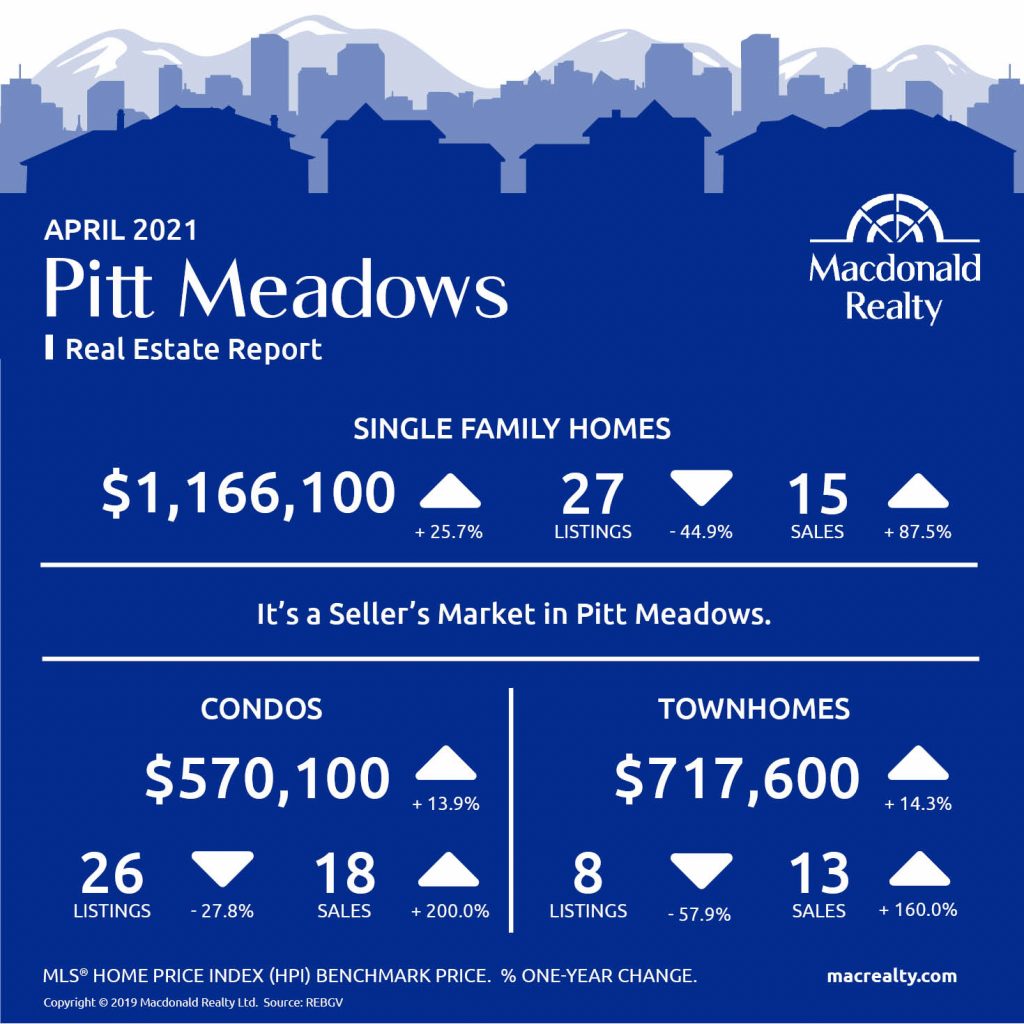
Pitt Meadows
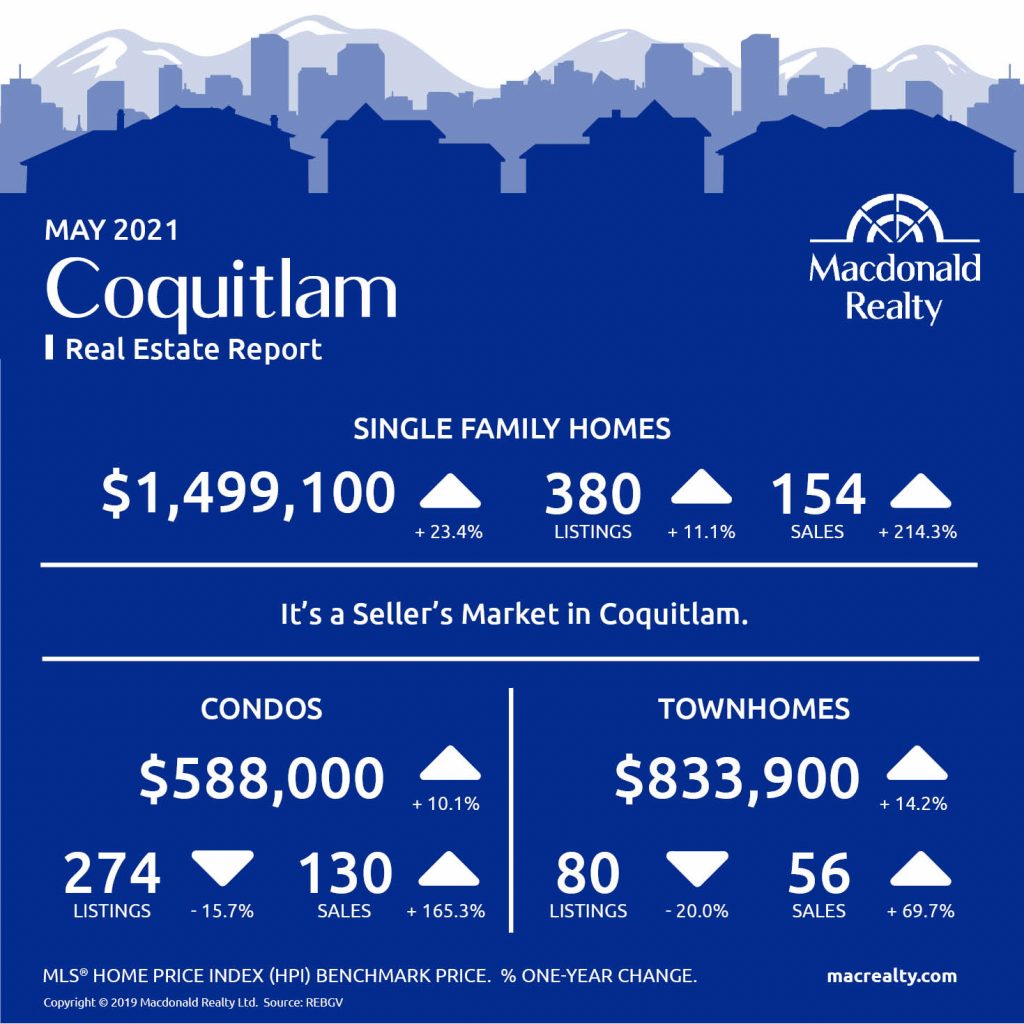
Coquitlam
Port Coquitlam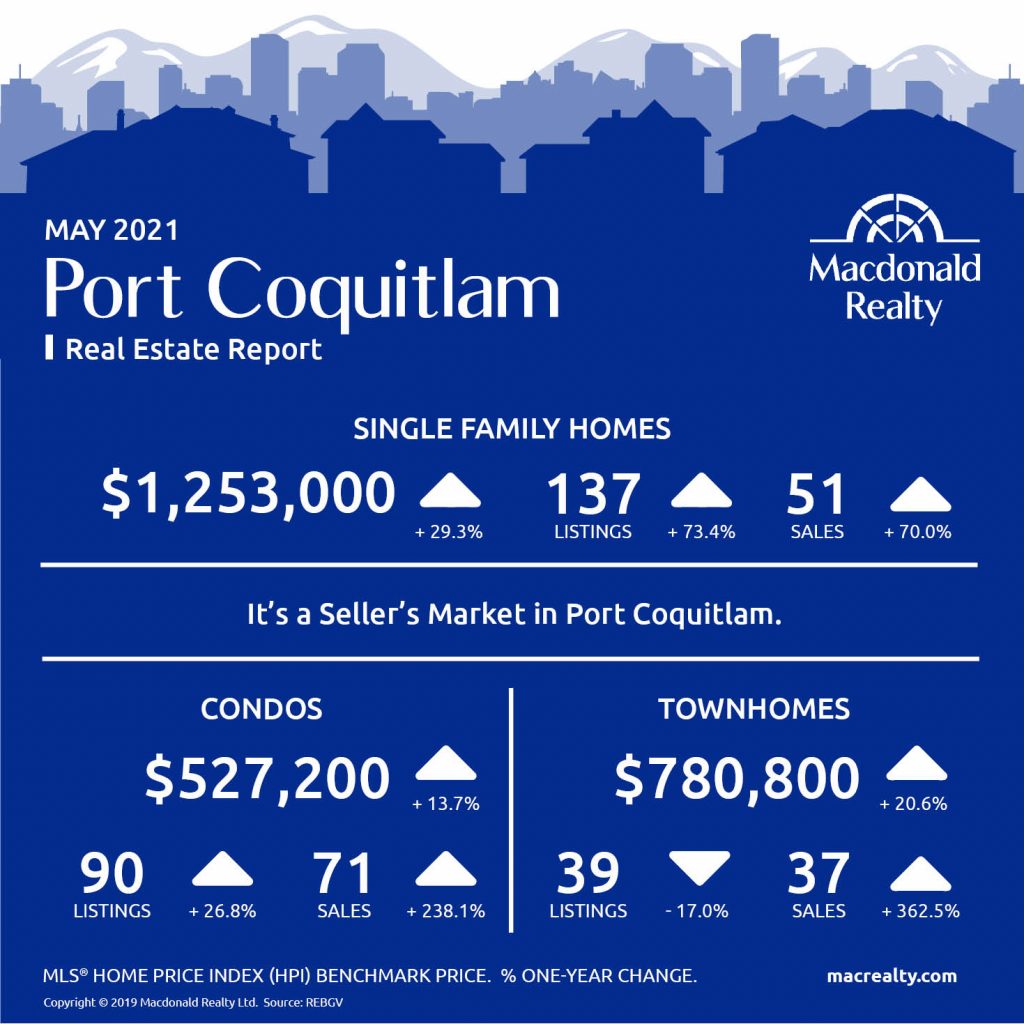
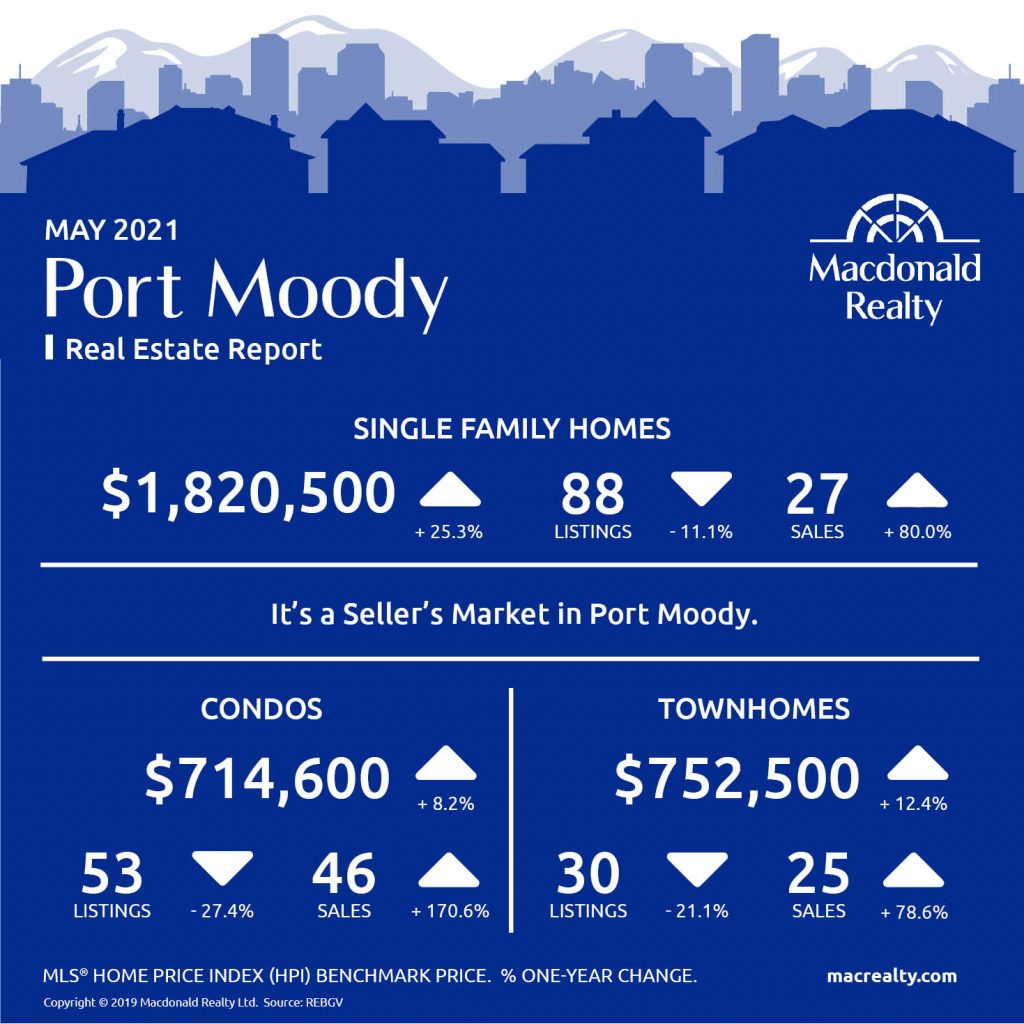
Port Moody
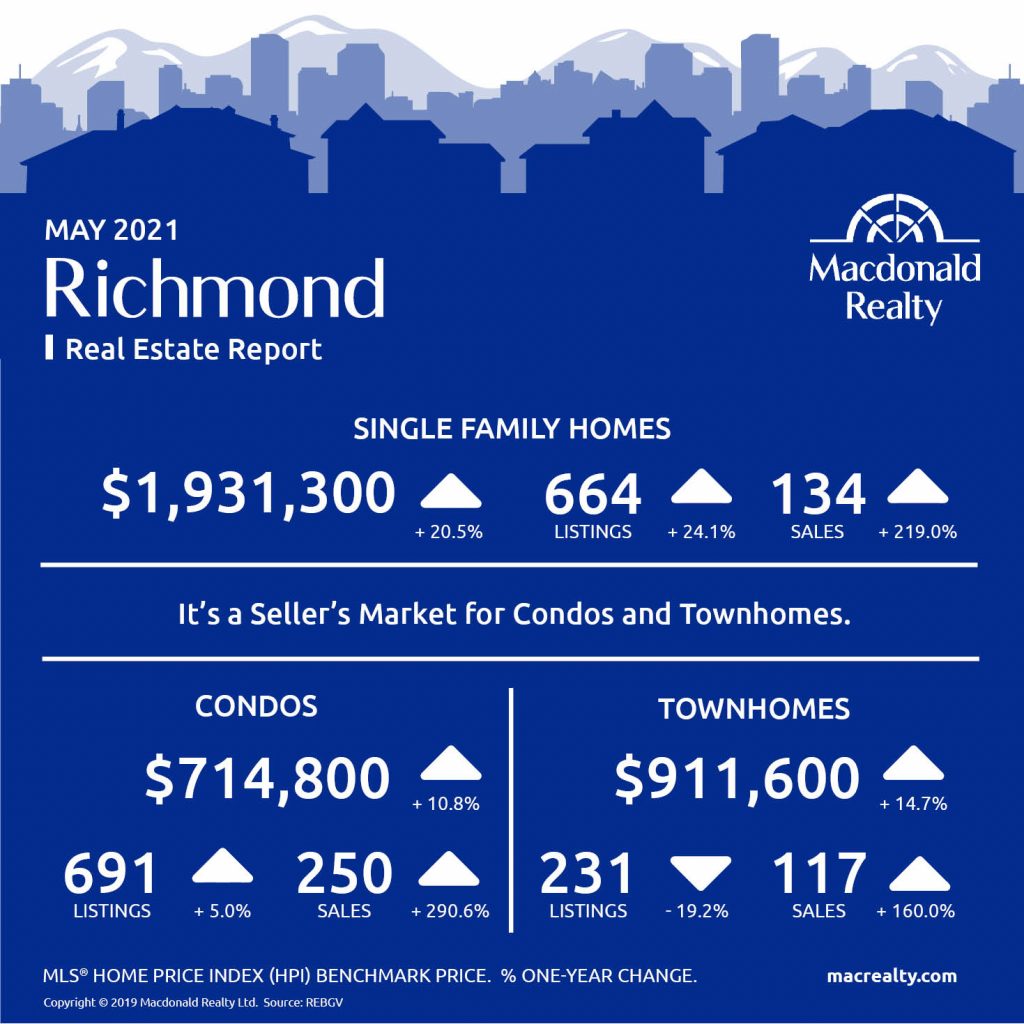
Richmond
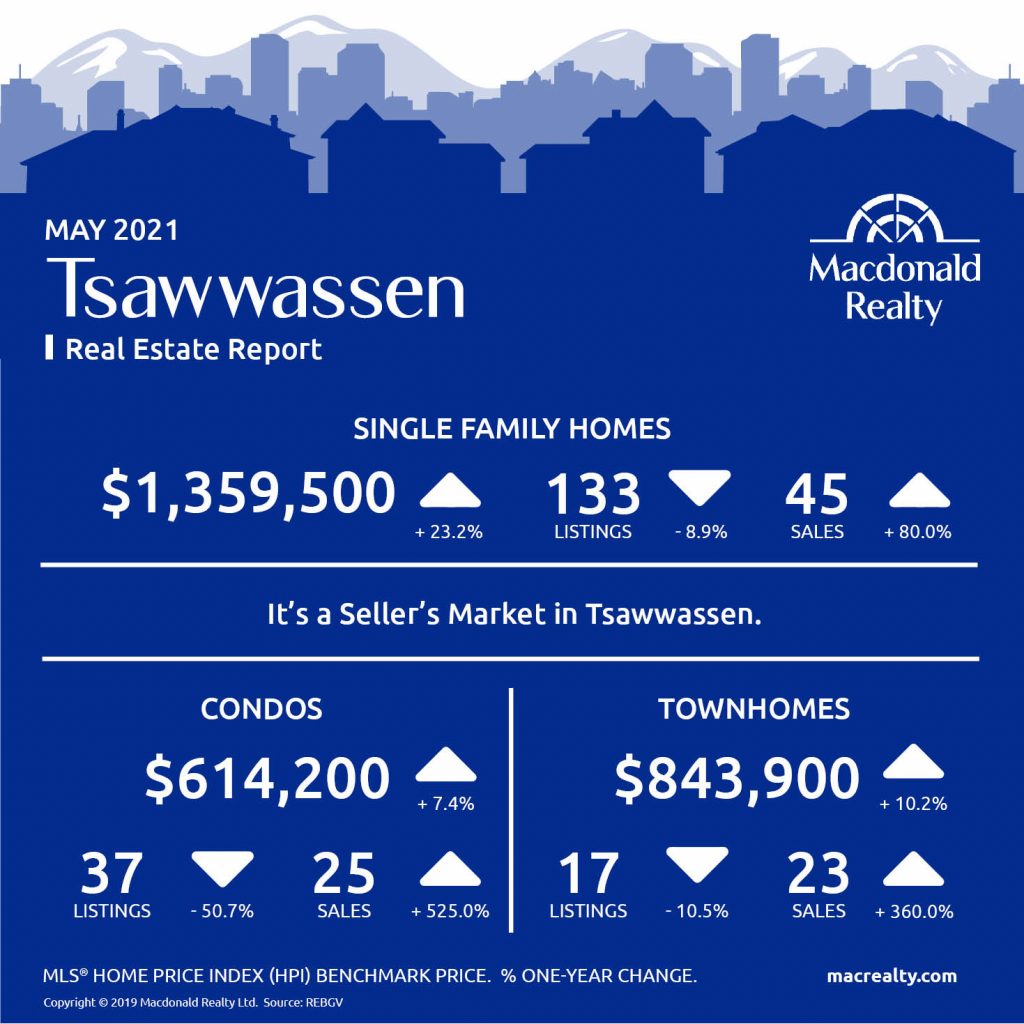
Tsawwassen
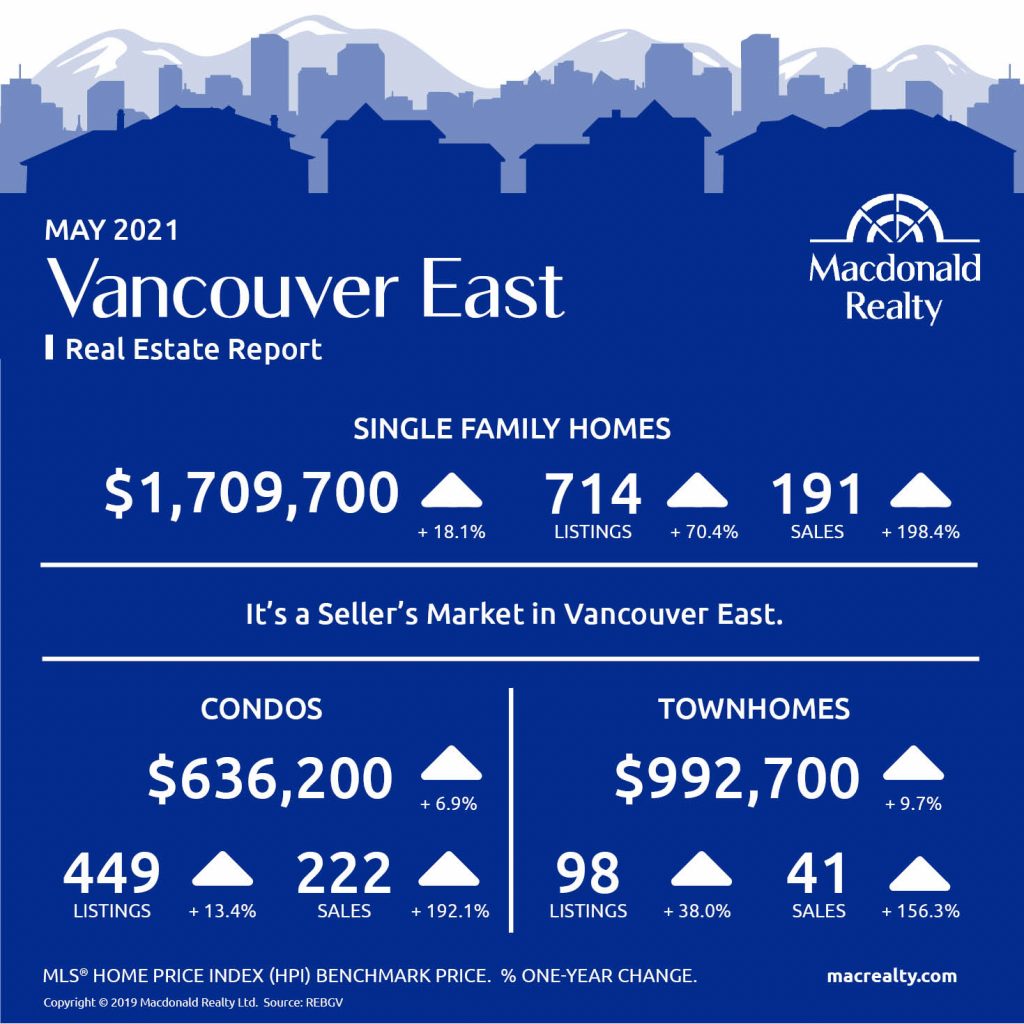
Vancouver East
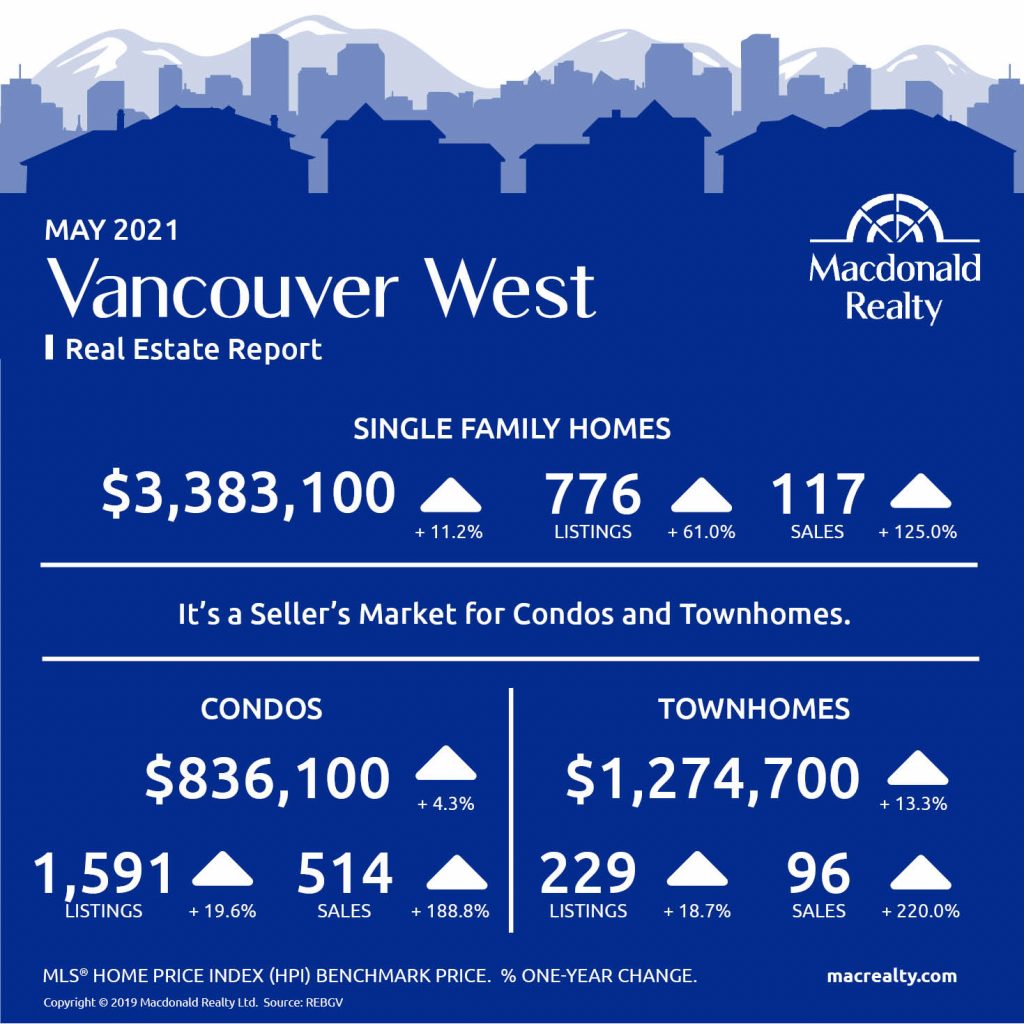
Vancouver West
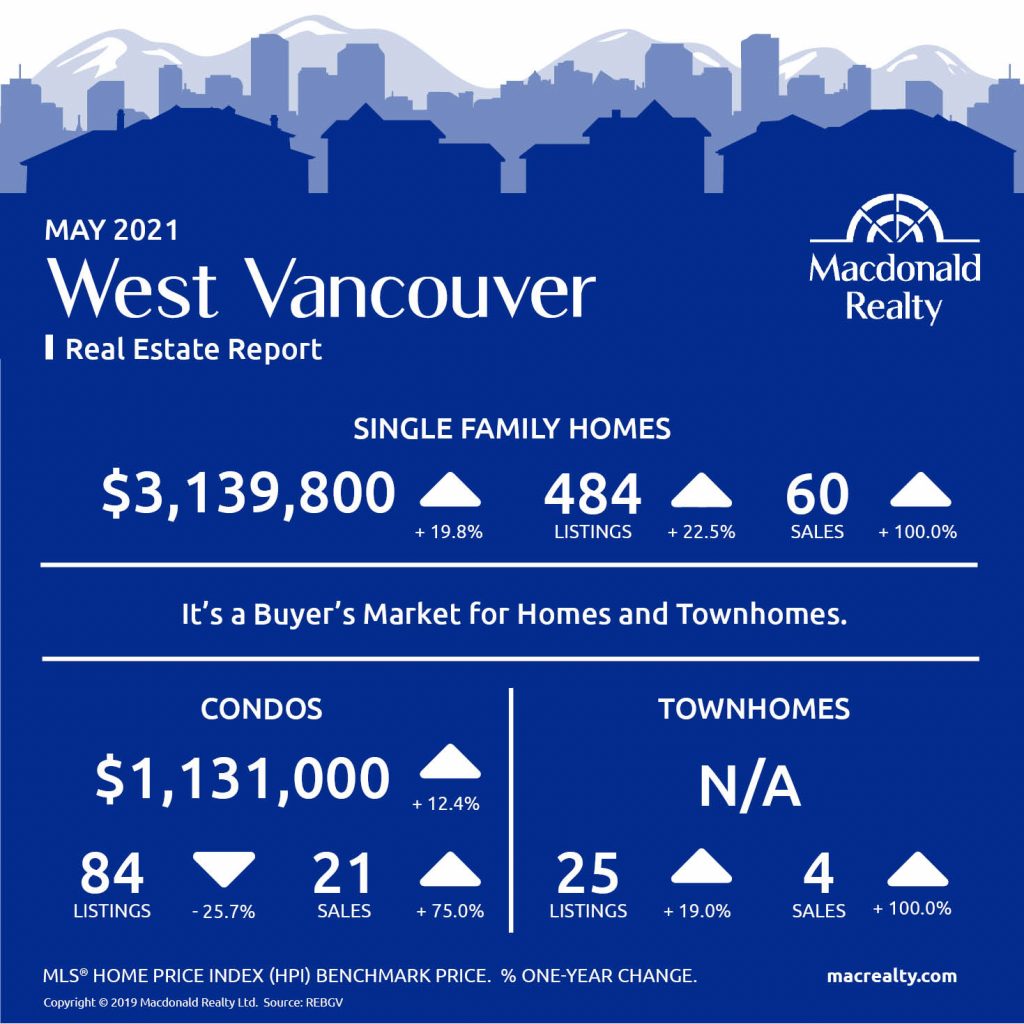
West Vancouver
Looking for more information about the real estate market in specific neighbourhoods in the Greater Vancouver?
Macdonald Realty has offices across the Greater Vancouver. Please email [email protected] or call 1-877-278-3888 to be matched with a REALTOR® working in your area.
MLS® Home Price Index (HPI) Benchmark Price
Average and median home prices are often misinterpreted, are affected by change in the mix of homes sold, and can swing dramatically from month to month (based on the types and prices of properties that sold in a given month). The MLS® HPI overcomes these shortcomings and uses the concept of a benchmark home, a notional home with common attributes of typical homes in a defined area. Visit www.housepriceindex.ca for more information.
This blog post is based on market data provided by the Real Estate Board of Greater Vancouver (REBGV) www.rebgv.org
by Macrealty Marketing Team | Jun 4, 2021 | Market Updates
Here are the latest real estate market statistics from Macdonald Realty on Greater Victoria, Parksville/Qualicum, and Nanaimo listings and sales in May 2021.
Find all the infographics related to the April Market Statistics by visiting the Facebook Album.
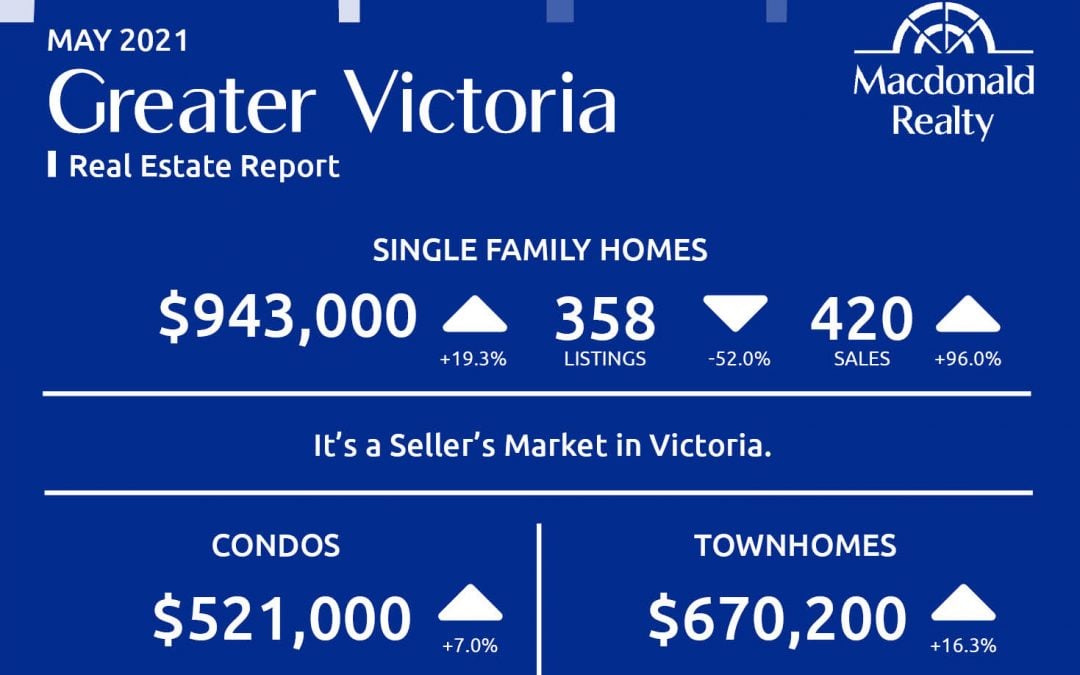
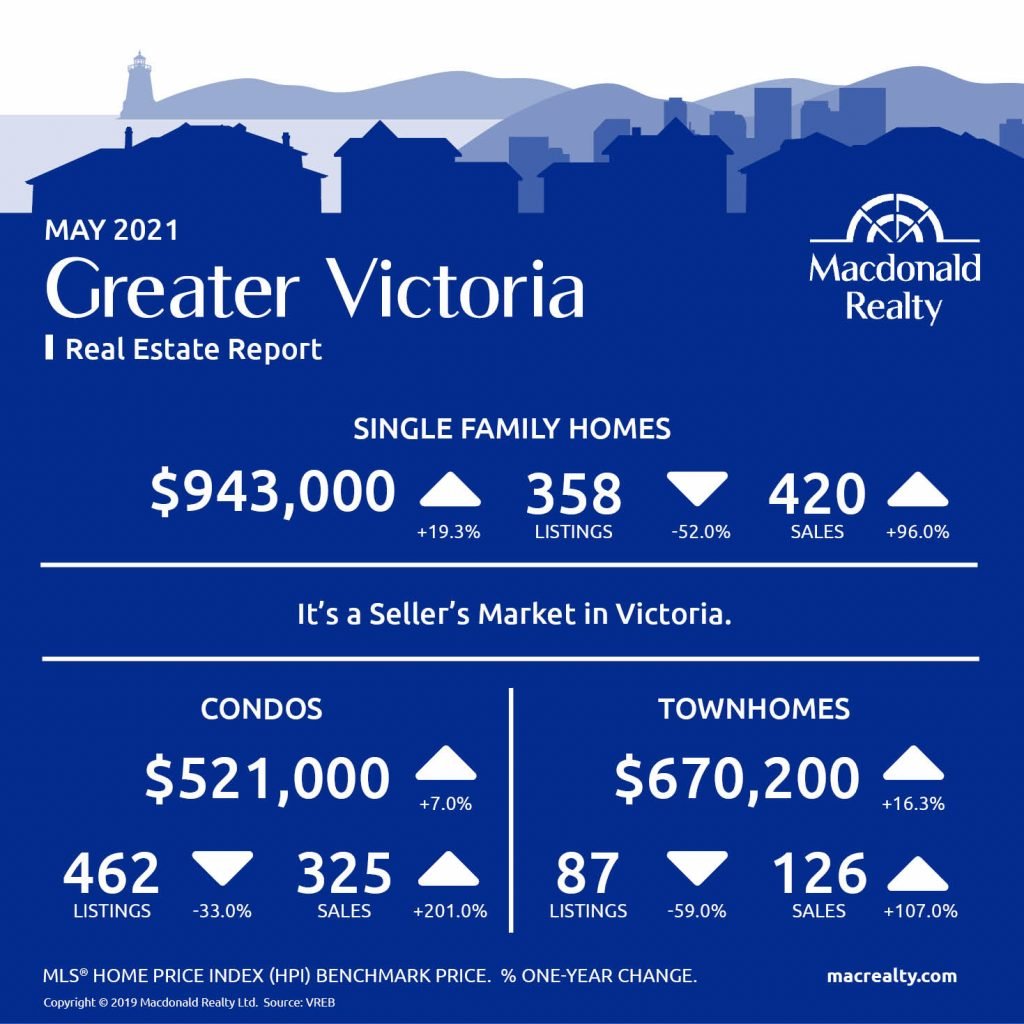
Greater Victoria
According to the Victoria Real Estate Board the Victoria market continued to show its strength through the month of May, with a near record-setting pace for sales and ongoing record low inventory levels. A total of 1,049 properties sold in the Victoria Real Estate Board region this May, 129.5 per cent more than the 457 properties sold in May 2020, but 6 per cent fewer than the previous month of April. Sales of condominiums were up 200.9 per cent from May 2020 with 325 units sold. 1.8 per cent fewer condominiums sold in May 2021 than in the previous month of April. Sales of single family homes were up 111.4 per cent from May 2020 with 537 sold. 4.8 per cent fewer single-family homes sold in May 2021 than in the previous month of April.
“Victoria is an amazing place to live and we will continue to see demand for property here,” said Victoria Real Estate Board President David Langlois. “In the future we need to support the creation of a housing market that can respond to demand and population growth and evolve with community needs. Adding inventory to the Greater Victoria market should be the focus of every municipal council across the region.”
As released by the board “there were 1,450 active listings for sale on the Victoria Real Estate Board Multiple Listing Service® at the end of May 2021, 43 per cent fewer properties than the total available at the end of May 2020 and just 4 properties fewer than the 1,454 active listings for sale at the end of April 2021.”
The Multiple Listing Service® Home Price Index benchmark value for a single family home in the Victoria Core in May 2020 was $855,900. The benchmark value for the same home in May 2021 increased by 17 per cent to $1,036,100, a 3.9 per cent increase from the previous month of April. The MLS® HPI benchmark value for a condominium in the Victoria Core in May 2020 was $500,000, while the benchmark value for the same condominium in May 2021 was $526,000, a 5.2 per cent increase.
“Recently the City of Victoria moved to fast-track non-profit developments, which is an exciting step in the right direction,” added Langlois. “But continued attention needs to be paid on housing of all types. By supporting an increase in urban density, we can ensure attainable housing, address missing middle family housing, increase tax revenues for community amenities and protect green space by slowing sprawl. If you are concerned about attainable housing and the future of homes in Greater Victoria, consider supporting the next housing development proposal in your neighbourhood.”
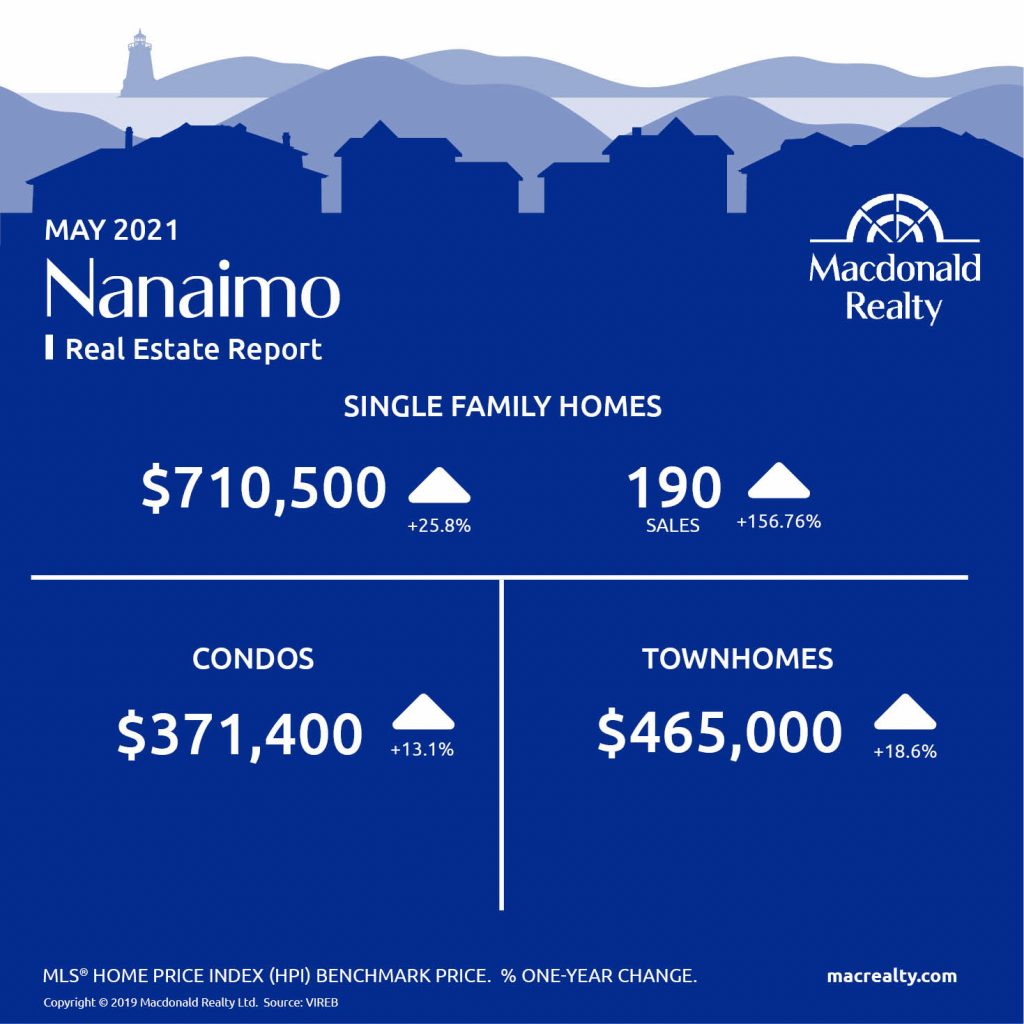
Nanaimo
Parksville / Qualicum

Looking for more information about the real estate market in specific neighbourhoods in Victoria, Parksville, Nanaimo, Vancouver Island and the Gulf Islands?
Macdonald Realty has offices in downtown Victoria, Sidney, Parksville and Salt Spring Island. Please email [email protected] or call 1-877-278-3888 to be matched with a REALTOR® working in your area.
MLS® Home Price Index (HPI) Benchmark Price
Average and median home prices are often misinterpreted, are affected by change in the mix of homes sold, and can swing dramatically from month to month (based on the types and prices of properties that sold in a given month). The MLS® HPI overcomes these shortcomings and uses the concept of a benchmark home, a notional home with common attributes of typical homes in a defined area. Visit www.housepriceindex.ca for more information.
This blog post is based on market data provided by the Victoria Real Estate Board (VREB) www.vreb.org and the Vancouver Island Real Estate Board (VIREB) www.vireb.com. Market data from the VIREB includes listings and sales in Campbell River, Comox Valley, Cowichan Valley Nanaimo, Parksville/Qualicum, Port Alberni/West, North Island, and the Islands.
by Macrealty Marketing Team | Jun 4, 2021 | Market Updates
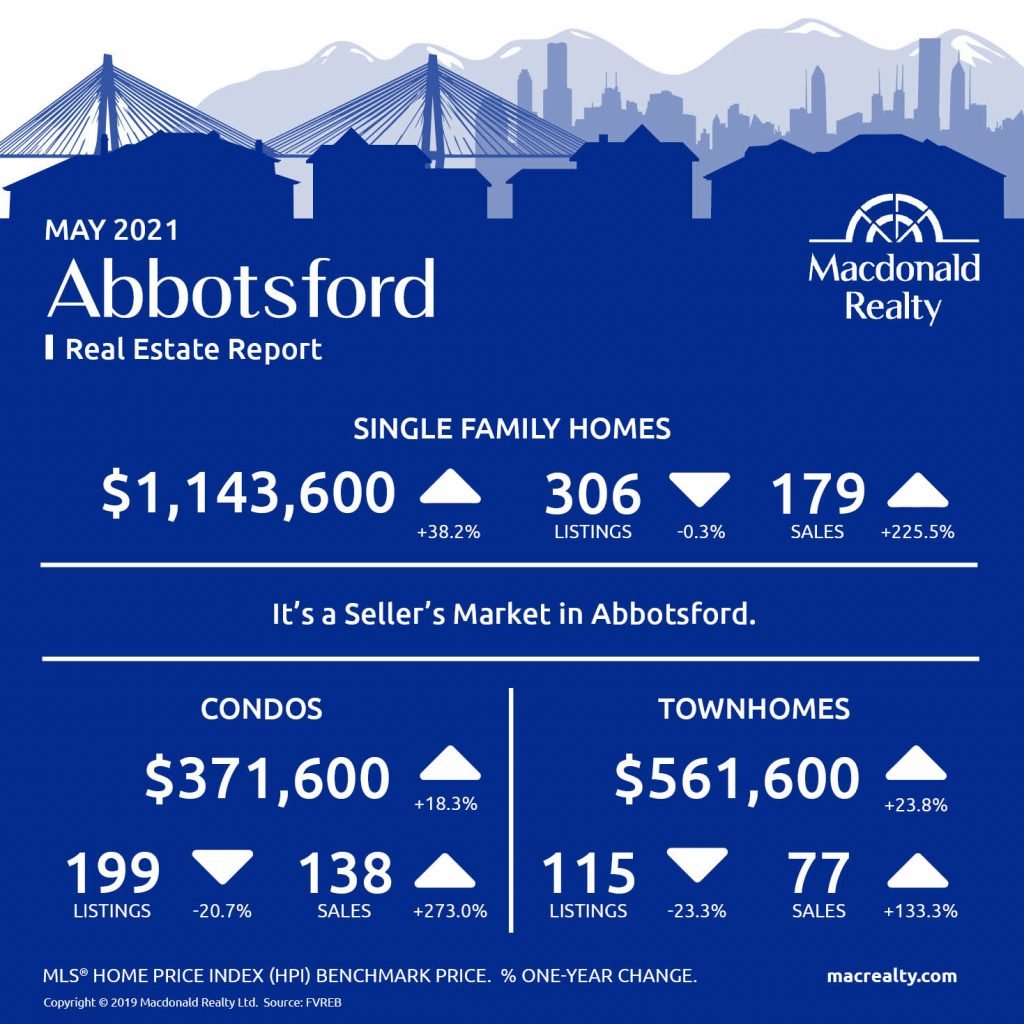
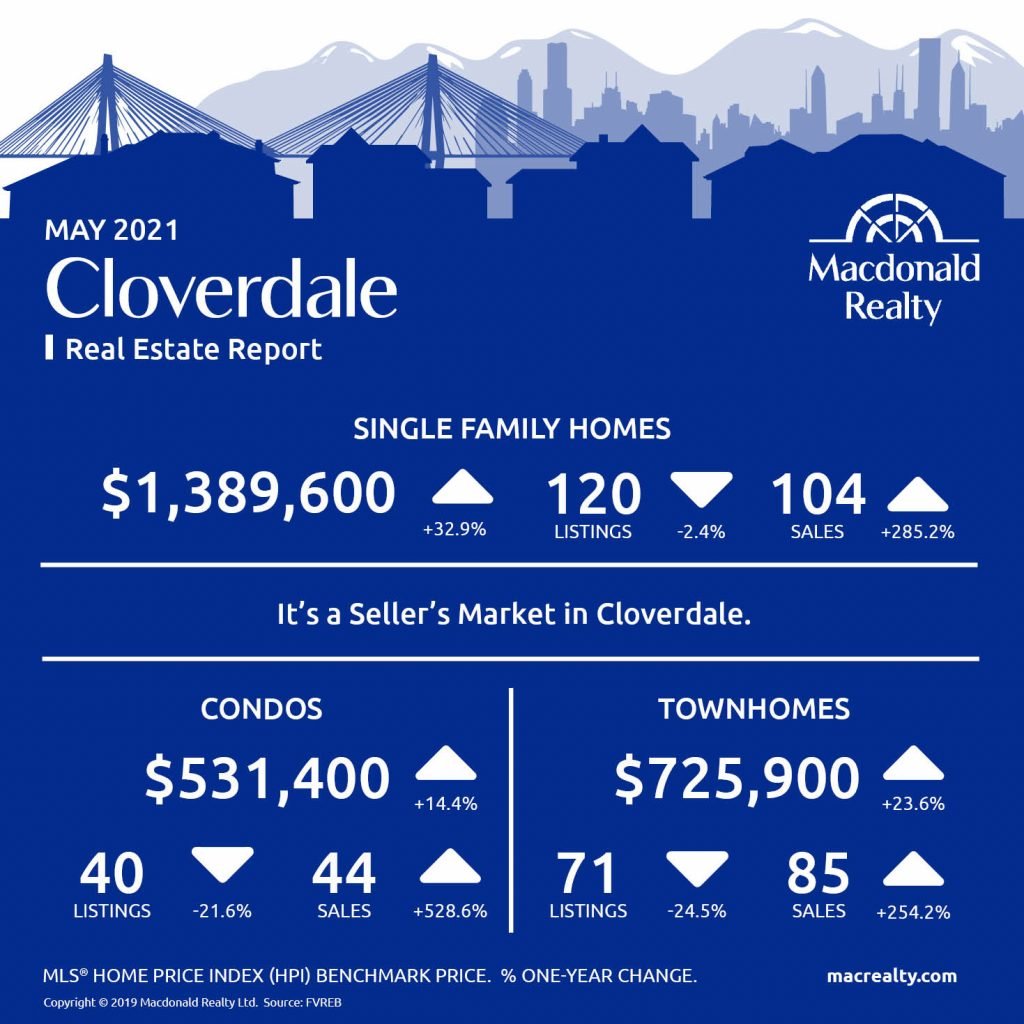
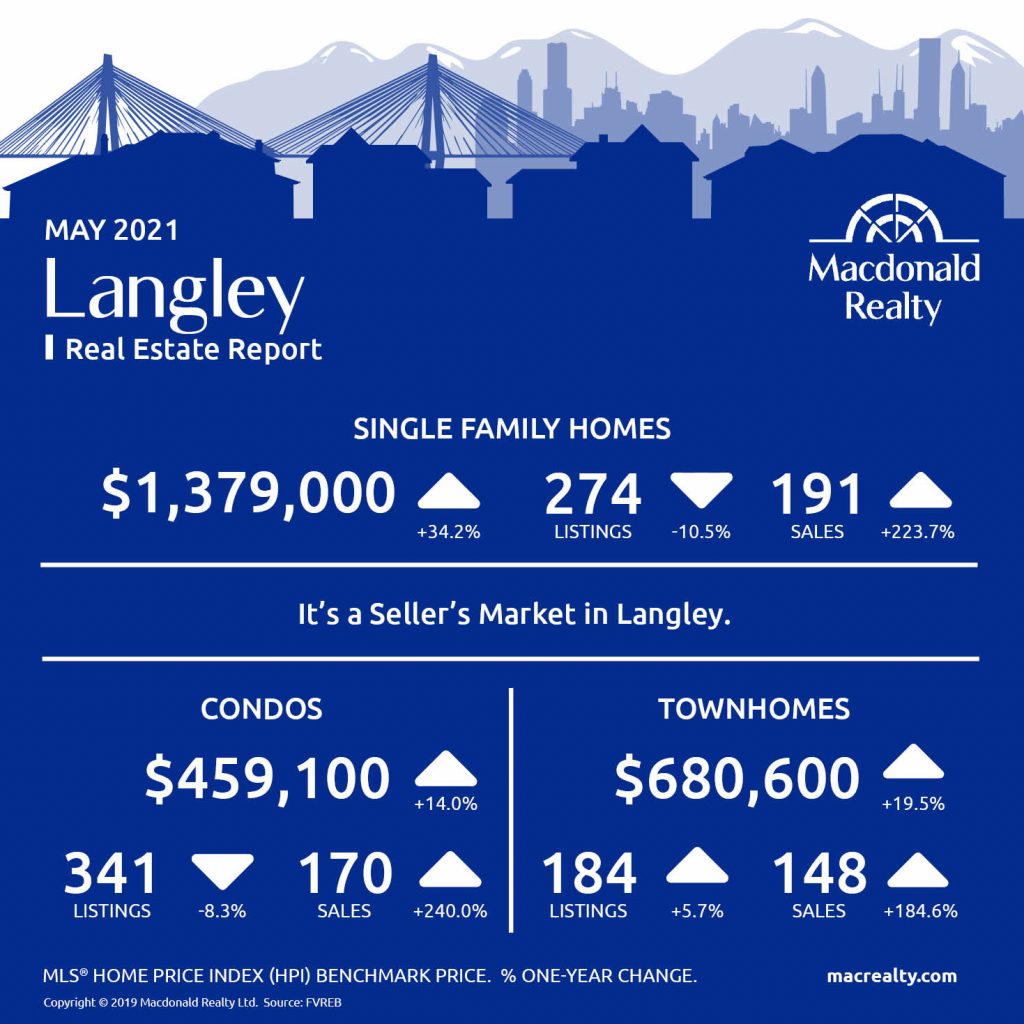
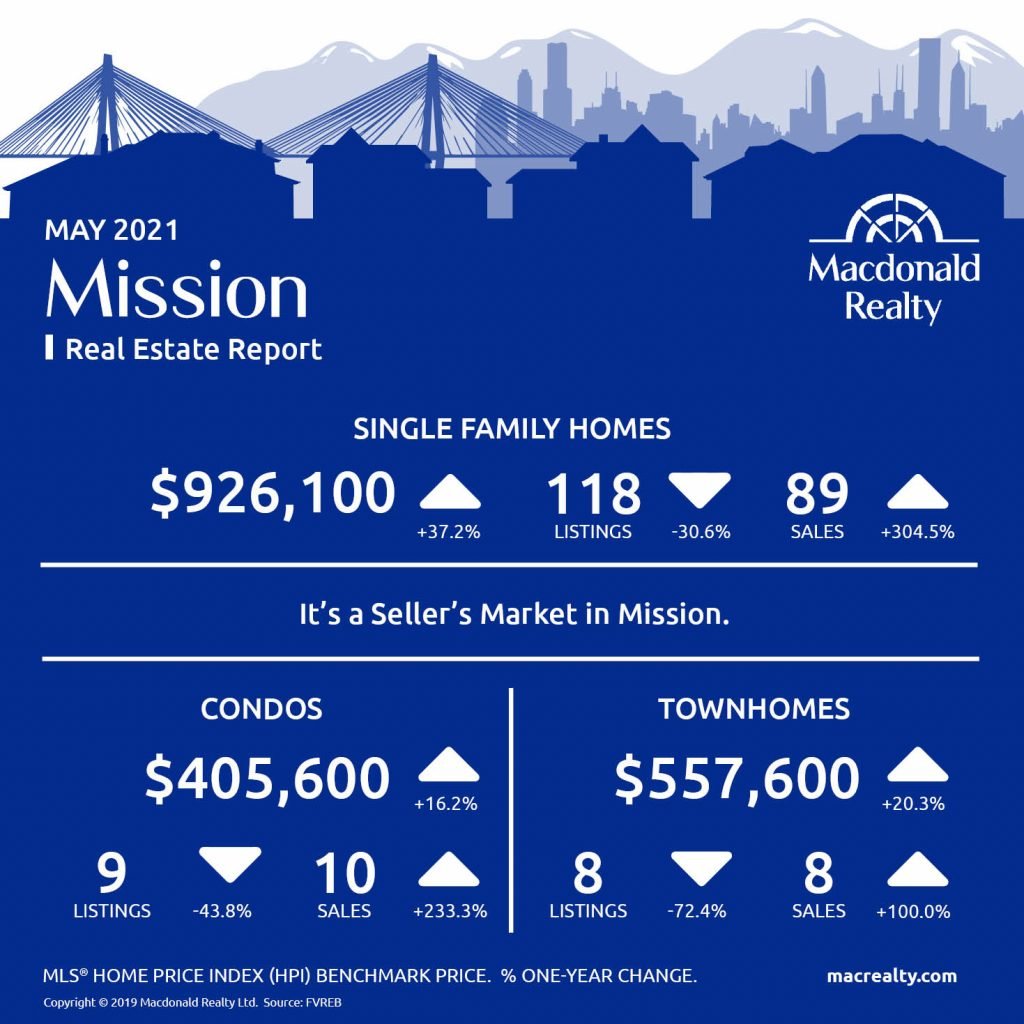
According to the Fraser Valley Real Estate Board “near record‐breaking new listings in the Fraser Valley not enough to match insatiable buyer demand”.
According to the board, Fraser Valley’s extraordinary pandemic real estate market continued to break sales records – for the ninth consecutive month – while at the same time, reaching near‐historic levels of new listings in May.
In May, the Fraser Valley Real Estate Board (FVREB) processed 2,951 sales on its Multiple Listing Service® (MLS®), an increase of 267 per cent compared to May 2020 and a 2 per cent decrease compared to April. (Note that last year, the market was significantly restricted due to the lockdown.) The previous record high for sales in May for the Fraser Valley region was 2,911 in 2016.
Larry Anderson, President of the Board, said “Demand hasn’t changed. What’s changed is supply. In the last three months, buyers have 40 per cent more inventory to look at in the Fraser Valley and it’s allowed them to take back a little control. “We’re seeing resistance to multiple offers and buyers adjusting their offers, or even waiting, because they have more selection. We’re a long way from a balanced market, but supply is helping us to head in the right direction.”
“In general, we’re seeing fewer multiple offers, fewer subject‐free offers, and homes over‐priced are starting to sit longer. These are positive signs that the market is responding to near‐record levels of new inventory.”
Find all the infographics related to the April Market Statistics by visiting the Facebook Album.
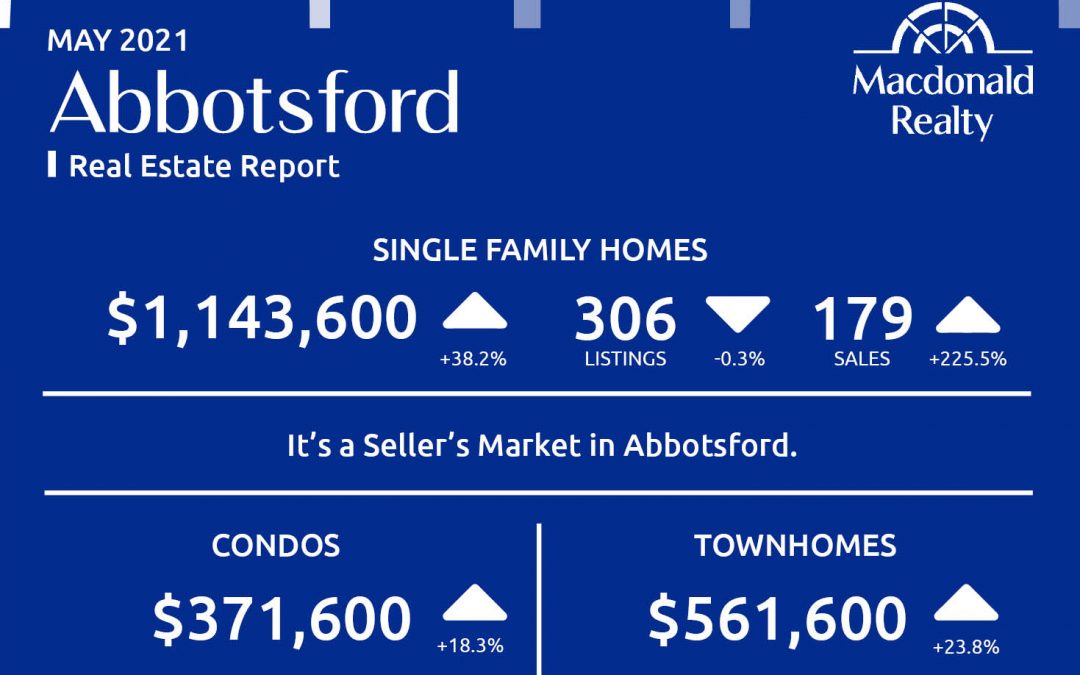
Abbotsford
Cloverdale
Langley
Mission
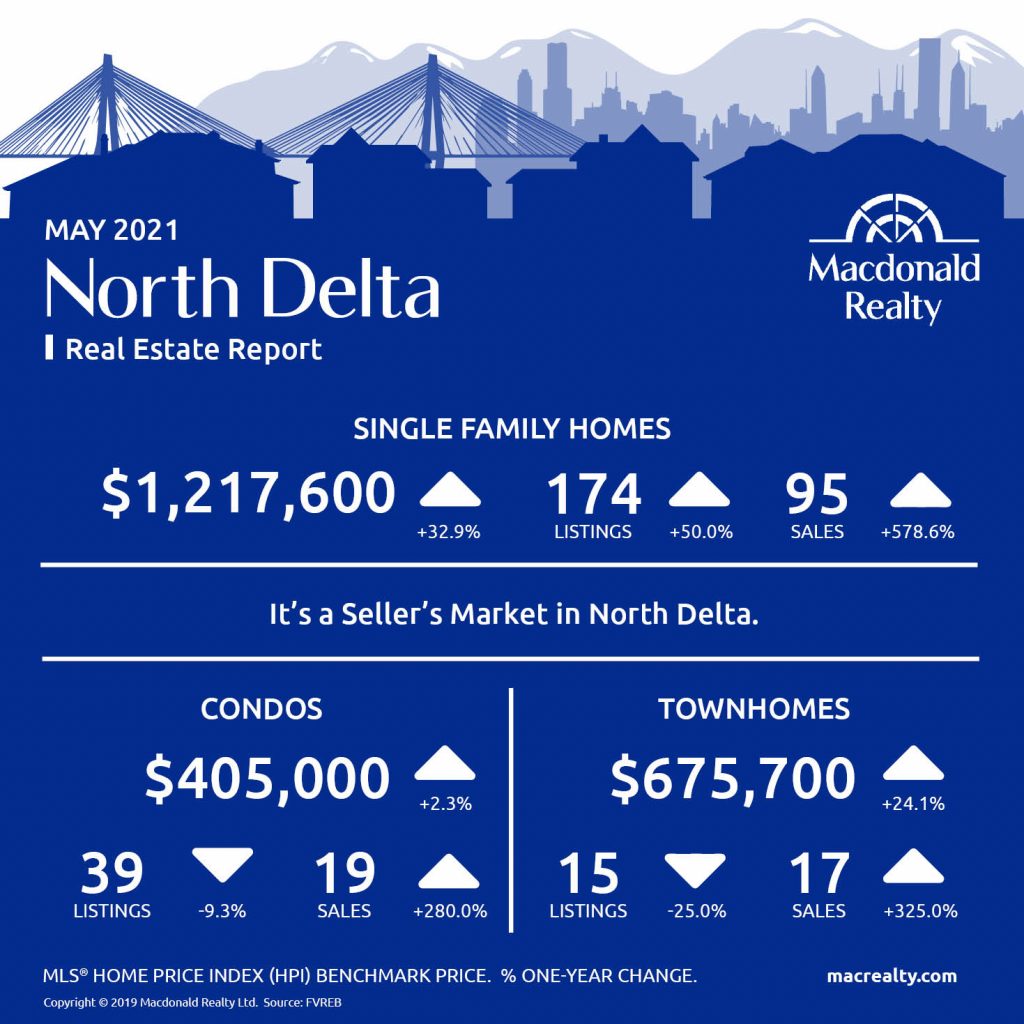
North Delta
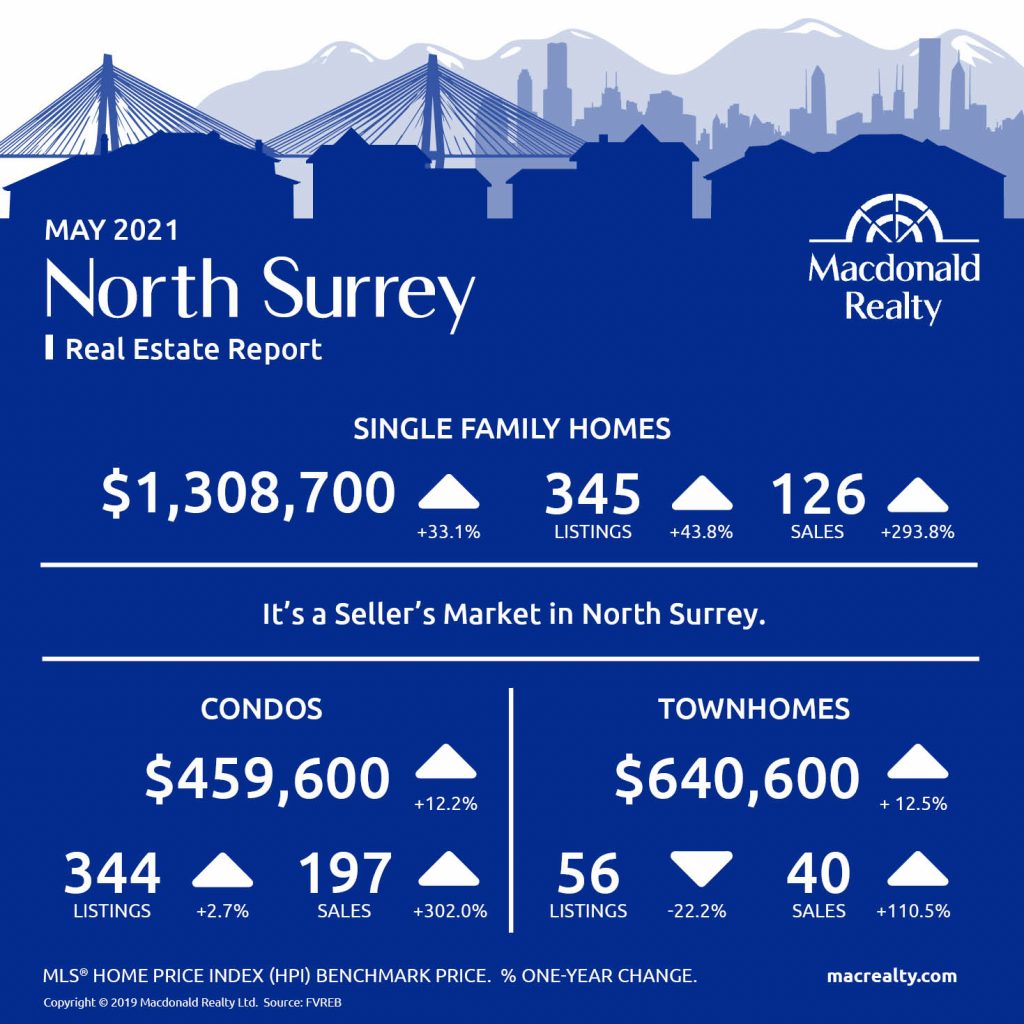
North Surrey
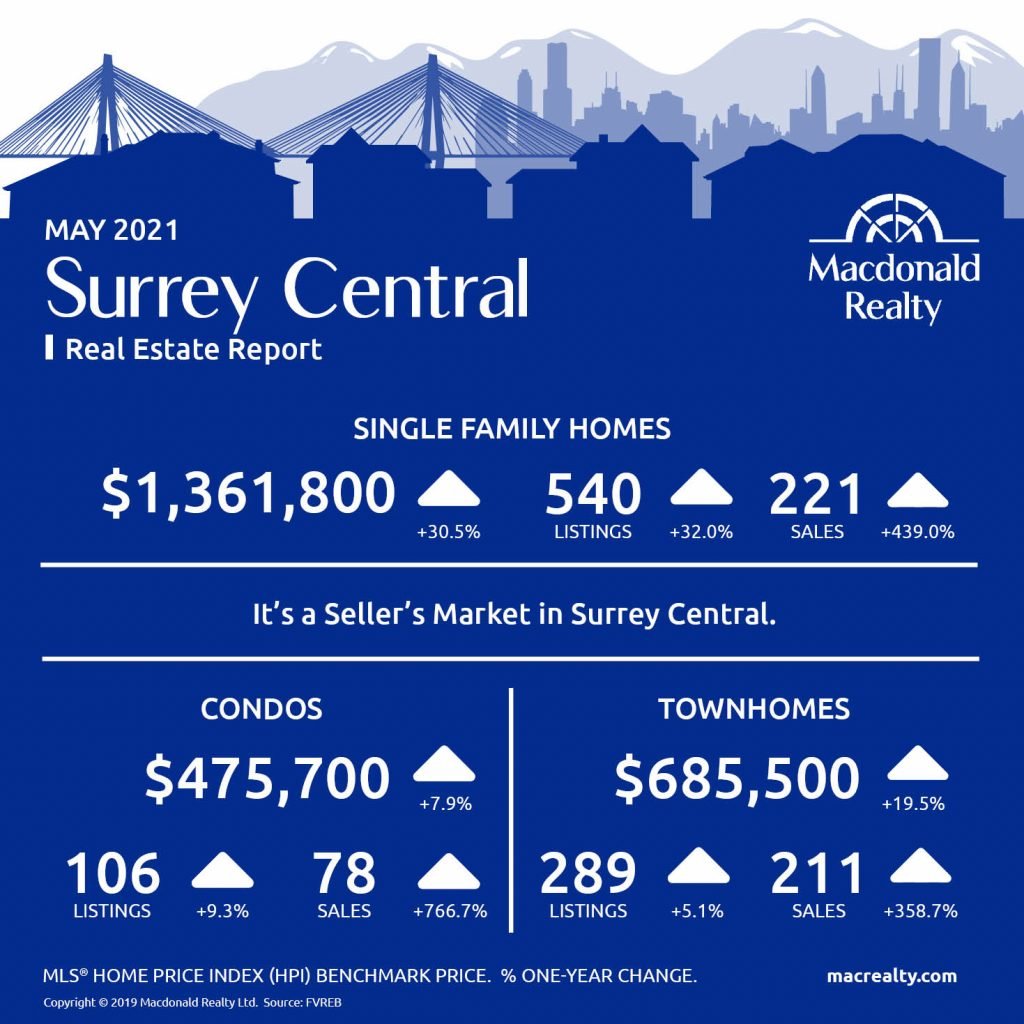
Surrey Central
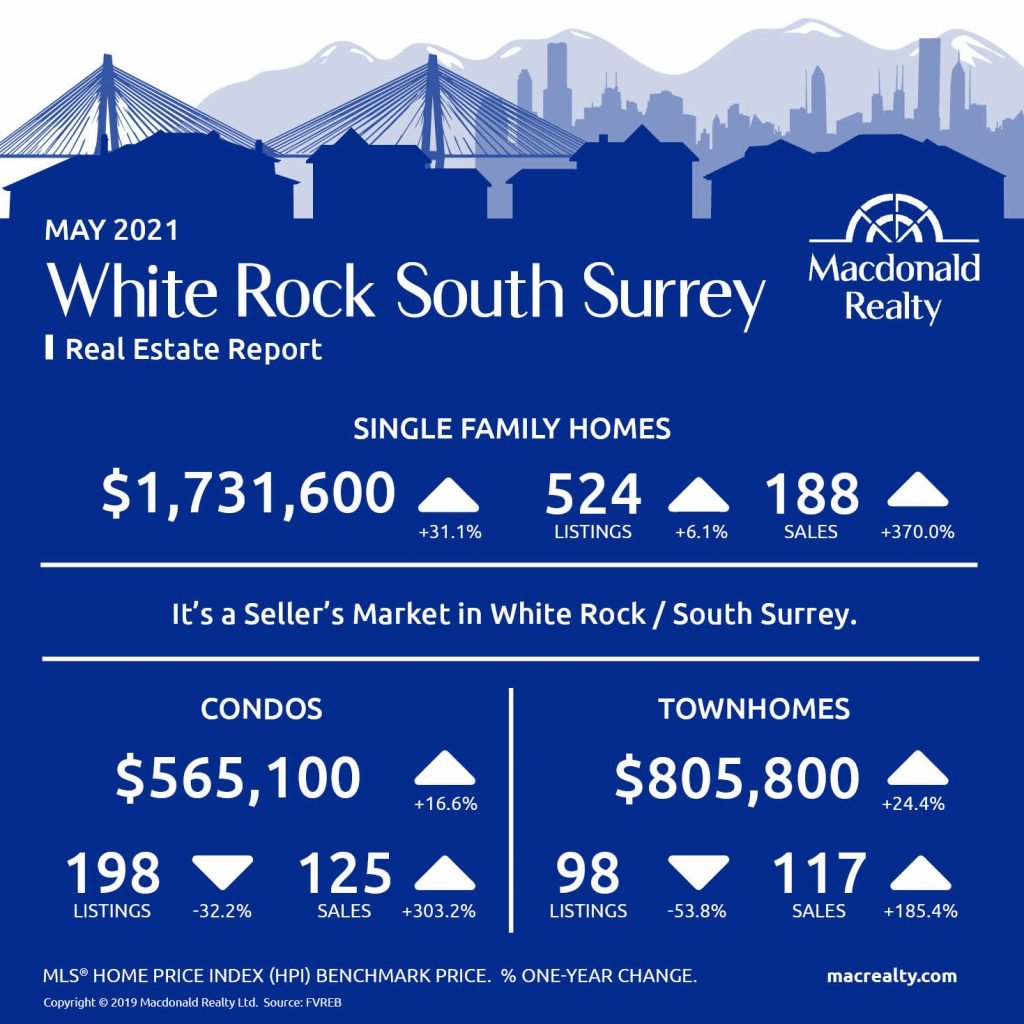
White Rock / South Surrey
Looking for more information about the real estate market in specific neighbourhoods in Surrey, Langley and Fraser Valley?
Macdonald Realty has offices in North Delta, White Rock/South Surrey, and Langley. Please email [email protected] or call 1-877-278-3888 to be matched with a REALTOR® working in your area.
MLS® Home Price Index (HPI) Benchmark Price
Average and median home prices are often misinterpreted, are affected by change in the mix of homes sold, and can swing dramatically from month to month (based on the types and prices of properties that sold in a given month). The MLS® HPI overcomes these shortcomings and uses the concept of a benchmark home, a notional home with common attributes of typical homes in a defined area. Visit www.housepriceindex.ca for more information.
This blog post is based on market data provided by the Fraser Valley Real Estate Board (FVREB) www.fvreb.bc.ca
by Macrealty Marketing Team | May 6, 2021 | Market Updates
Here are the latest real estate market statistics from Macdonald Realty on the Greater Vancouver listings and sales in April 2021.
Find all the infographics by visiting the Facebook Album.
According to The Real Estate Board of Greater Vancouver (REBGV) “home sellers have become increasingly active in Metro Vancouver’s* housing market this spring in response to heightened demand and rising home values that have materialized during the pandemic.
The Board reports that residential home sales in the region totalled 4,908 in April 2021, a 342.6% increase from the 1,109 sales recorded in April 2020, and a 14% decrease from the 5,708 homes sold in March 2021.
“Last month’s sales were 56.2% above the 10-year April sales average and are the highest total on record for the month.” – said the REBGV.
“Our housing market has changed considerably from one year ago when COVID-19 concerns brought activity to a near standstill,” Keith Stewart, REBGV’s economist said. “This was followed by a well-documented spike in home buyer demand across the region. So far this spring, we’ve seen a corresponding supply response from home sellers.”
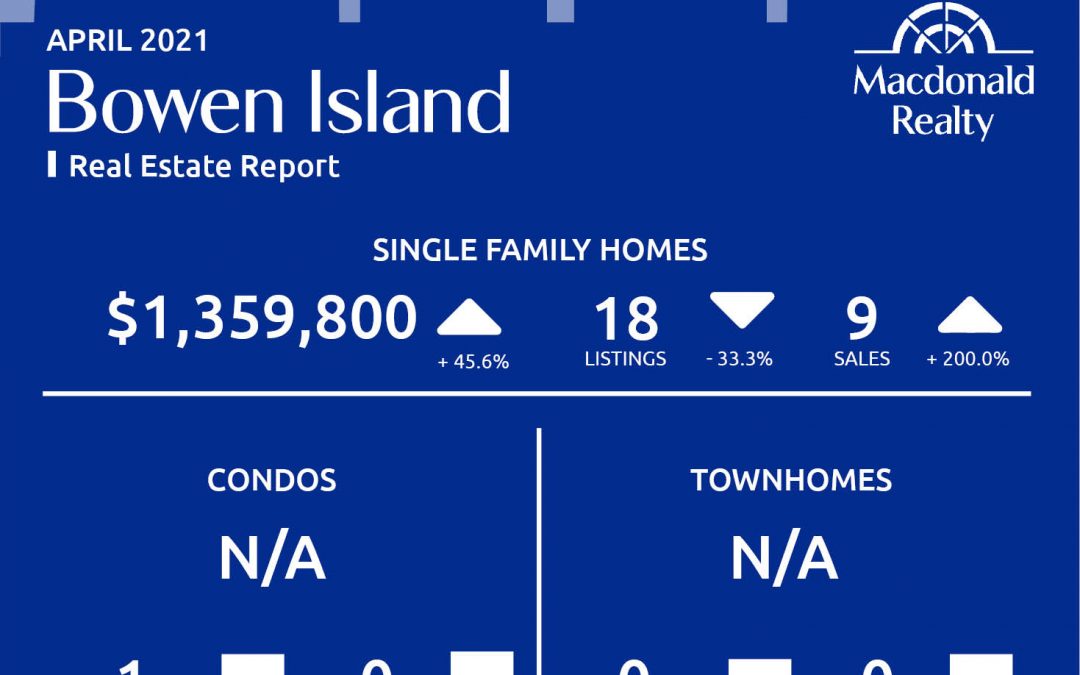
Bowen Island

Burnaby East

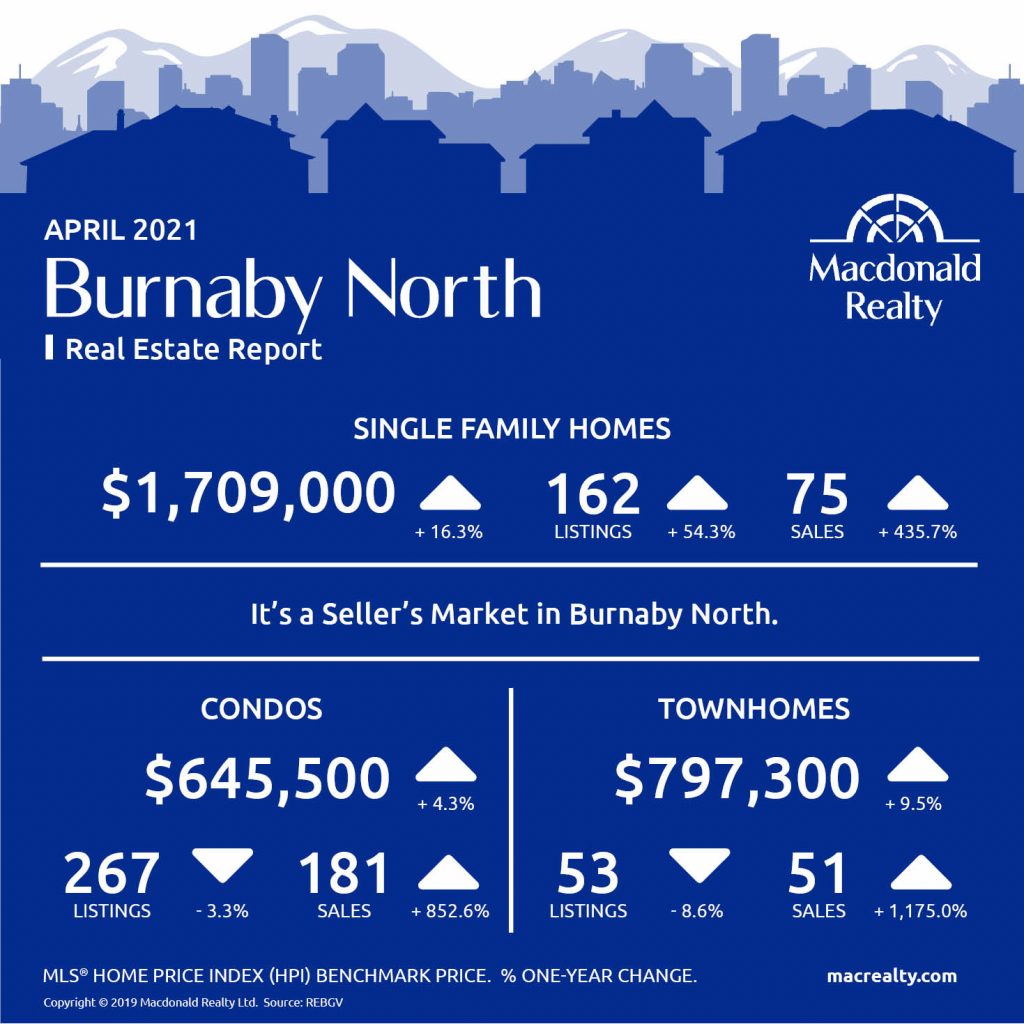
Burnaby North
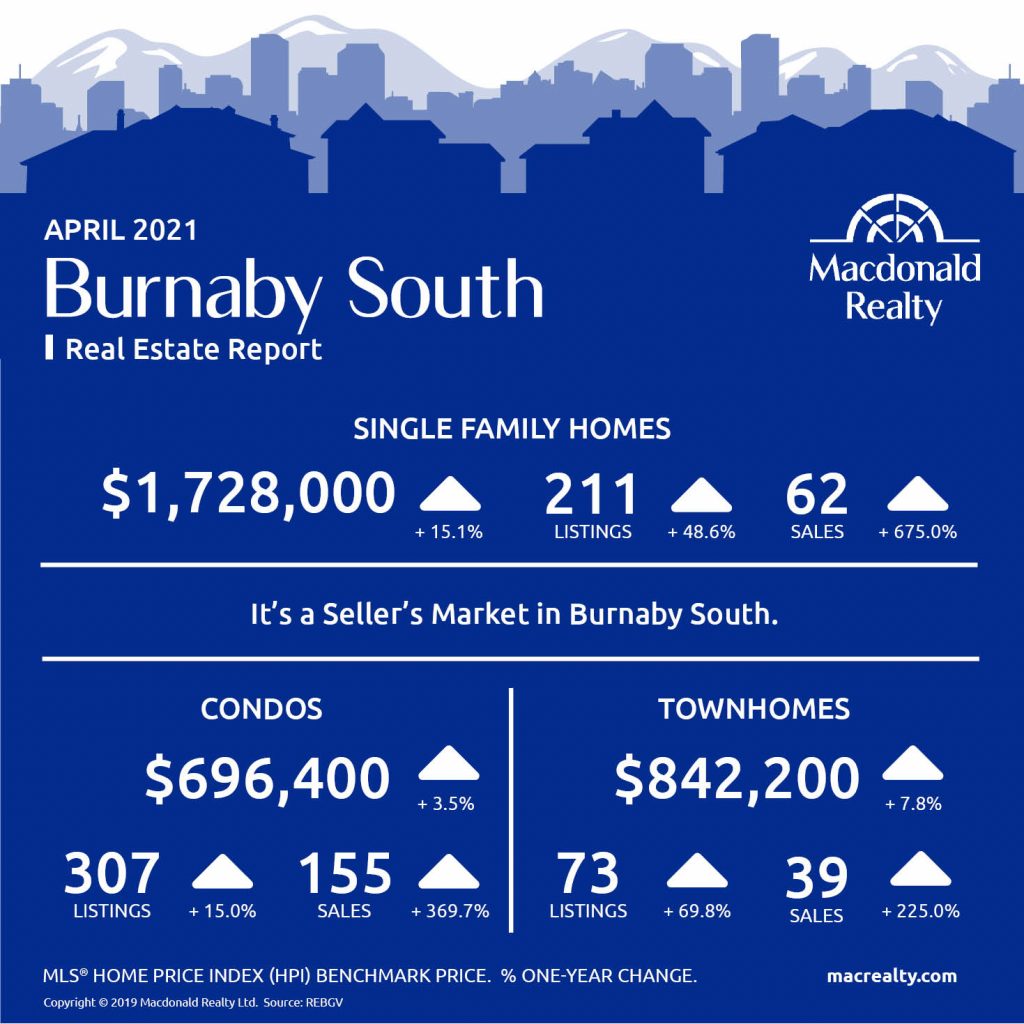
Burnaby South
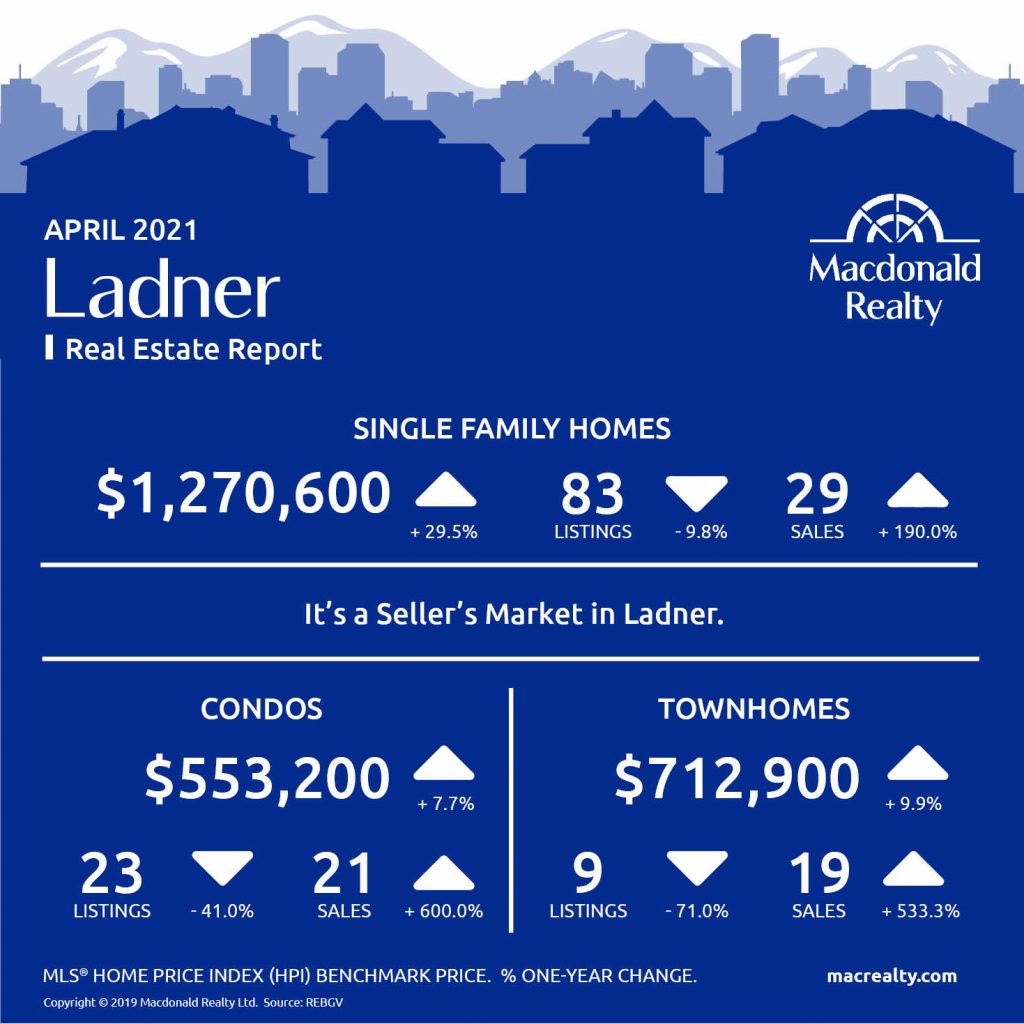
Ladner
Maple Ridge
New Westminster
North Vancouver
Pitt Meadows
Coquitlam

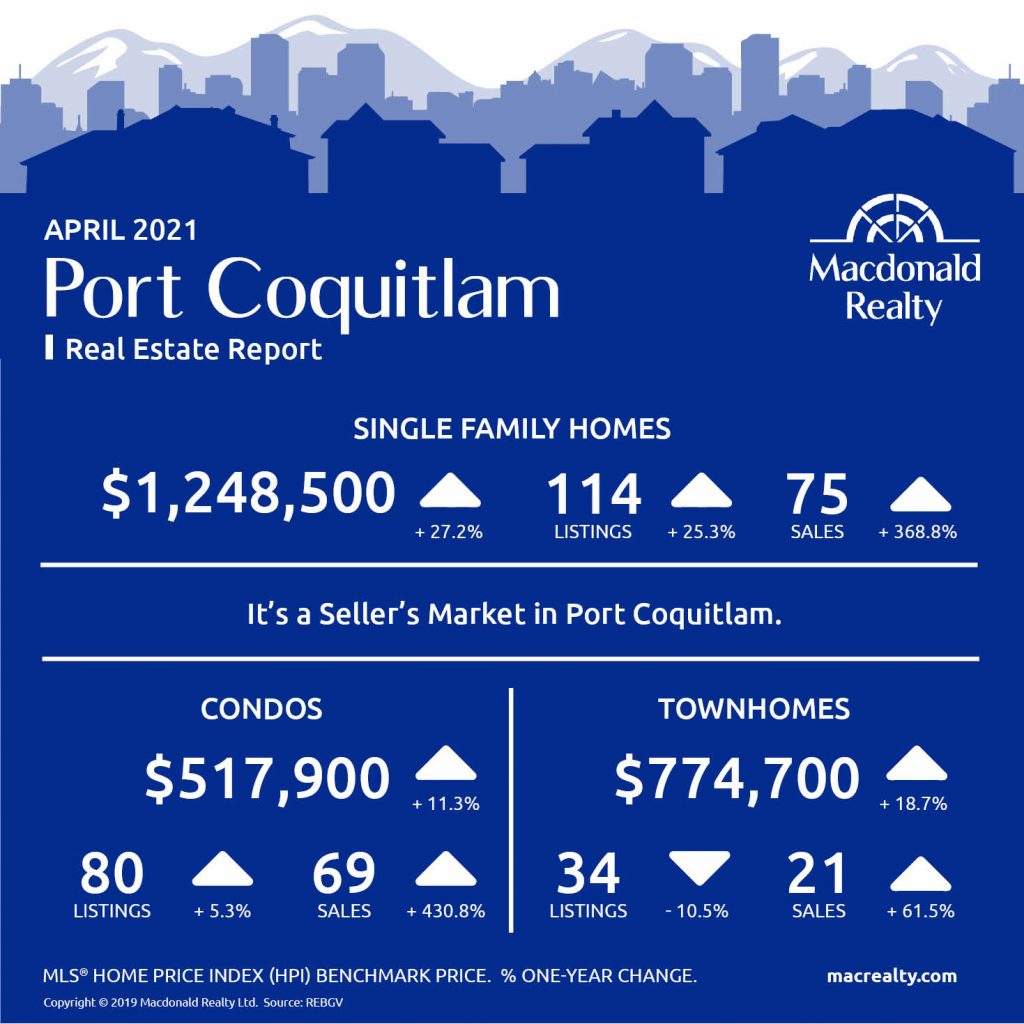
Port Coquitlam
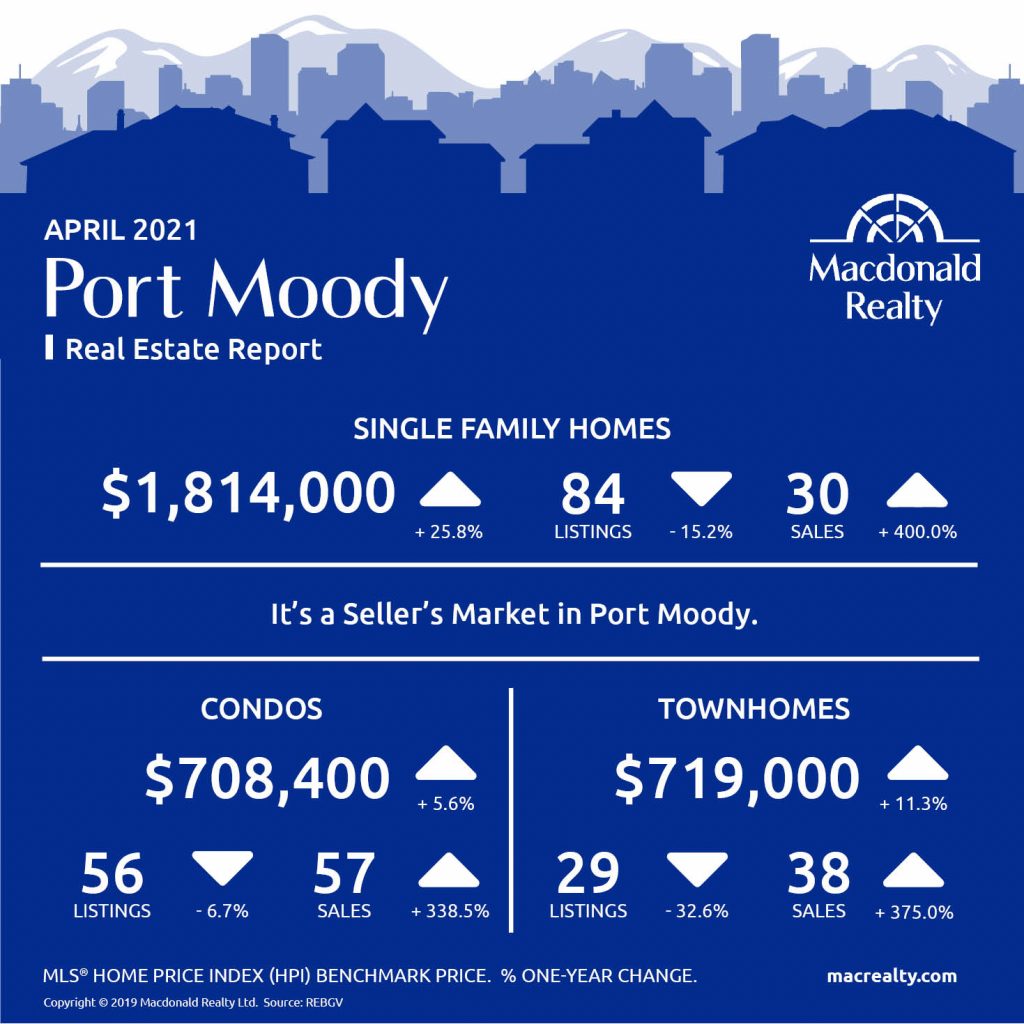
Port Moody
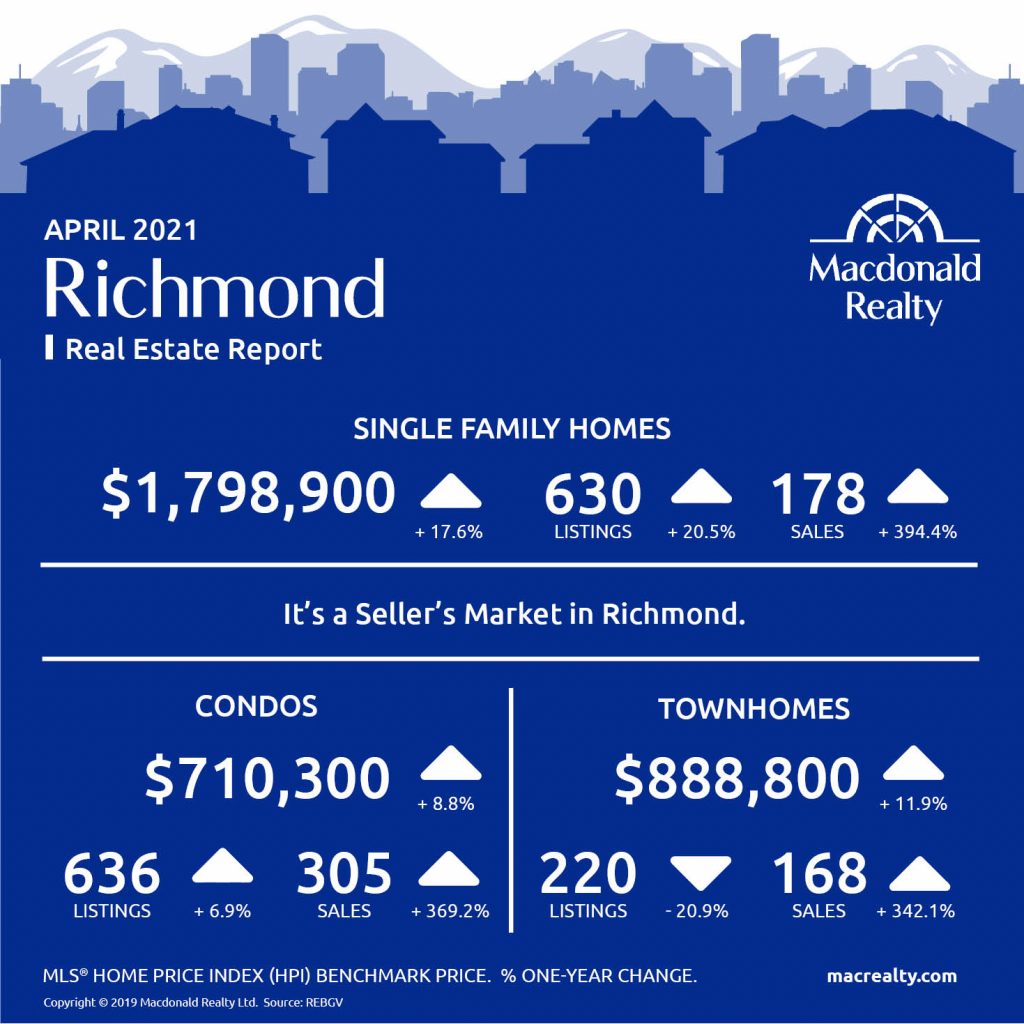
Richmond
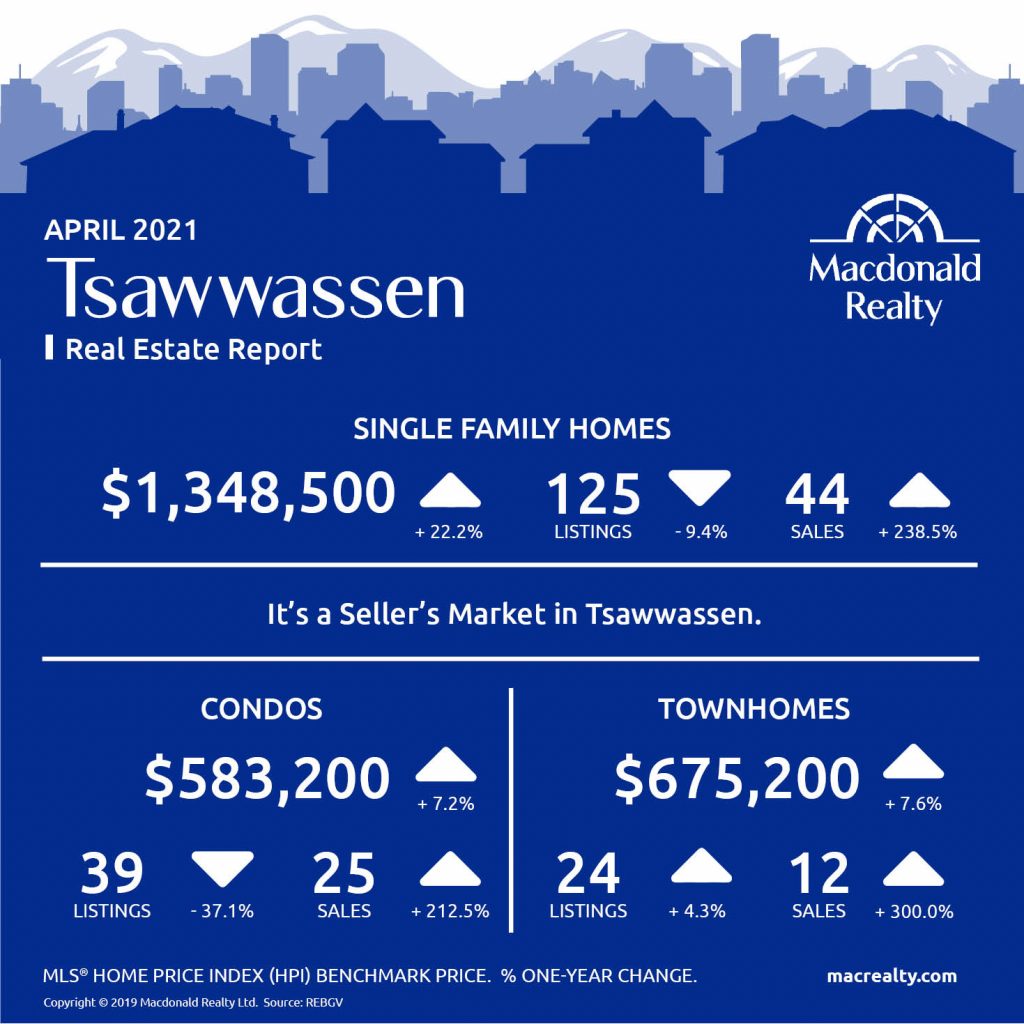
Tsawwassen
Vancouver East

Vancouver West

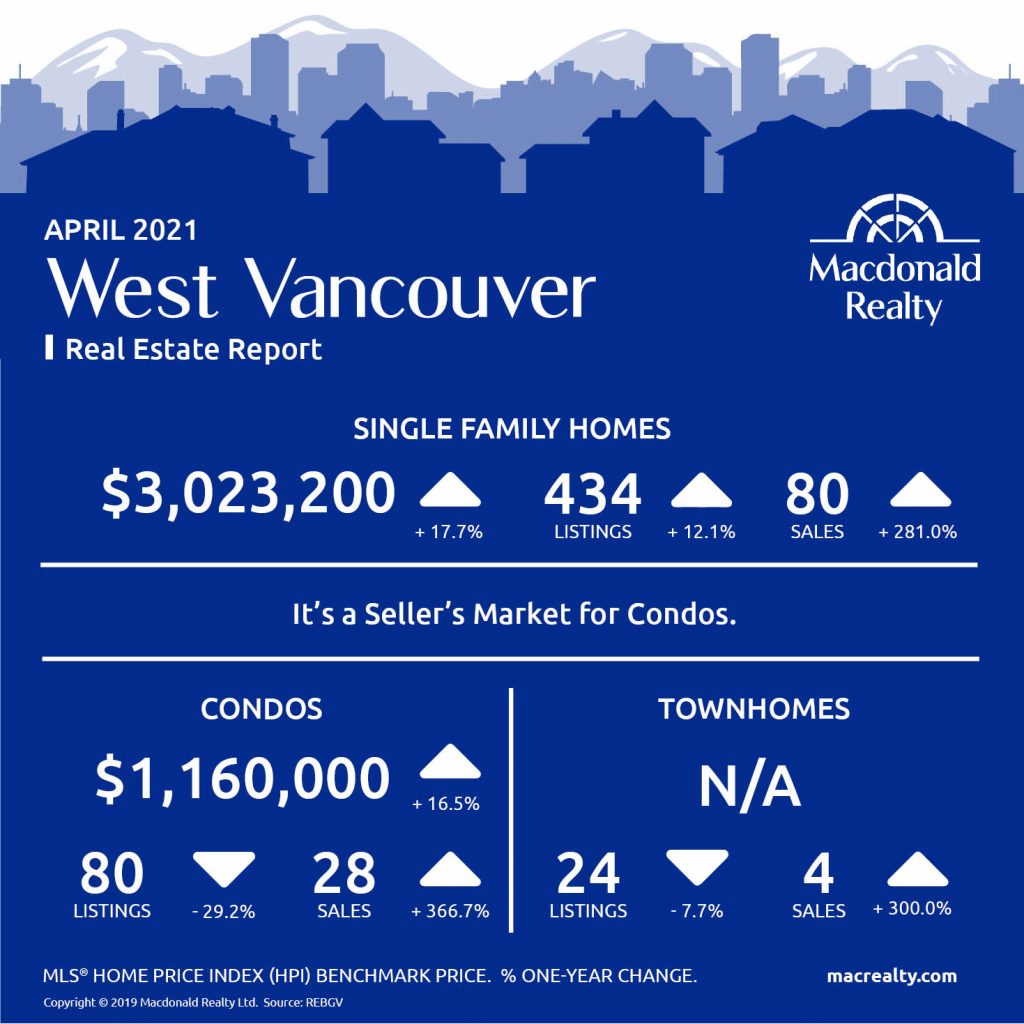
West Vancouver
Looking for more information about the real estate market in specific neighbourhoods in the Greater Vancouver?
Macdonald Realty has offices across the Greater Vancouver. Please email [email protected] or call 1-877-278-3888 to be matched with a REALTOR® working in your area.
MLS® Home Price Index (HPI) Benchmark Price
Average and median home prices are often misinterpreted, are affected by change in the mix of homes sold, and can swing dramatically from month to month (based on the types and prices of properties that sold in a given month). The MLS® HPI overcomes these shortcomings and uses the concept of a benchmark home, a notional home with common attributes of typical homes in a defined area. Visit www.housepriceindex.ca for more information.
This blog post is based on market data provided by the Real Estate Board of Greater Vancouver (REBGV) www.rebgv.org
by Macrealty Marketing Team | May 6, 2021 | Market Updates
Here are the latest real estate market statistics from Macdonald Realty on Squamish, Whistler, and Sunshine Coast listings and sales in April 2021.
Find all the infographics related to the May Market Statistics by visiting the Facebook Album.
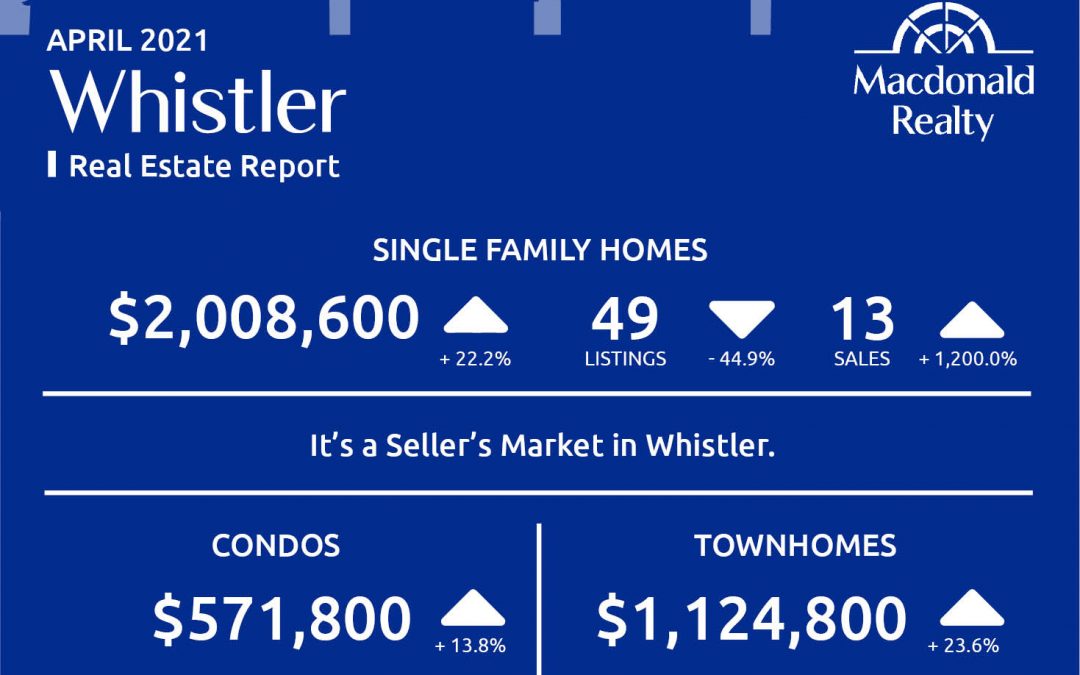
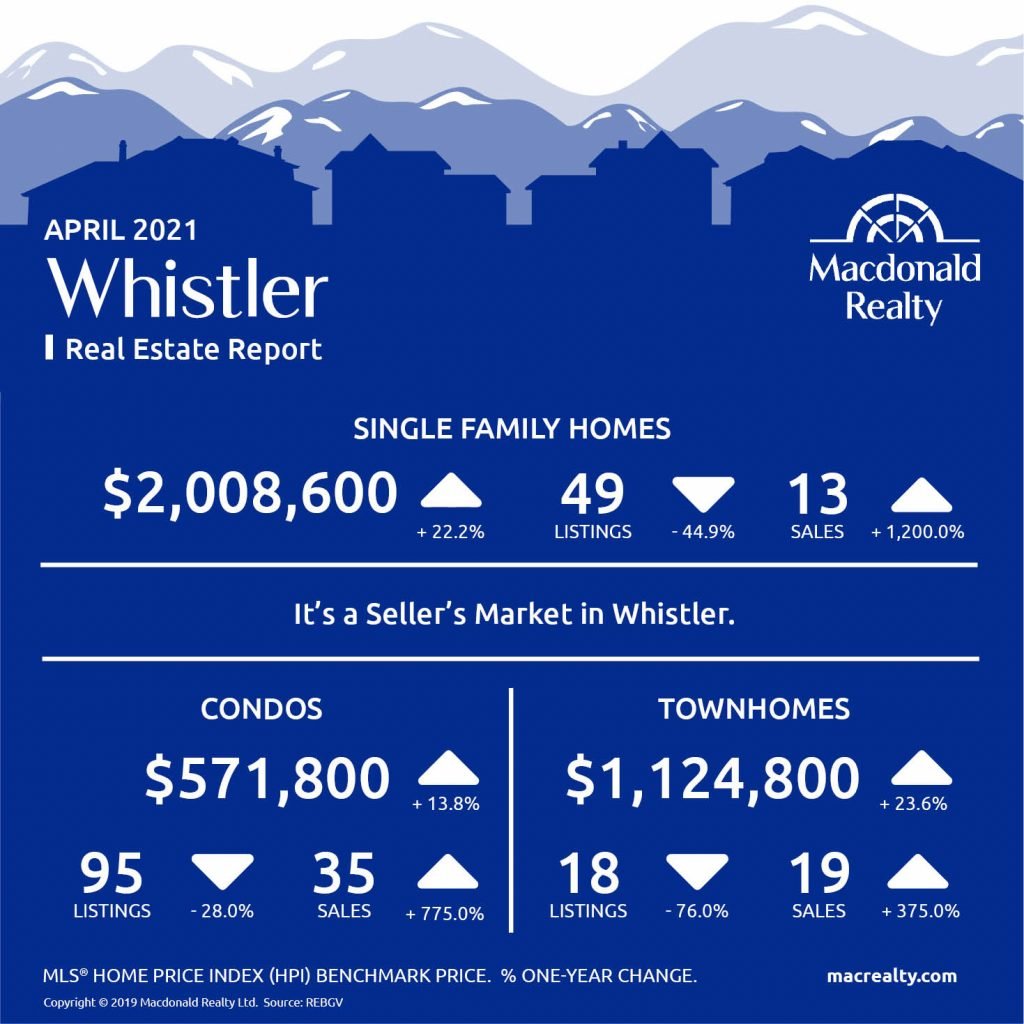
Whistler
In April 2021, there were 13 sales of detached homes and 49 active listings. The benchmark sale price was $2,008,600.
The condo market had 35 sales and 95 active listings at the end of the month. The benchmark sale price was $571,800.
The townhome market had 19 sales and, the active listings were 18. The benchmark sale price was $1,124,800.
It’s a Seller’s market in Whistler.
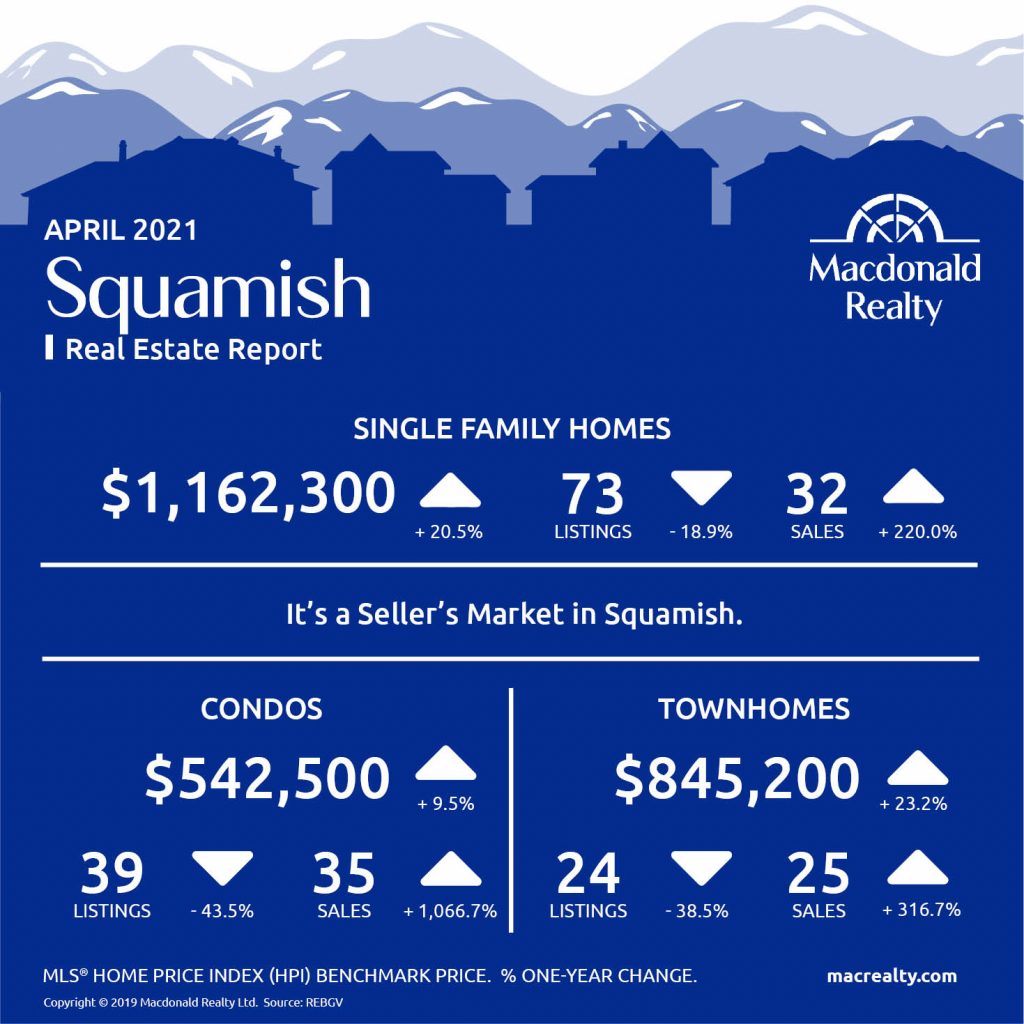
Squamish
In April 2021, there were 32 sales of detached homes and 73 active listings. The benchmark sale price was $1,062,300.
The condo market had 35 sales and 39 active listings at the end of the month. The benchmark sale price was $542,500.
The townhome market had 25 sales and, the active listings were 24. The benchmark sale price was $845,200.
It’s a Seller’s Market in Squamish.
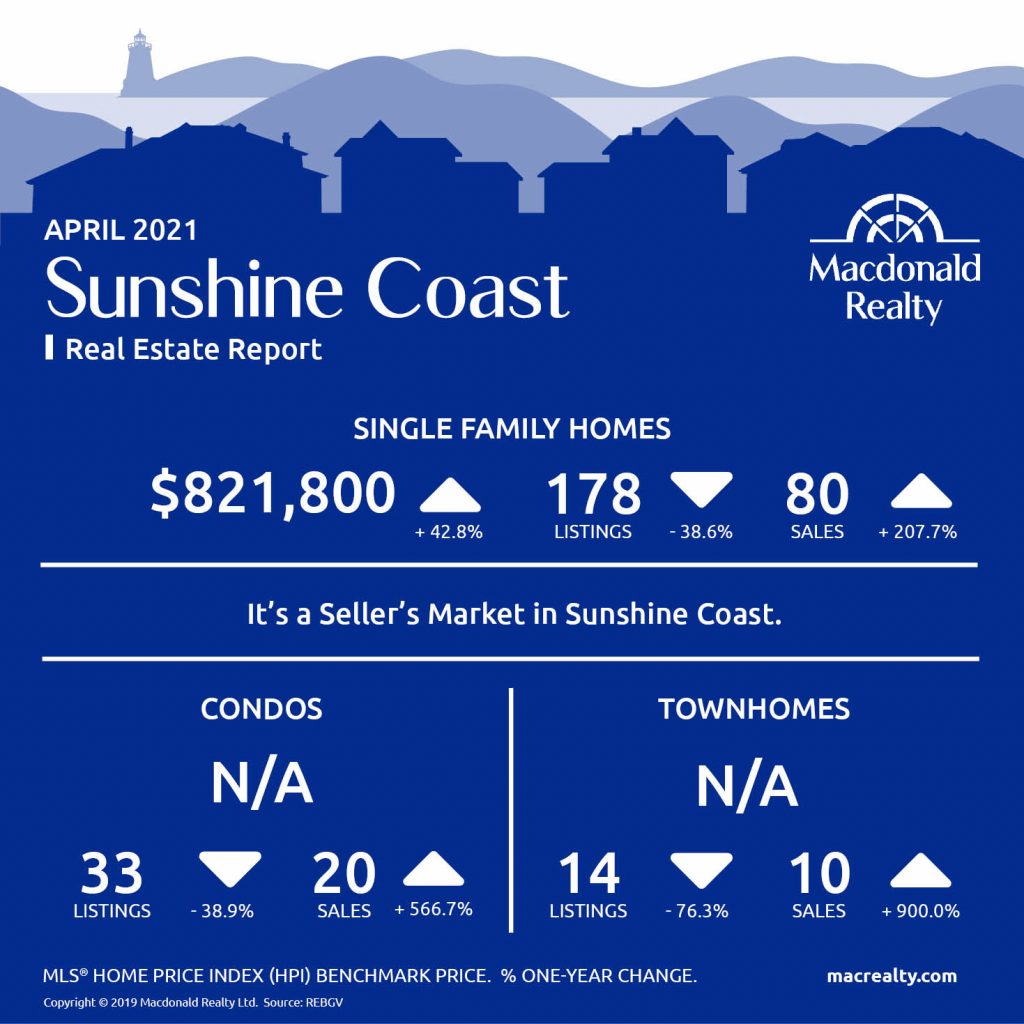
Sunshine Coast
In April 2021, there were 80 sales of detached homes and178 active listings. The benchmark sale price was $821,800.
The condo market had 20 sales and 33 active listings at the end of the month.
The townhome market had 10 sales and, the active listings were 14.
It’s a Seller’s market on Sunshine Coast.
Looking for more information about the real estate market in specific neighbourhoods in Squamish, Whistler, and Sunshine Coast? Macdonald Realty has offices in Squamish, Whistler, and Sunshine Coast. Please email [email protected] or call 1-877-278-3888 to be matched with a REALTOR® working in your area.
MLS® Home Price Index (HPI) Benchmark Price
Average and median home prices are often misinterpreted, are affected by change in the mix of homes sold, and can swing dramatically from month to month (based on the types and prices of properties that sold in a given month). The MLS® HPI overcomes these shortcomings and uses the concept of a benchmark home, a notional home with common attributes of typical homes in a defined area. Visit www.housepriceindex.ca for more information.
This blog post is based on market data provided by the Real Estate Board of Greater Vancouver (REBGV) www.rebgv.org
by Macrealty Marketing Team | May 5, 2021 | Market Updates
Here are the latest real estate market statistics from Macdonald Realty on Greater Victoria, Parksville/Qualicum, and Nanaimo listings and sales in April 2021.
Find all the infographics related to the April Market Statistics by visiting the Facebook Album.
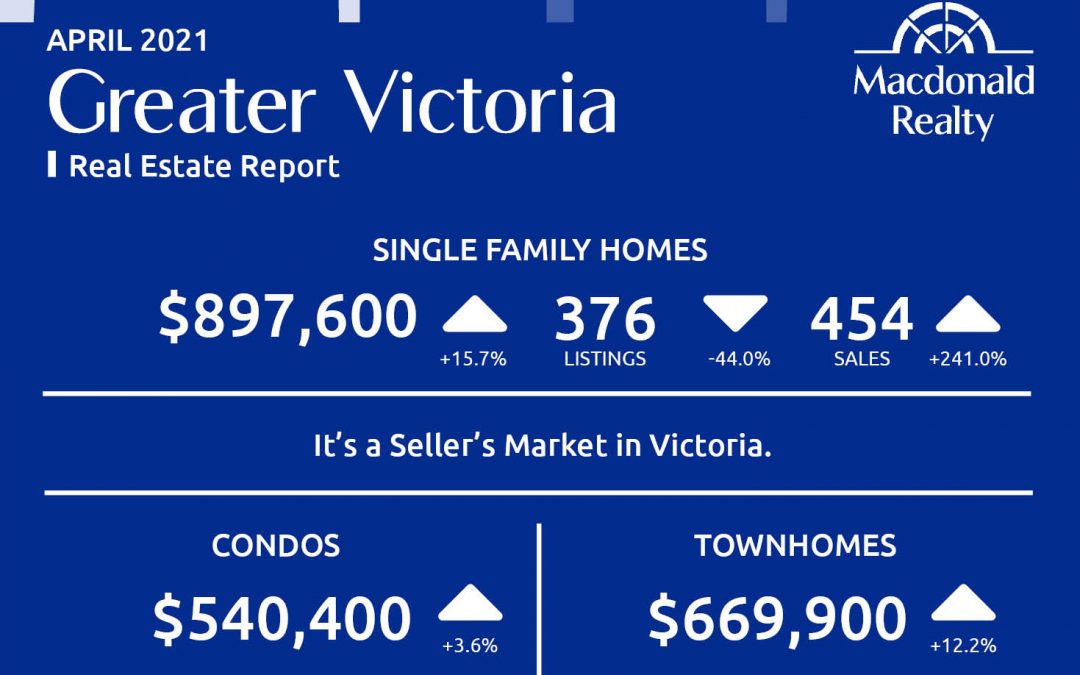
Greater Victoria
According to the Victoria Real Estate Board the housing market in Greater Victoria remains in high demand.
“Comparing last year’s April market to 2021 does not provide us any real insight into long term market trends,” said Victoria Real Estate Board President David Langlois. “Instead of comparing to last year’s numbers, we need to look at years before the pandemic to see how April 2021 compares to average. In the most recent five years pre-pandemic, the average number of sales in the month of April was 896. April 2016 holds the record for sales with 1,286 properties sold. The five-year average for active listings was 2,596, so we sit at more than one thousand homes fewer than a recent average level of inventory.”
A total of 1,116 properties sold in the Victoria Real Estate Board region this April, 288.9% more than the 287 properties sold in April 2020, but 4.9% fewer than the previous month of March. Sales of
condominiums were up 353.4% from April 2020 with 331 units sold. 12.2% fewer condominiums sold in April 2021 than in the previous month of March. Sales of single-family homes were up 246% from
April 2020 with 564 sold. 1.7% fewer single-family homes sold in April 2021 than in the previous month of March.

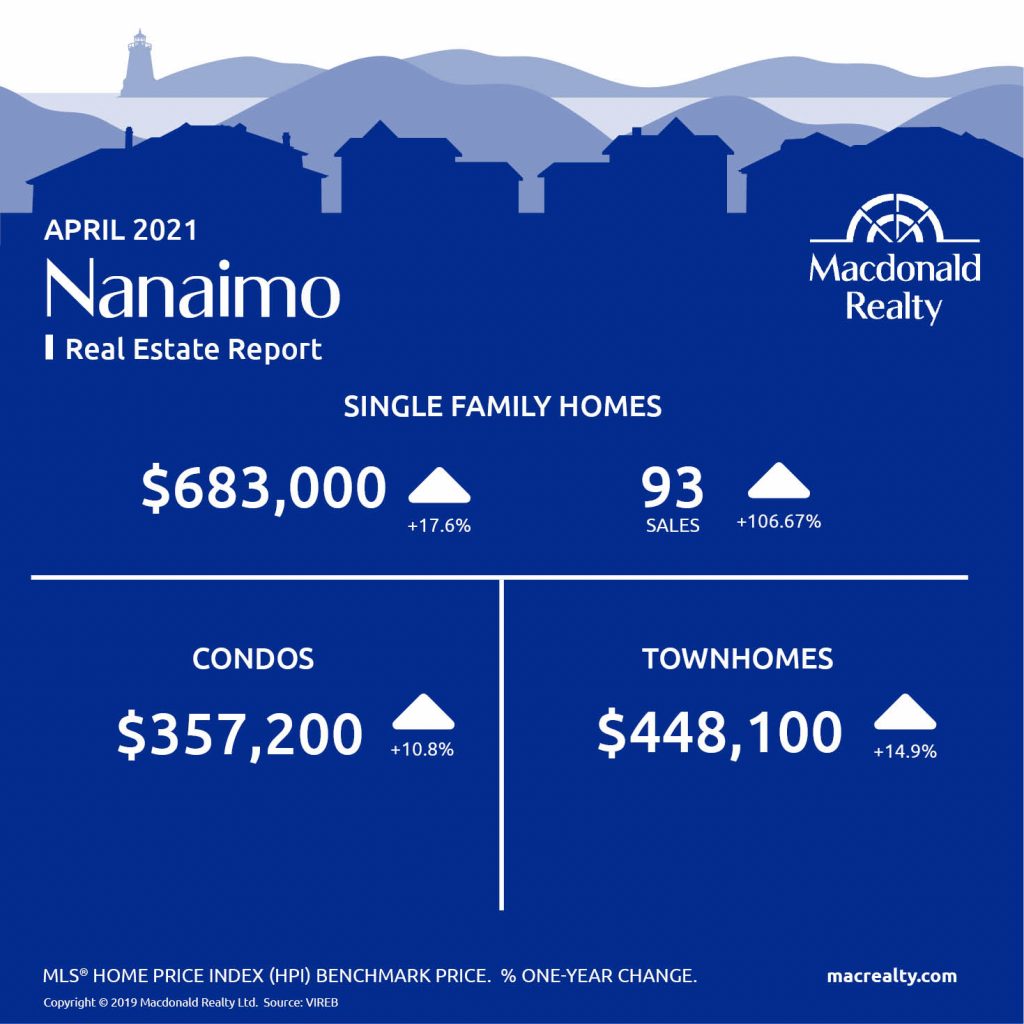
Nanaimo
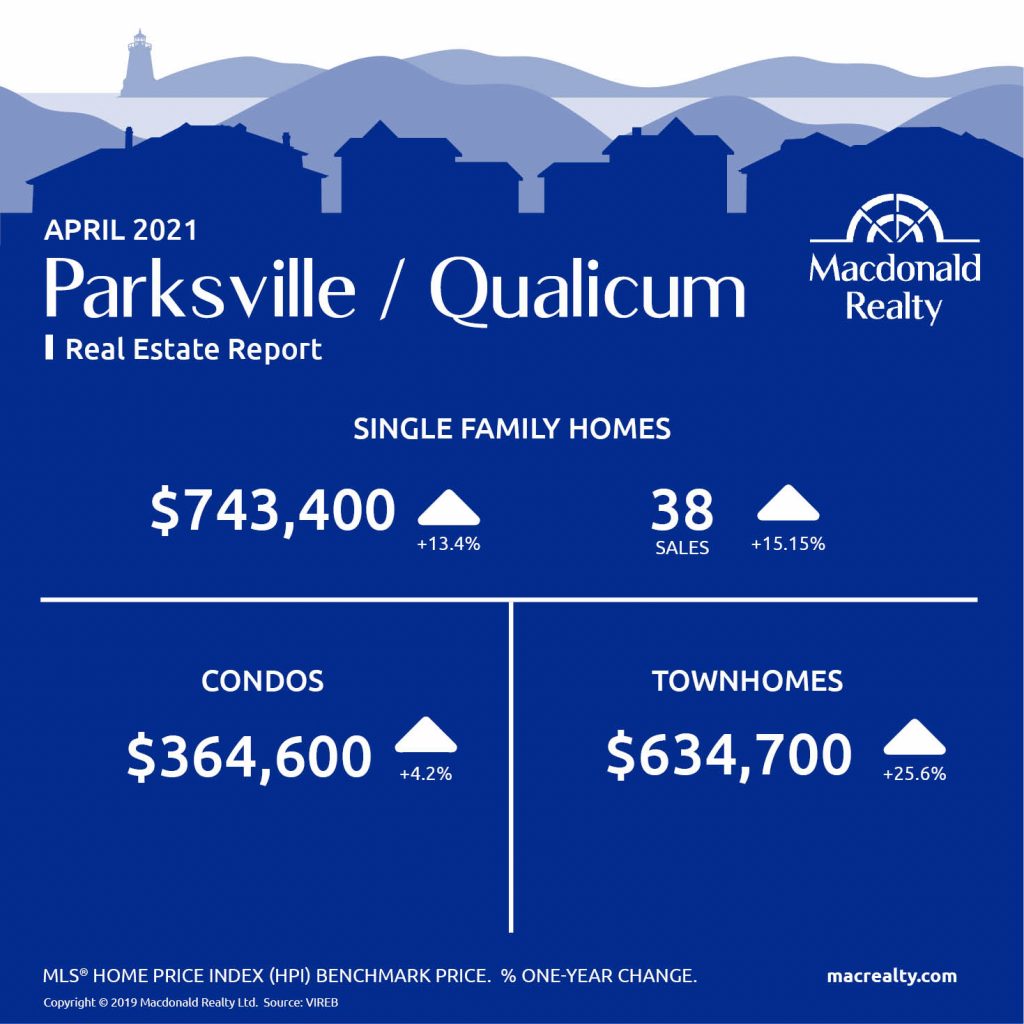
Parksville / Qualicum
Looking for more information about the real estate market in specific neighbourhoods in Victoria, Parksville, Nanaimo, Vancouver Island and the Gulf Islands?
Macdonald Realty has offices in downtown Victoria, Sidney, Parksville and Salt Spring Island. Please email [email protected] or call 1-877-278-3888 to be matched with a REALTOR® working in your area.
MLS® Home Price Index (HPI) Benchmark Price
Average and median home prices are often misinterpreted, are affected by change in the mix of homes sold, and can swing dramatically from month to month (based on the types and prices of properties that sold in a given month). The MLS® HPI overcomes these shortcomings and uses the concept of a benchmark home, a notional home with common attributes of typical homes in a defined area. Visit www.housepriceindex.ca for more information.
This blog post is based on market data provided by the Victoria Real Estate Board (VREB) www.vreb.org and the Vancouver Island Real Estate Board (VIREB) www.vireb.com. Market data from the VIREB includes listings and sales in Campbell River, Comox Valley, Cowichan Valley Nanaimo, Parksville/Qualicum, Port Alberni/West, North Island, and the Islands.

