by Macrealty Marketing Team | Apr 7, 2021 | Market Updates
Here are the latest real estate market statistics from Macdonald Realty on Greater Victoria, Parksville/Qualicum, and Nanaimo listings and sales in March 2021.
Find all the infographics related to the February Market Statistics by visiting the Facebook Album.
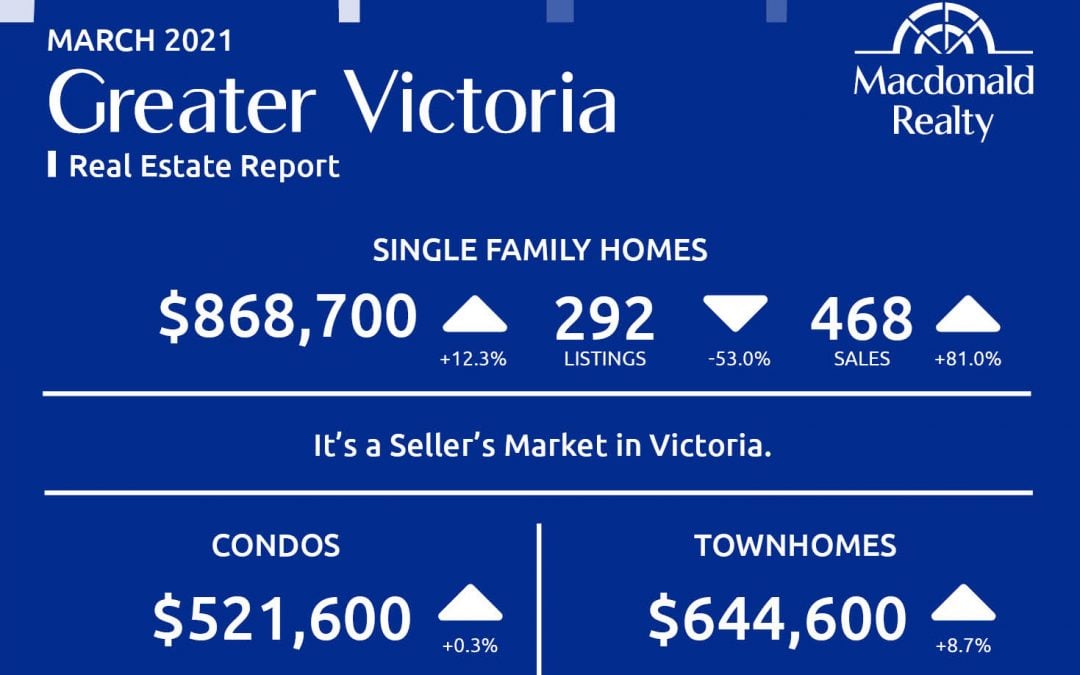
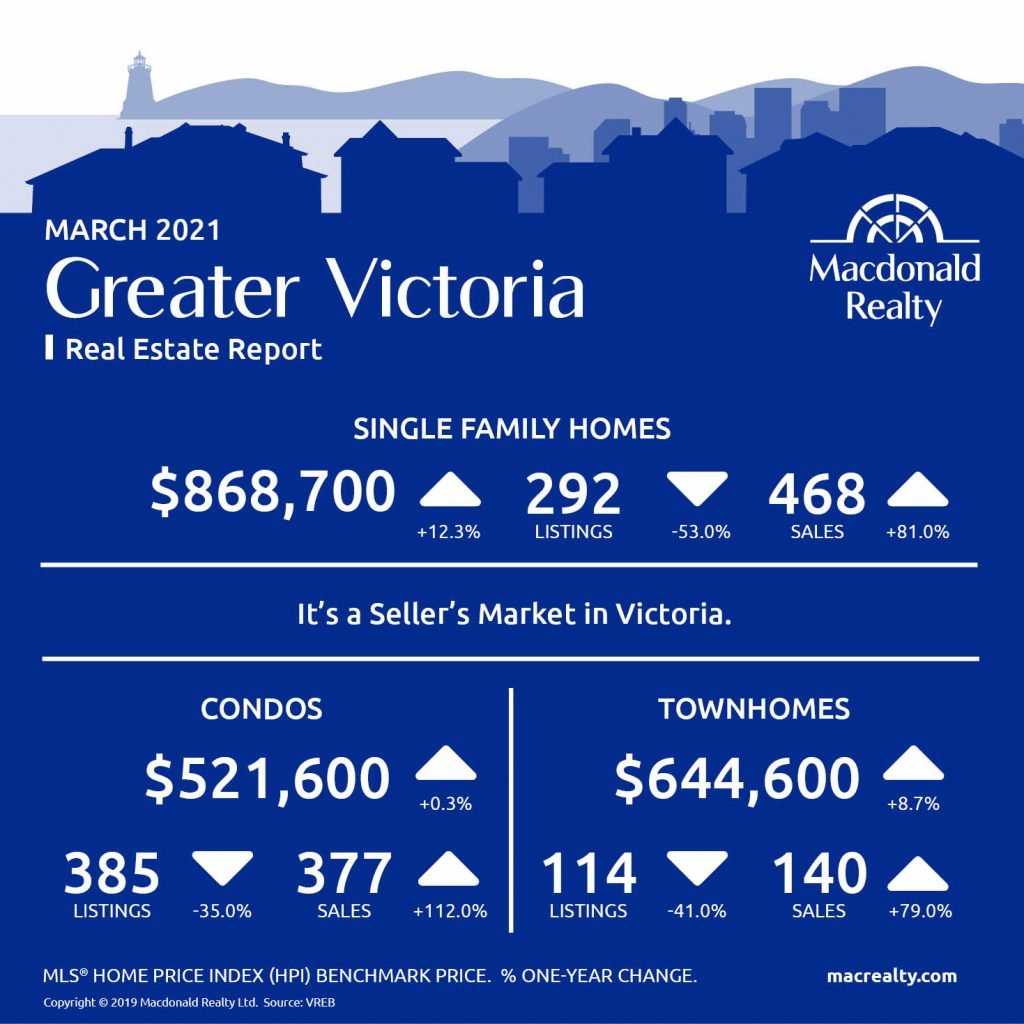
Greater Victoria
According to the Victoria Real Estate Board “A total of 1,173 properties sold in the Victoria Real Estate Board region this March, 92.9 per cent more than the 608 properties sold in March 2020 and 35.9 per cent more than the previous month of February. Sales of condominiums were up 111.8 per cent from March 2020 with 377 units sold. Sales of single family homes were up 88.2 per cent from March 2020 with 574 sold.”
“Limited supply with overwhelming demand has been the story for the first quarter of 2021,” said Victoria Real Estate Board President David Langlois. “This time last year was the beginning of the pandemic and most everything was shut down – so we cannot compare year over year numbers – but if we look at longer term trends, the average number of sales from the month of March in the past ten years before 2020 was 715 properties. Numbers from last month are close to the market trends we saw in 2016, but with an even greater imbalance in inventory due to a surge in consumer demand for homes in the Victoria area.”
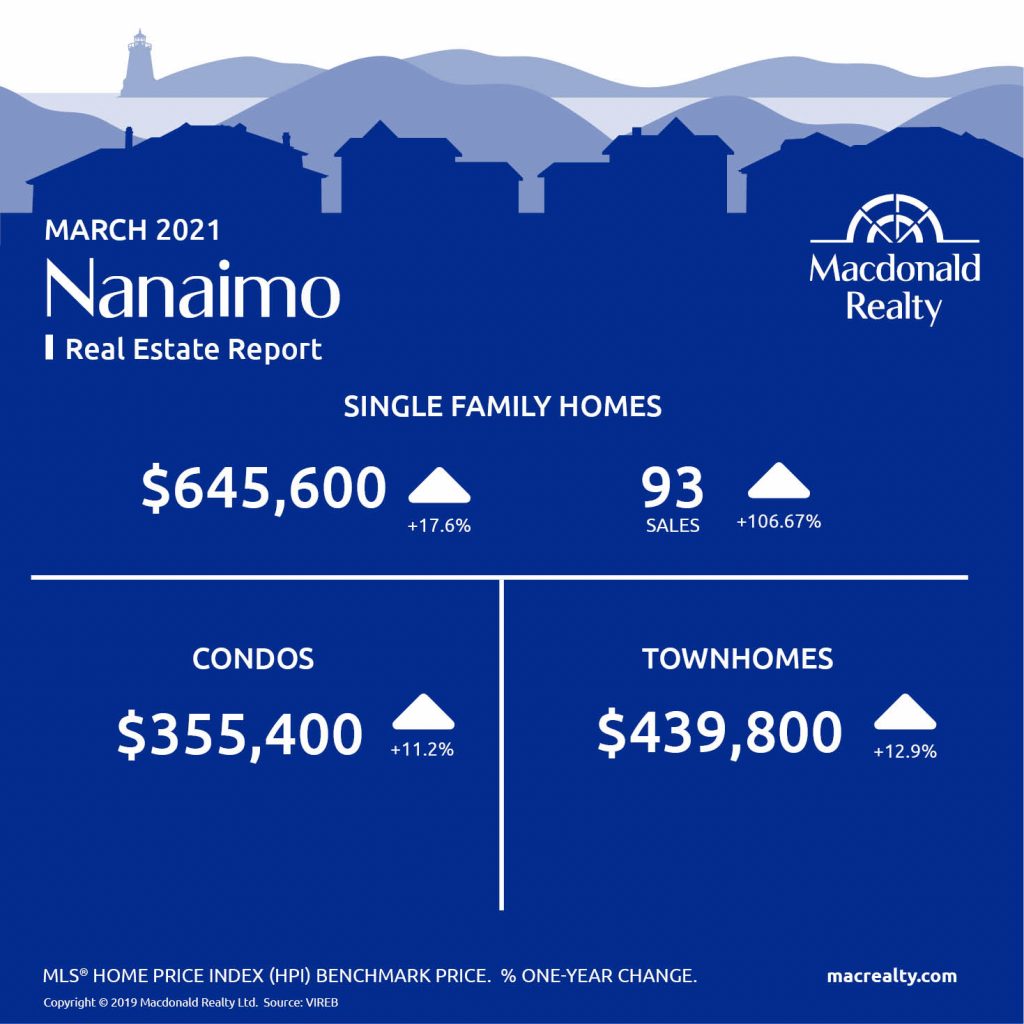
Nanaimo
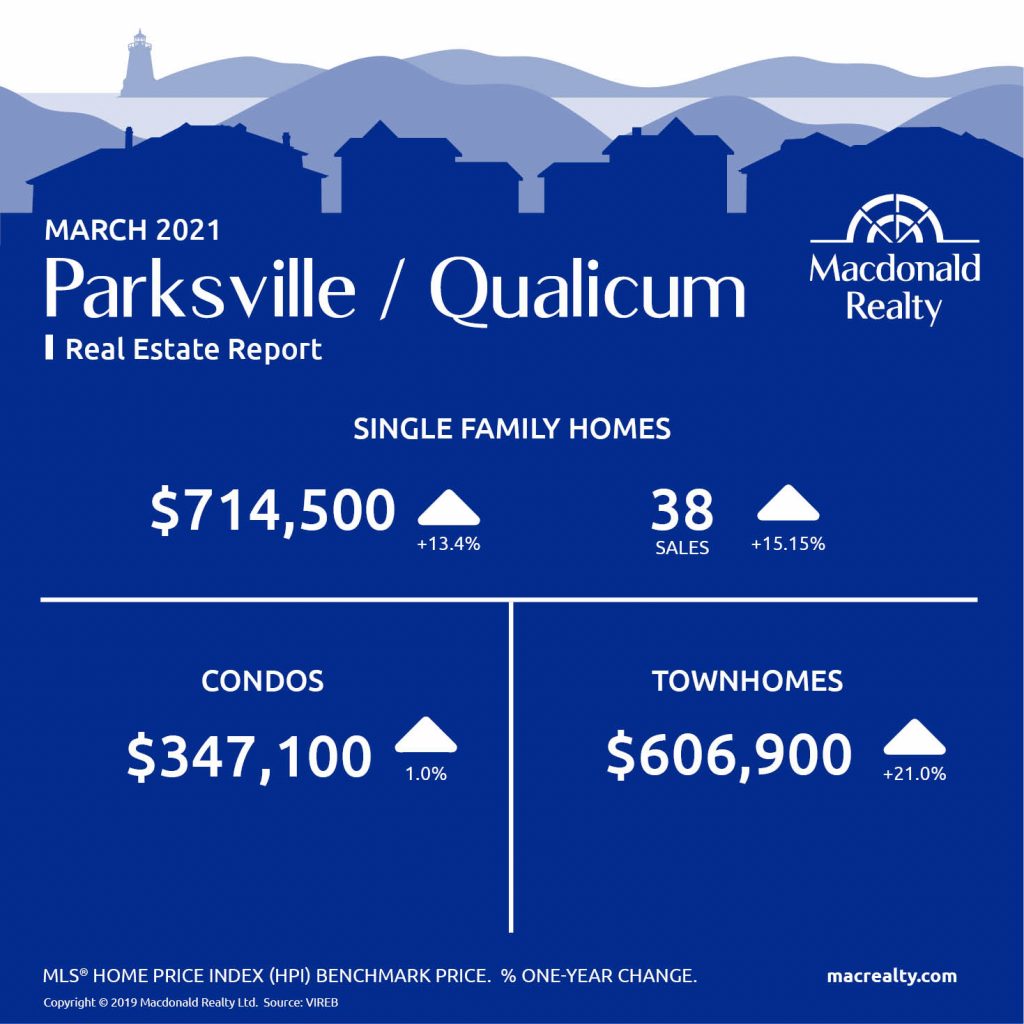
Parksville / Qualicum
Looking for more information about the real estate market in specific neighbourhoods in Victoria, Parksville, Nanaimo, Vancouver Island and the Gulf Islands?
Macdonald Realty has offices in downtown Victoria, Sidney, Parksville and Salt Spring Island. Please email [email protected] or call 1-877-278-3888 to be matched with a REALTOR® working in your area.
MLS® Home Price Index (HPI) Benchmark Price
Average and median home prices are often misinterpreted, are affected by change in the mix of homes sold, and can swing dramatically from month to month (based on the types and prices of properties that sold in a given month). The MLS® HPI overcomes these shortcomings and uses the concept of a benchmark home, a notional home with common attributes of typical homes in a defined area. Visit www.housepriceindex.ca for more information.
This blog post is based on market data provided by the Victoria Real Estate Board (VREB) www.vreb.org and the Vancouver Island Real Estate Board (VIREB) www.vireb.com. Market data from the VIREB includes listings and sales in Campbell River, Comox Valley, Cowichan Valley Nanaimo, Parksville/Qualicum, Port Alberni/West, North Island, and the Islands.
by Macrealty Marketing Team | Mar 5, 2021 | Market Updates
Here are the latest real estate market statistics from Macdonald Realty on the Greater Vancouver listings and sales in February 2021.
Find all the infographics by visiting the Facebook Album.
The Real Estate Board of Greater Vancouver (REBGV) reports that residential home sales in the region totalled 3,727 in February 2021, a 73.3 per cent increase from the 2,150 sales recorded in February 2020, and a 56 per cent increase from the 2,389 homes sold in January 2021.
Last month’s sales were 42.8 per cent above the 10-year February sales average.
“Metro Vancouver’s housing market is experiencing seller’s market conditions. The supply of listings for sale isn’t keeping up with the demand we’re seeing,” Colette Gerber, REBGV Chair said.
Colette also has mentioned the multiple offer situations:
“Competition amongst home buyers is causing multiple offer situations and upward pressure on prices.
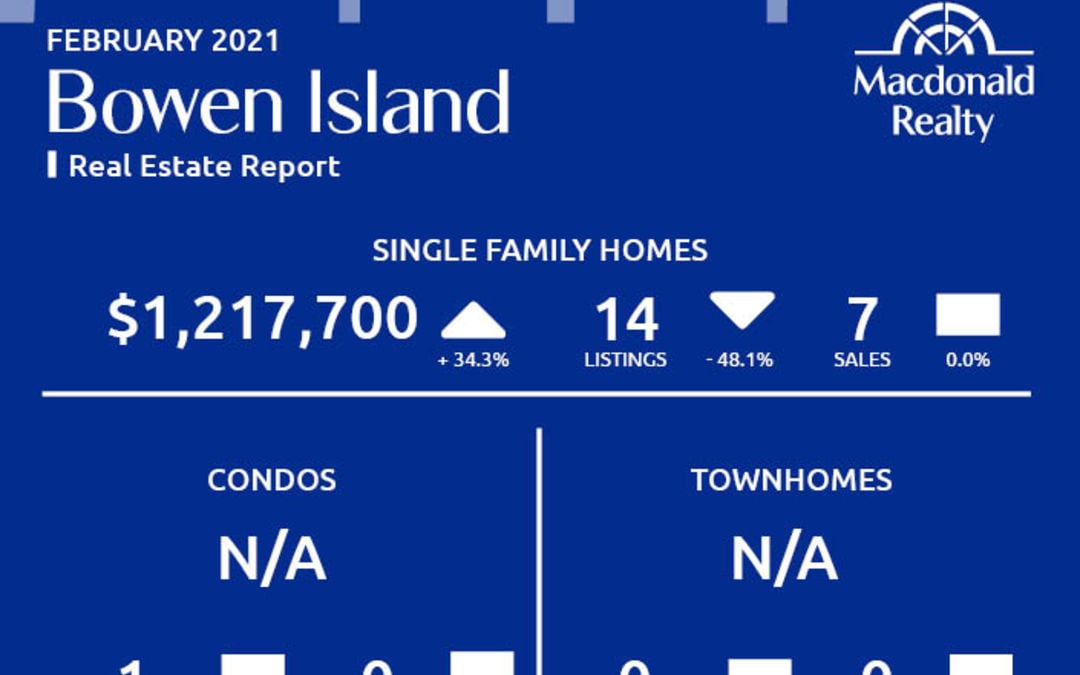
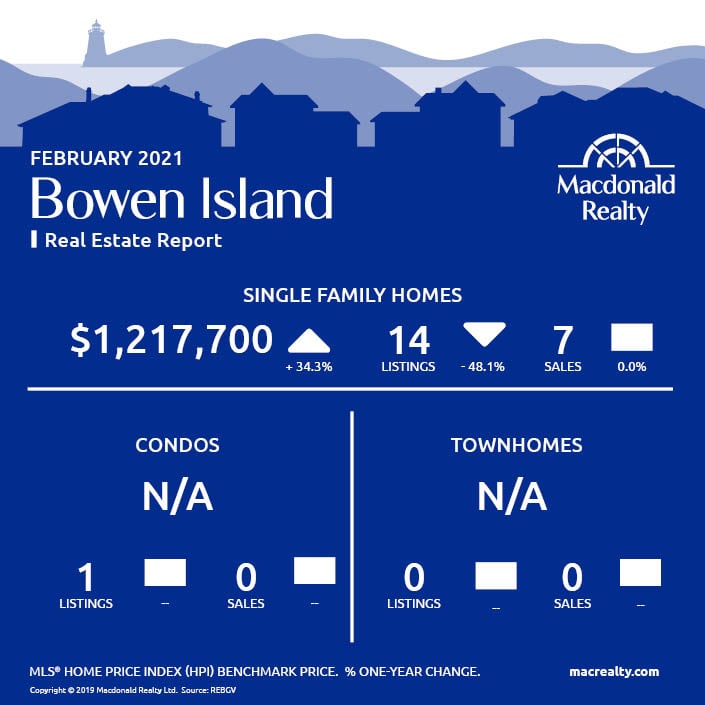
Bowen Island
Burnaby East

Burnaby North

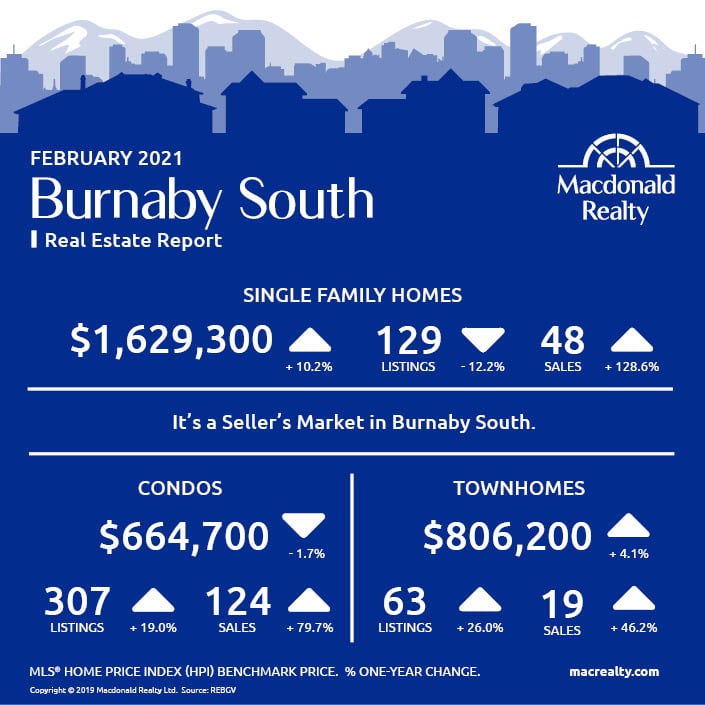
Burnaby South
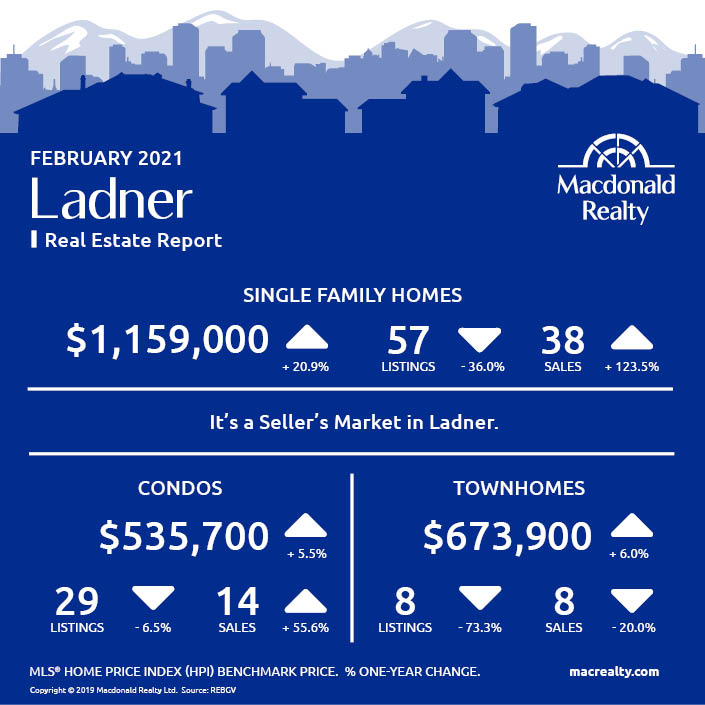
Ladner
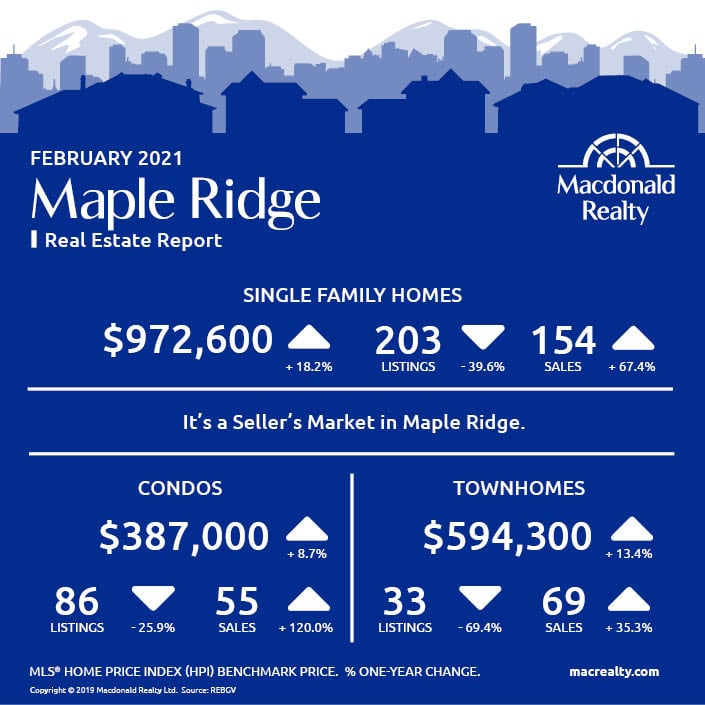
Maple Ridge
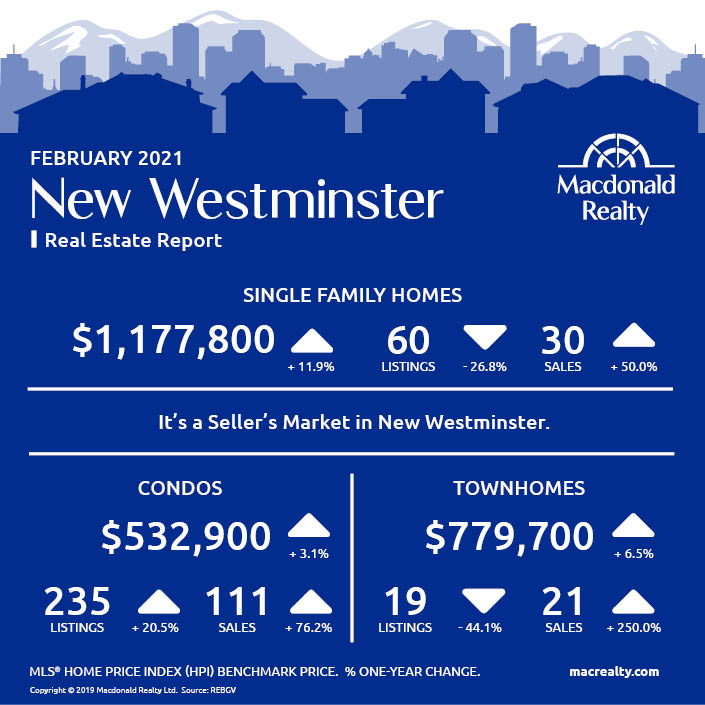
New Westminster
North Vancouver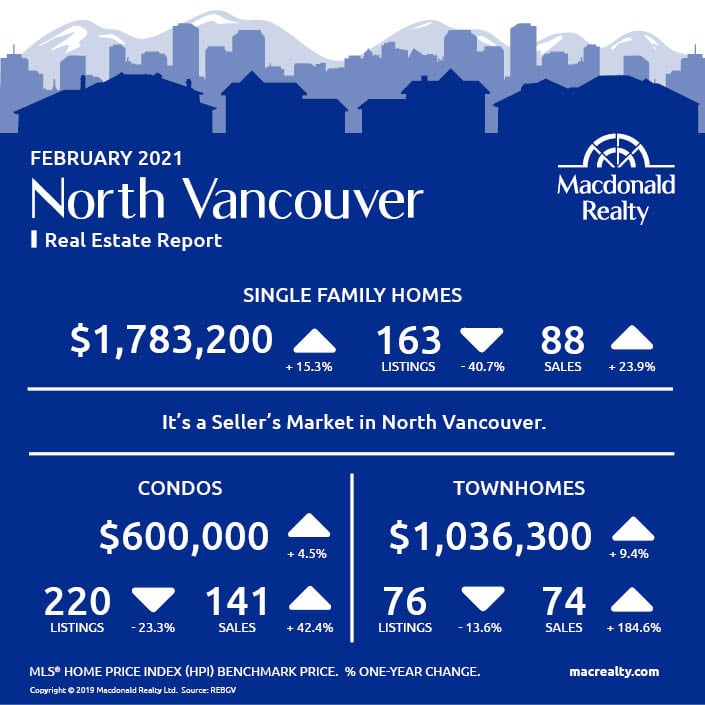
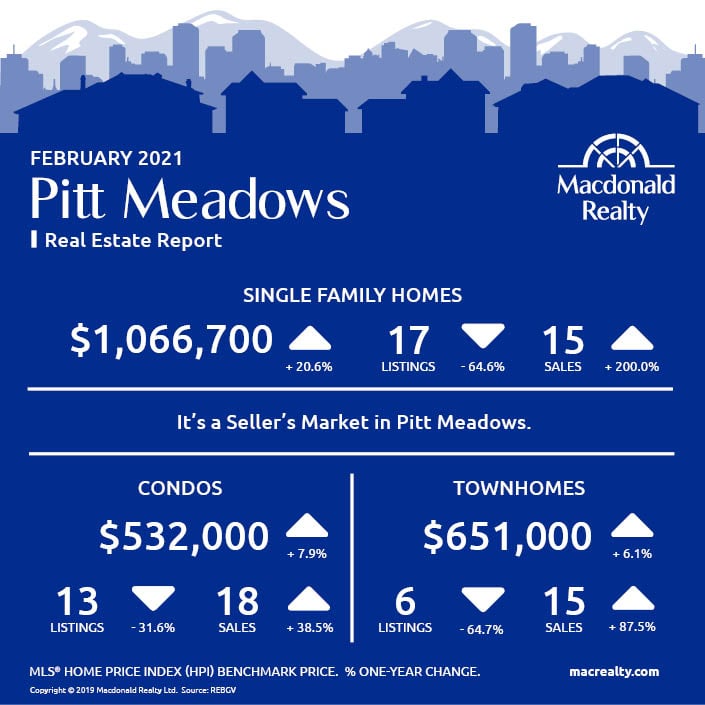
Pitt Meadows
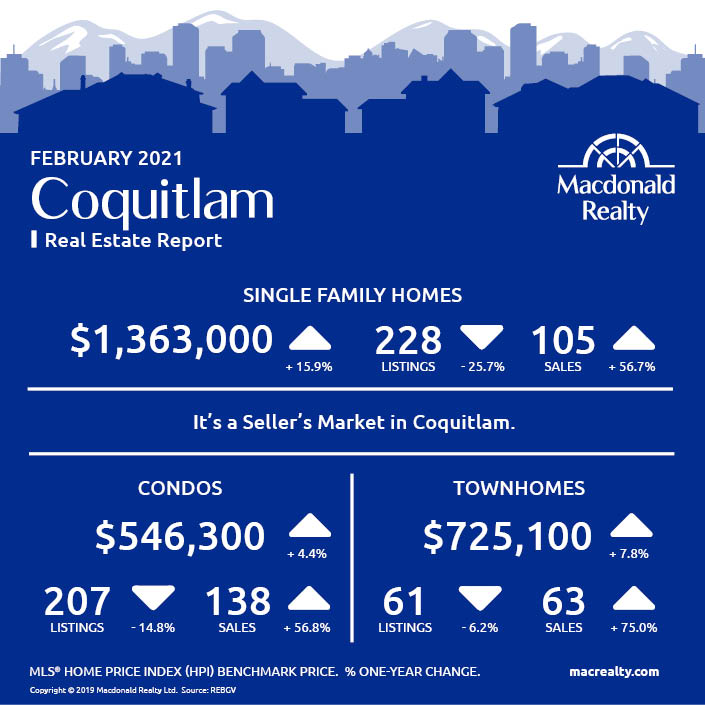
Coquitlam
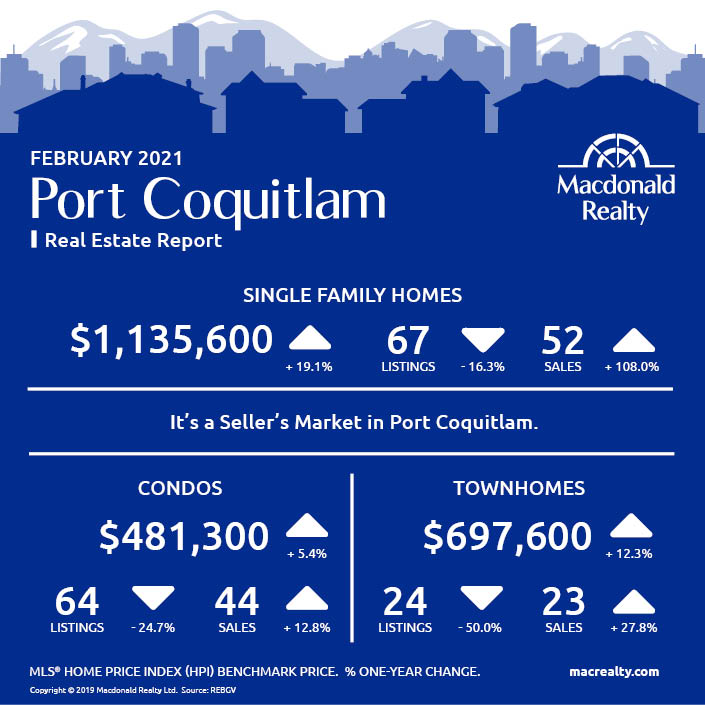
Port Coquitlam
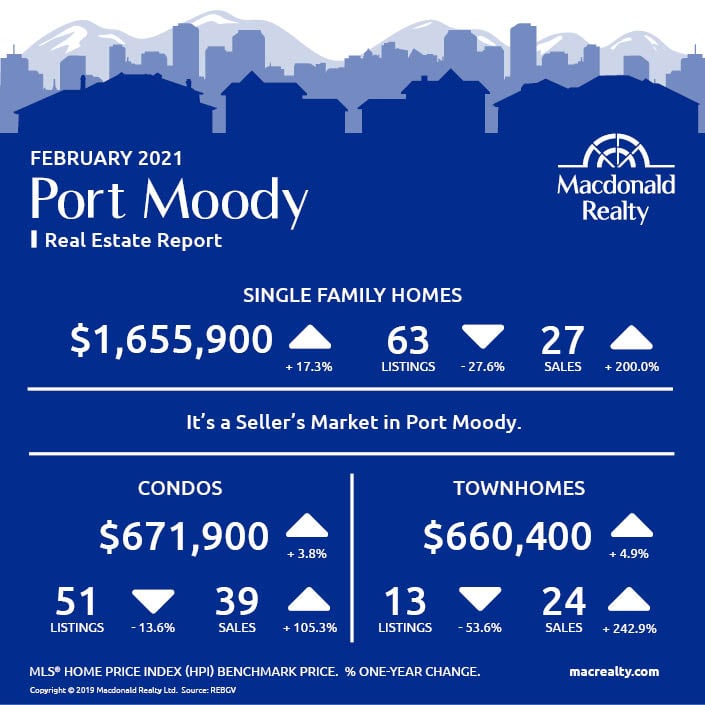
Port Moody
Richmond

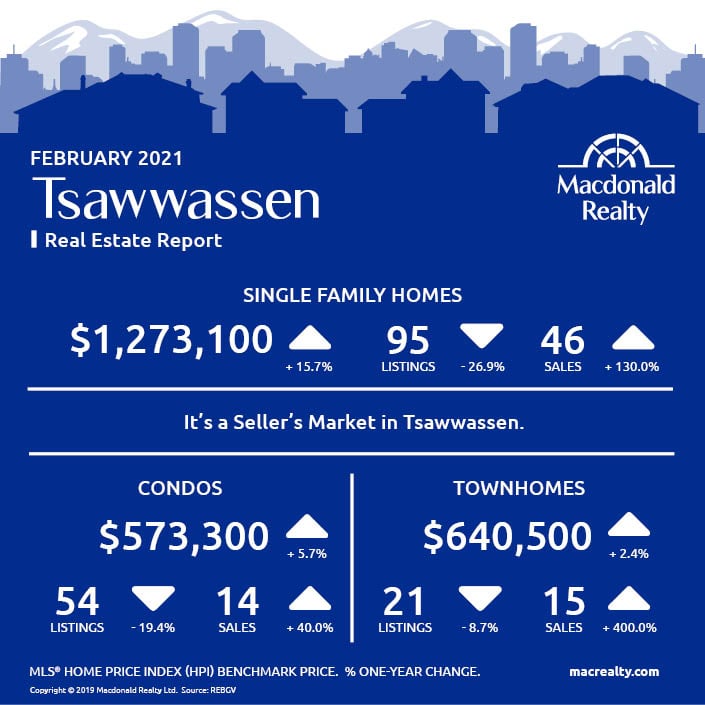
Tsawwassen
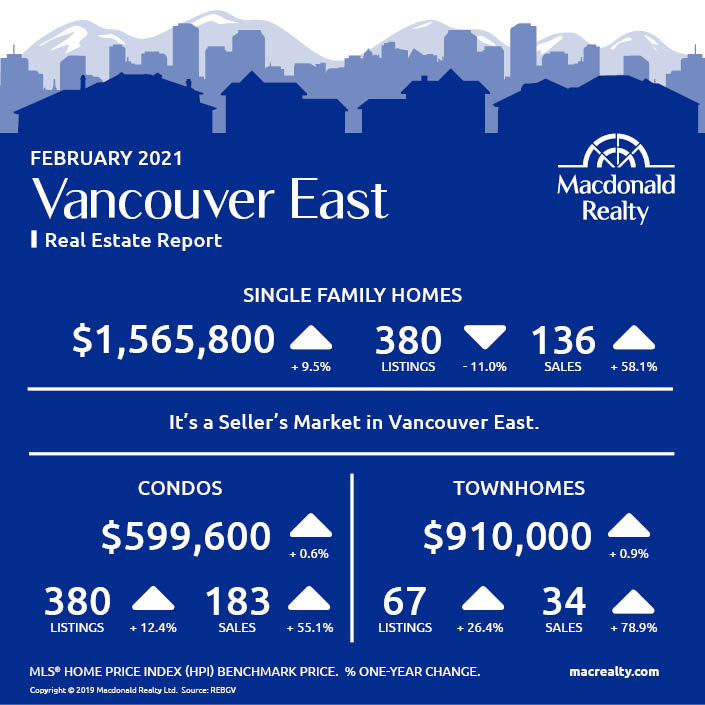
Vancouver East
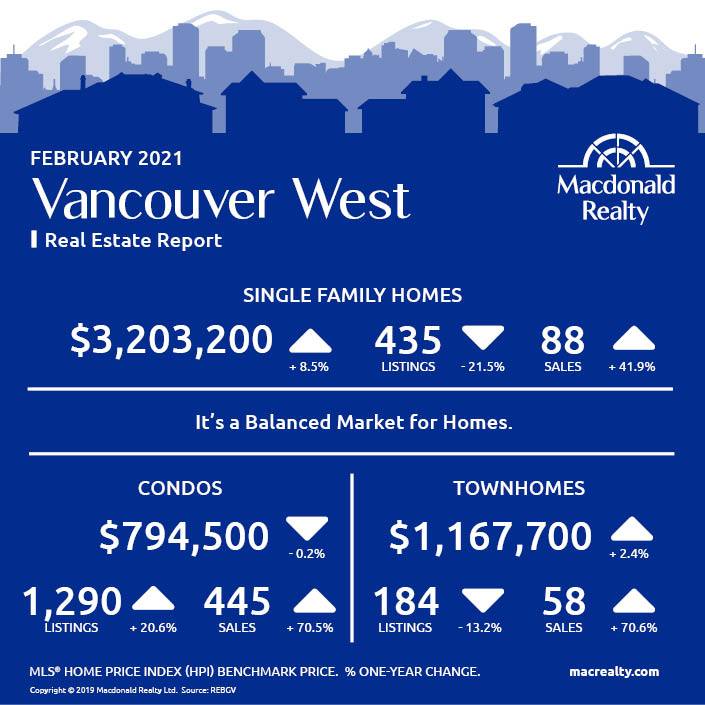
Vancouver West
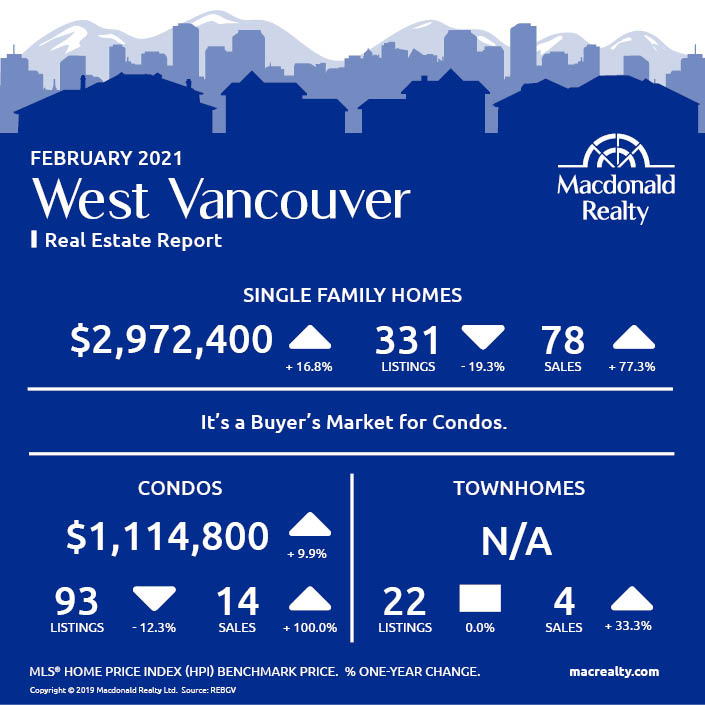
West Vancouver
Looking for more information about the real estate market in specific neighbourhoods in the Greater Vancouver?
Macdonald Realty has offices across the Greater Vancouver. Please email [email protected] or call 1-877-278-3888 to be matched with a REALTOR® working in your area.
MLS® Home Price Index (HPI) Benchmark Price
Average and median home prices are often misinterpreted, are affected by change in the mix of homes sold, and can swing dramatically from month to month (based on the types and prices of properties that sold in a given month). The MLS® HPI overcomes these shortcomings and uses the concept of a benchmark home, a notional home with common attributes of typical homes in a defined area. Visit www.housepriceindex.ca for more information.
This blog post is based on market data provided by the Real Estate Board of Greater Vancouver (REBGV) www.rebgv.org
by Macrealty Marketing Team | Mar 4, 2021 | Market Updates
Here are the latest real estate market statistics from Macdonald Realty on Okanagan listings and sales in February 2021.
Find the infographics by visiting the Facebook Album.
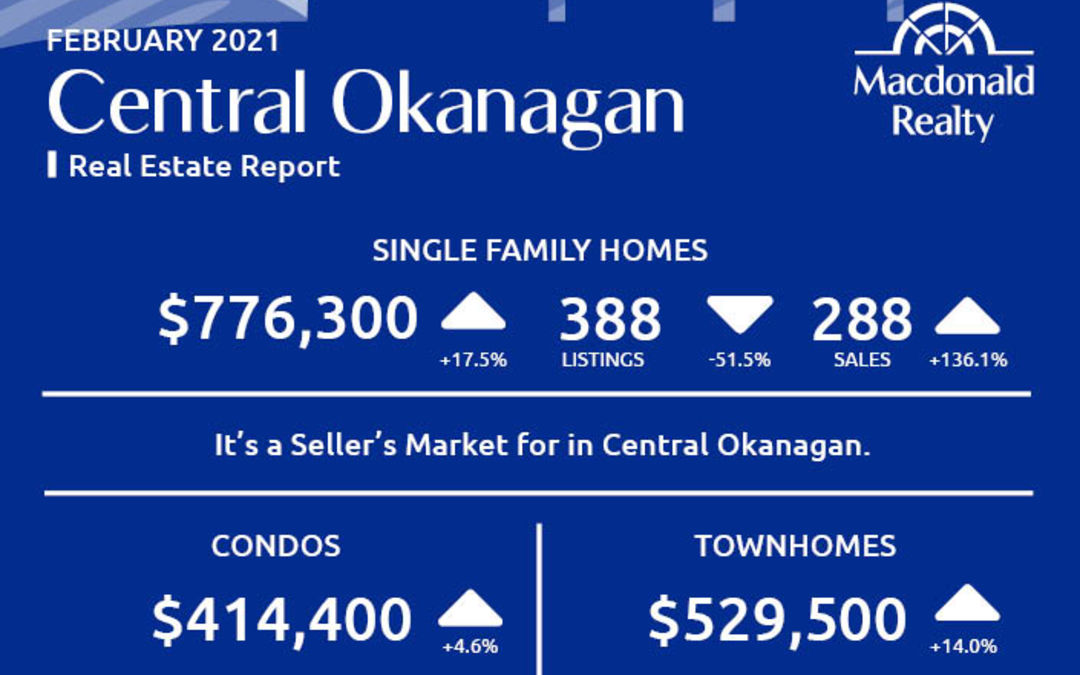
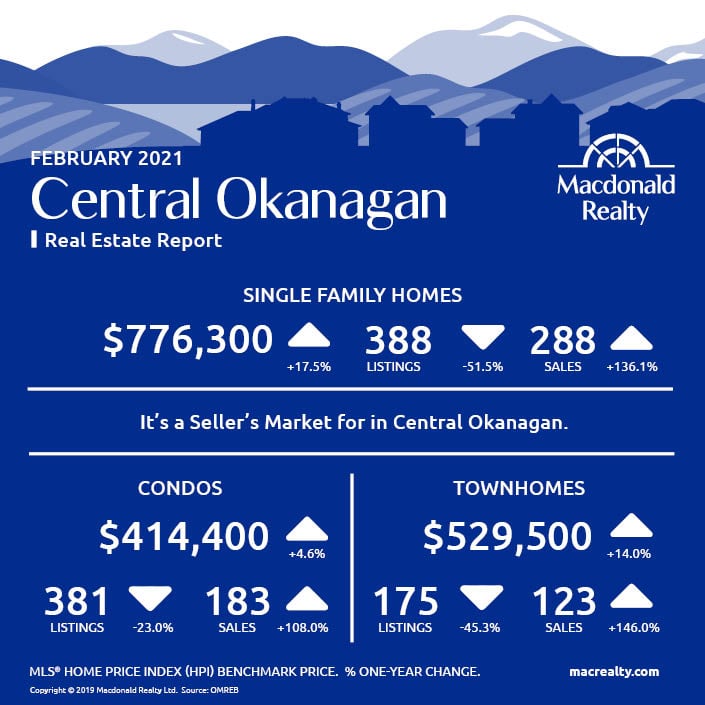
Central Okanagan: Kelowna and Lake Country
There were 288 sales, 388 active listings, and $776,300 average sale price for detached homes in the Central Okanagan market, including Kelowna and Lake Country.
The condo market featured 183 sales and 381 active listings at the end of the month. The average sale price was $414,400.
Townhome sales were 123, active listings were 175 and the average sale price was $529,500.
It’s a seller’s market in Central Okanagan.
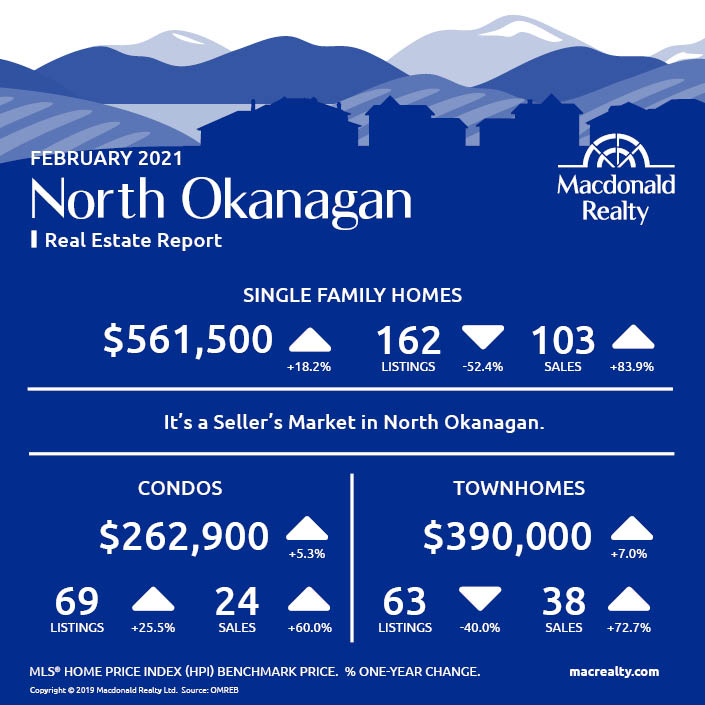
North Okanagan: Vernon and surrounding area
In North Okanagan, including Vernon and the surrounding area and the average sale price was $561,500. At the end of the month, there were 103 sales and 162 active listings.
There were 24 sales and 69 active listings for condos. The average sale price was $262,900.
In comparison, townhomes featured 38 sales, 63 active listings and a $390,000 average sale price.
It’s a seller’s market in North Okanagan.
Looking for more information about the real estate market in specific neighbourhoods in Okanagan?
Macdonald Realty has offices in Kelowna and across BC. Please email [email protected] or call 1-877-278-3888 to be matched with a REALTOR® working in your area.
This blog post is based on market data provided by Okanagan Mainline Real Estate Board (OMREB) www.omreb.com.
by Macrealty Marketing Team | Mar 4, 2021 | Market Updates
According to the Fraser Valley Real Estate Board for the sixth consecutive month, Fraser Valley’s real estate market experienced property sales at
levels are never seen before in the 100‐year history of the Fraser Valley Real Estate Board (FVREB).
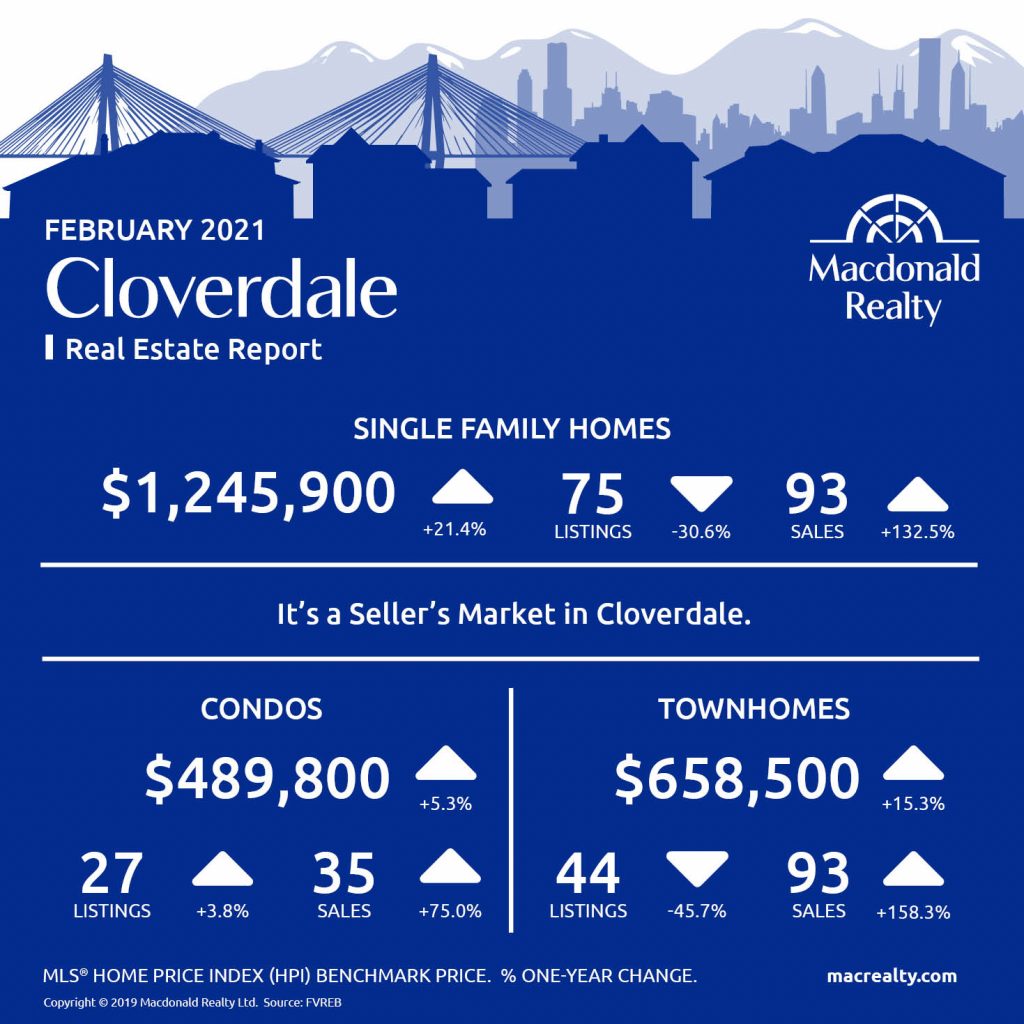
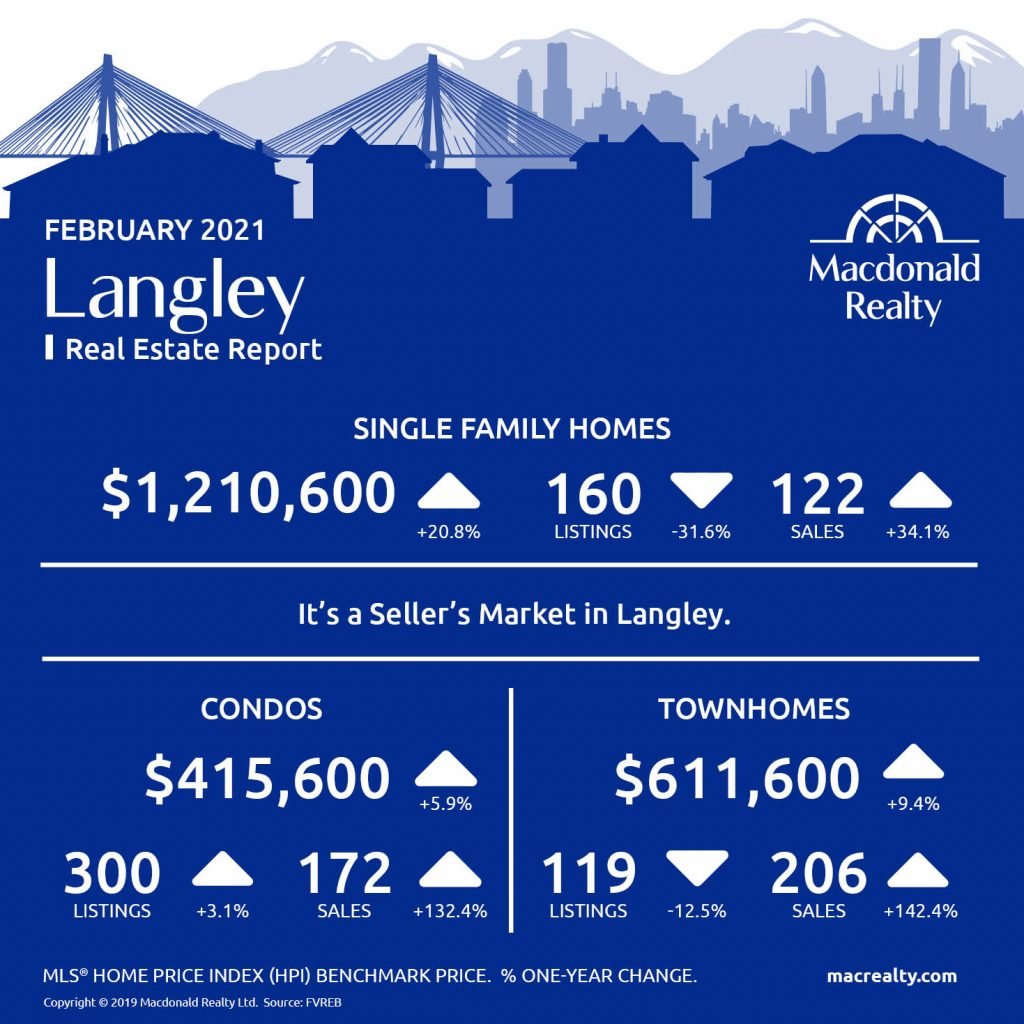
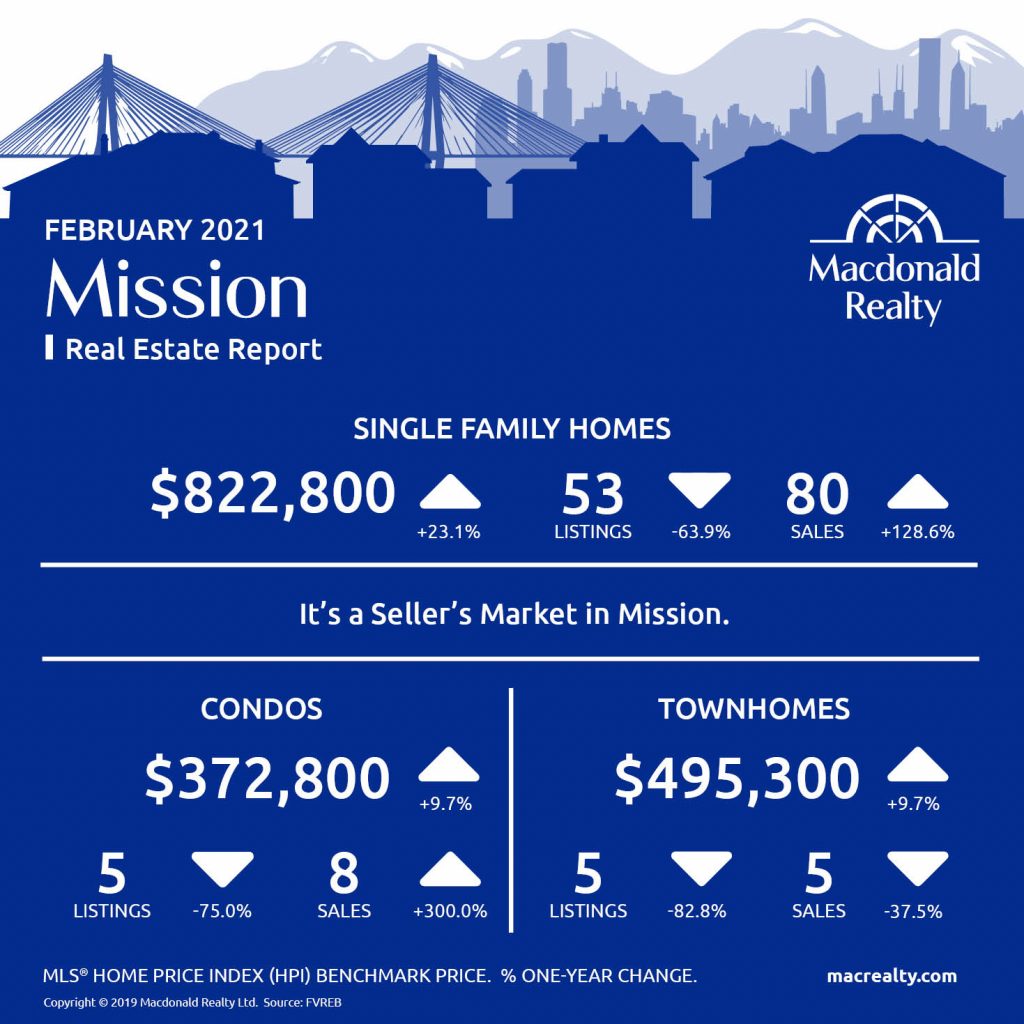
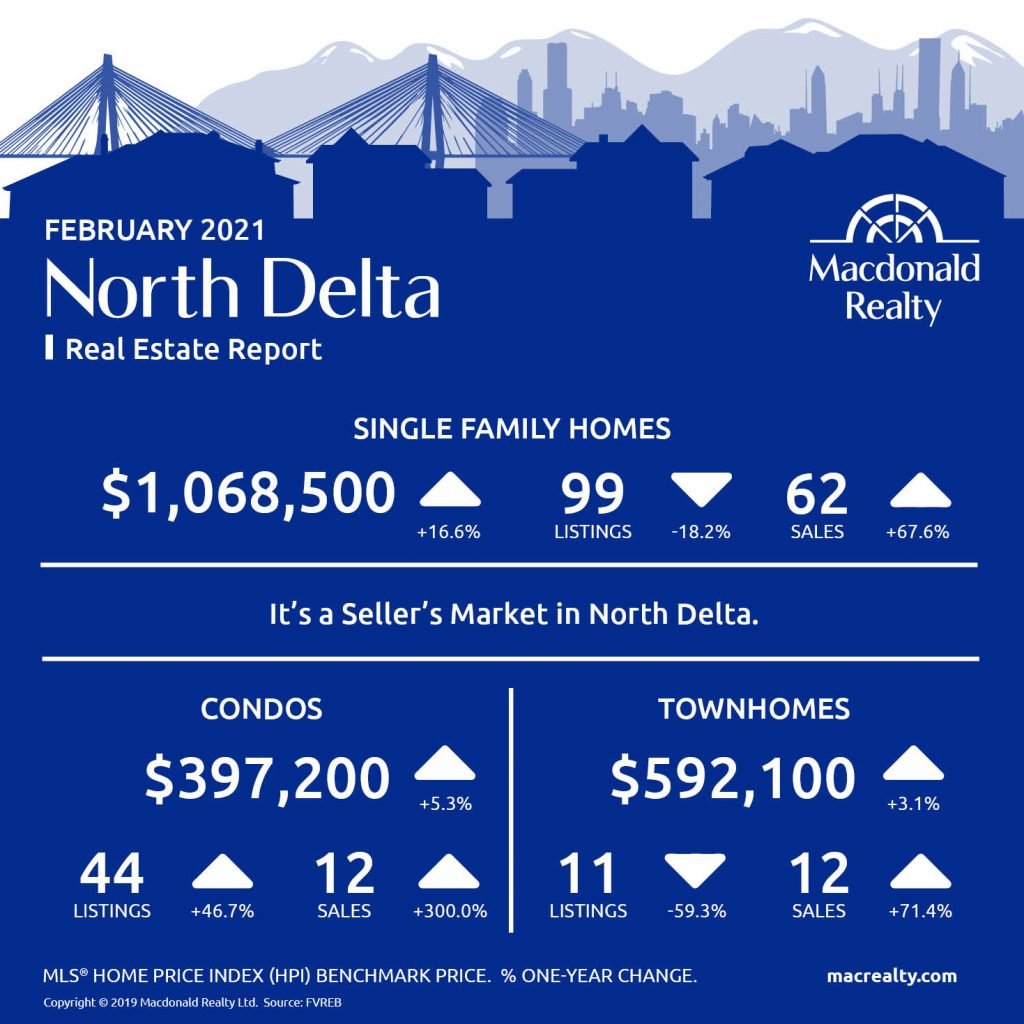
As released by the FVREB “In February, the FVREB processed a total of 2,815 sales on its Multiple Listing Service® (MLS®), an increase of 108 per cent compared to February 2020 and 64 per cent more than were processed in January 2021. To provide a historical perspective, sales in February were 88 per cent above the 10‐year average for that month; and 18 per cent higher than the previous record of 2,387 sales in February 2016.”
Chris Shields, President of the Board said of this month’s record numbers, “This is new territory for us. We have never seen such consistent and persistent demand for housing in the Fraser Valley.
“What’s fueling the demand is the combination of record‐low interest rates and the response to the pandemic. It’s not something that could have been predicted and it has created a very complex market for buyers that requires the knowledge and expertise of a professional. For family‐sized homes, prices climbed 3 to 5 per cent in February alone and sold on average in three weeks. We understand the stress and frustration with the market currently and we’re here to help guide and protect home buyers.”
Find all the infographics related to the May Market Statistics by visiting the Facebook Album.
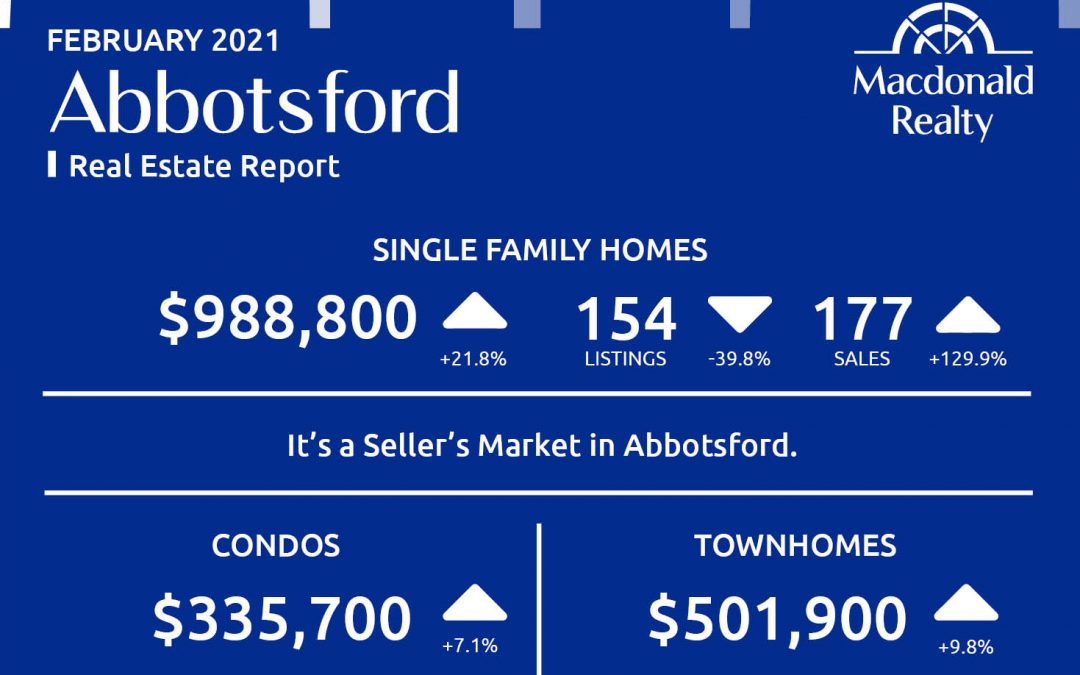
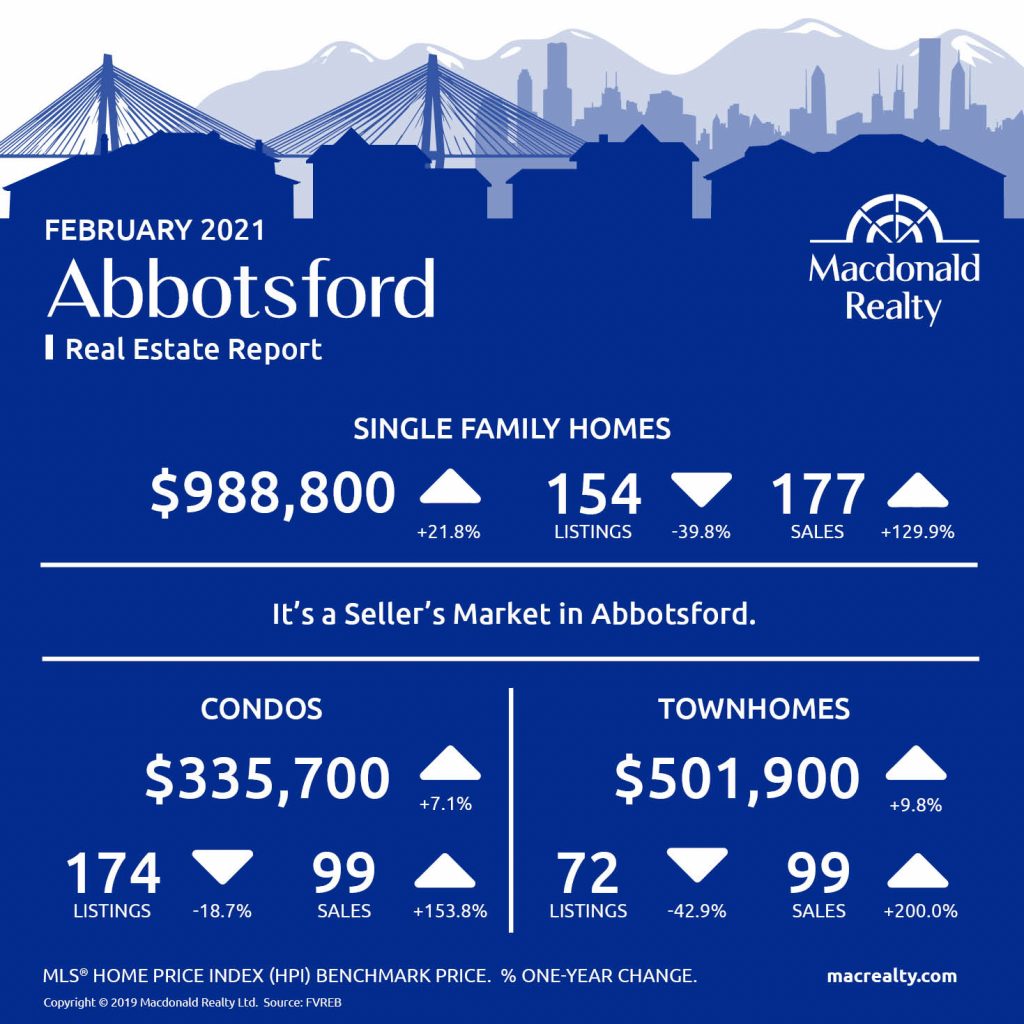
Abbotsford
Cloverdale
Langley
Mission
North Delta
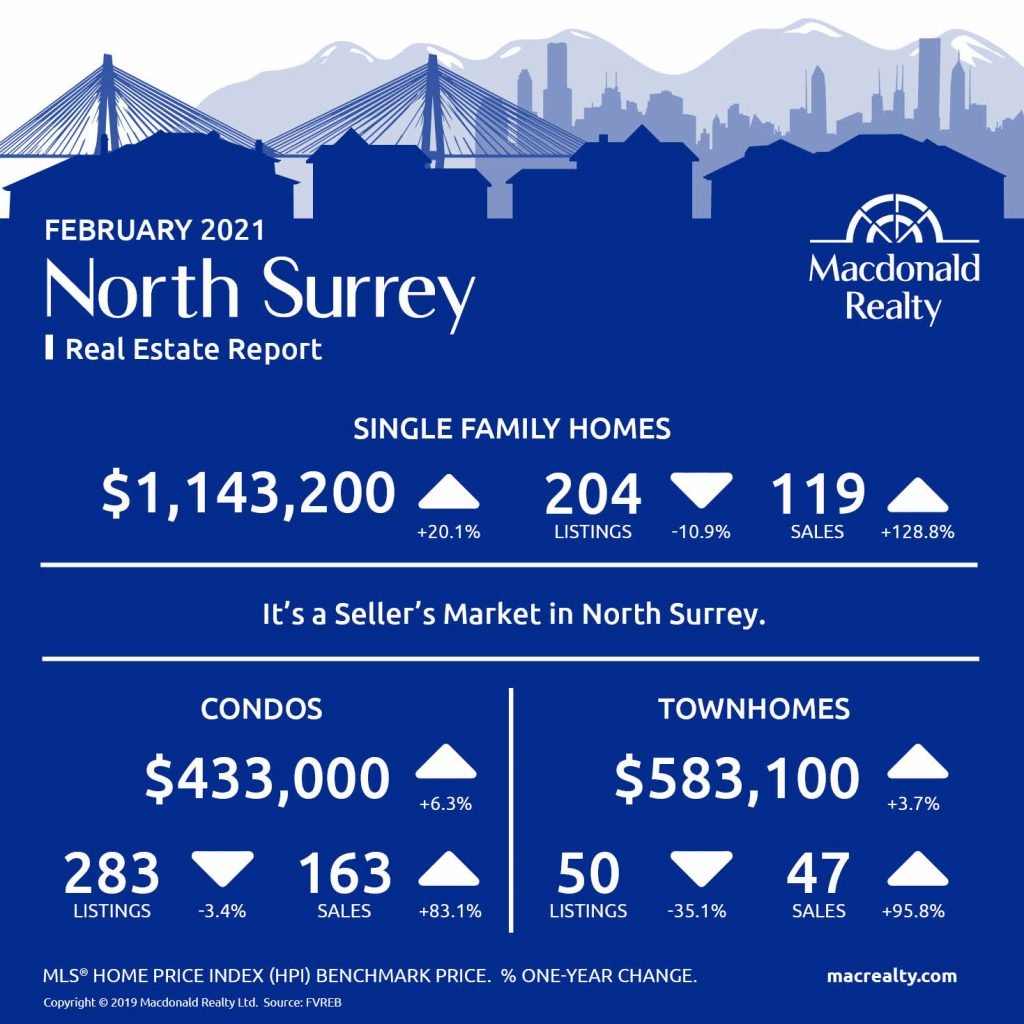
North Surrey
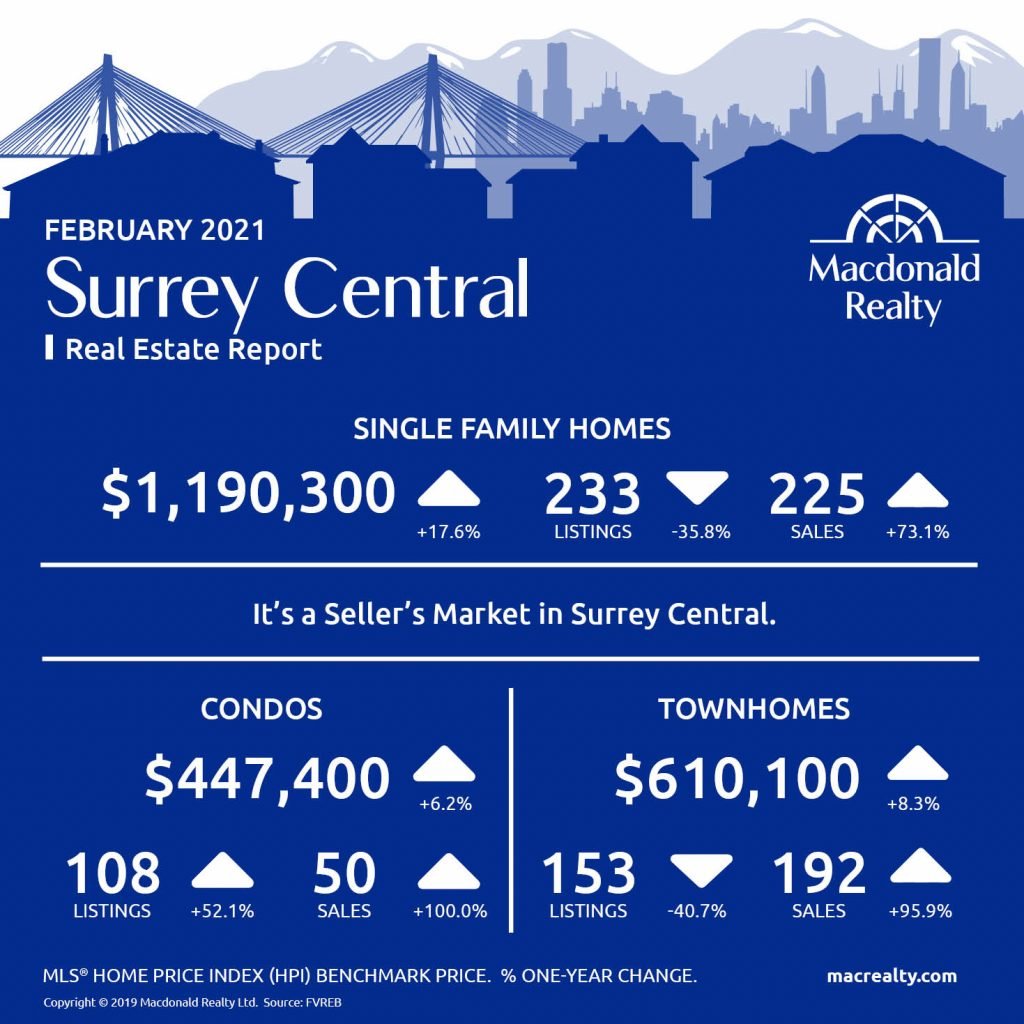
Surrey Central
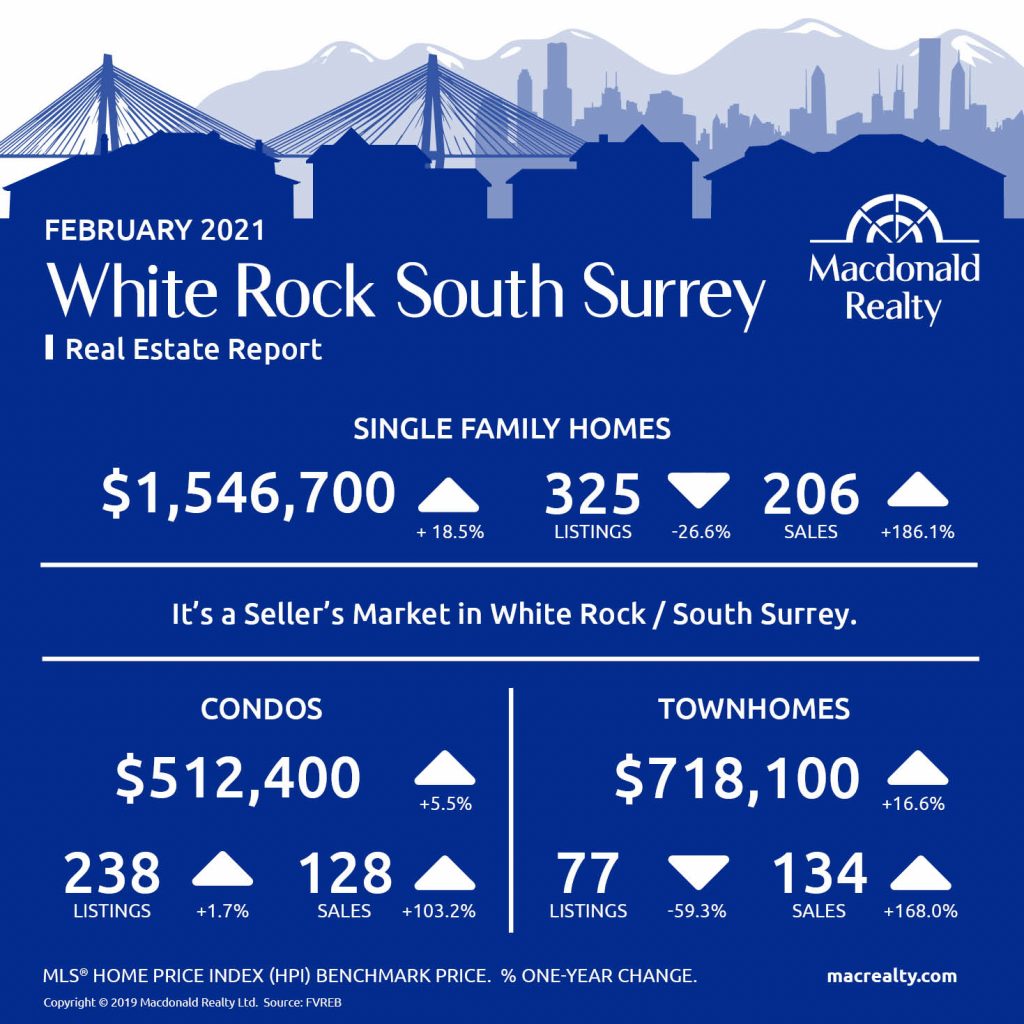
White Rock / South Surrey
Looking for more information about the real estate market in specific neighbourhoods in Surrey, Langley and Fraser Valley?
Macdonald Realty has offices in North Delta, White Rock/South Surrey, and Langley. Please email [email protected] or call 1-877-278-3888 to be matched with a REALTOR® working in your area.
MLS® Home Price Index (HPI) Benchmark Price
Average and median home prices are often misinterpreted, are affected by change in the mix of homes sold, and can swing dramatically from month to month (based on the types and prices of properties that sold in a given month). The MLS® HPI overcomes these shortcomings and uses the concept of a benchmark home, a notional home with common attributes of typical homes in a defined area. Visit www.housepriceindex.ca for more information.
This blog post is based on market data provided by the Fraser Valley Real Estate Board (FVREB) www.fvreb.bc.ca
by Macrealty Marketing Team | Mar 3, 2021 | Market Updates
Here are the latest real estate market statistics from Macdonald Realty on Greater Victoria, Parksville/Qualicum, and Nanaimo listings and sales in February 2021.
Find all the infographics related to the February Market Statistics by visiting the Facebook Album.
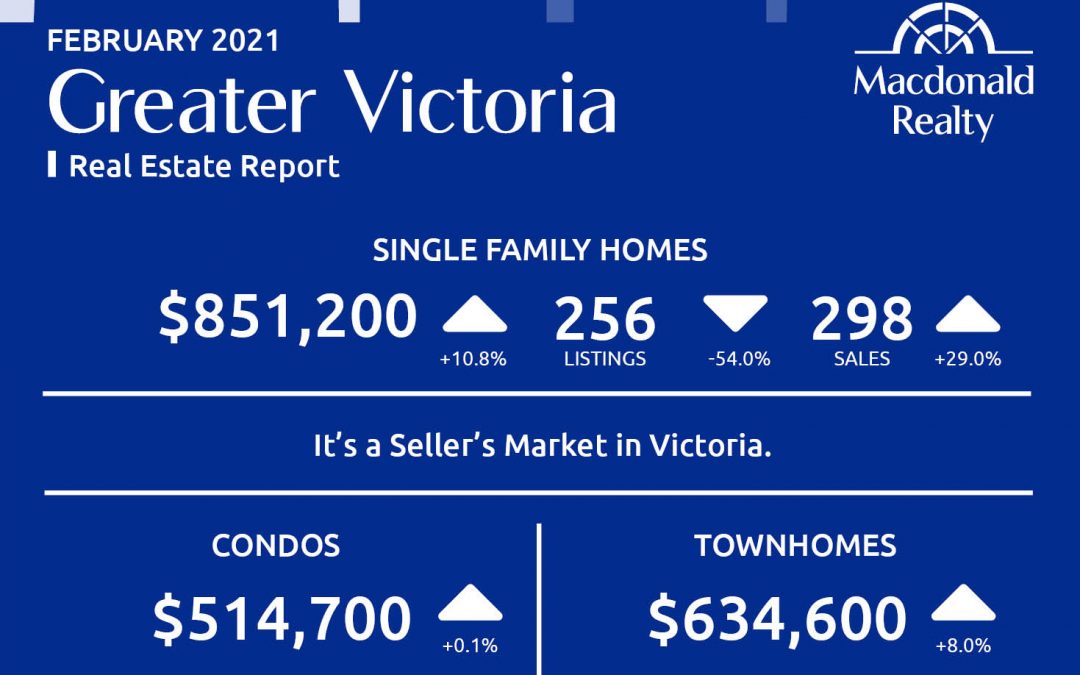
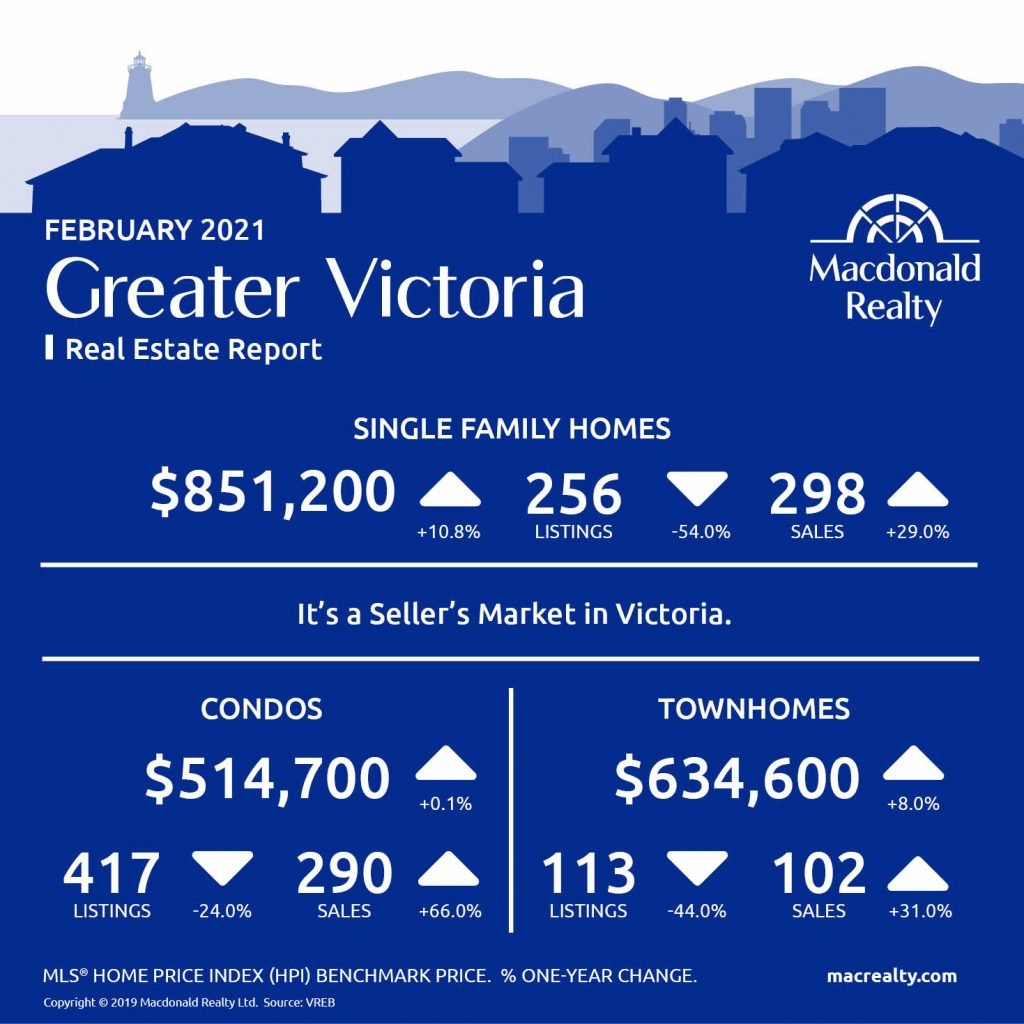
Greater Victoria
According to the Victoria Real Estate Board “A total of 863 properties sold in the Victoria Real Estate Board region this February, 53.3 per cent more than the 563 properties sold in February 2020 and 33.6 per cent more than the previous month of January. Sales of condominiums were up 65.7 per cent from February 2020 with 290 units sold. Sales of single family homes were up 43.9 per cent from February 2020 with 390 sold.”
“Our early spring market is in full swing carrying on from a fast start in January,” said Victoria Real Estate Board President David Langlois. “Our market remains one with tightly constrained inventory and high demand. The good news is that we have seen some stabilization in listings and condo pricing between January and February, but we continue to see huge pressure on single family homes – new listings are snapped up as soon as they are listed. As a result, the pressure on single family homes continues to ramp up. There is significant competition for desirable homes – and in our marketplace most homes are desirable – and people competing for properties pushes prices up.”
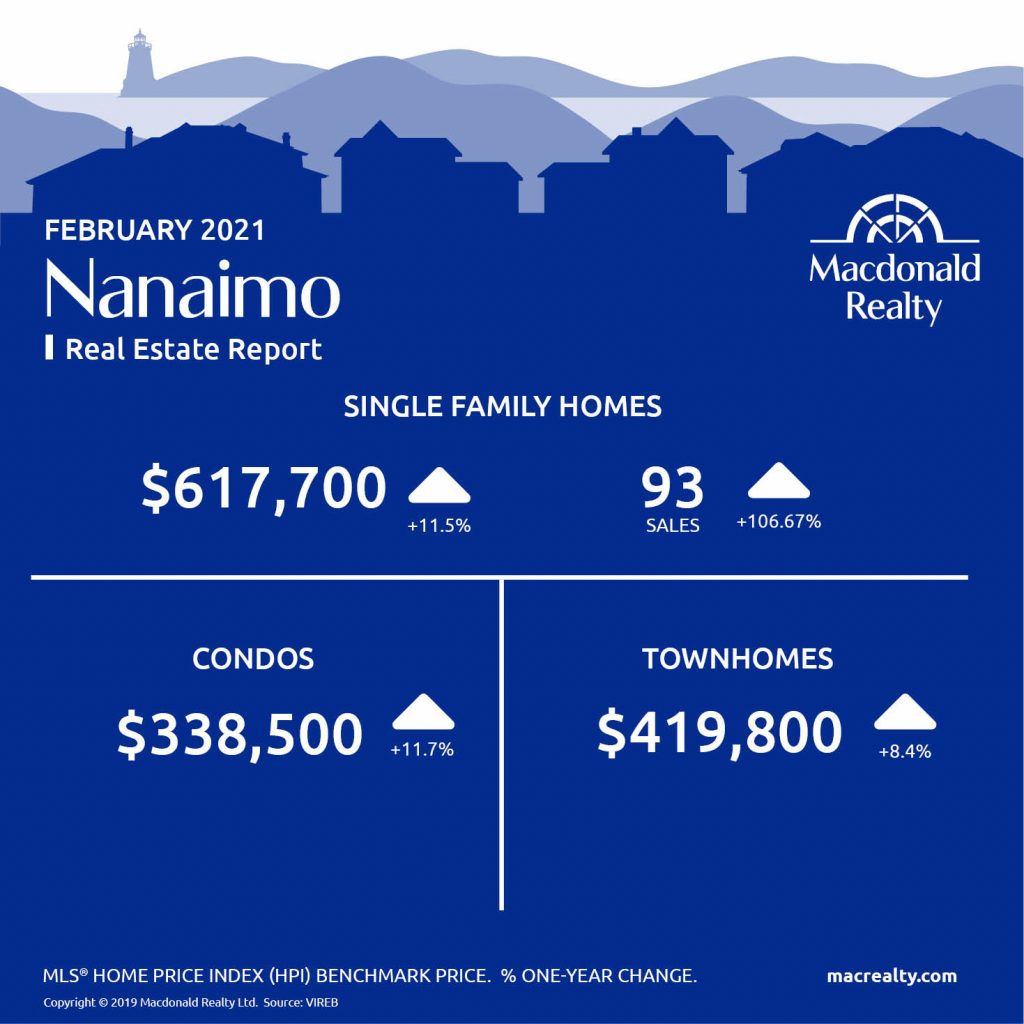
Nanaimo
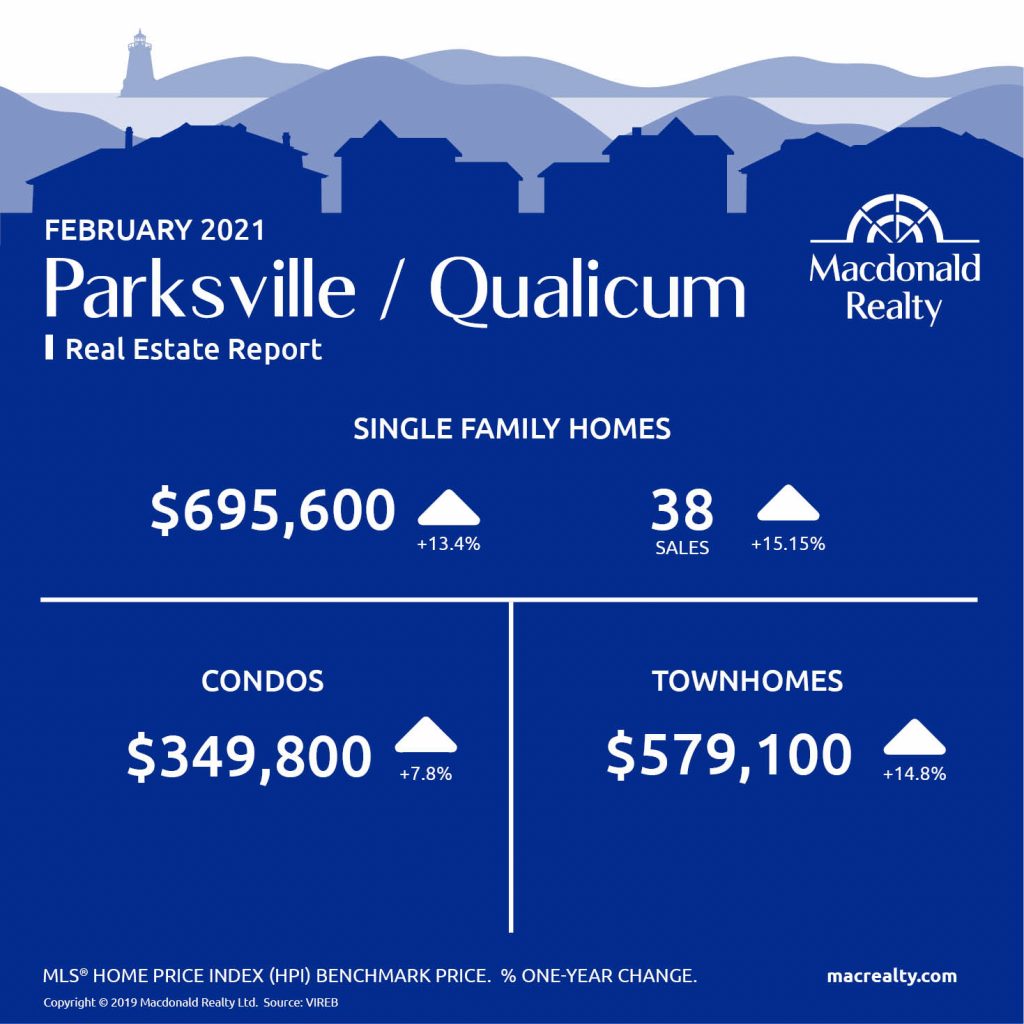
Parksville / Qualicum
Looking for more information about the real estate market in specific neighbourhoods in Victoria, Parksville, Nanaimo, Vancouver Island and the Gulf Islands?
Macdonald Realty has offices in downtown Victoria, Sidney, Parksville and Salt Spring Island. Please email [email protected] or call 1-877-278-3888 to be matched with a REALTOR® working in your area.
MLS® Home Price Index (HPI) Benchmark Price
Average and median home prices are often misinterpreted, are affected by change in the mix of homes sold, and can swing dramatically from month to month (based on the types and prices of properties that sold in a given month). The MLS® HPI overcomes these shortcomings and uses the concept of a benchmark home, a notional home with common attributes of typical homes in a defined area. Visit www.housepriceindex.ca for more information.
This blog post is based on market data provided by the Victoria Real Estate Board (VREB) www.vreb.org and the Vancouver Island Real Estate Board (VIREB) www.vireb.com. Market data from the VIREB includes listings and sales in Campbell River, Comox Valley, Cowichan Valley Nanaimo, Parksville/Qualicum, Port Alberni/West, North Island, and the Islands.
by Macrealty Marketing Team | Feb 4, 2021 | Market Updates
Here are the latest real estate market statistics from Macdonald Realty on the Greater Vancouver listings and sales in January 2021.
Find all the infographics by visiting the Facebook Album.
The Real Estate Board of Greater Vancouver (REBGV) reports that residential home sales in the region totalled 2,389 in January 2021, a 52.1% increase from the 1,571 sales recorded in January 2020, and a 22.8% decrease from the 3,093 homes sold in December 2020.
Last month’s sales were 36.4% above the 10-year January sales average.
“With home sale activity well above our January average, the supply of homes for sale isn’t able to keep pace,” Colette Gerber, REBGV Chair said. “This is causing increased competition amongst home buyers and upward pressure on prices.”
Colette also has mentioned the COVID-19 season and low-interest rates:
“Shifting housing needs during the pandemic and historically low interest rates have been key drivers of demand in our market over the last six months,” Gerber said. “People who managed to enter the market a few years ago, and have seen their home values increase, are now looking to move up in the market to accommodate their changing needs.”
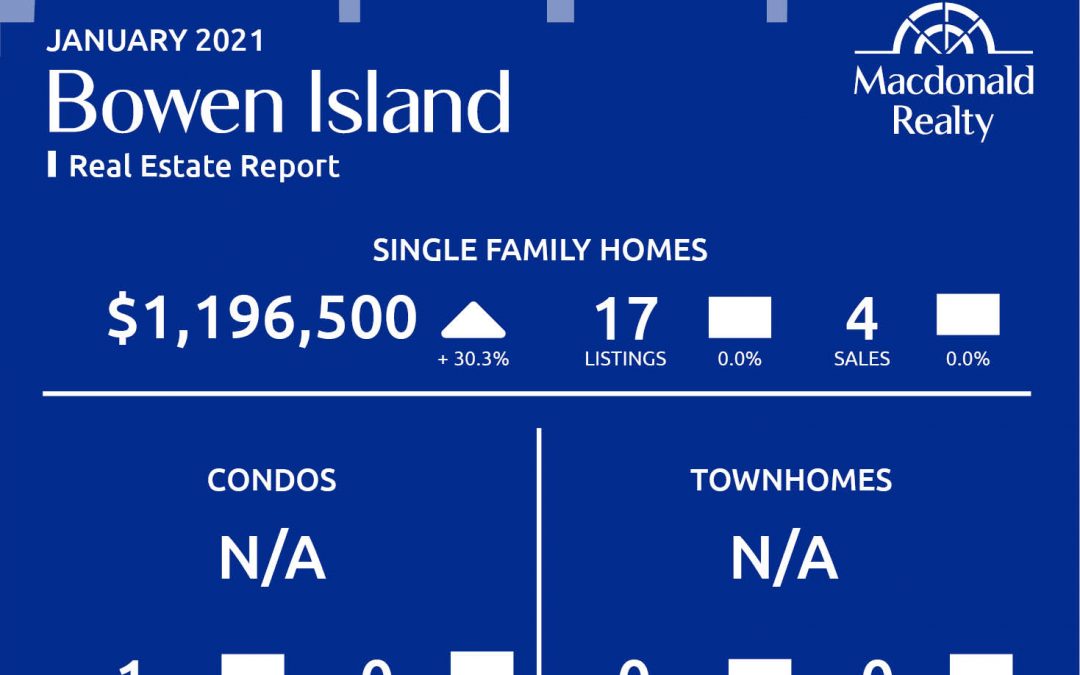
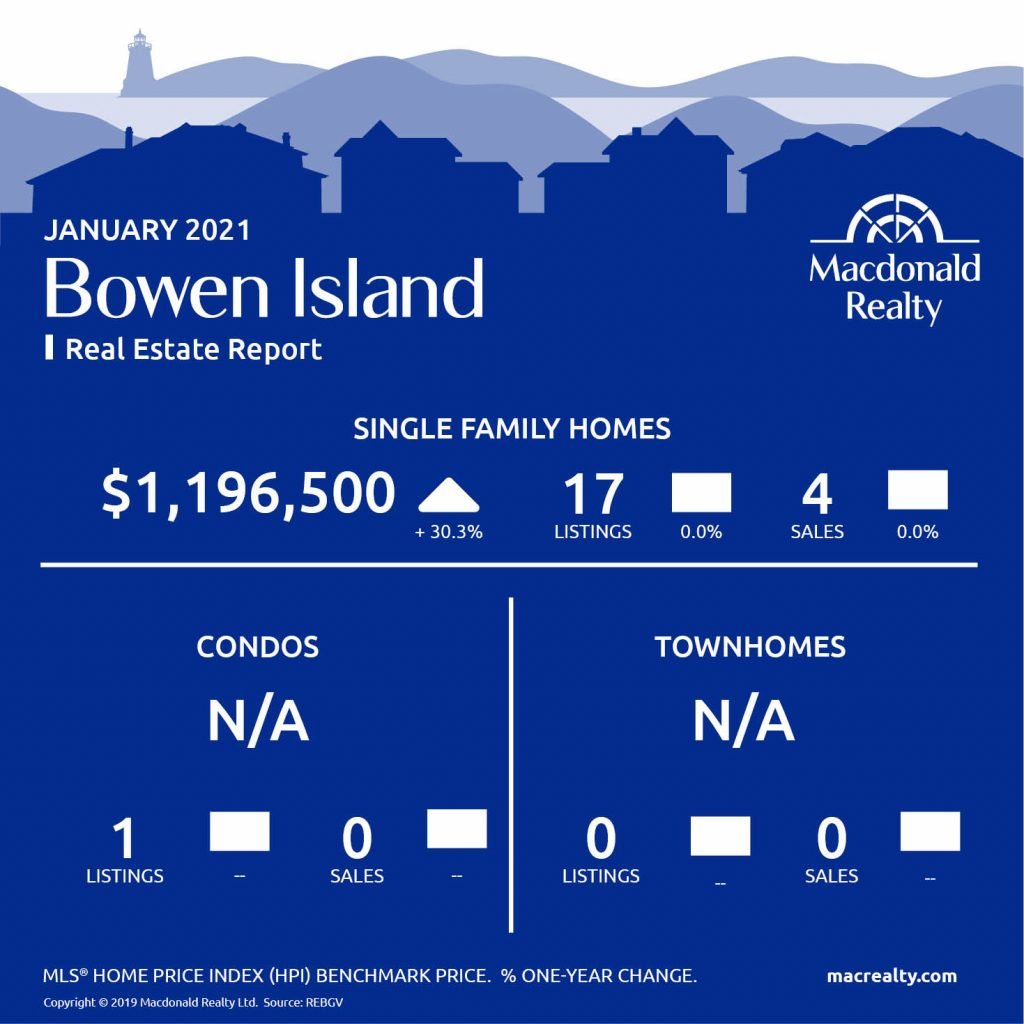
Bowen Island
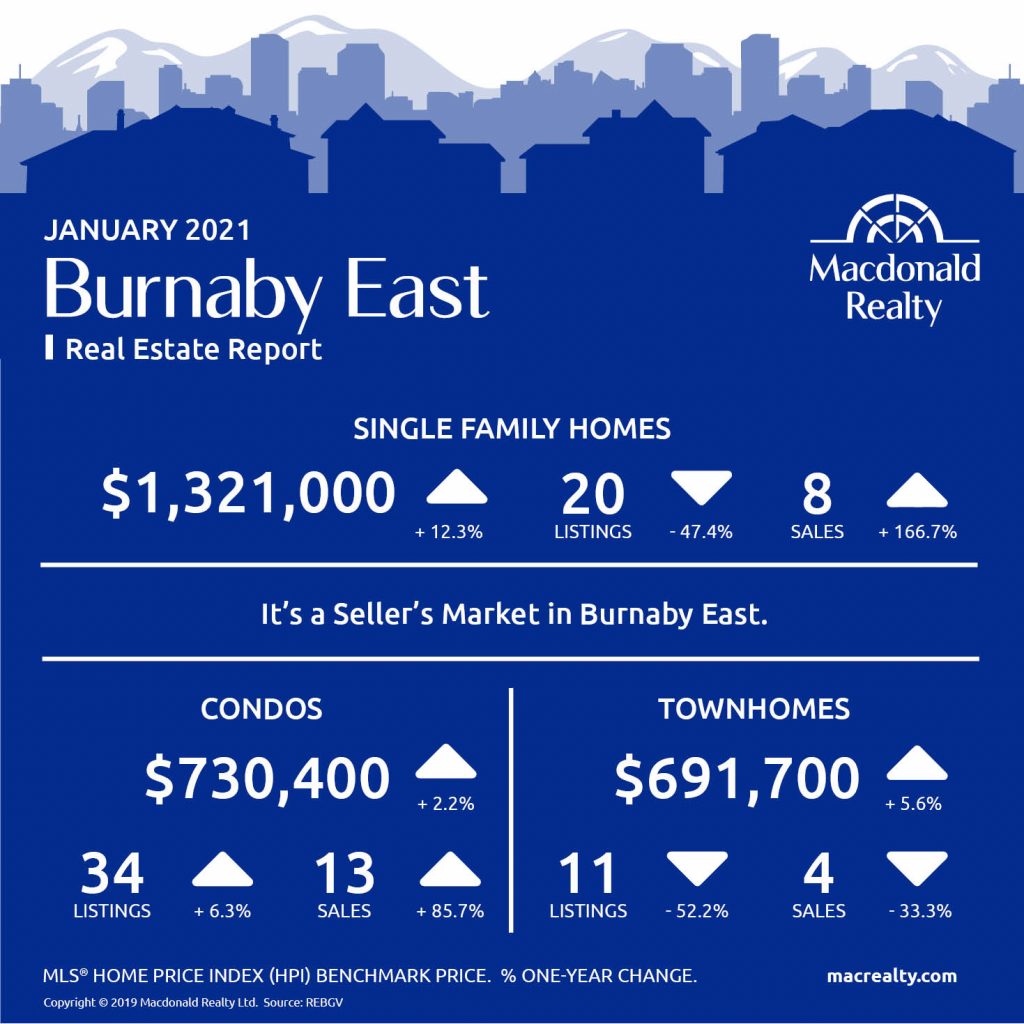
Burnaby East
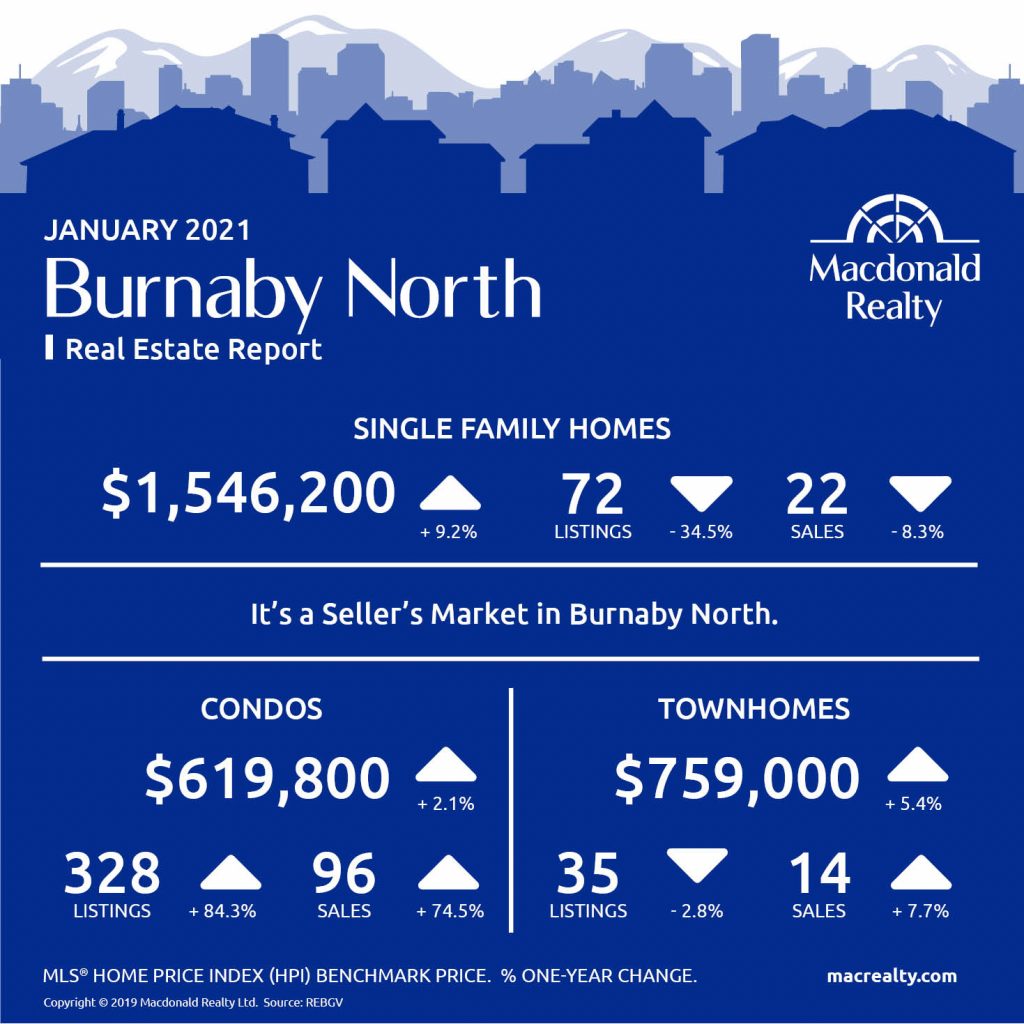
Burnaby North
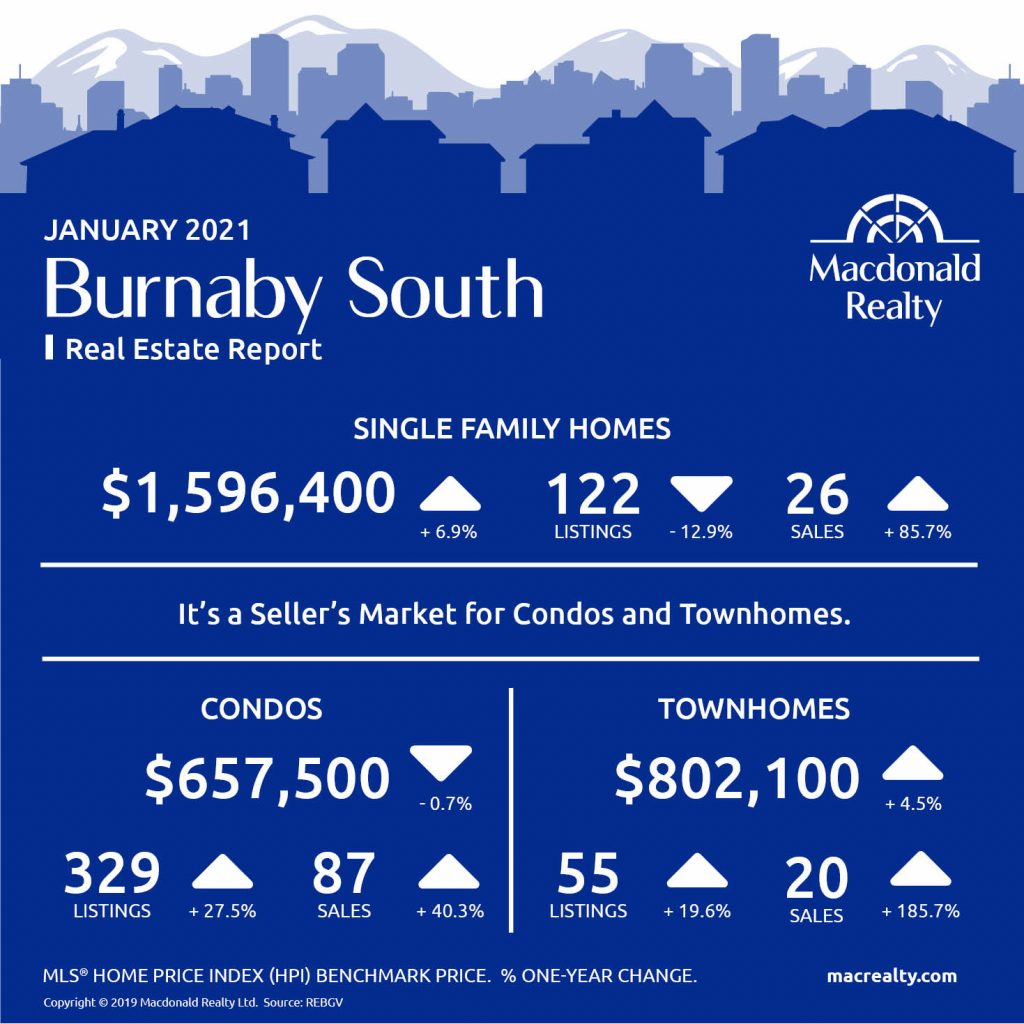
Burnaby South
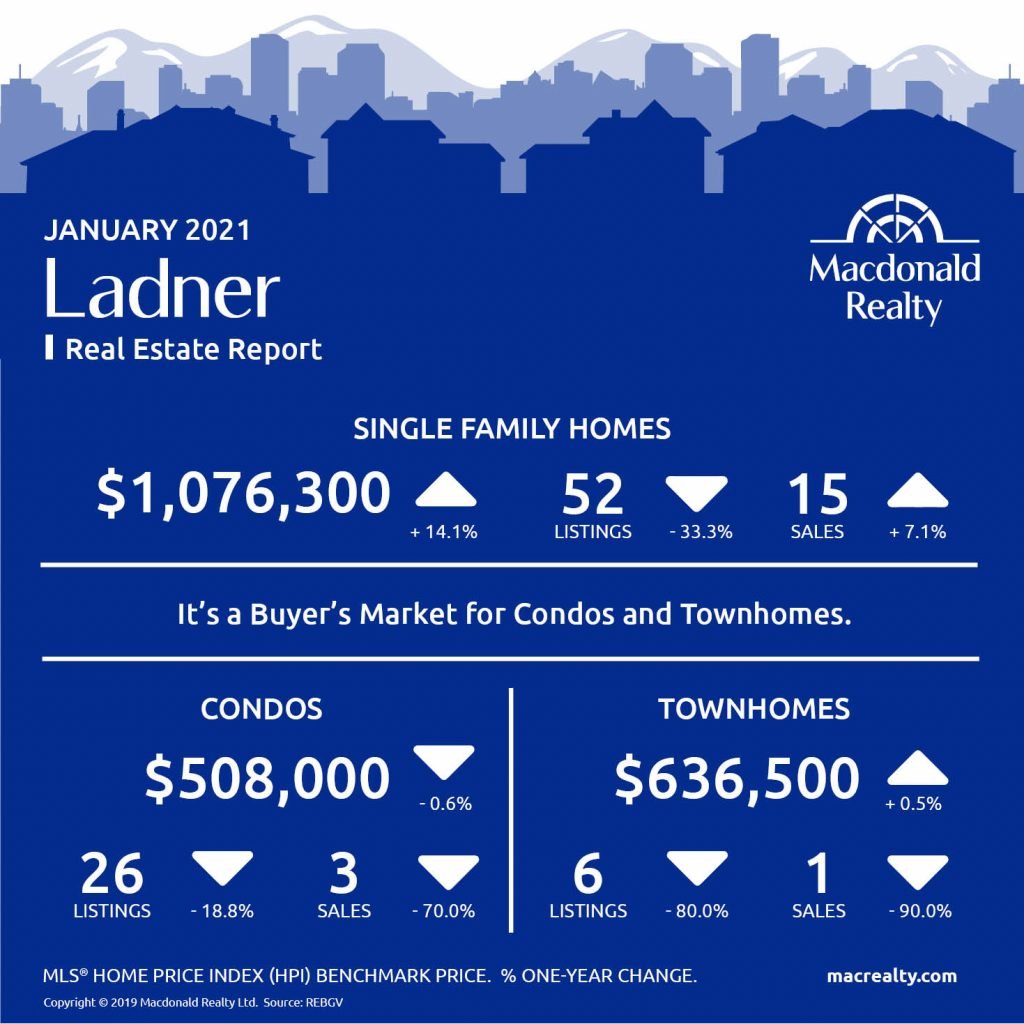
Ladner
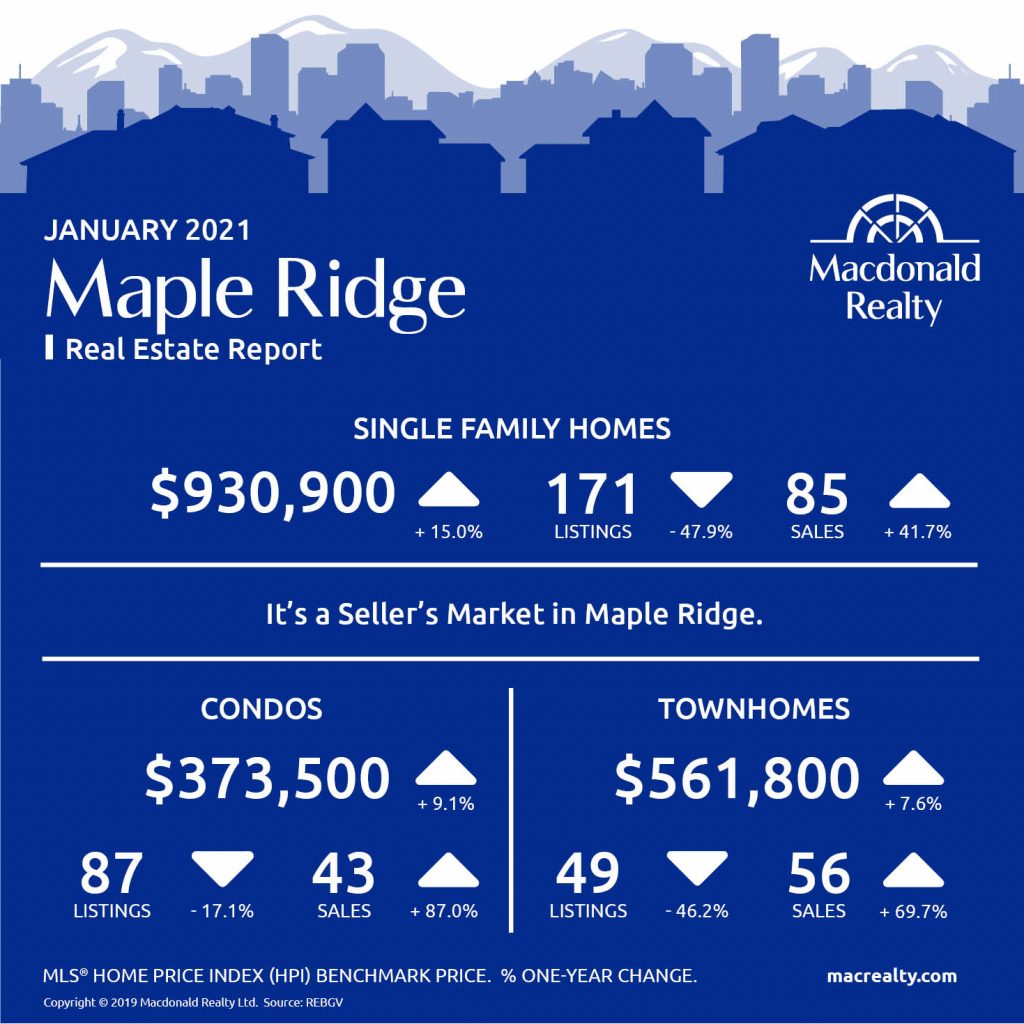
Maple Ridge
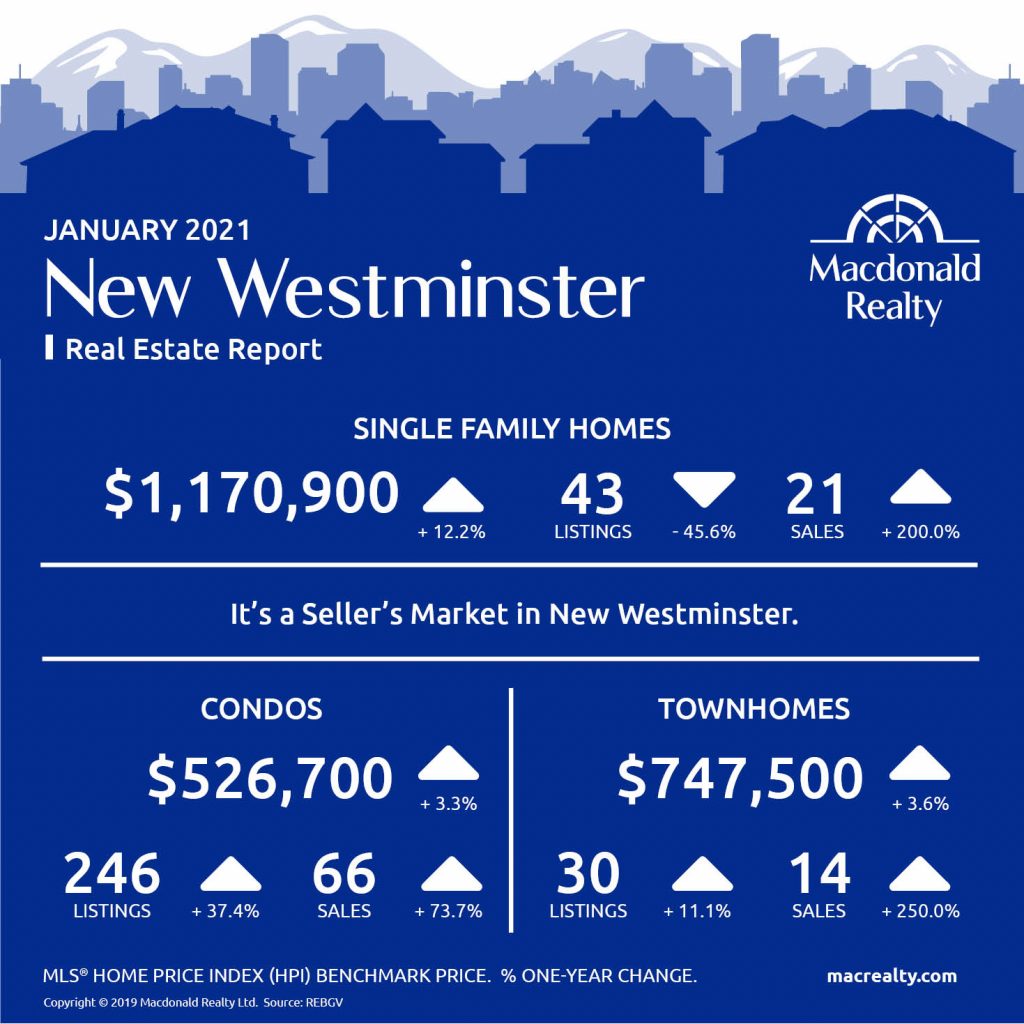
New Westminster
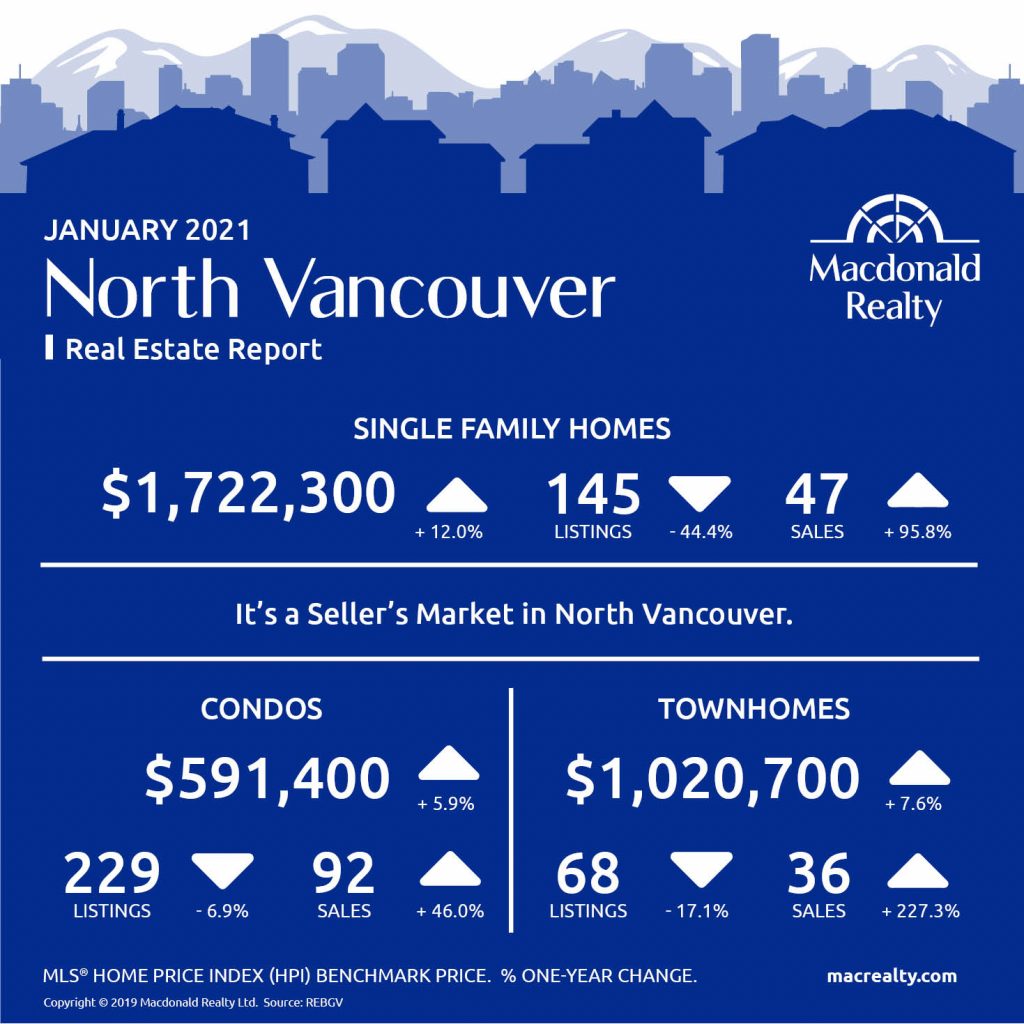
North Vancouver
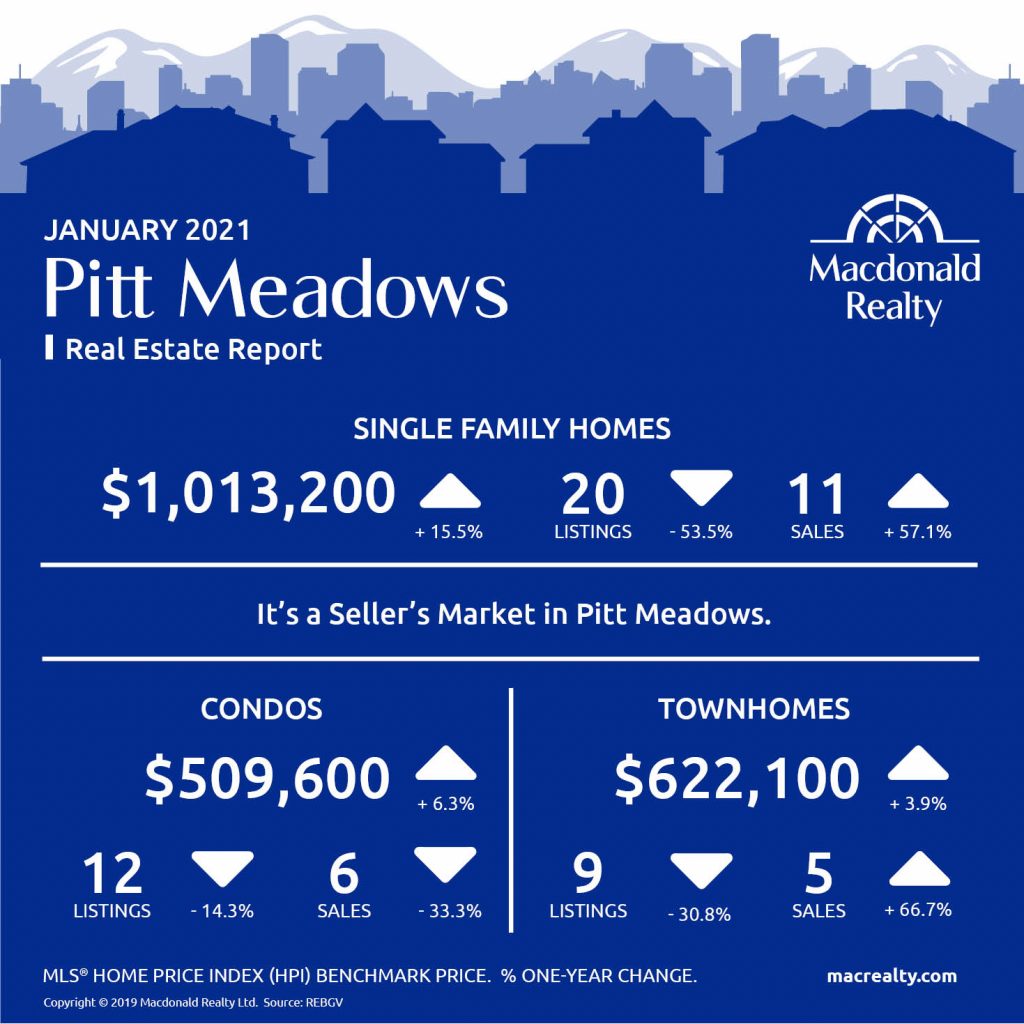
Pitt Meadows
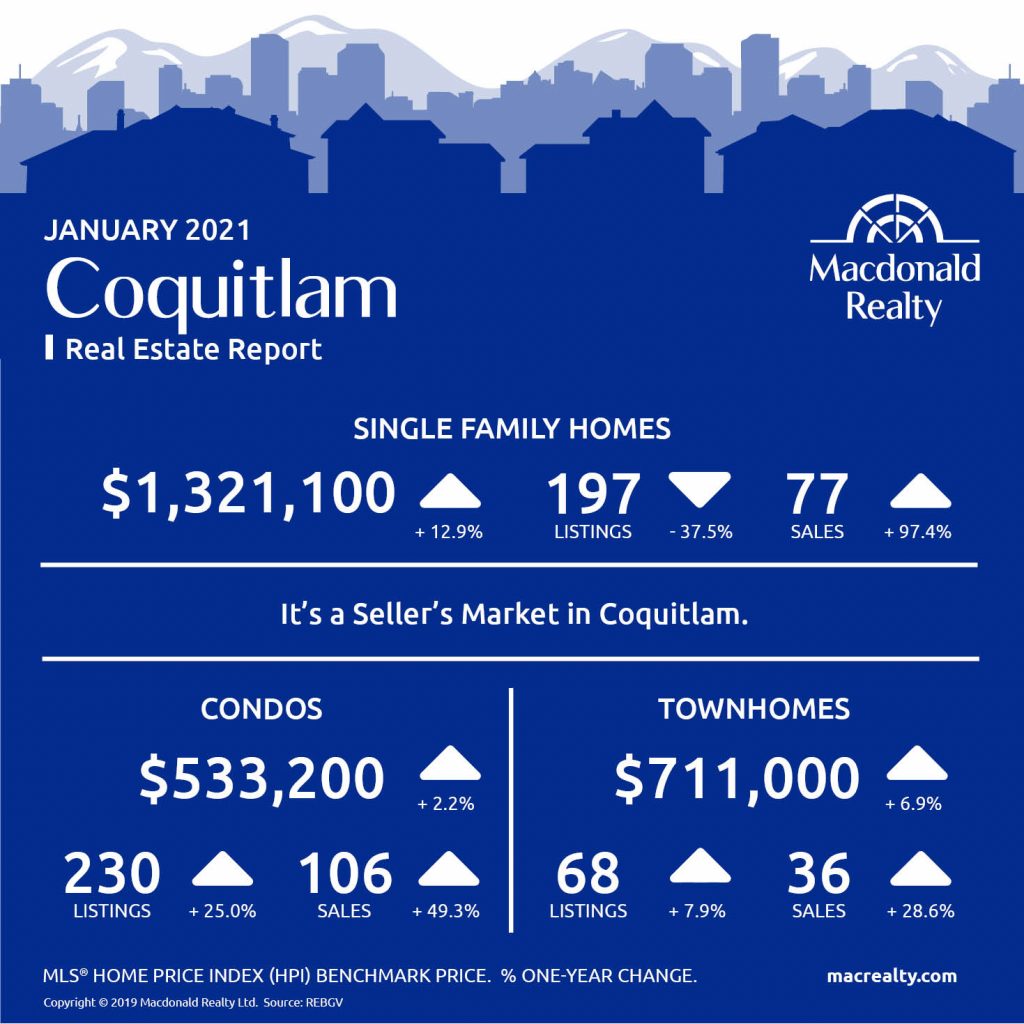
Coquitlam
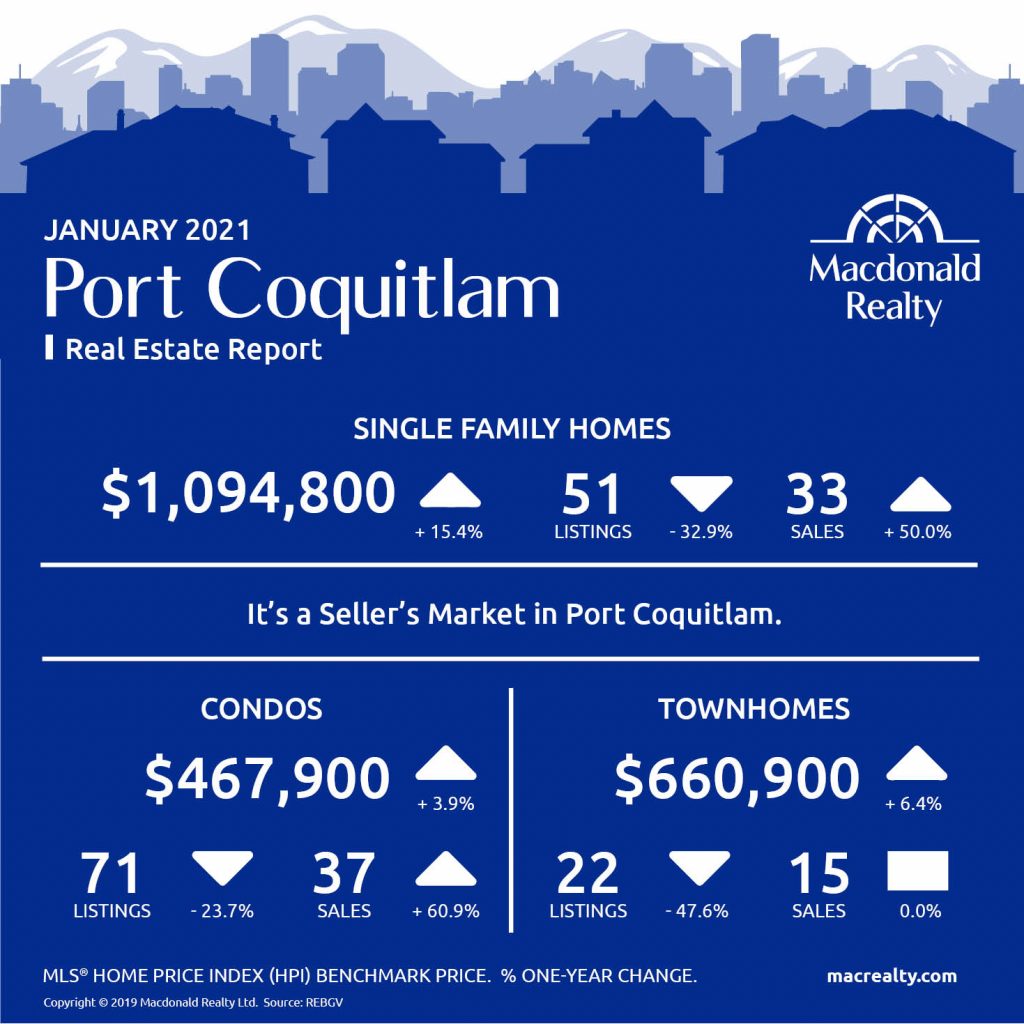
Port Coquitlam
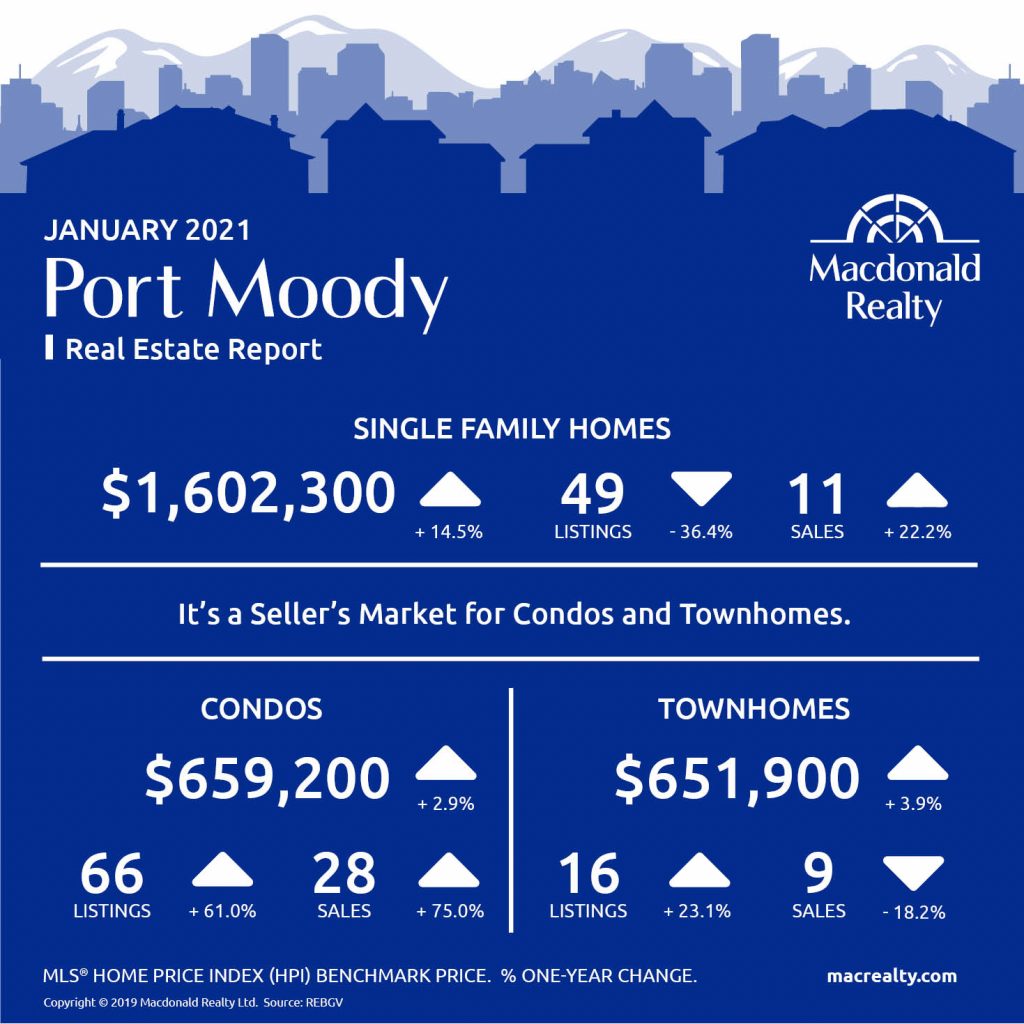
Port Moody
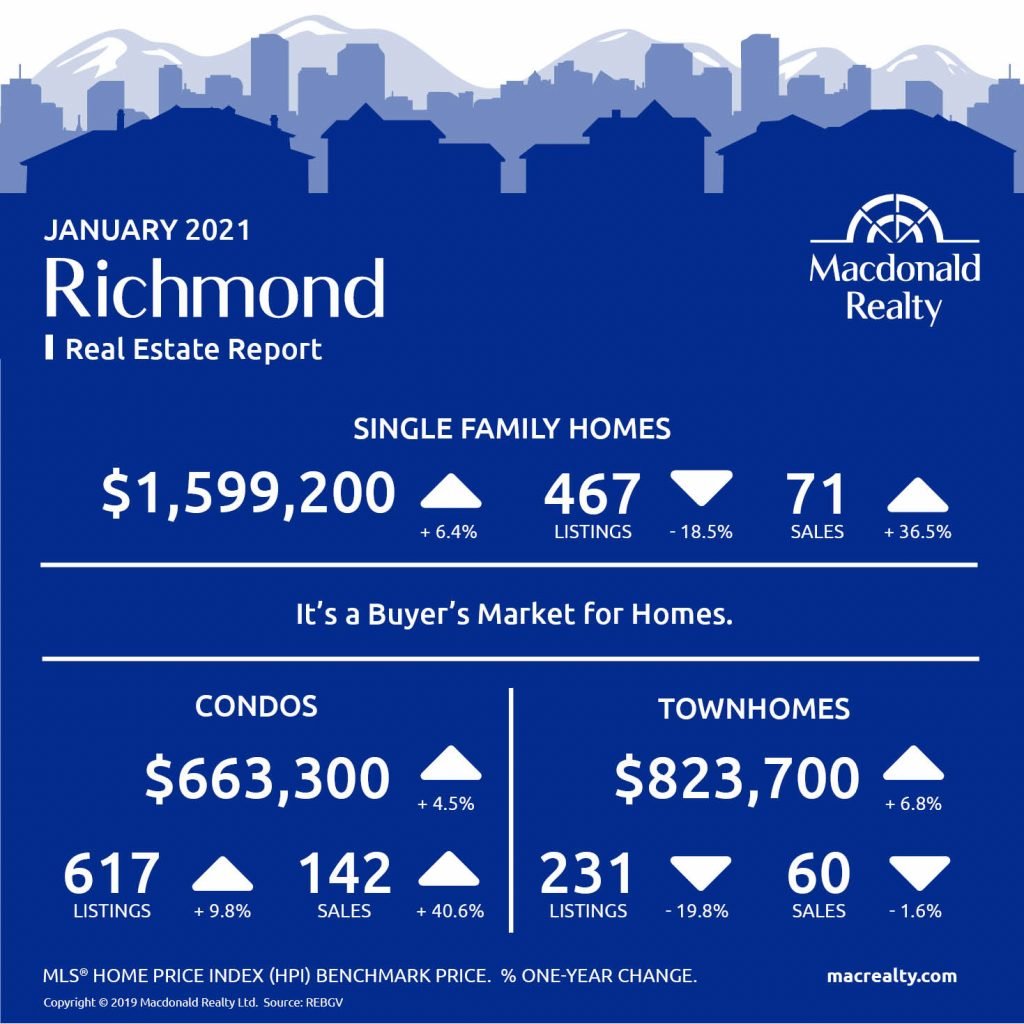
Richmond
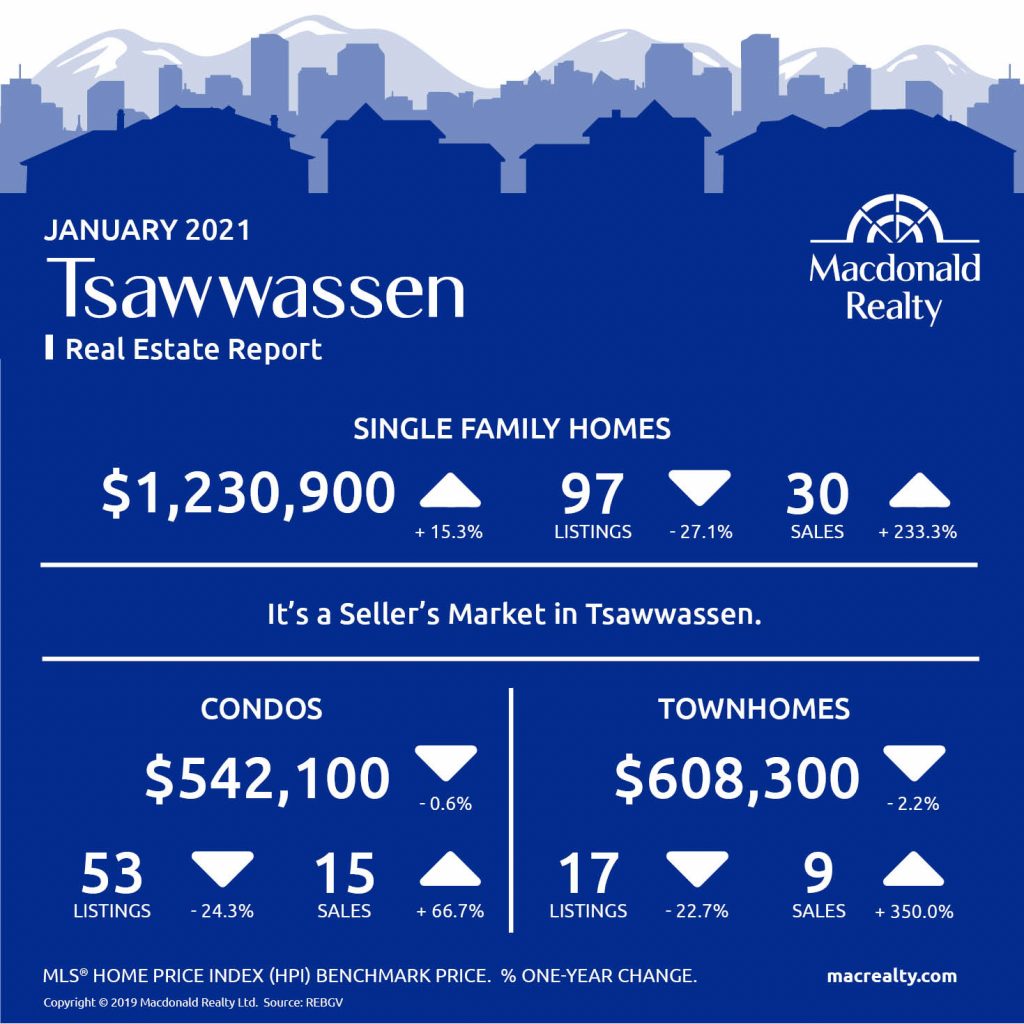
Tsawwassen
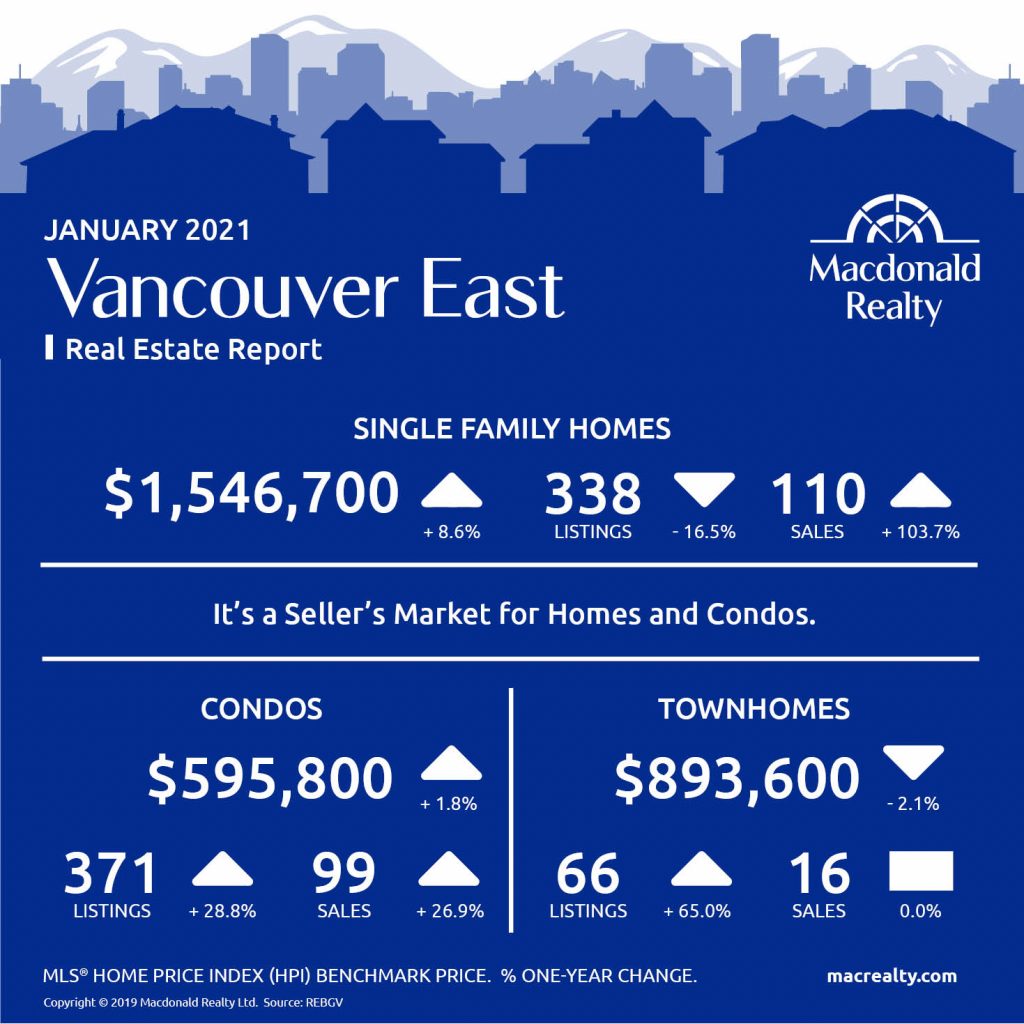
Vancouver East
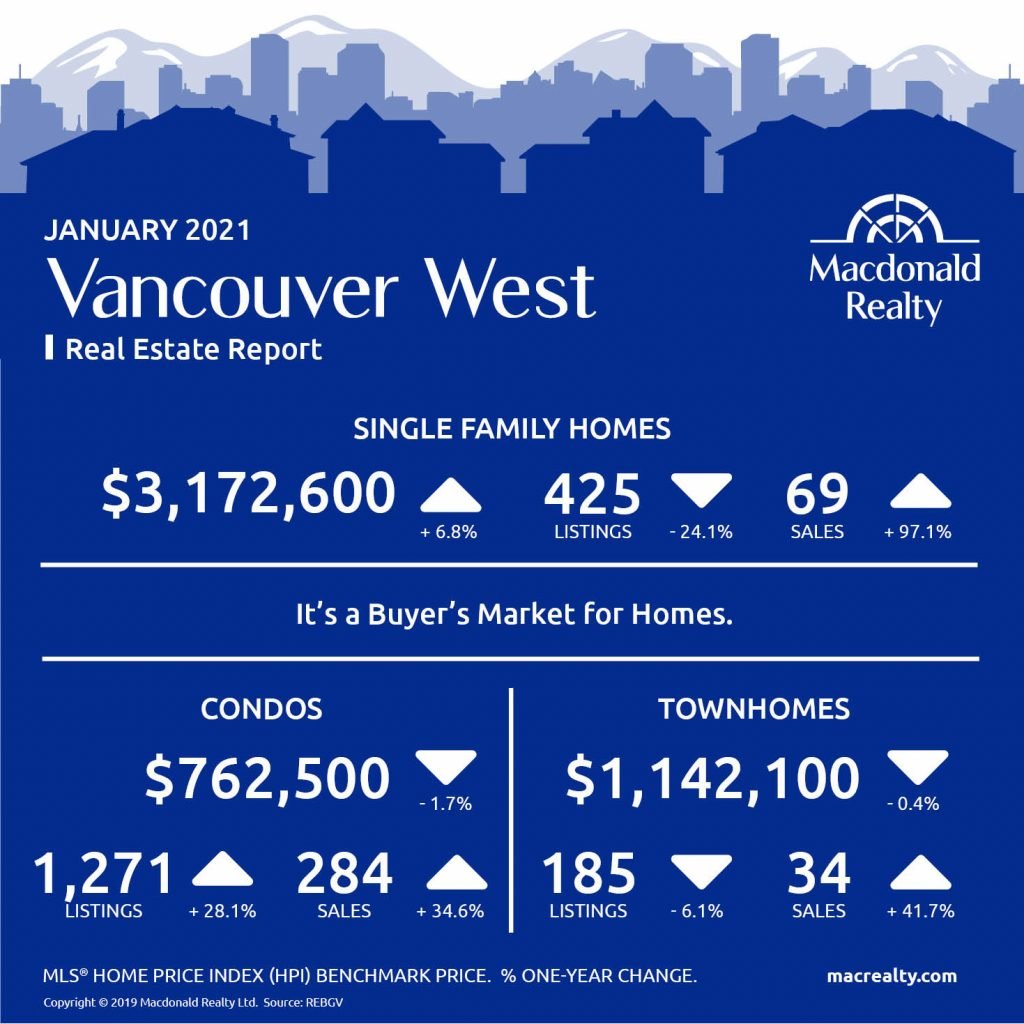
Vancouver West
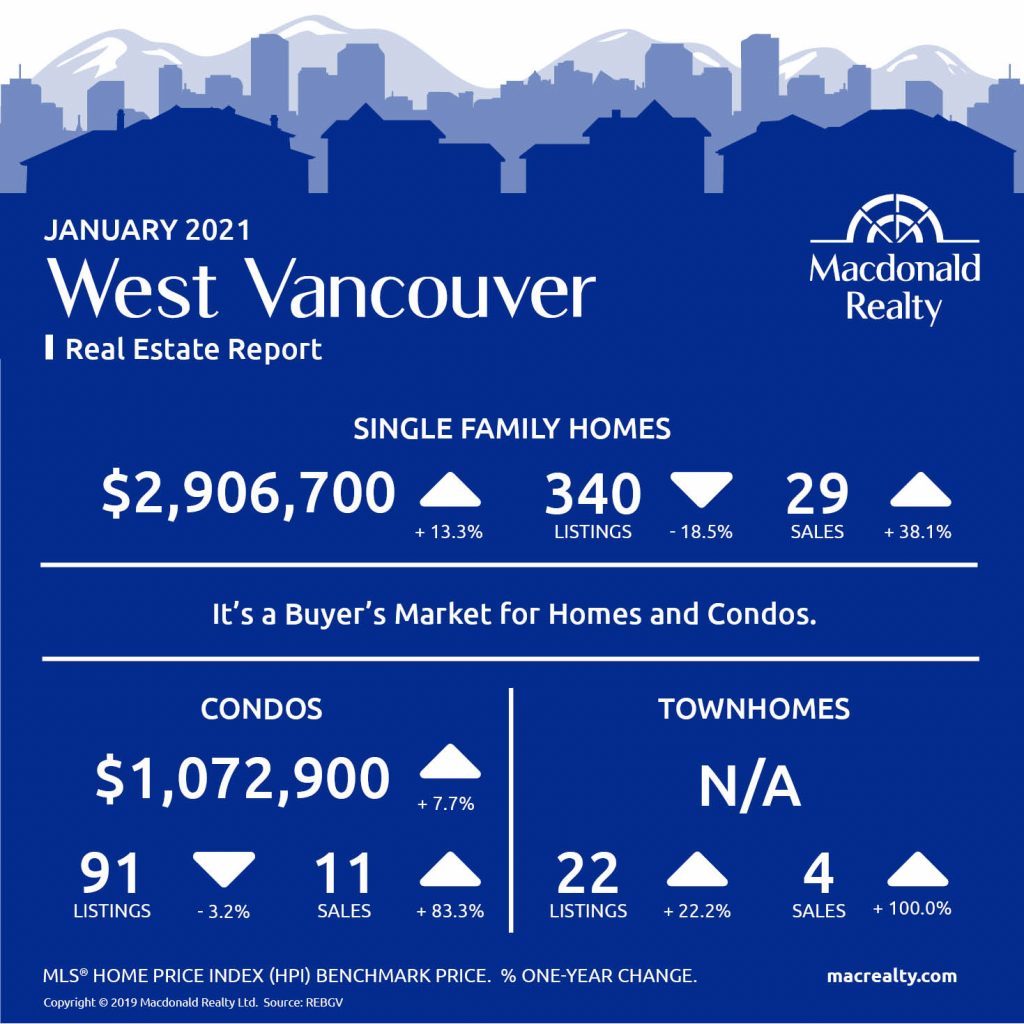
West Vancouver
Looking for more information about the real estate market in specific neighbourhoods in the Greater Vancouver?
Macdonald Realty has offices across the Greater Vancouver. Please email [email protected] or call 1-877-278-3888 to be matched with a REALTOR® working in your area.
MLS® Home Price Index (HPI) Benchmark Price
Average and median home prices are often misinterpreted, are affected by change in the mix of homes sold, and can swing dramatically from month to month (based on the types and prices of properties that sold in a given month). The MLS® HPI overcomes these shortcomings and uses the concept of a benchmark home, a notional home with common attributes of typical homes in a defined area. Visit www.housepriceindex.ca for more information.
This blog post is based on market data provided by the Real Estate Board of Greater Vancouver (REBGV) www.rebgv.org

