by Macrealty Marketing Team | May 5, 2021 | Market Updates
According to the Fraser Valley Real Estate Board “monthly sales and new listings in the Fraser Valley continue blistering pace; surge in inventory starting to calm prices”.
According to the board, for the 8th consecutive month, Fraser Valley real estate saw record‐breaking sales with April topping the previous monthly high set in 2016. The 2020/2021 pandemic seller’s market in the Fraser Valley has now surpassed the previous longest stretch of seven consecutive, record‐breaking months, last set in 2015/2016.
In April, also released by the Fraser Valley Real Estate Board (FVREB) processed 3,016 sales on its Multiple Listing Service® (MLS®), an increase of 338% compared to April 2020 and a 9% decrease compared to March. (Note that sales and new listings in April 2020 were significantly restricted due to the pandemic lockdown.) The previous record high for sales in April was 2,969 in 2016.
Larry Anderson, President of the Board, said of this month’s statistics, “Although it remains very competitive and challenging for buyers, April could be the turning point in this historic market. In the last couple of weeks, we have seen evidence of a change in pace.
“In general, we’re seeing fewer multiple offers, fewer subject‐free offers, and homes over‐priced are starting to sit longer. These are positive signs that the market is responding to near‐record levels of new inventory.”
Find all the infographics related to the April Market Statistics by visiting the Facebook Album.
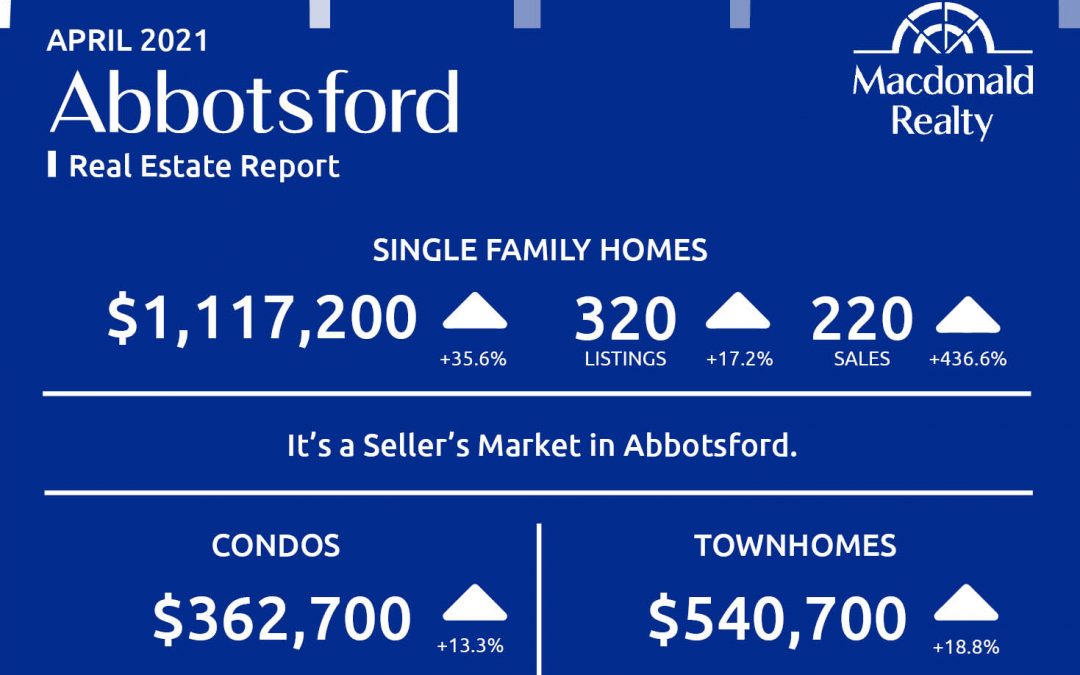
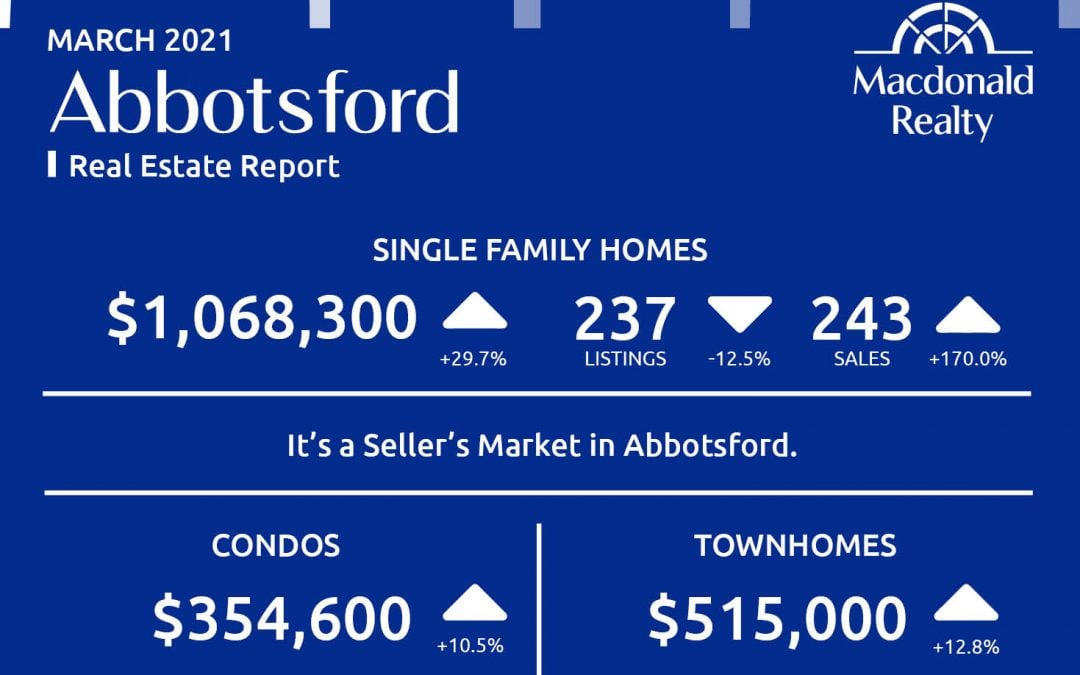
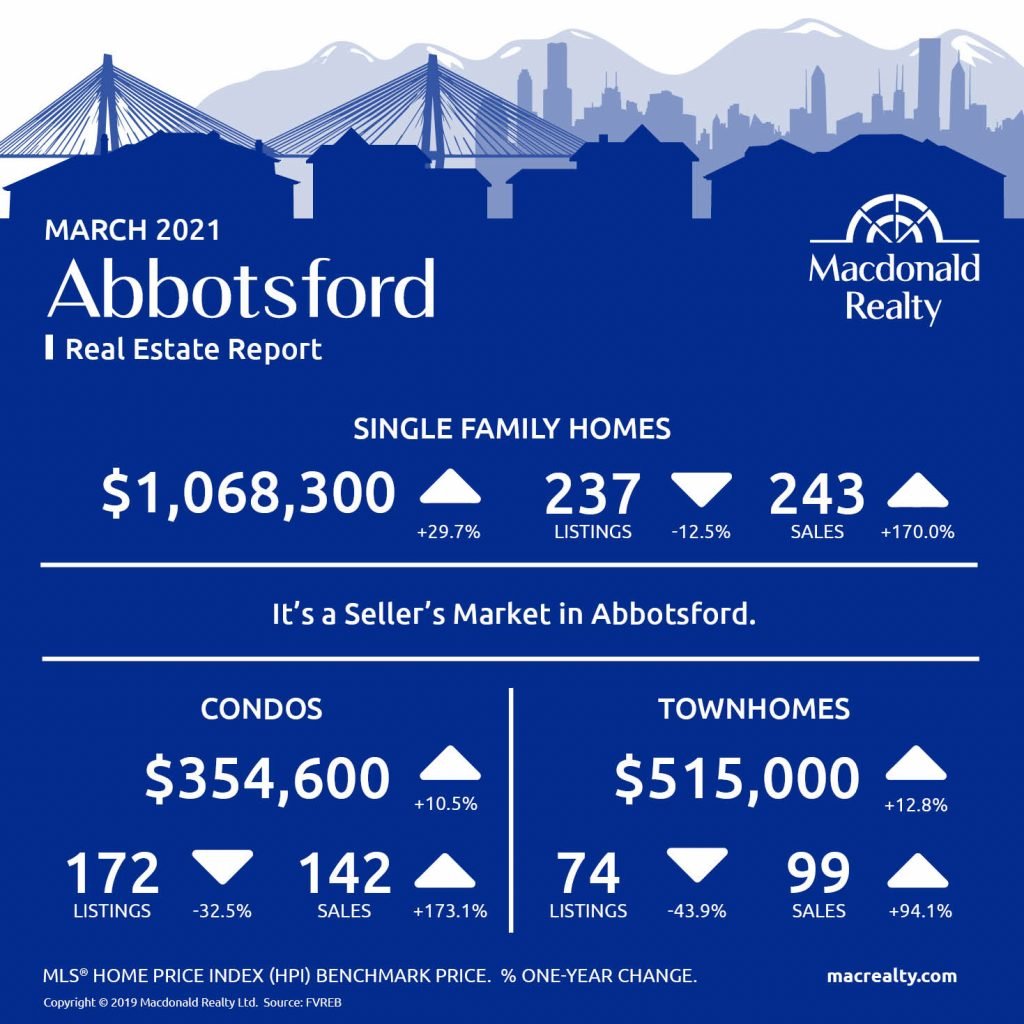
Abbotsford

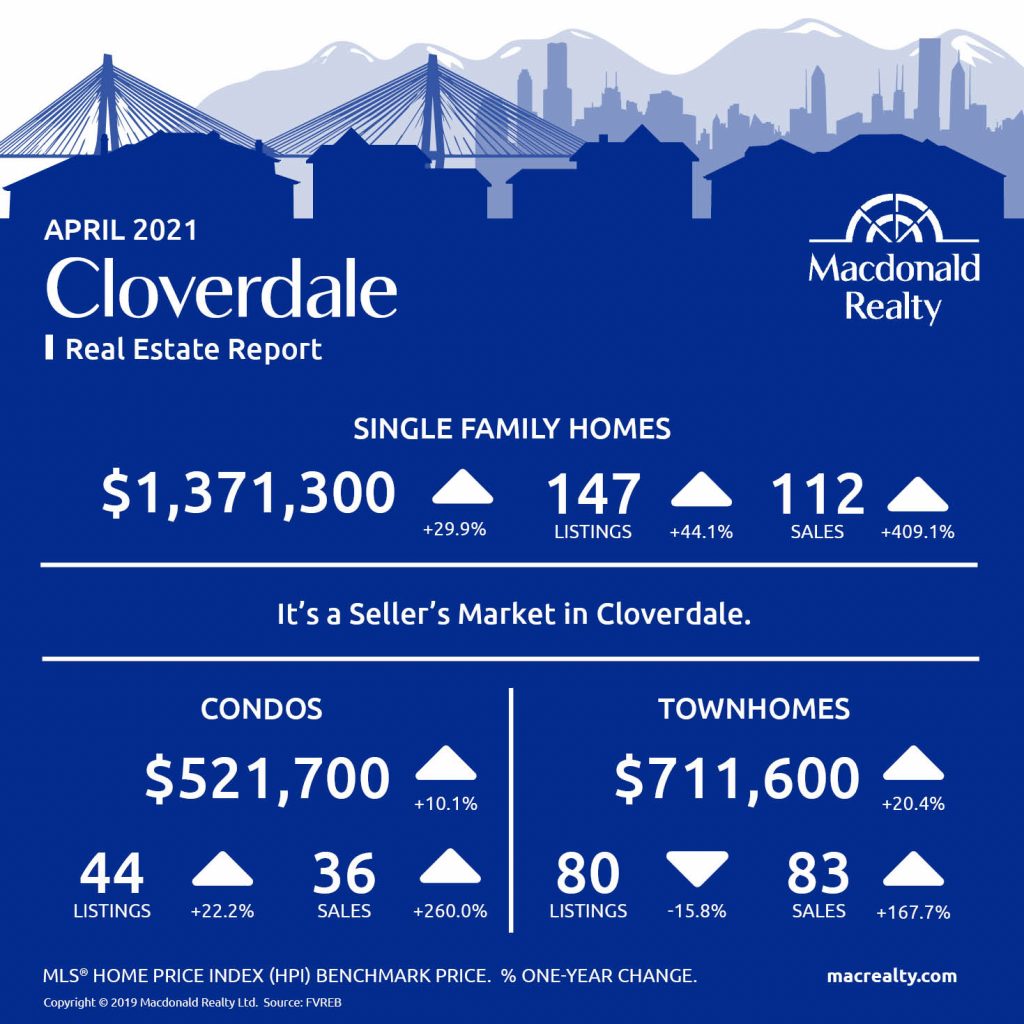
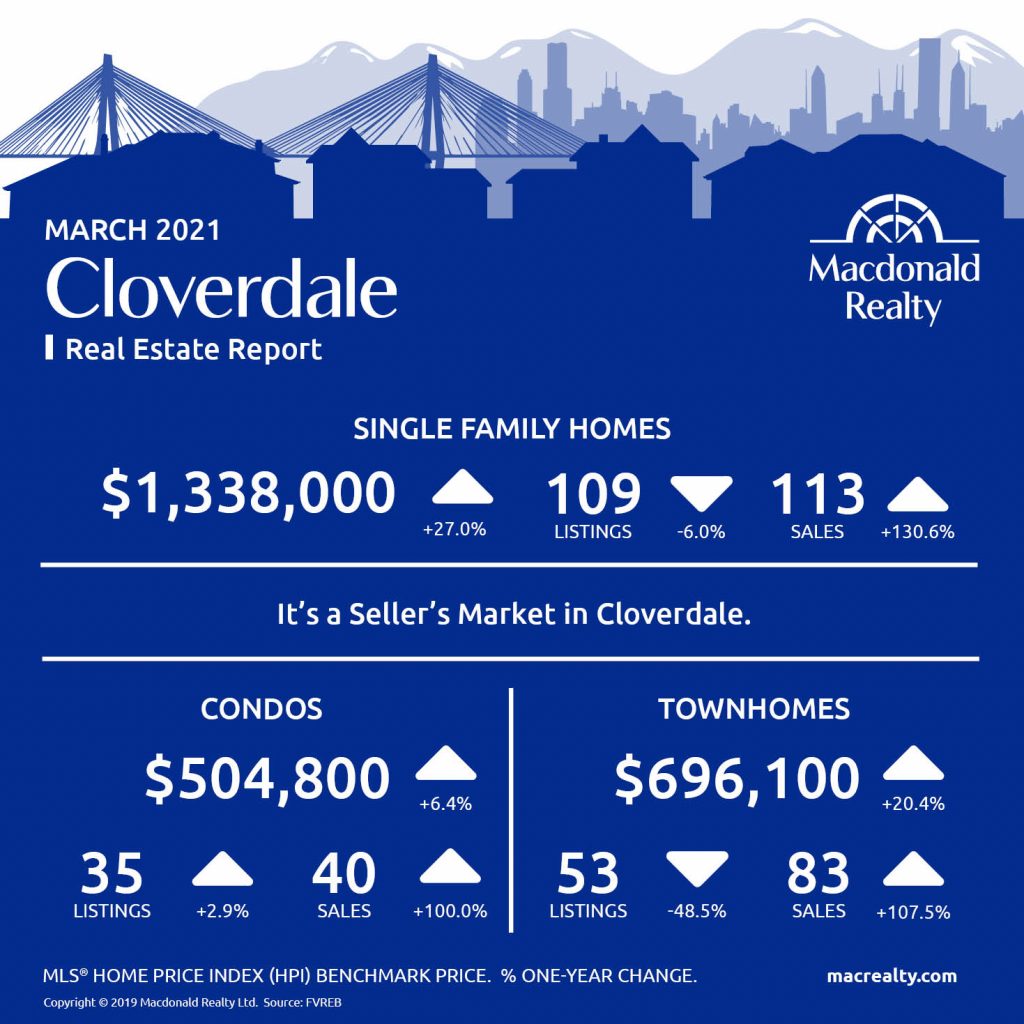
Cloverdale
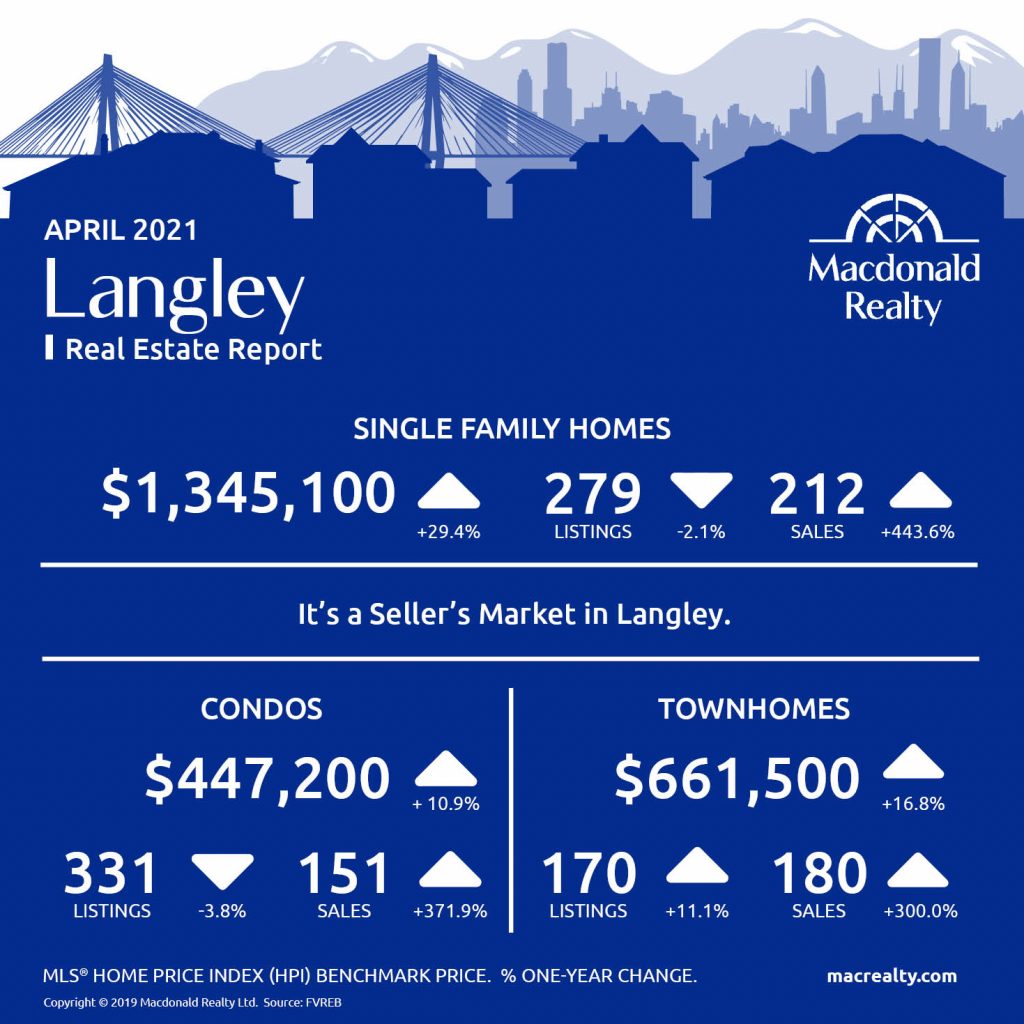
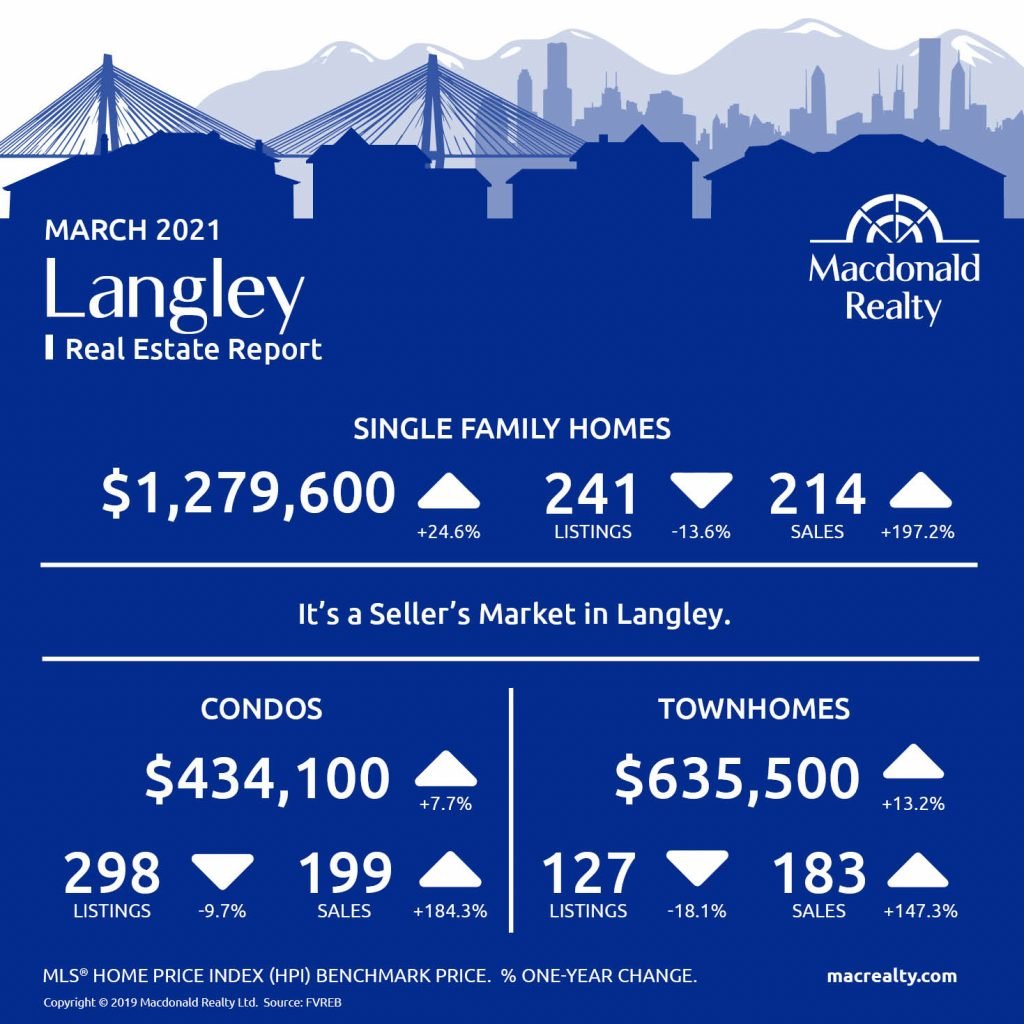
Langley
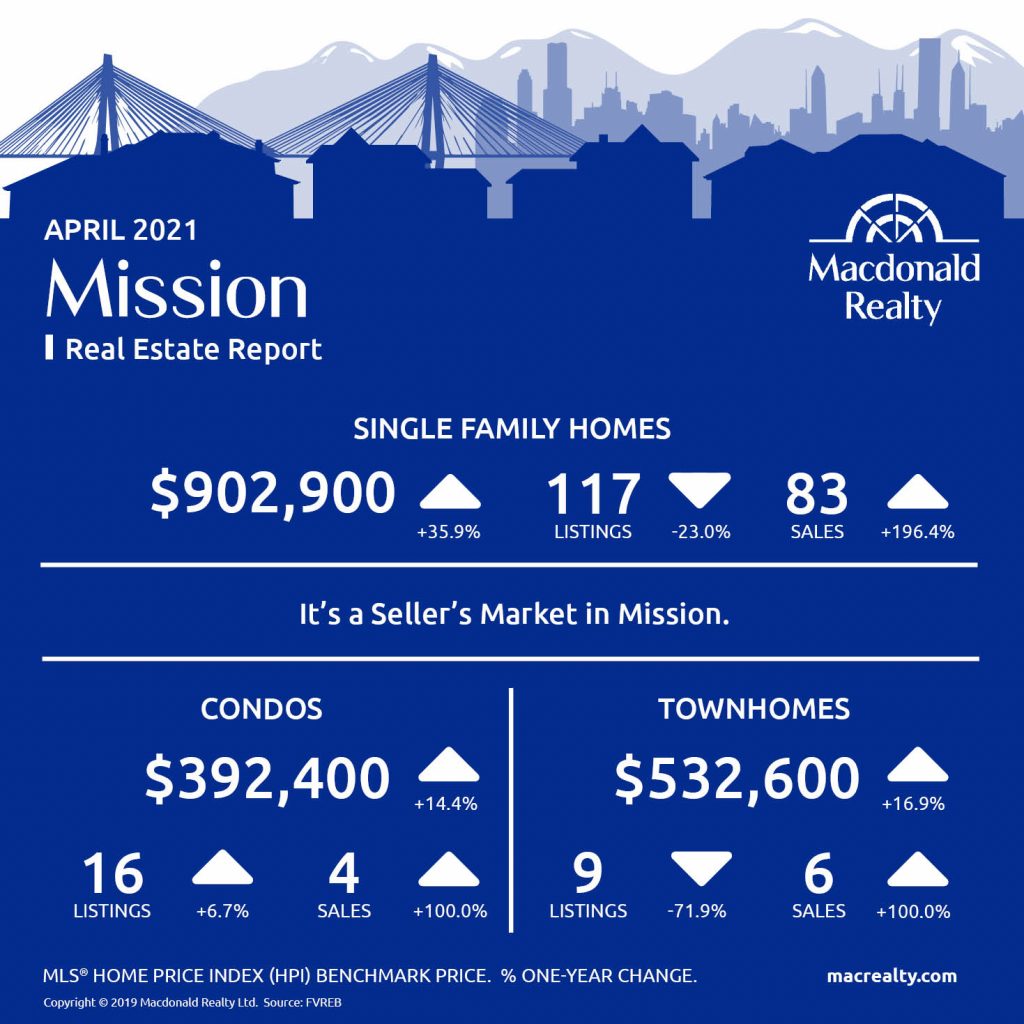
Mission
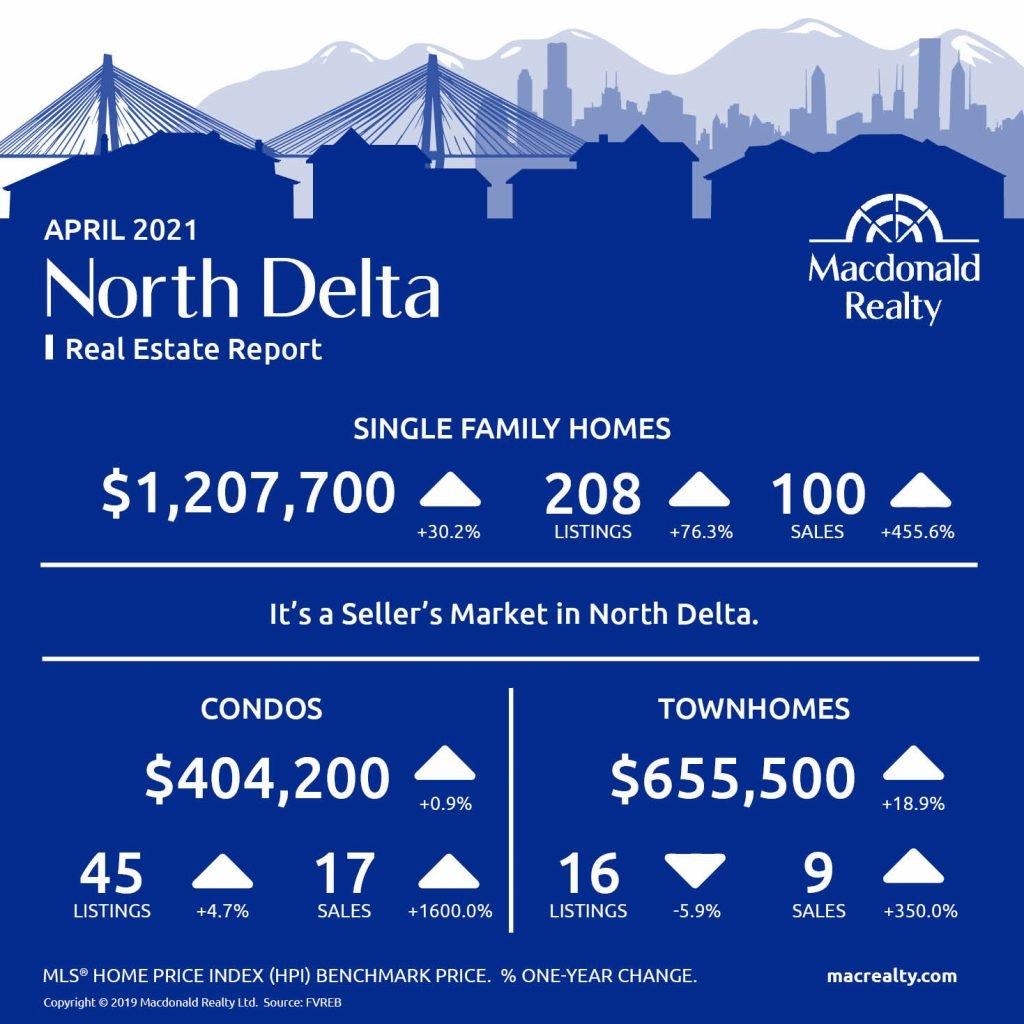
North Delta
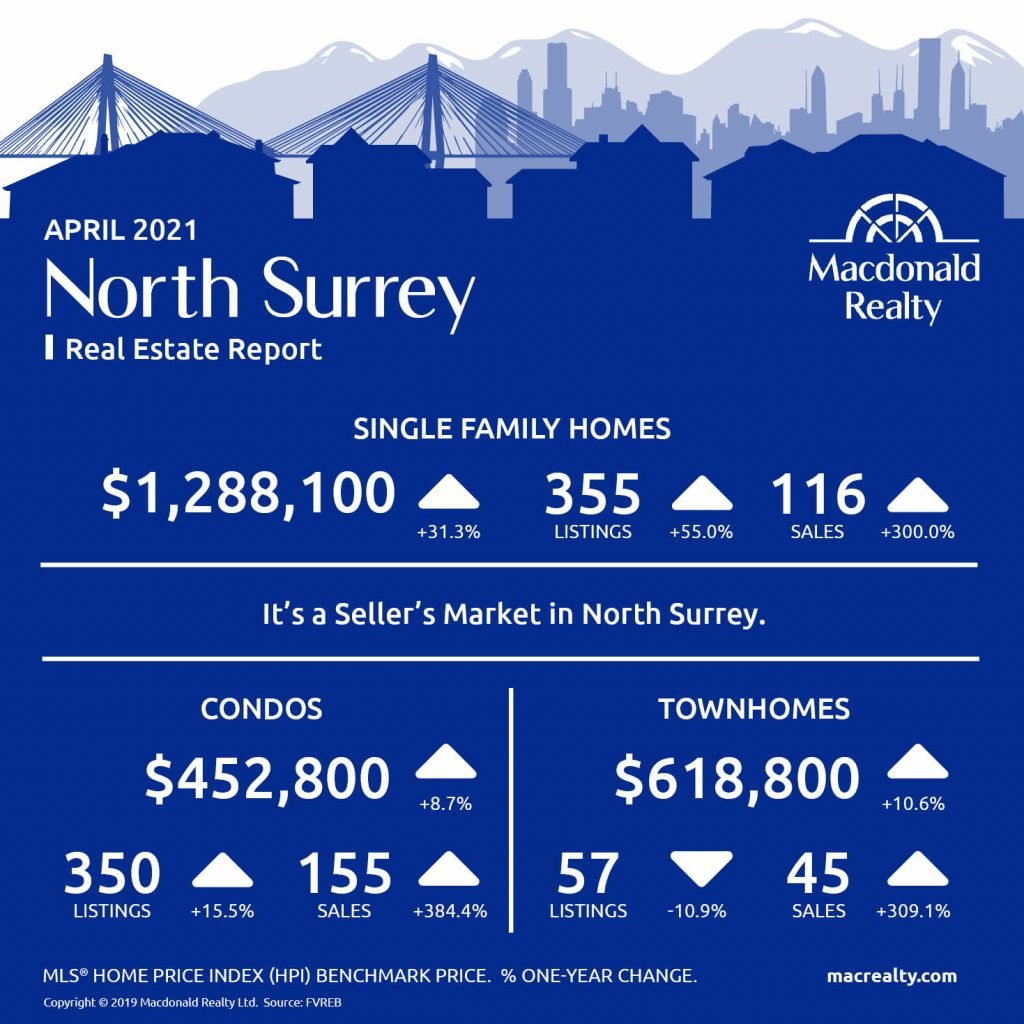
North Surrey
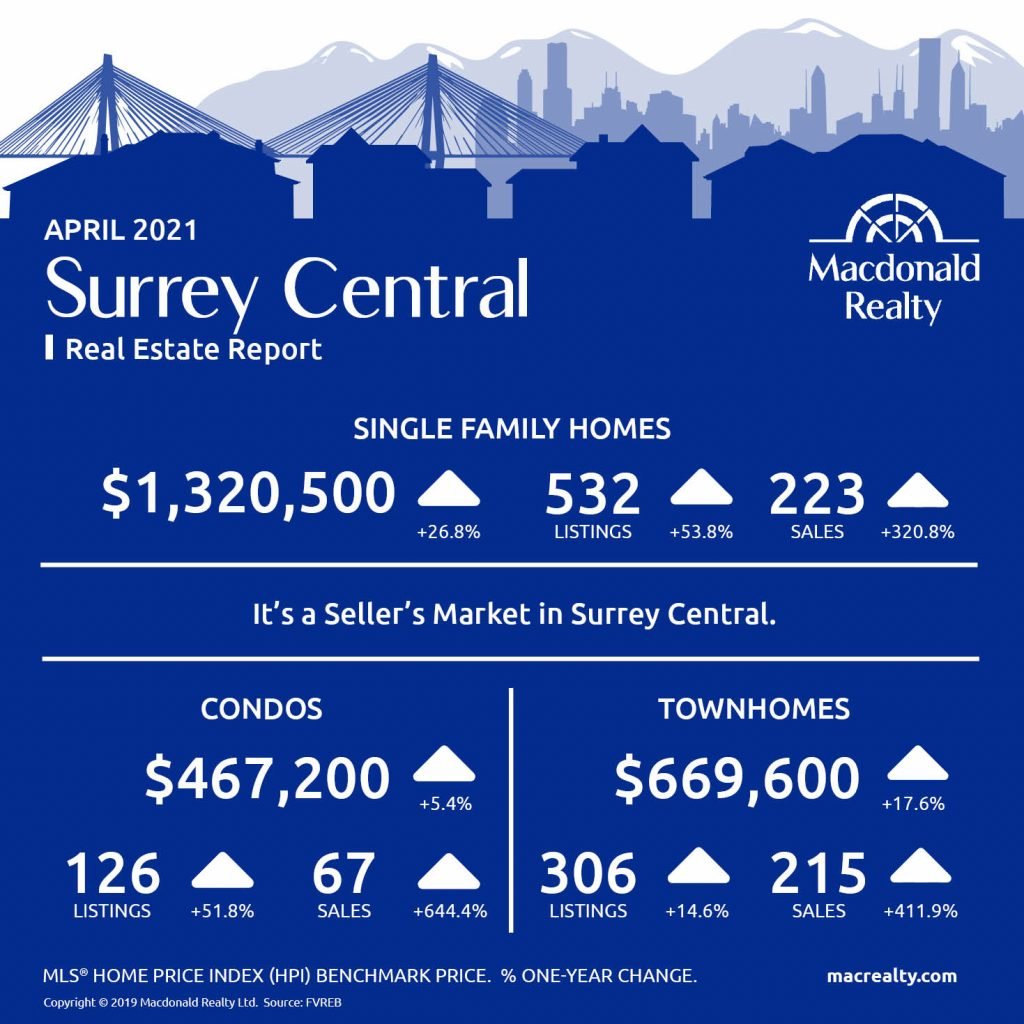
Surrey Central
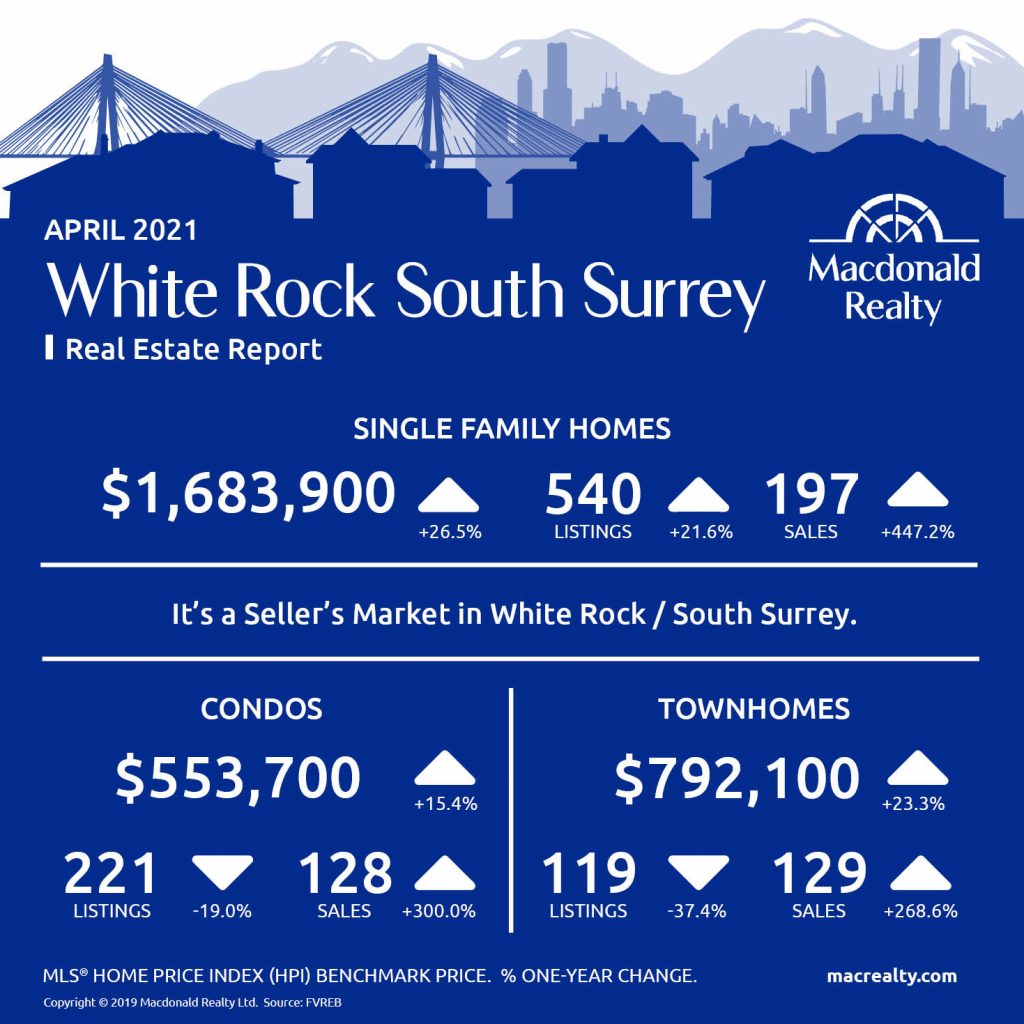
White Rock / South Surrey
Looking for more information about the real estate market in specific neighbourhoods in Surrey, Langley and Fraser Valley?
Macdonald Realty has offices in North Delta, White Rock/South Surrey, and Langley. Please email [email protected] or call 1-877-278-3888 to be matched with a REALTOR® working in your area.
MLS® Home Price Index (HPI) Benchmark Price
Average and median home prices are often misinterpreted, are affected by change in the mix of homes sold, and can swing dramatically from month to month (based on the types and prices of properties that sold in a given month). The MLS® HPI overcomes these shortcomings and uses the concept of a benchmark home, a notional home with common attributes of typical homes in a defined area. Visit www.housepriceindex.ca for more information.
This blog post is based on market data provided by the Fraser Valley Real Estate Board (FVREB) www.fvreb.bc.ca
by Macrealty Marketing Team | May 5, 2021 | Market Updates
Here are the latest real estate market statistics from Macdonald Realty on Okanagan listings and sales in April 2021.
Find the infographics by visiting the Facebook Album.
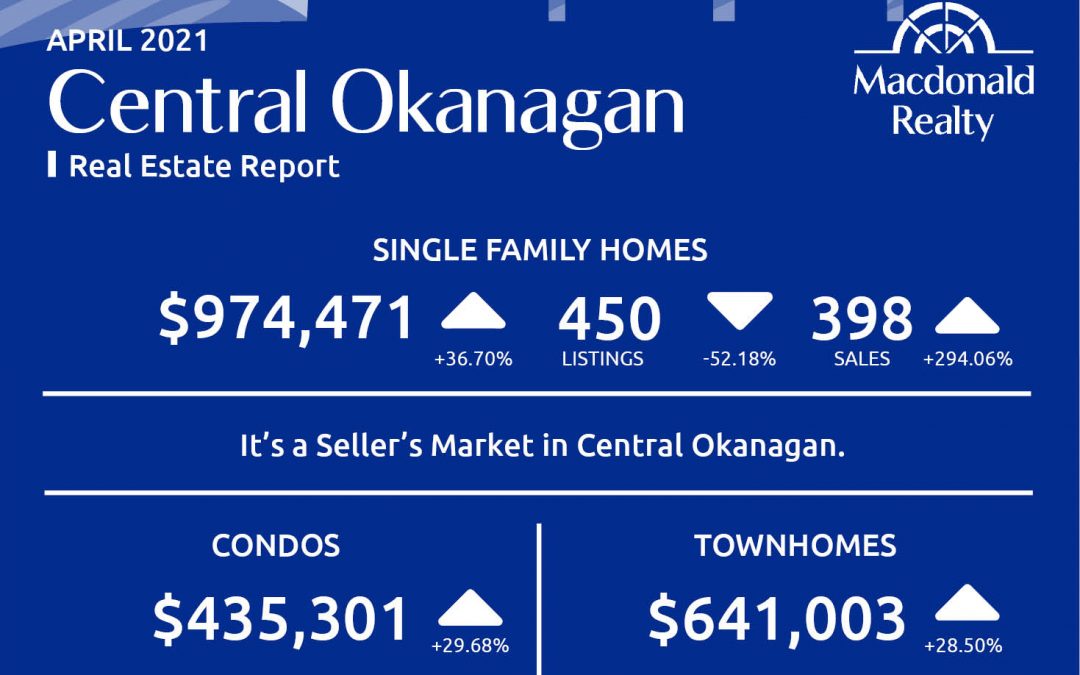
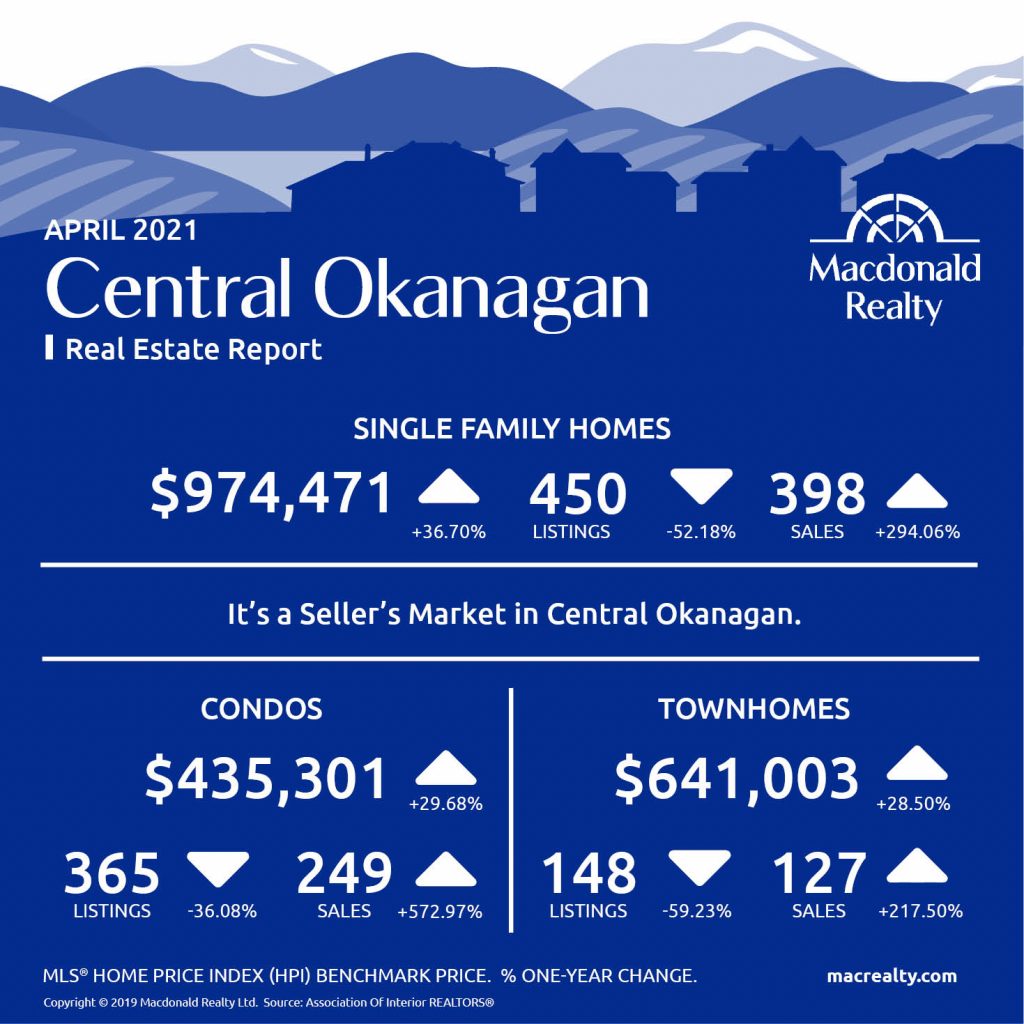
Central Okanagan: Kelowna and Lake Country
There were 398 sales, 450 active listings, and $974,471 average sale price for detached homes in the Central Okanagan market, including Kelowna and Lake Country.
The condo market featured 249 sales and 365 active listings at the end of the month. The average sale price was $435,301.
Townhome sales were 127, active listings were 148 and the average sale price was $641,003.
It’s a seller’s market in Central Okanagan.
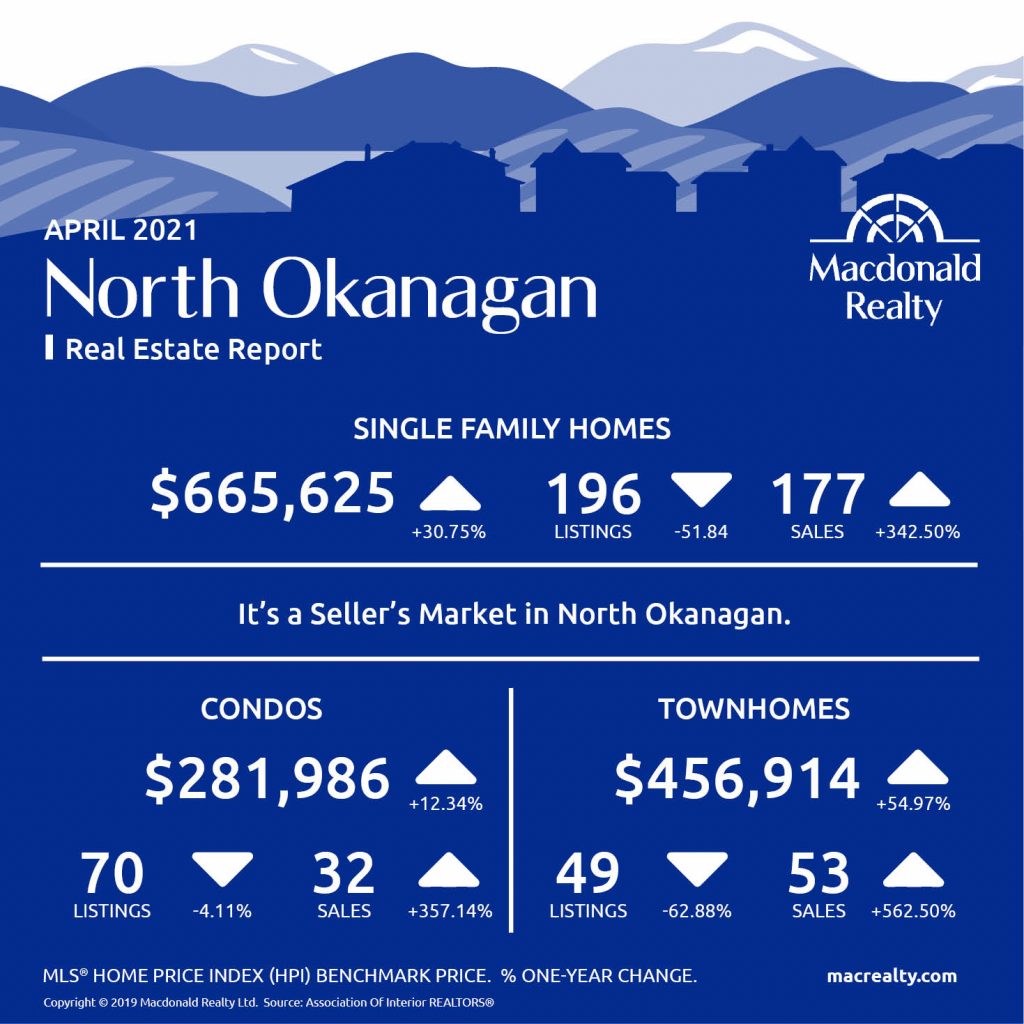
North Okanagan: Vernon and surrounding area
In North Okanagan, including Vernon and the surrounding area and the average sale price was $665,625. At the end of the month, there were 177 sales and 196 active listings.
There were 32 sales and 70 active listings for condos. The average sale price was $281,986.
In comparison, townhomes featured 53 sales, 49 active listings and a $456,914 average sale price.
It’s a seller’s market in North Okanagan.
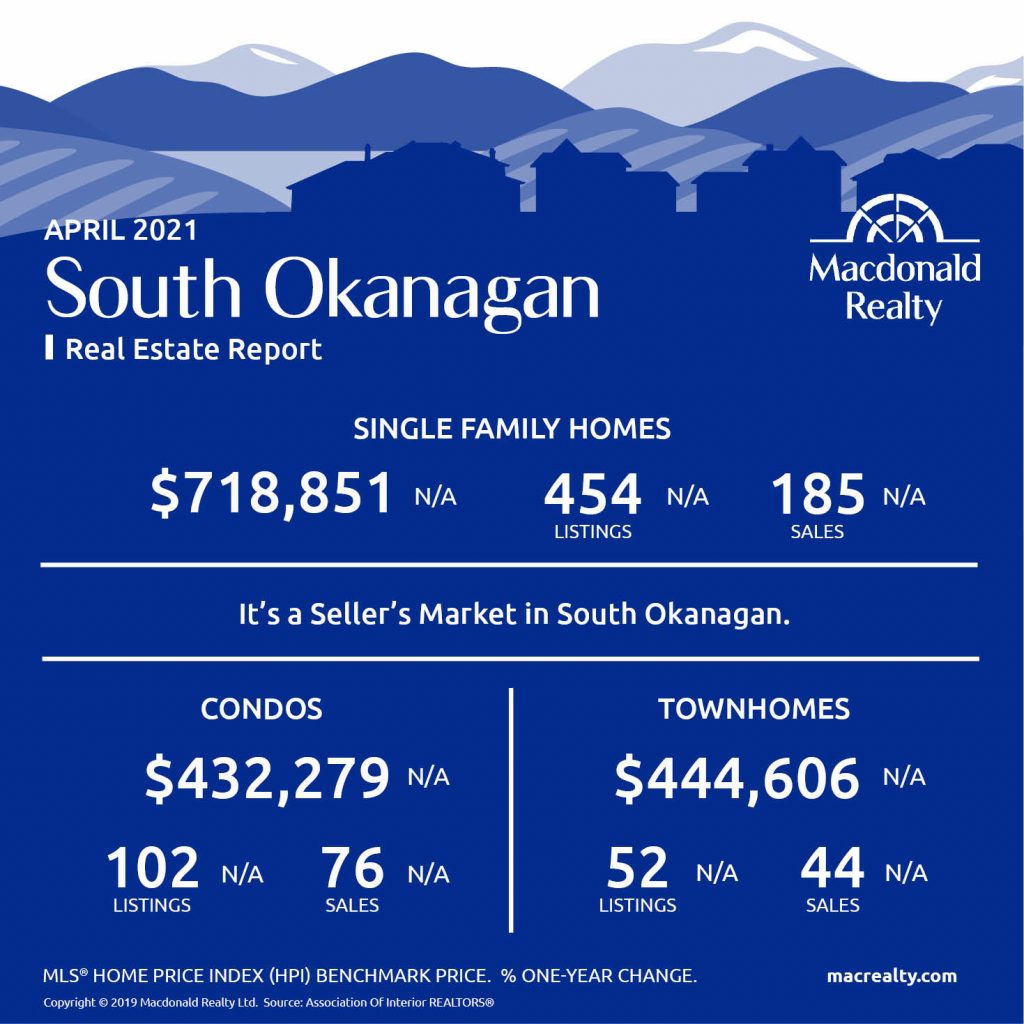
South Okanagan
There were185 sales, 454 active listings, and $718,851 average sale price for detached homes in the Central Okanagan market, including Kelowna and Lake Country.
The condo market featured 76 sales and 102 active listings at the end of the month. The average sale price was $432,279.
Townhome sales were 44, active listings were 52 and the average sale price was $444,606.
It’s a seller’s market in South Okanagan.
Looking for more information about the real estate market in specific neighbourhoods in Okanagan?
Macdonald Realty has offices in Kelowna and across BC. Please email [email protected] or call 1-877-278-3888 to be matched with a REALTOR® working in your area.
This blog post is based on market data provided by the Association Of Interior REALTORS® https://www.interiorrealtors.ca/.
by Macrealty Marketing Team | Apr 7, 2021 | Market Updates
Here are the latest real estate market statistics from Macdonald Realty on Squamish, Whistler, and Sunshine Coast listings and sales in March 2021.
Find all the infographics related to the May Market Statistics by visiting the Facebook Album.
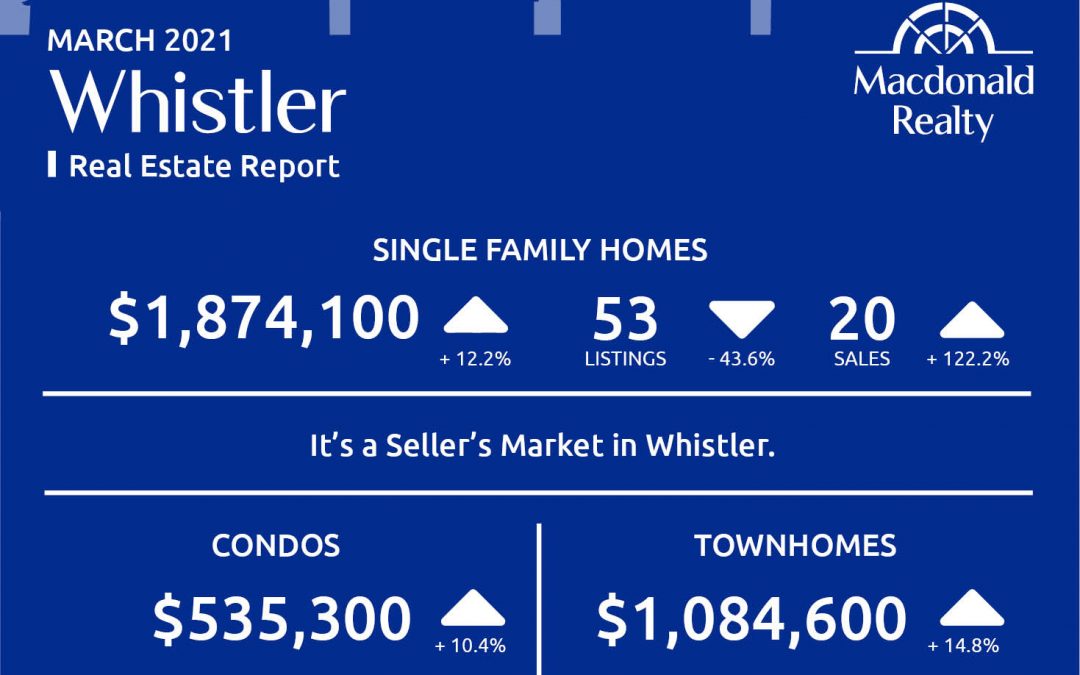
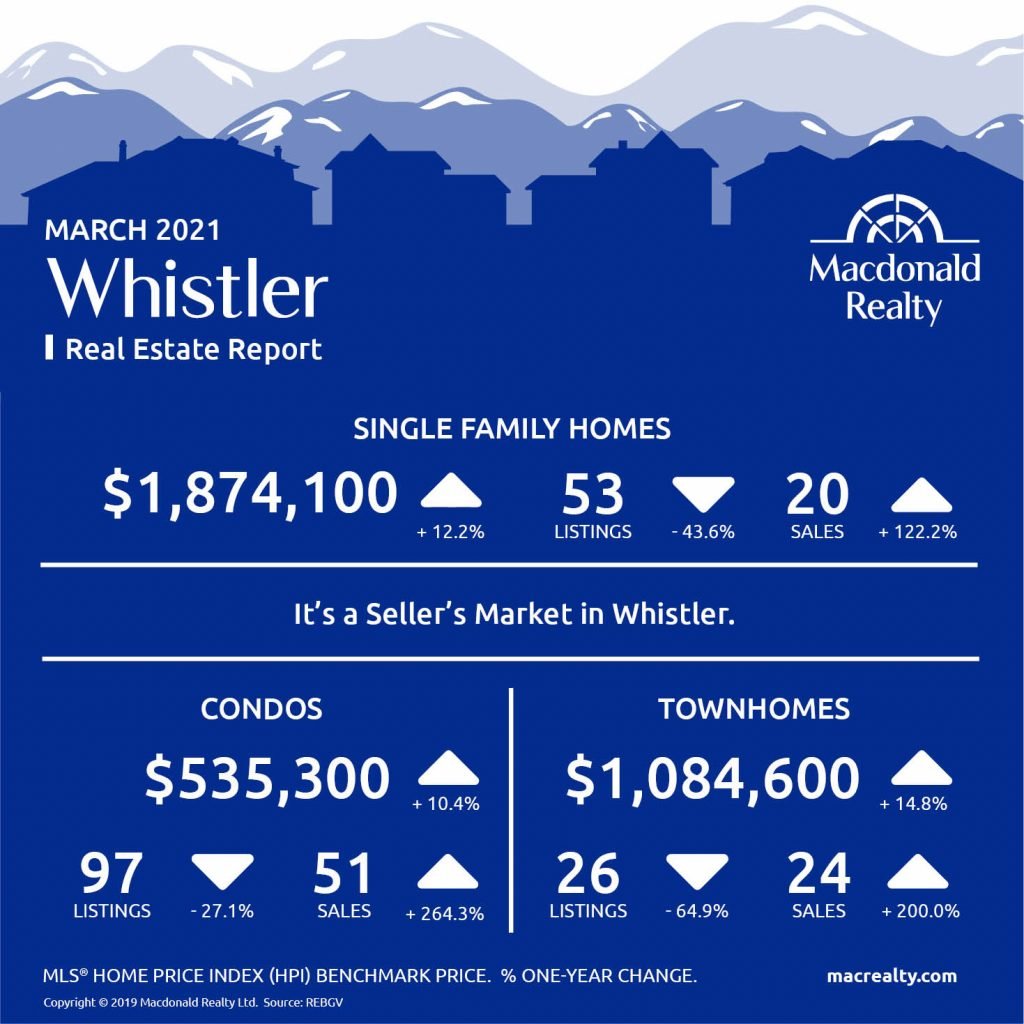
Whistler
In March 2021, there were 20 sales of detached homes and 53 active listings. The benchmark sale price was $1,874,100.
The condo market had 51 sales and 97 active listings at the end of the month. The benchmark sale price was $535,300.
The townhome market had 24 sales and, the active listings were 26. The benchmark sale price was $1,084,600.
It’s a Seller’s market in Whistler.
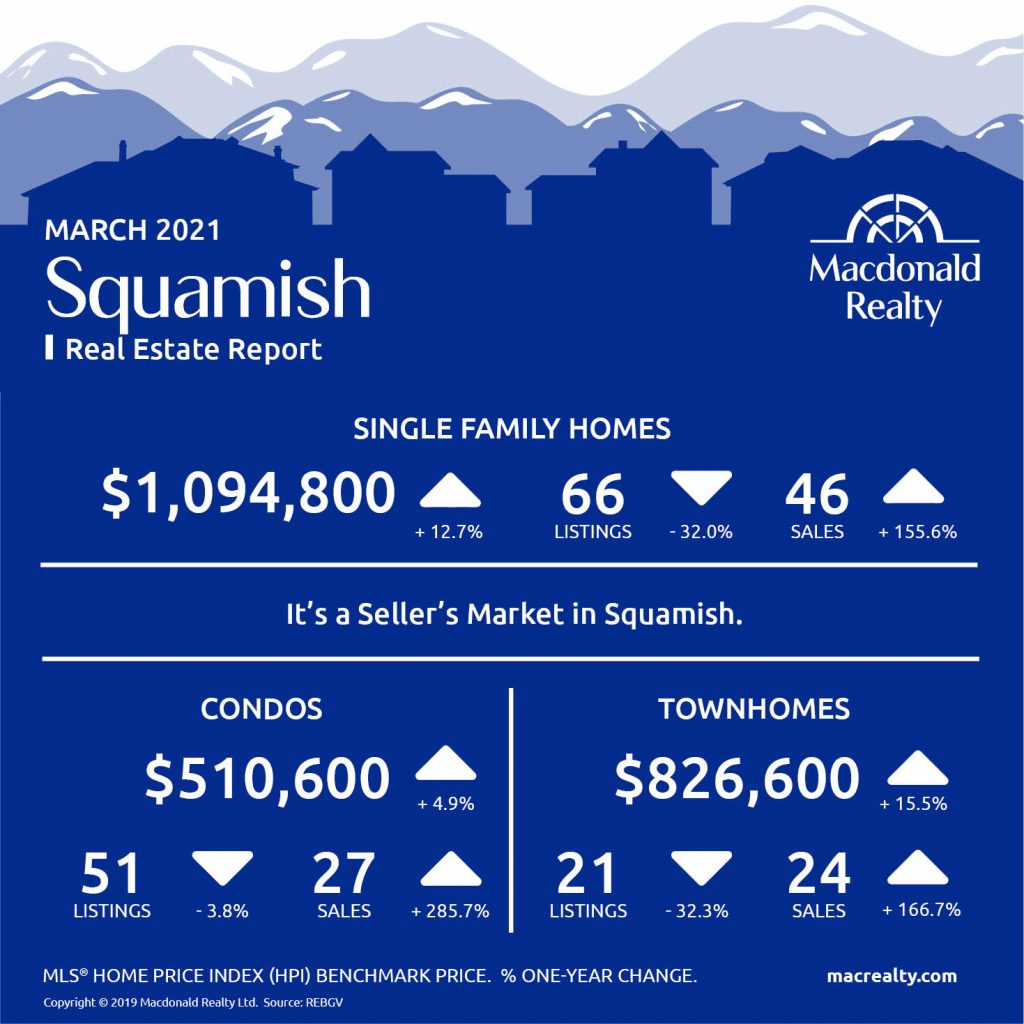
Squamish
In March 2021, there were 46 sales of detached homes and 66 active listings. The benchmark sale price was $1,094,800.
The condo market had 27 sales and 51 active listings at the end of the month. The benchmark sale price was $510,600.
The townhome market had 24 sales and, the active listings were 21. The benchmark sale price was $826,600.
It’s a Seller’s Market in Squamish.
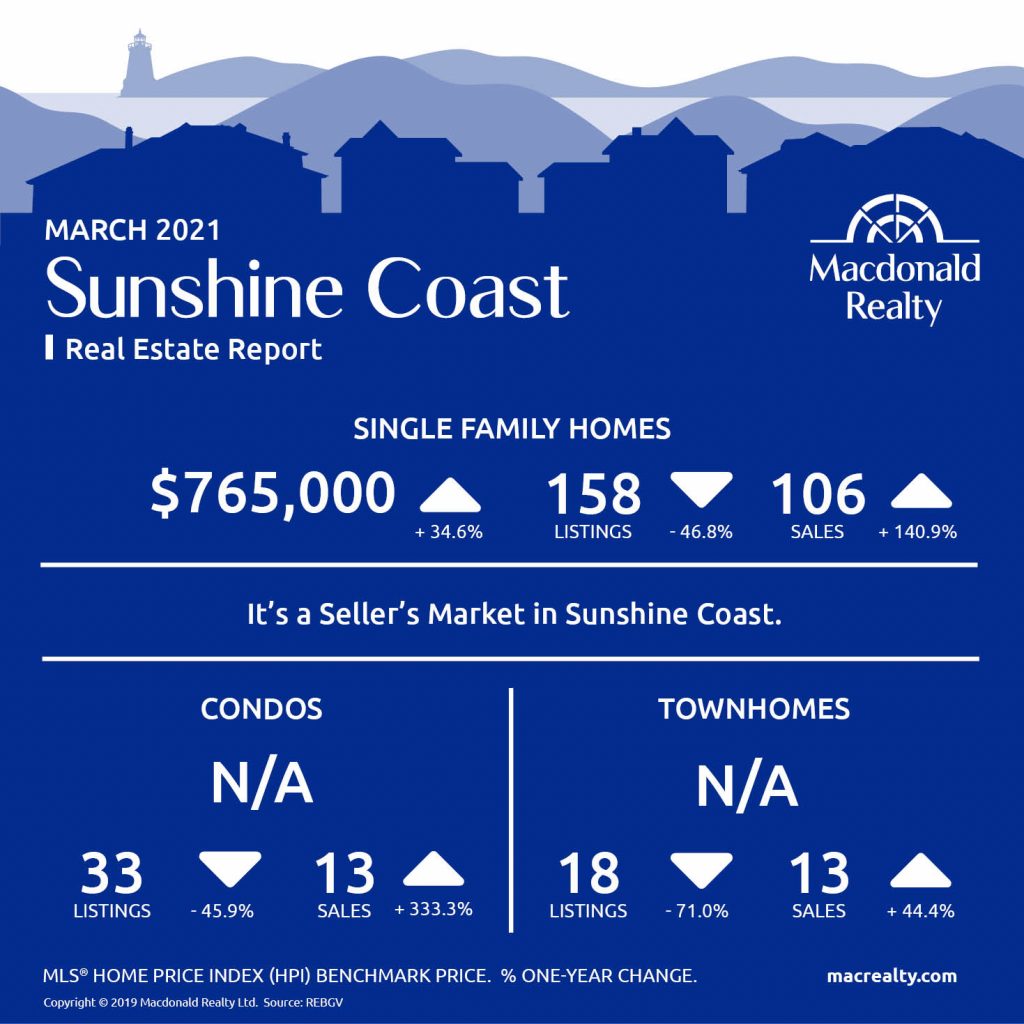
Sunshine Coast
In March 2021, there were 106 sales of detached homes and 158 active listings. The benchmark sale price was $765,000.
The condo market had 13 sales and 33 active listings at the end of the month.
The townhome market had 13 sales and, the active listings were 18.
It’s a Seller’s market on Sunshine Coast.
Looking for more information about the real estate market in specific neighbourhoods in Squamish, Whistler, and Sunshine Coast? Macdonald Realty has offices in Squamish, Whistler, and Sunshine Coast. Please email [email protected] or call 1-877-278-3888 to be matched with a REALTOR® working in your area.
MLS® Home Price Index (HPI) Benchmark Price
Average and median home prices are often misinterpreted, are affected by change in the mix of homes sold, and can swing dramatically from month to month (based on the types and prices of properties that sold in a given month). The MLS® HPI overcomes these shortcomings and uses the concept of a benchmark home, a notional home with common attributes of typical homes in a defined area. Visit www.housepriceindex.ca for more information.
This blog post is based on market data provided by the Real Estate Board of Greater Vancouver (REBGV) www.rebgv.org
by Macrealty Marketing Team | Apr 7, 2021 | Market Updates
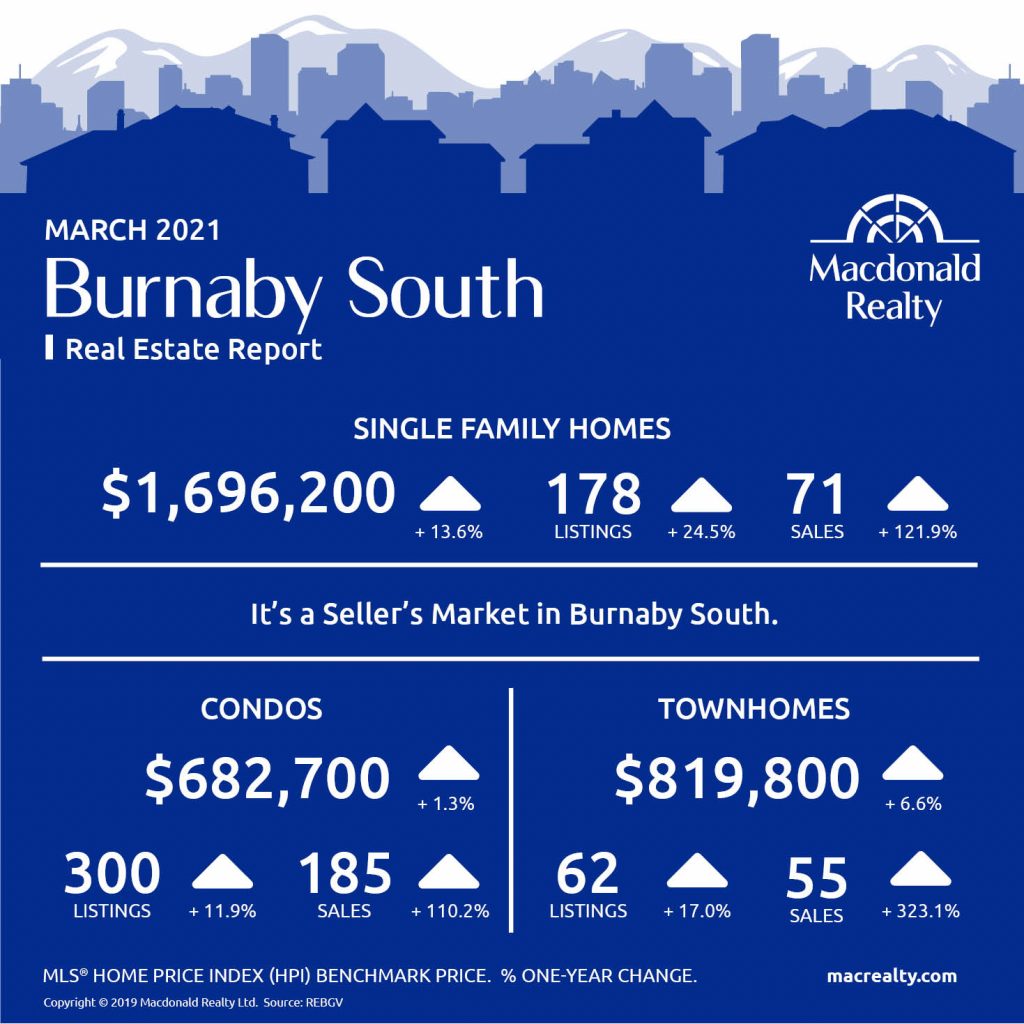
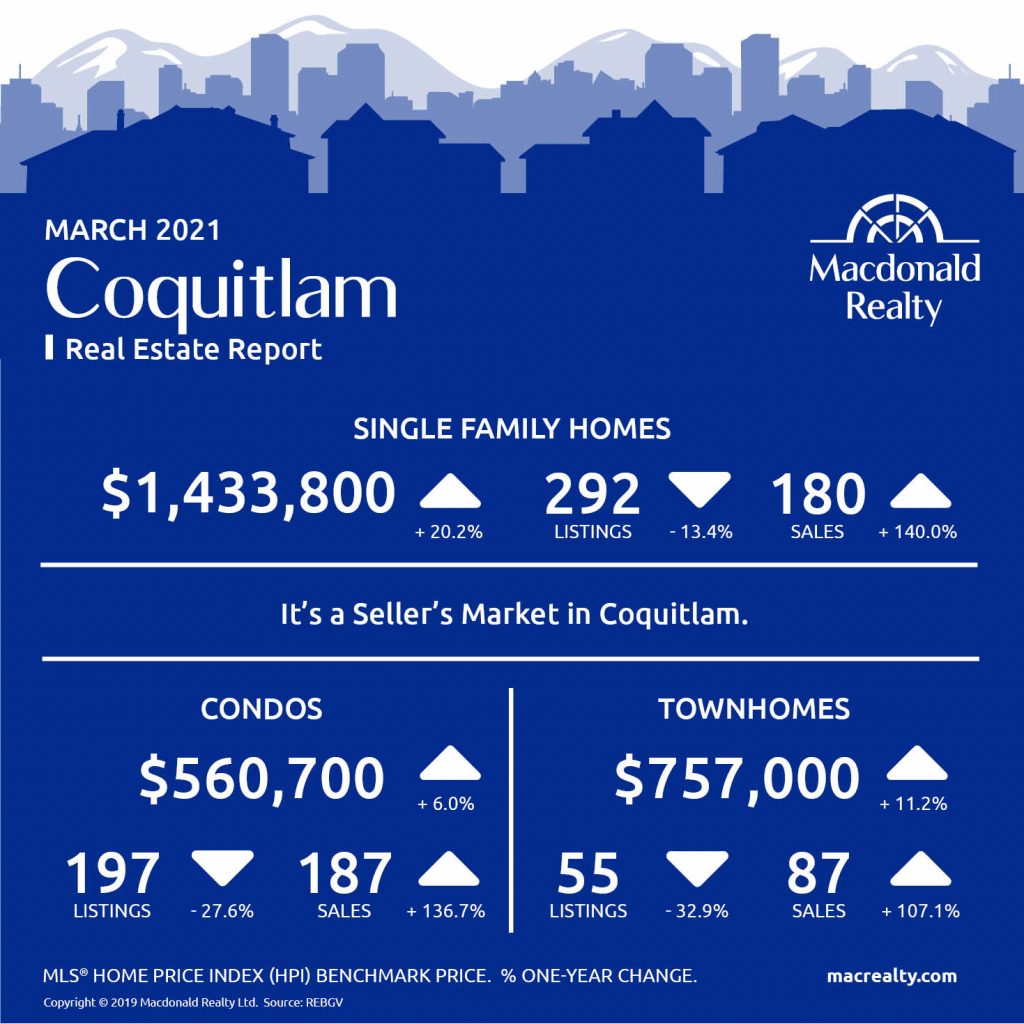
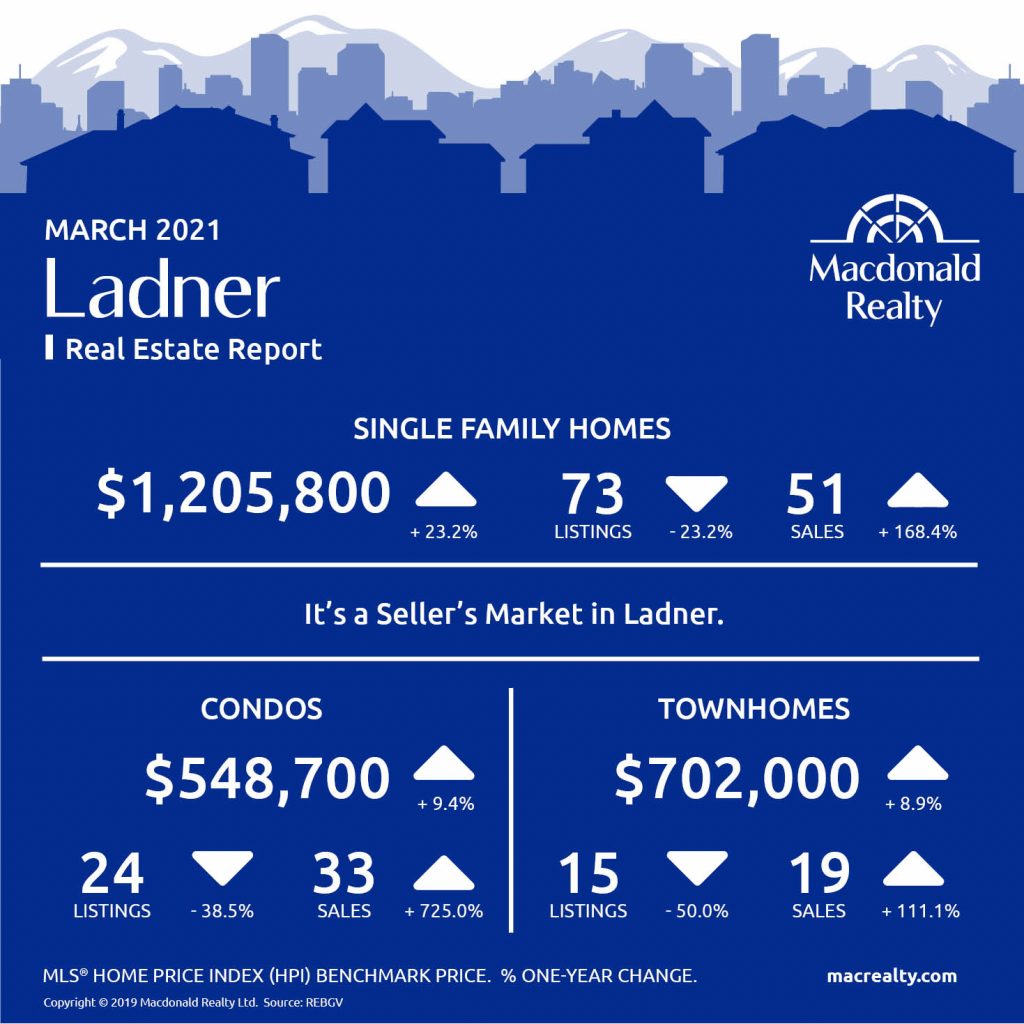
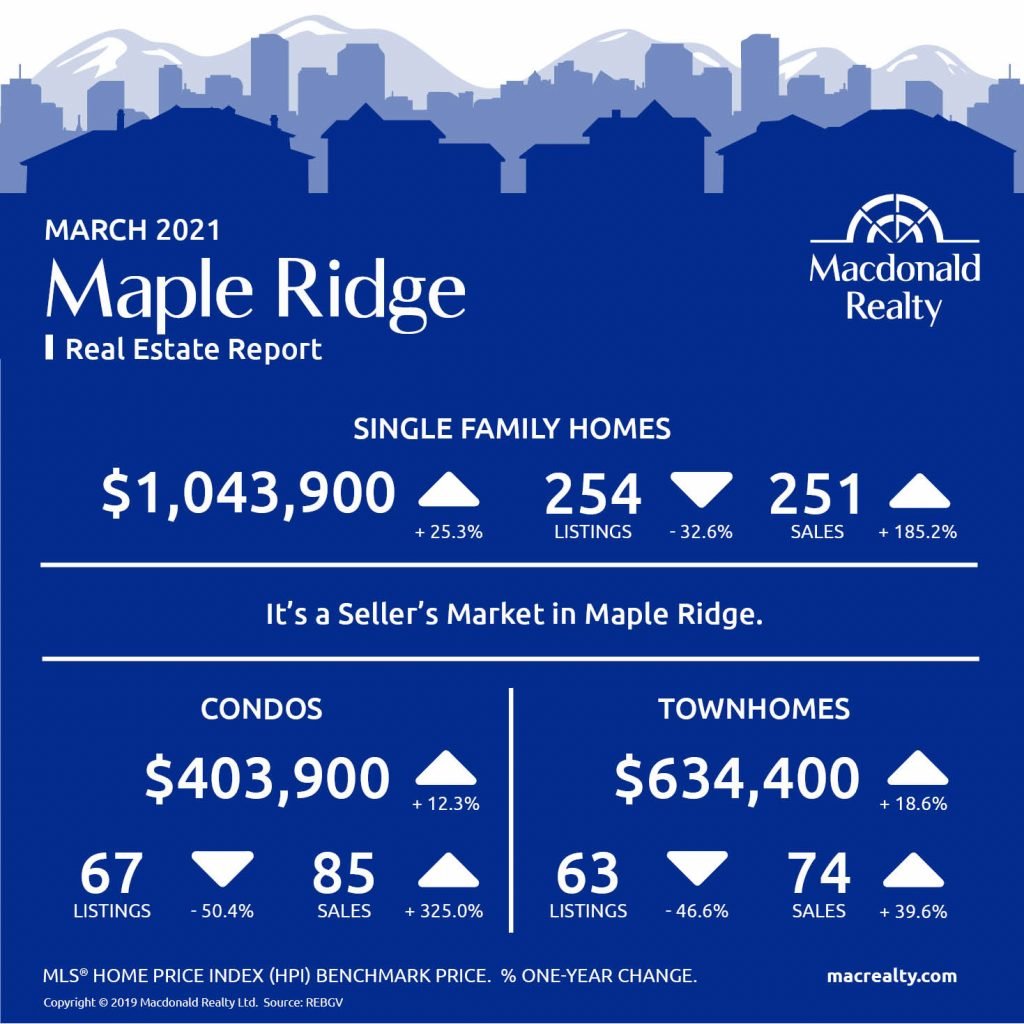
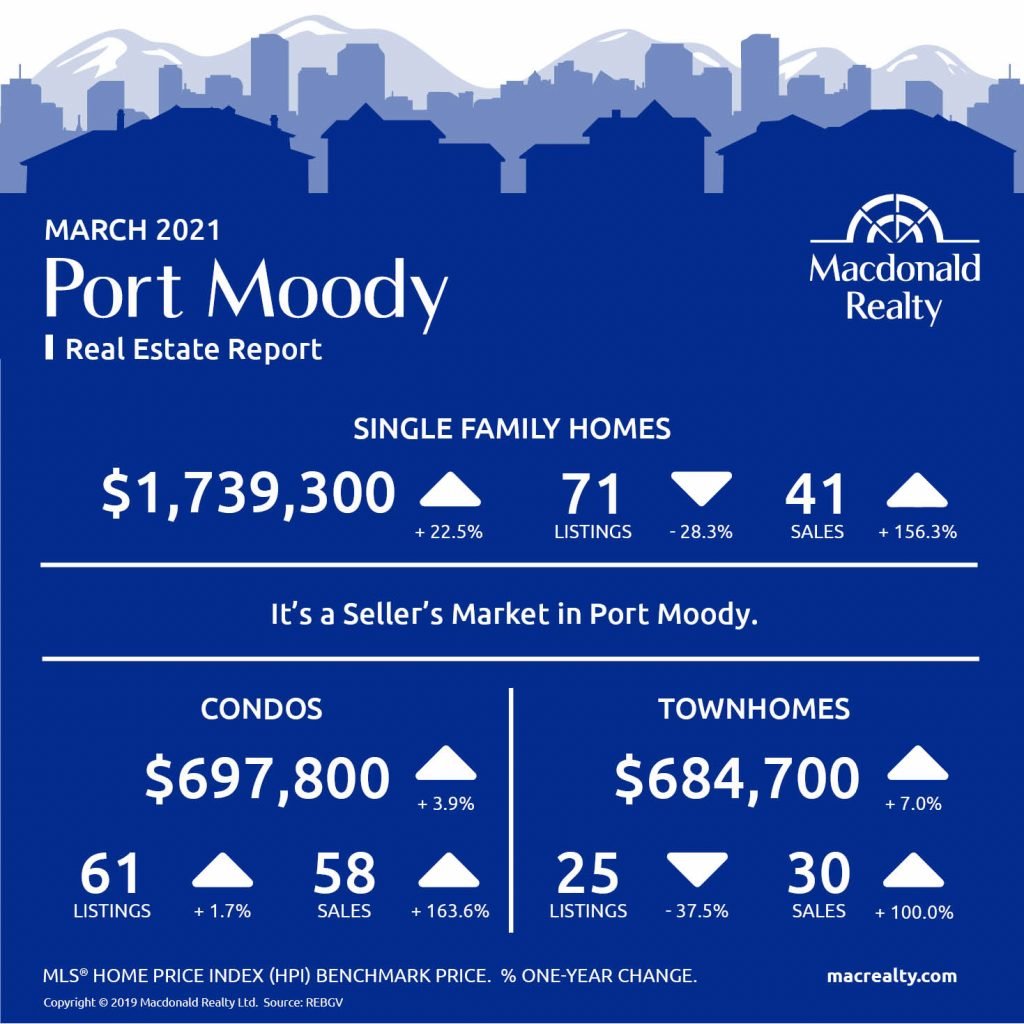
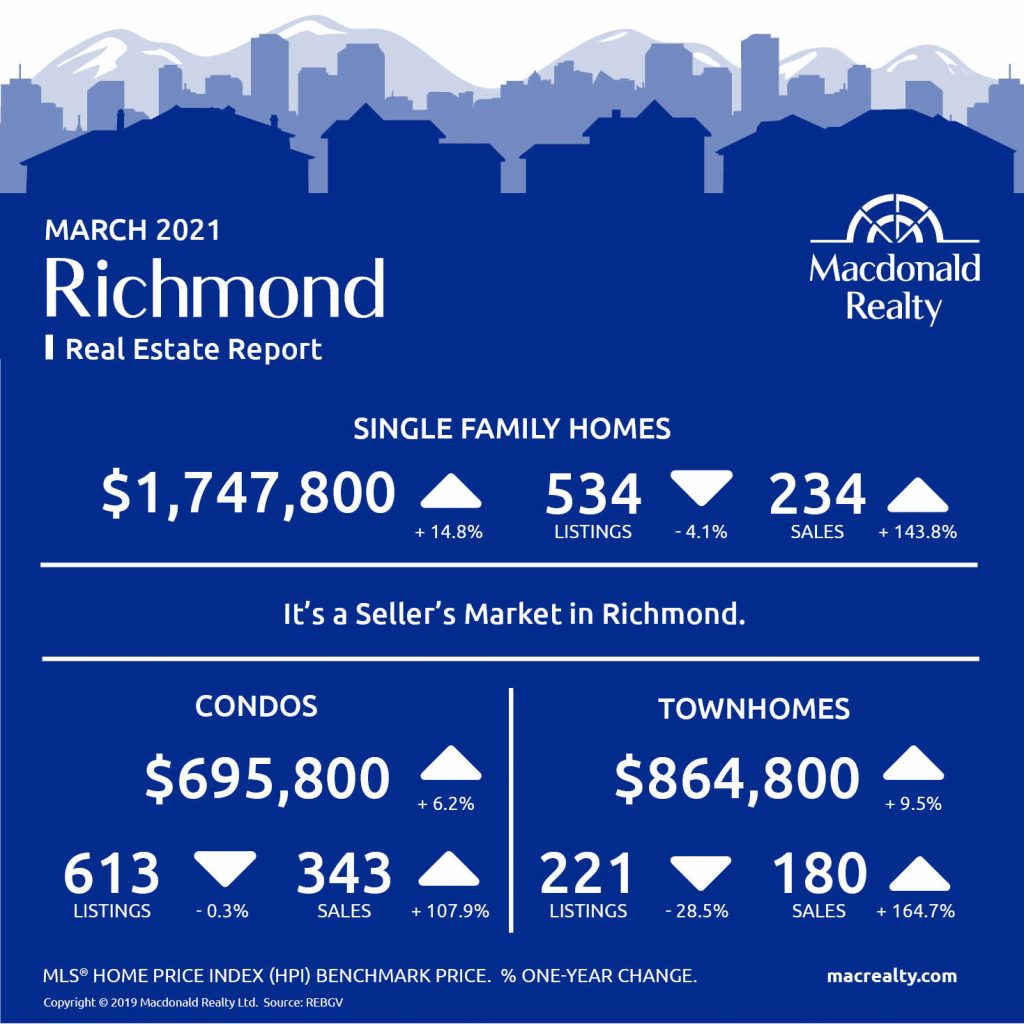
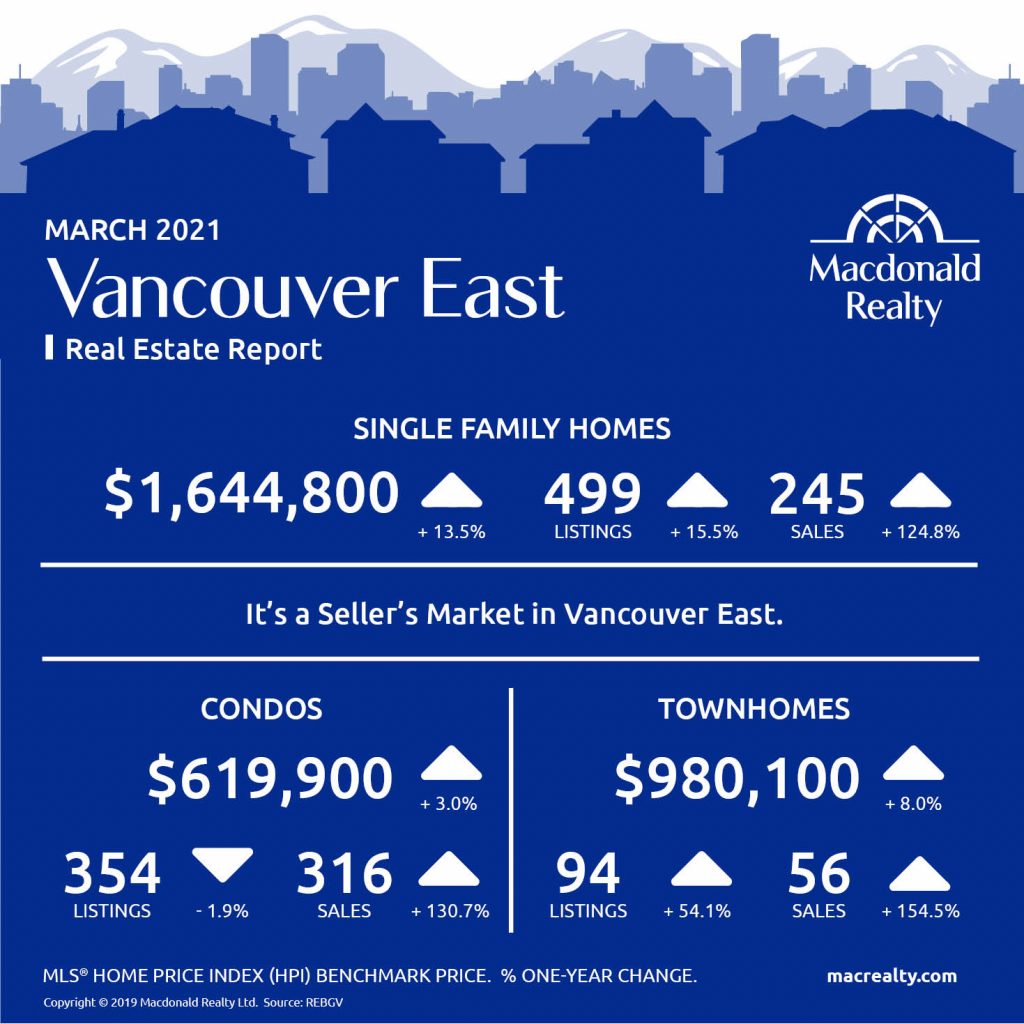
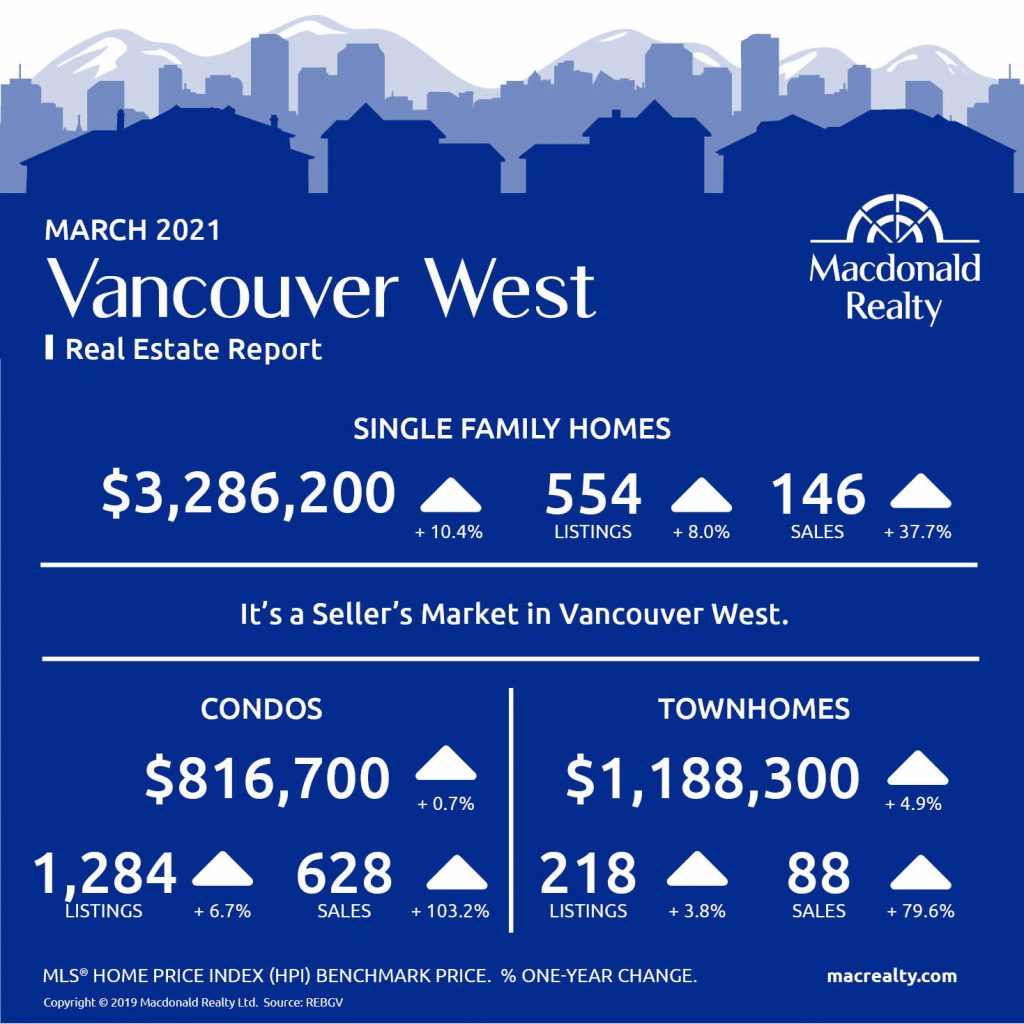
Here are the latest real estate market statistics from Macdonald Realty on the Greater Vancouver listings and sales in March 2021.
Find all the infographics by visiting the Facebook Album.
The Real Estate Board of Greater Vancouver (REBGV) reports that residential home sales in the region totalled 5,708 in March 2021, a 126.1 per cent increase from the 2,524 sales recorded in March 2020, and a 53.2 per cent increase from the 3,727 homes sold in February 2021.
Last month’s sales were 72.2 per cent above the 10-year March sales average and is the highest monthly sales total ever recorded in the region.
“In March, residents bought and listed homes across our region at levels not seen before,” Taylor Biggar, REBGV Chair said. “This surge in activity is increasing upward pressure on prices. We’re beginning to see double-digit price gains for single-family homes and townhomes over the last 12 months.”
As released by the Board “The total number of homes currently listed for sale on the MLS® system in Metro Vancouver is 9,145, a 4.8 per cent decrease compared to March 2020 (9,606) and a 9.4 per cent increase compared to February 2021 (8,358). This is 18.6 per cent below the 10-year March total listings average.
“While we did see a record number of listings enter the market last month, the demand in today’s market isn’t allowing that new supply to accumulate. As a result, the overall inventory of homes for sale decreased compared to last year,” said Biggar.
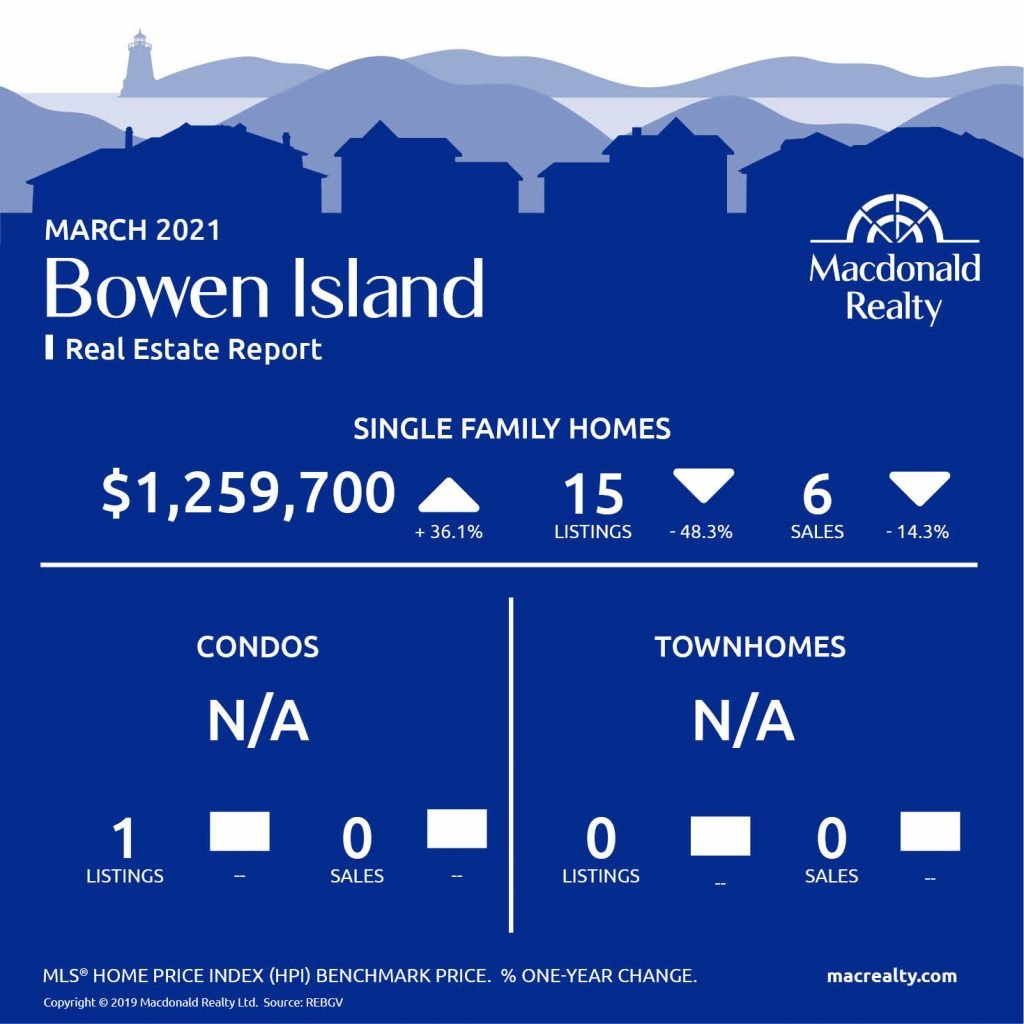
Bowen Island
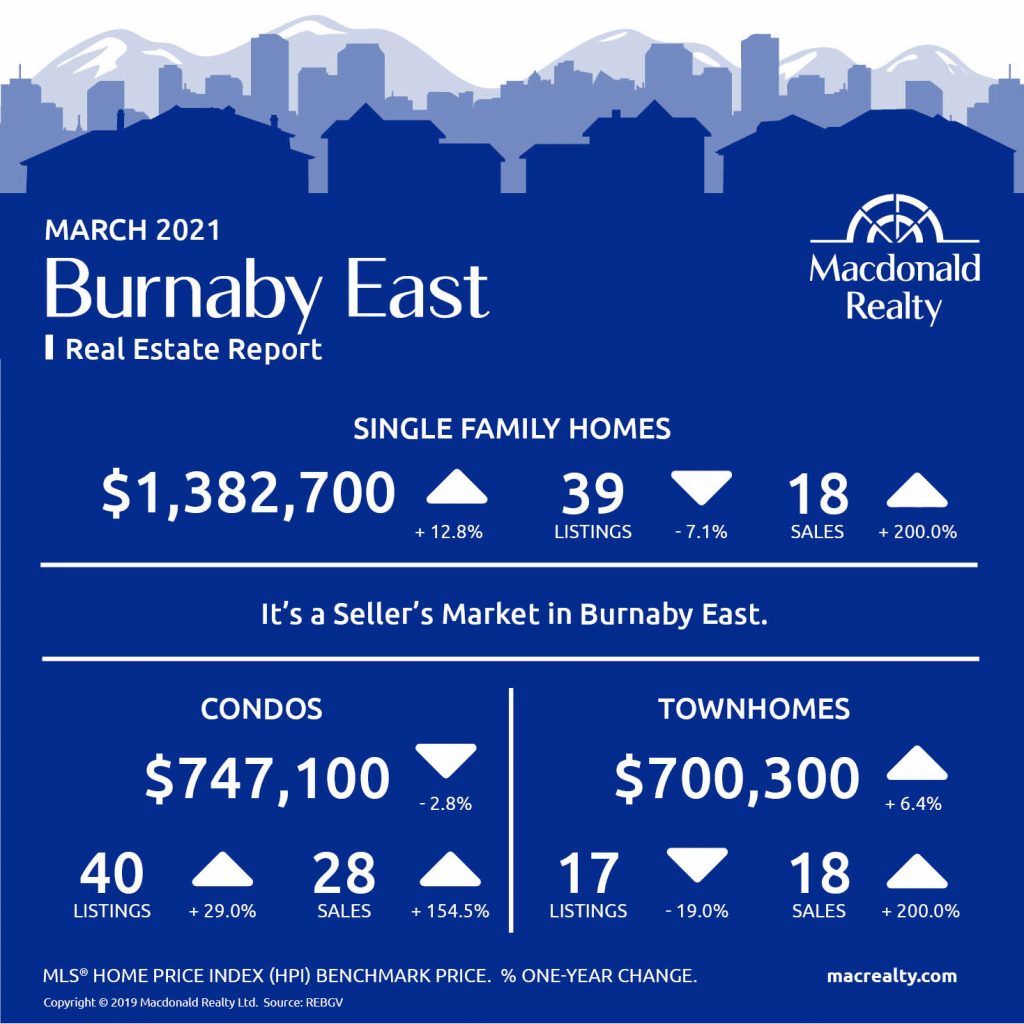
Burnaby East
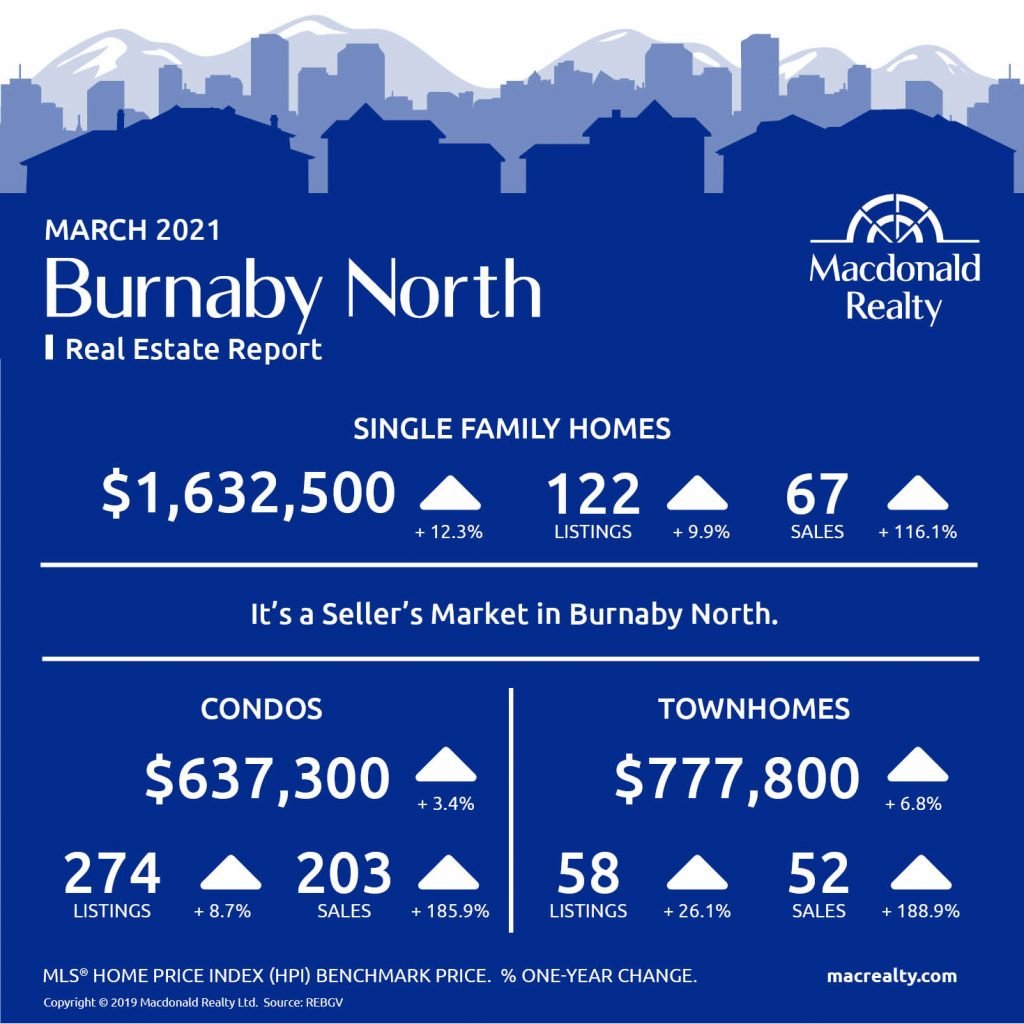
Burnaby North
Burnaby South
Ladner
Maple Ridge
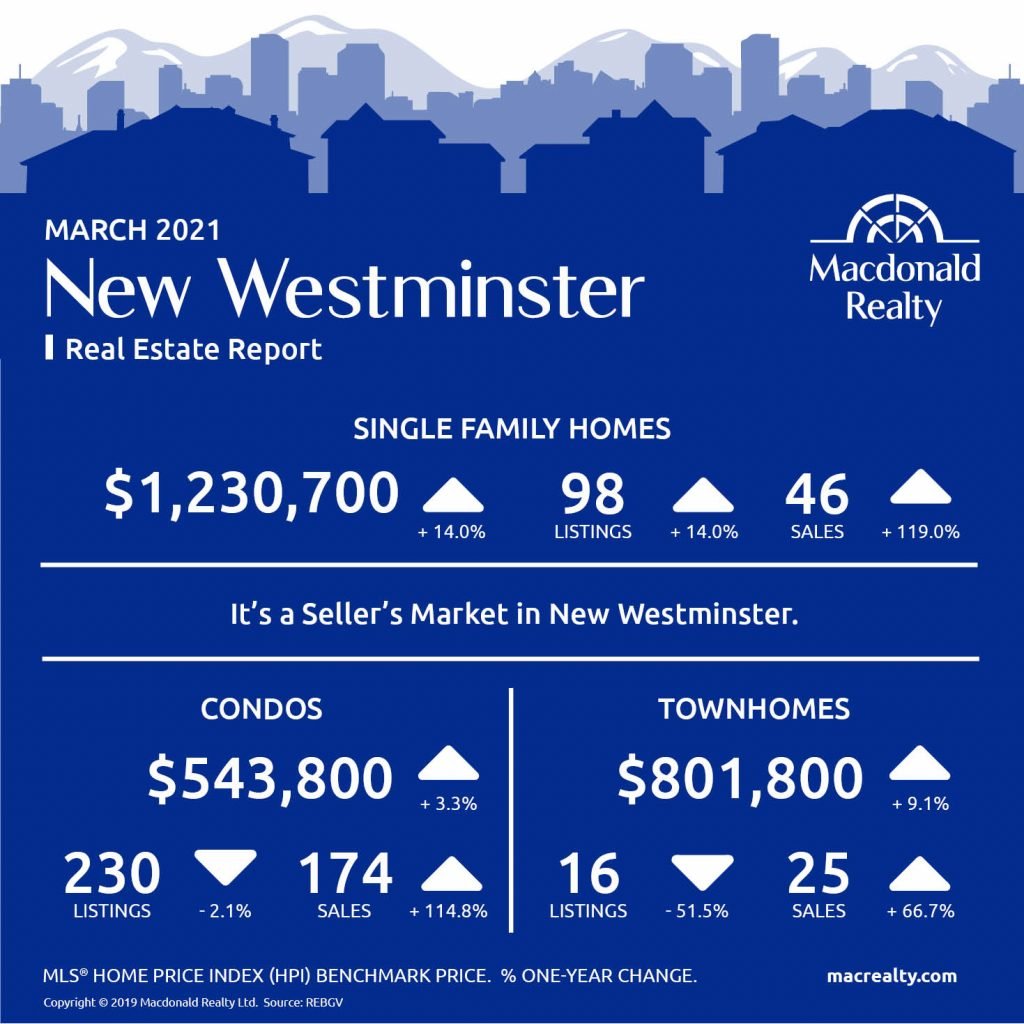
New Westminster
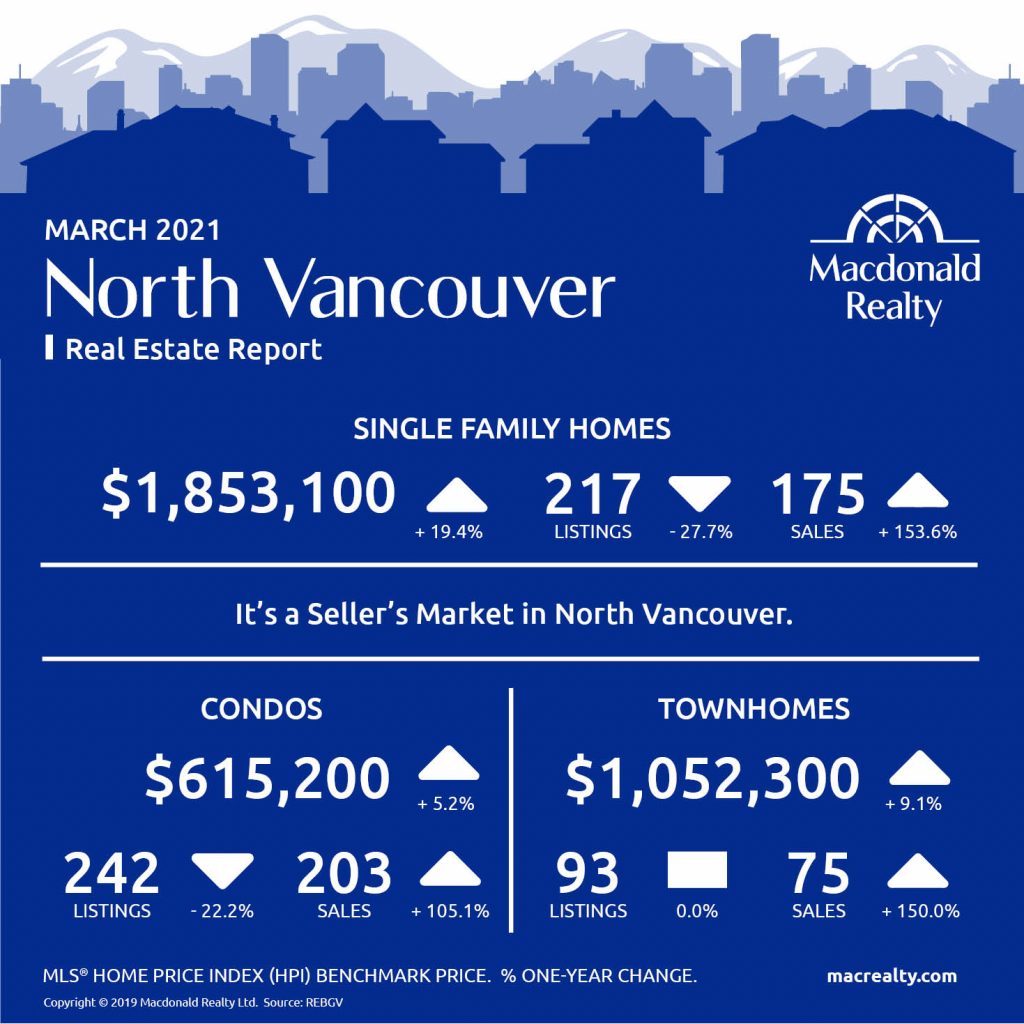
North Vancouver
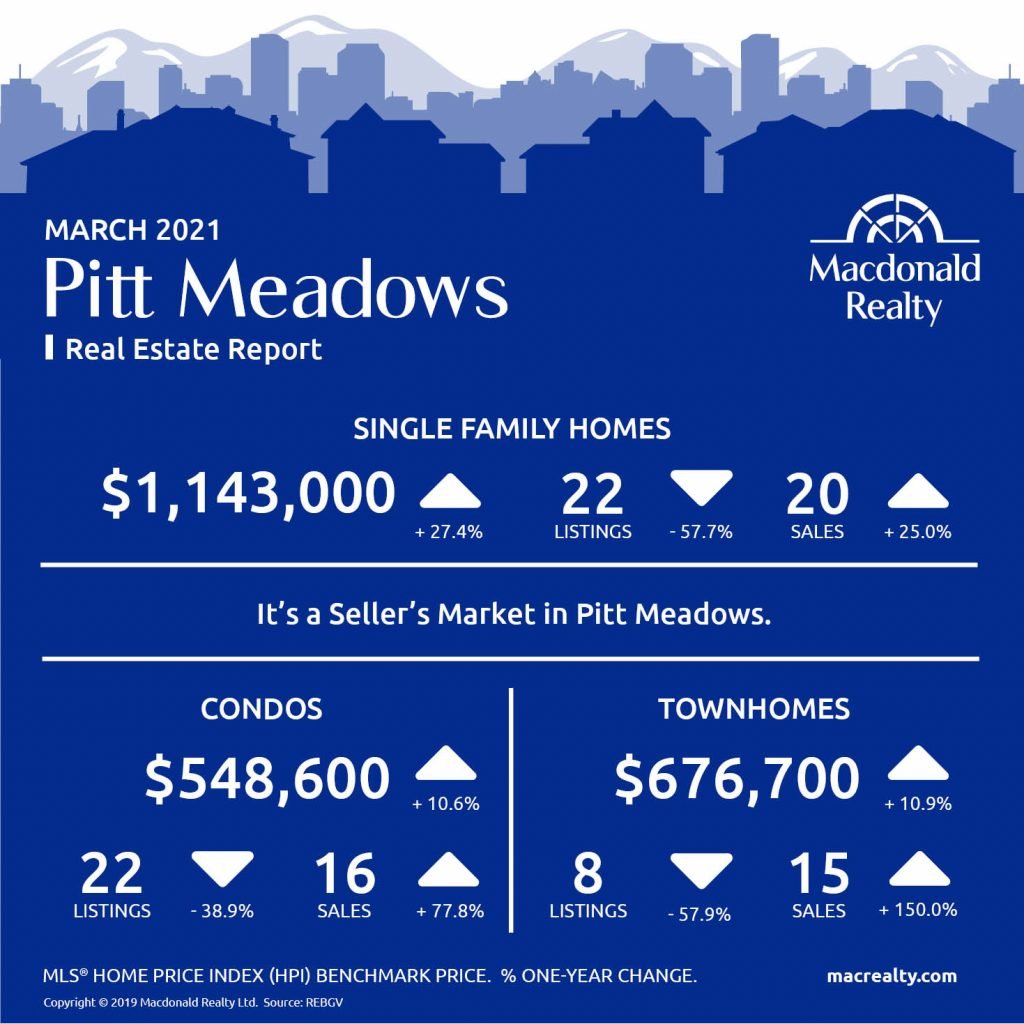
Pitt Meadows
Coquitlam
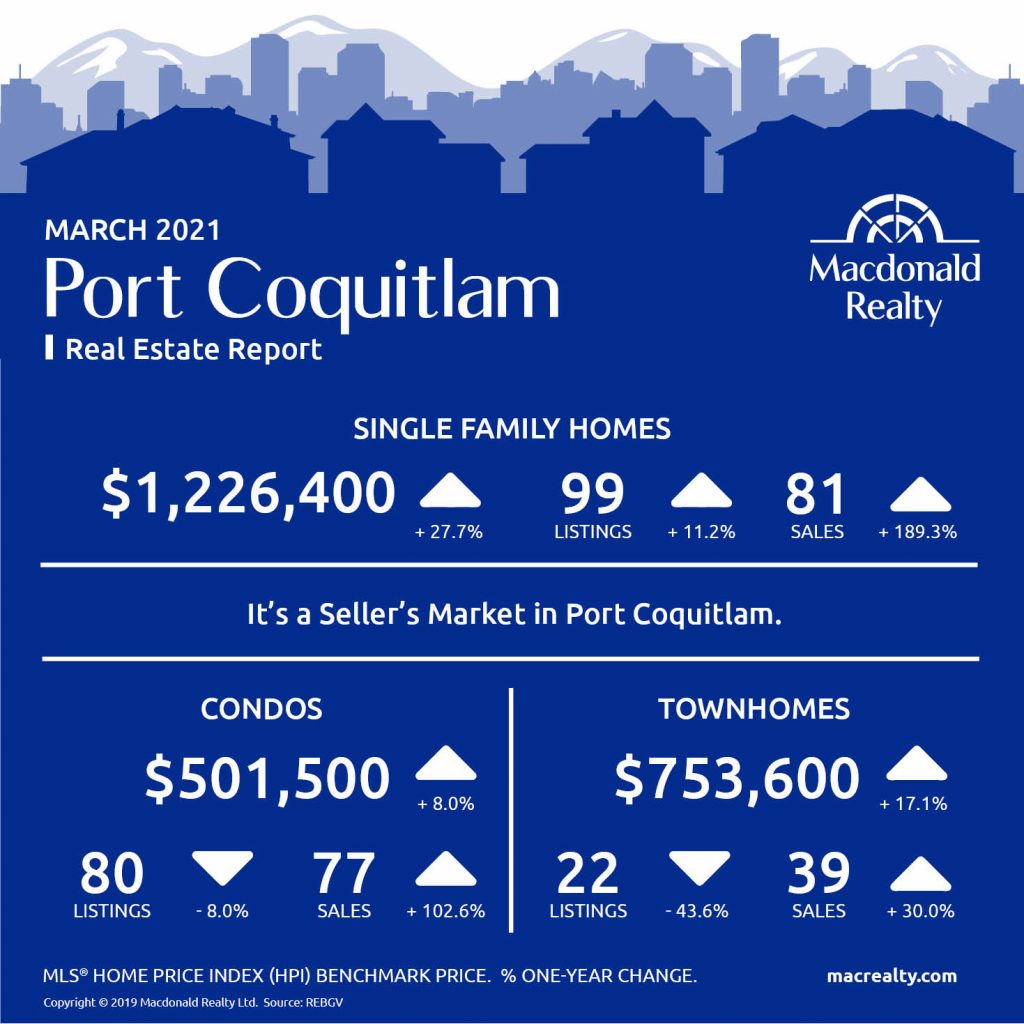
Port Coquitlam
Port Moody
Richmond
Tsawwassen

Vancouver East
Vancouver West
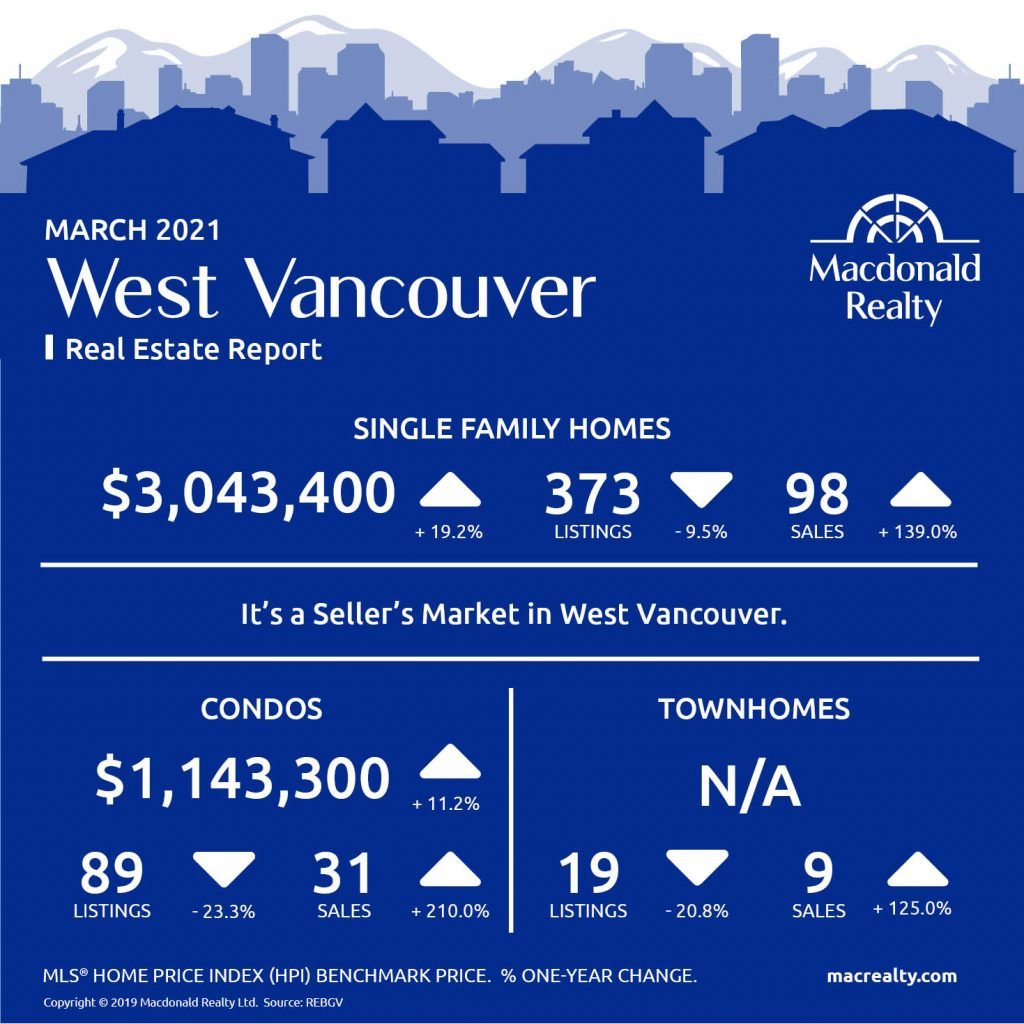
West Vancouver
Looking for more information about the real estate market in specific neighbourhoods in the Greater Vancouver?
Macdonald Realty has offices across the Greater Vancouver. Please email [email protected] or call 1-877-278-3888 to be matched with a REALTOR® working in your area.
MLS® Home Price Index (HPI) Benchmark Price
Average and median home prices are often misinterpreted, are affected by change in the mix of homes sold, and can swing dramatically from month to month (based on the types and prices of properties that sold in a given month). The MLS® HPI overcomes these shortcomings and uses the concept of a benchmark home, a notional home with common attributes of typical homes in a defined area. Visit www.housepriceindex.ca for more information.
This blog post is based on market data provided by the Real Estate Board of Greater Vancouver (REBGV) www.rebgv.org
by Macrealty Marketing Team | Apr 7, 2021 | Market Updates
Here are the latest real estate market statistics from Macdonald Realty on Okanagan listings and sales in March 2021.
Find the infographics by visiting the Facebook Album.
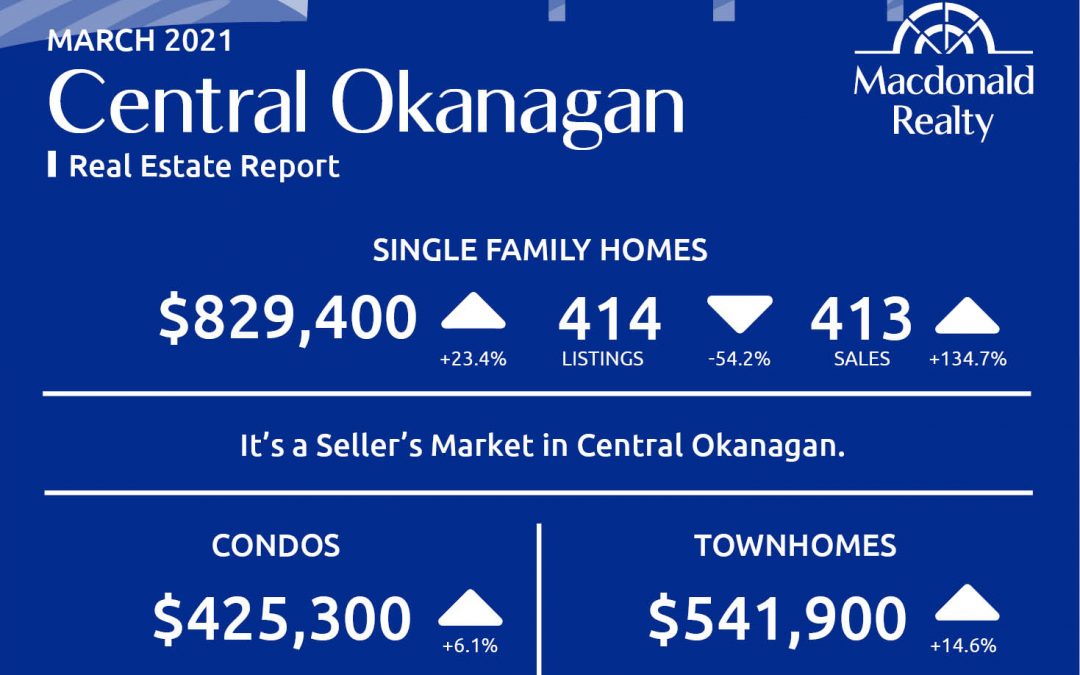
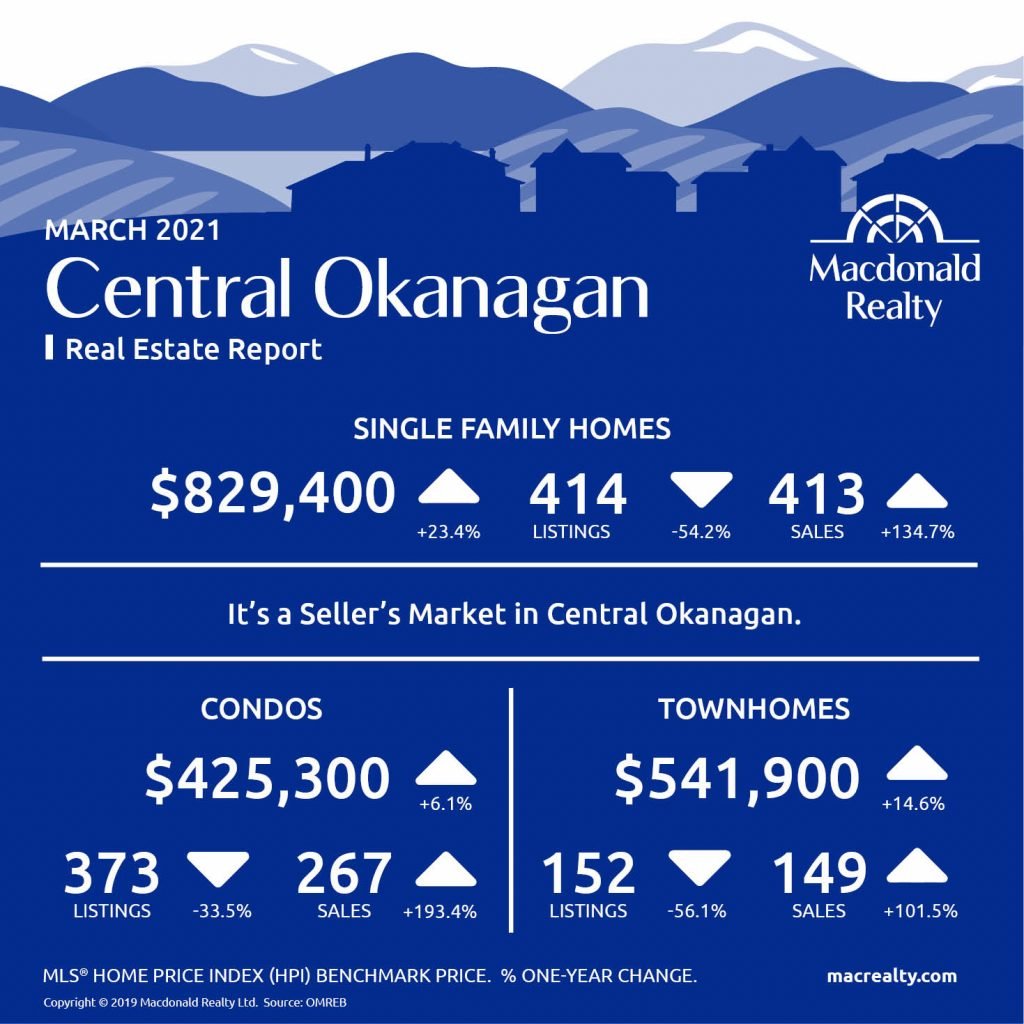
Central Okanagan: Kelowna and Lake Country
There were 413 sales, 414 active listings, and $829,400 average sale price for detached homes in the Central Okanagan market, including Kelowna and Lake Country.
The condo market featured 267 sales and 373 active listings at the end of the month. The average sale price was $425,300.
Townhome sales were 149, active listings were 152 and the average sale price was $541,900.
It’s a seller’s market in Central Okanagan.
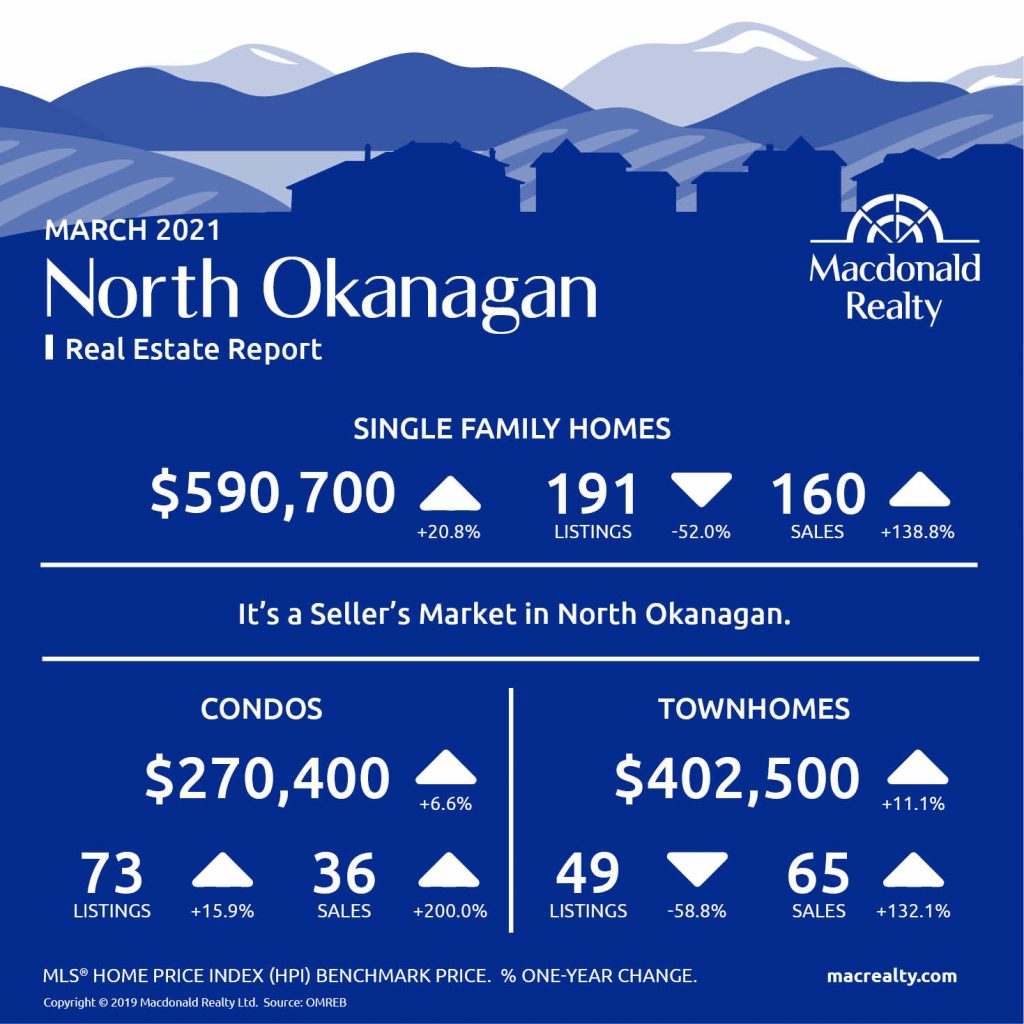
North Okanagan: Vernon and surrounding area
In North Okanagan, including Vernon and the surrounding area and the average sale price was $590,700. At the end of the month, there were 160 sales and 191 active listings.
There were 36 sales and 73 active listings for condos. The average sale price was $270,400.
In comparison, townhomes featured 65 sales, 49 active listings and a $402,500 average sale price.
It’s a seller’s market in North Okanagan.
Looking for more information about the real estate market in specific neighbourhoods in Okanagan?
Macdonald Realty has offices in Kelowna and across BC. Please email [email protected] or call 1-877-278-3888 to be matched with a REALTOR® working in your area.
This blog post is based on market data provided by Okanagan Mainline Real Estate Board (OMREB) www.omreb.com.
by Macrealty Marketing Team | Apr 7, 2021 | Market Updates
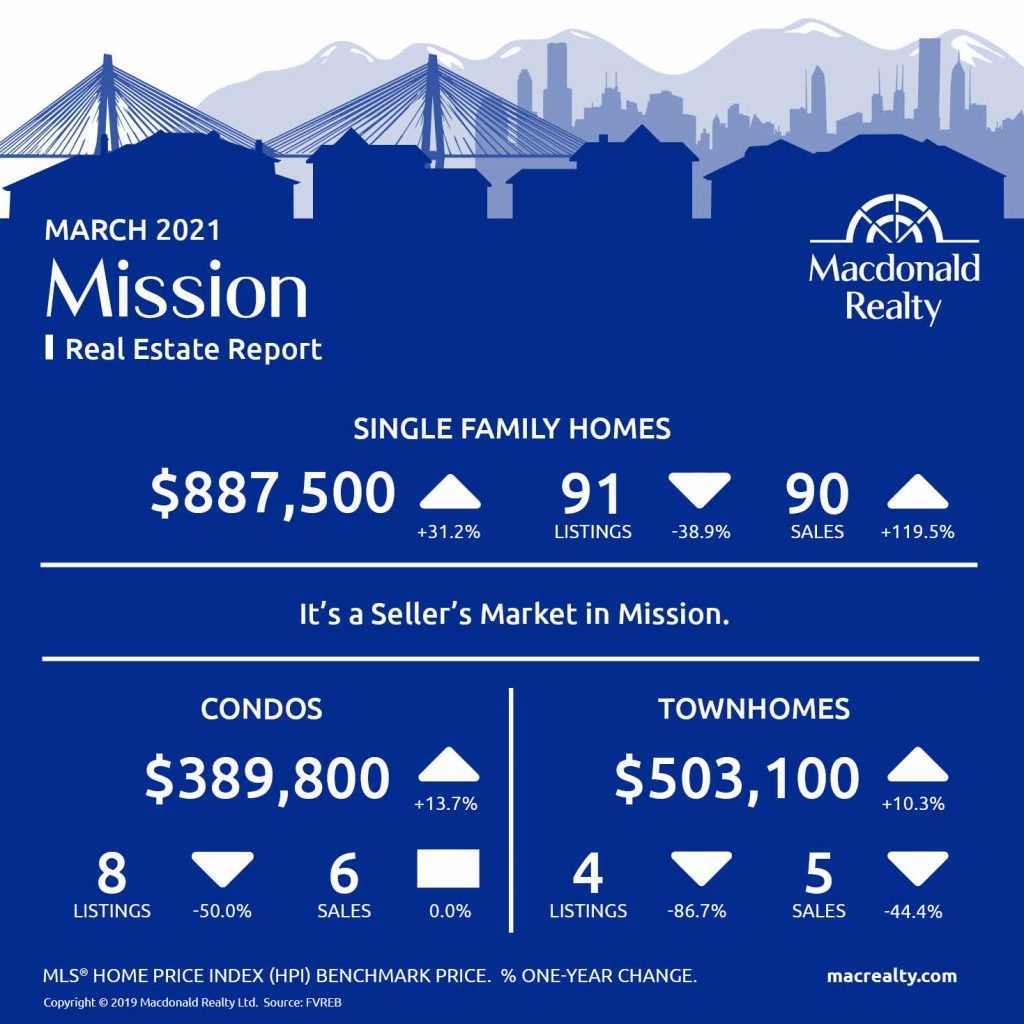
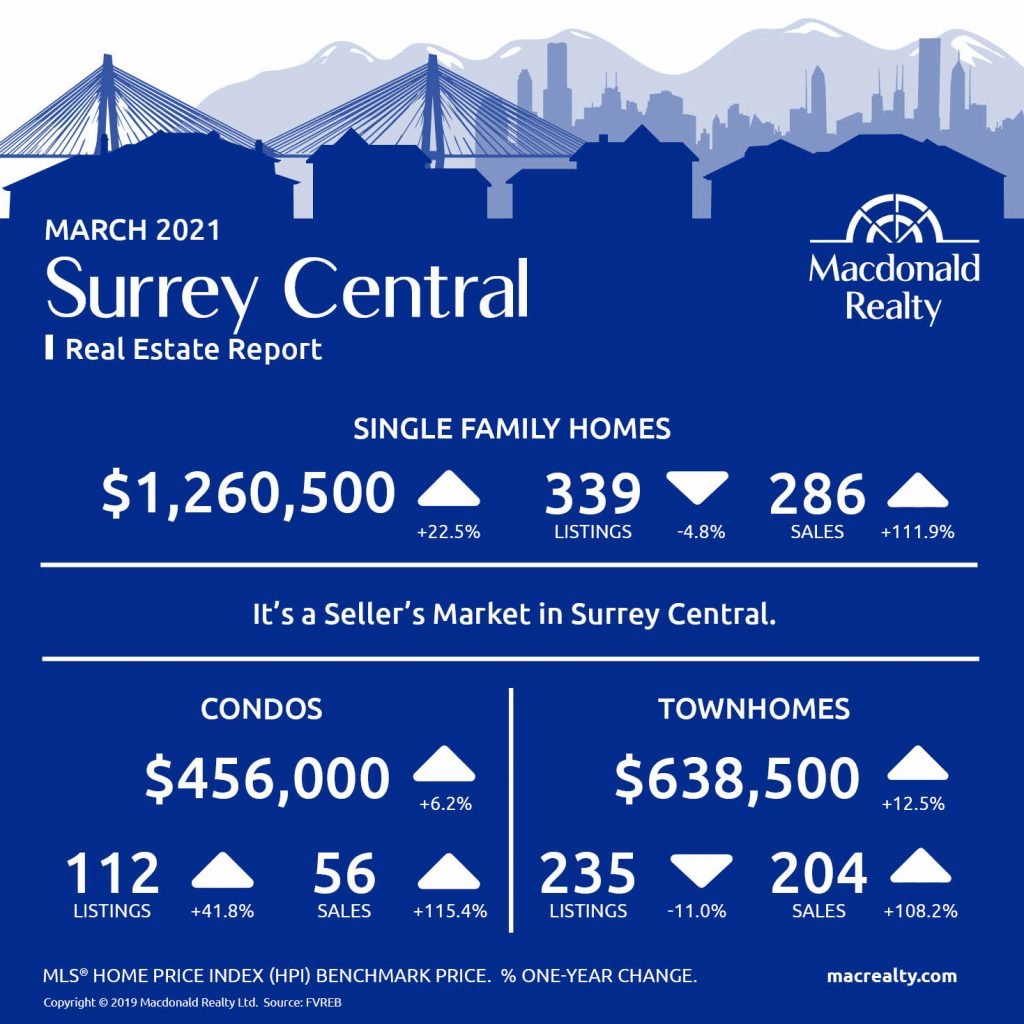
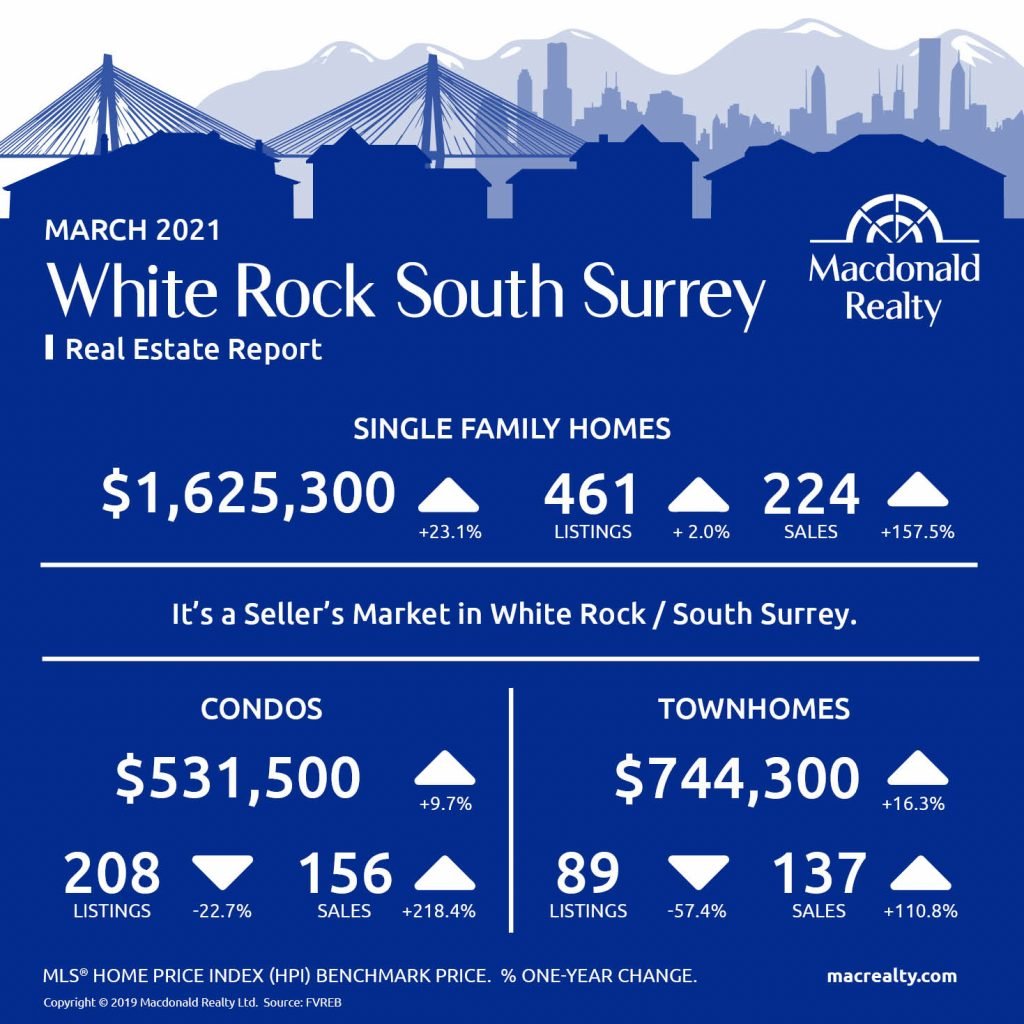
According to the Fraser Valley Real Estate Board March shatters monthly sales and new listings records.
As released by the FVREB “In March, the Fraser Valley real estate hit two historical highs in March, setting records for both sales and new listings processed in one month since the Fraser Valley Real Estate Board’s (FVREB) inception in 1921.
In March, the FVREB processed 3,329 residential and commercial sales on its Multiple Listing Service® (MLS®), an increase of 131 per cent compared to March 2020 and 18 per cent more than were processed in February. The previous record of 3,006 sales was set in March of 2016
Larry Anderson, President of the Board, said of this month’s statistics, “This market is uncharted territory for Fraser Valley real estate. The surprising strength of the economy, the influence of the pandemic and a lack of inventory of all property types has created unprecedented demand for housing in our region.
“It is very stressful for buyers. REALTORS® are working hard to guide them through what has become a protracted, powerful seller’s market. As we continue to help our clients grapple with escalating prices and multiple offers, March did bring some good news. It set a record for volume of new listings received improving selection,” said Anderson.
Find all the infographics related to the May Market Statistics by visiting the Facebook Album.
Abbotsford
Cloverdale
Langley
Mission
North Delta

North Surrey

Surrey Central
White Rock / South Surrey
Looking for more information about the real estate market in specific neighbourhoods in Surrey, Langley and Fraser Valley?
Macdonald Realty has offices in North Delta, White Rock/South Surrey, and Langley. Please email [email protected] or call 1-877-278-3888 to be matched with a REALTOR® working in your area.
MLS® Home Price Index (HPI) Benchmark Price
Average and median home prices are often misinterpreted, are affected by change in the mix of homes sold, and can swing dramatically from month to month (based on the types and prices of properties that sold in a given month). The MLS® HPI overcomes these shortcomings and uses the concept of a benchmark home, a notional home with common attributes of typical homes in a defined area. Visit www.housepriceindex.ca for more information.
This blog post is based on market data provided by the Fraser Valley Real Estate Board (FVREB) www.fvreb.bc.ca

