by Macrealty Marketing Team | Oct 5, 2023 | Market Updates
October 2023 – Lower Mainland Monthly Update
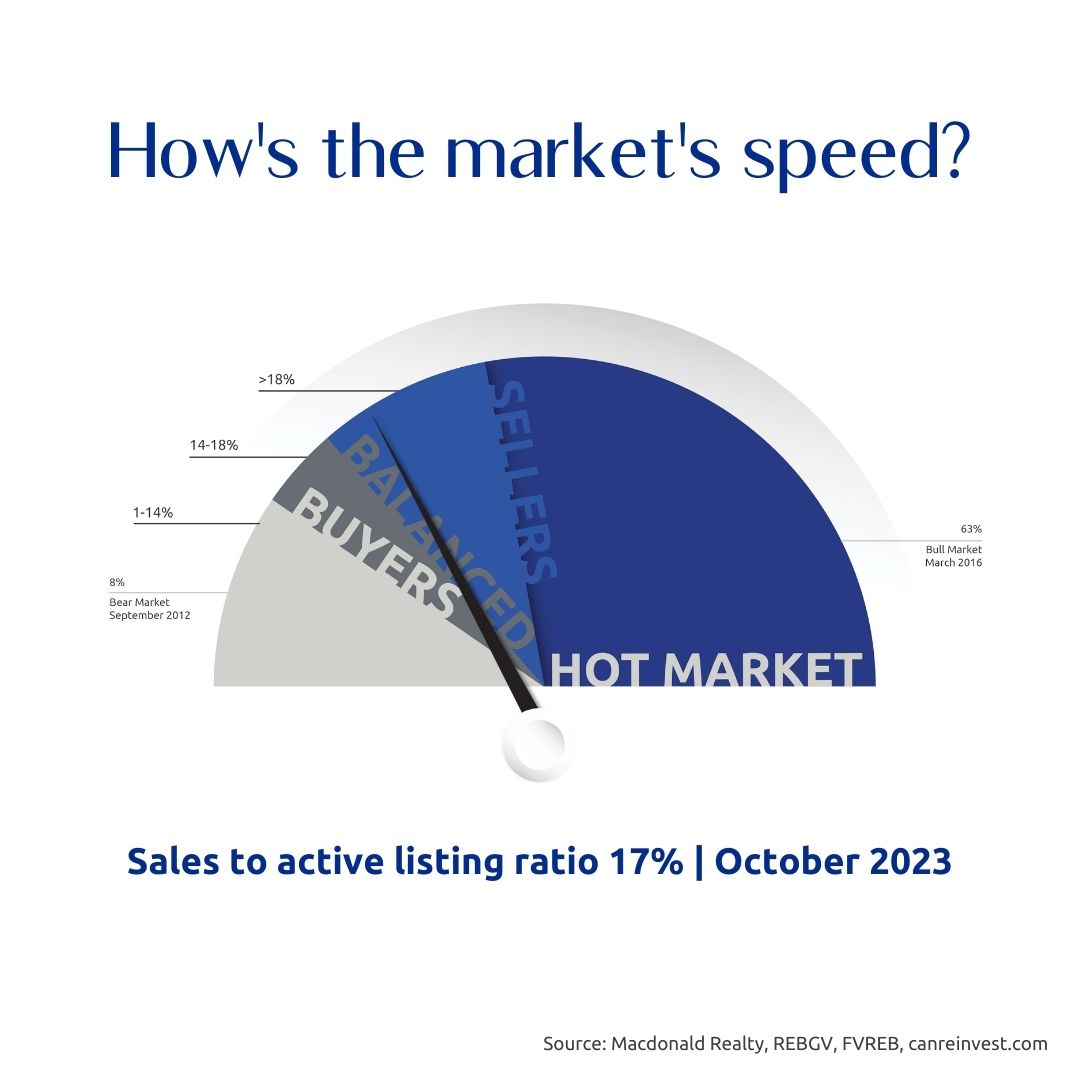
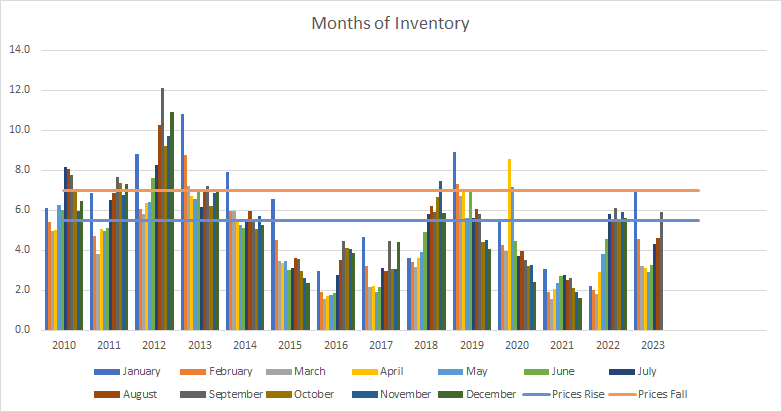
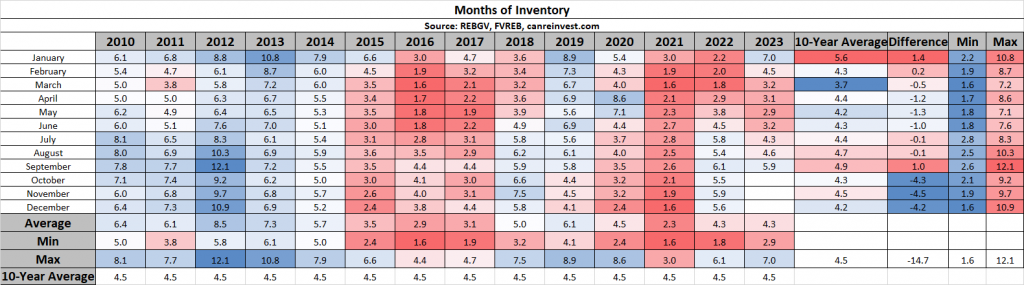
At 5.9 Months of Inventory, Prices are expected to Remain Flat.
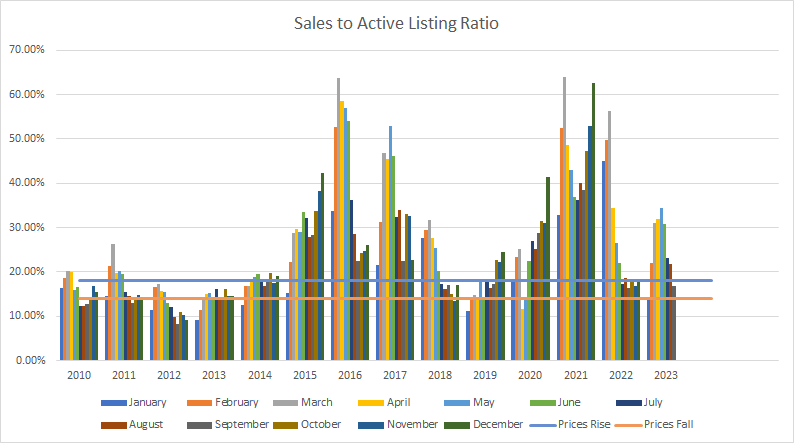
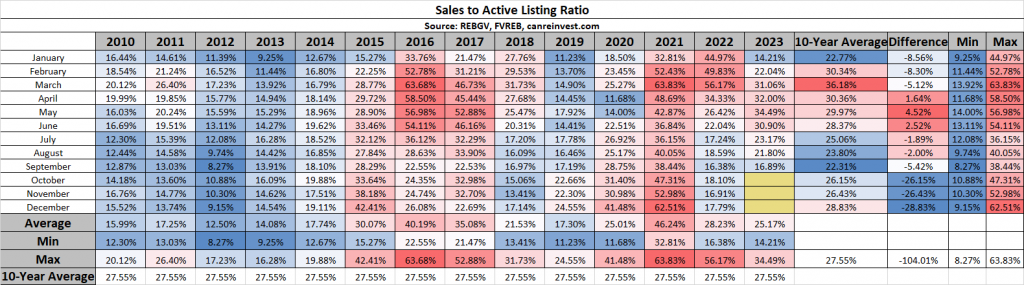
The most reliable indicator of market prices is the Sales to Active Listings Ratio (SAL). This is the ratio between the number of sales in a given month and the number of active listings at month-end.
In hotter markets in BC, a long-term analysis has shown that prices will usually act in the following ways:
- 7+ Months of Inventory (Under 14% SAL): Prices will likely DECLINE
- 5 – 7 Months of Inventory (14% – 18% SAL): Prices will likely be STABLE
- Less than 5.5 Months of Inventory (Over 18% SAL): Prices will likely RISE
Visit this link to learn more about house prices and inventory.
Sales
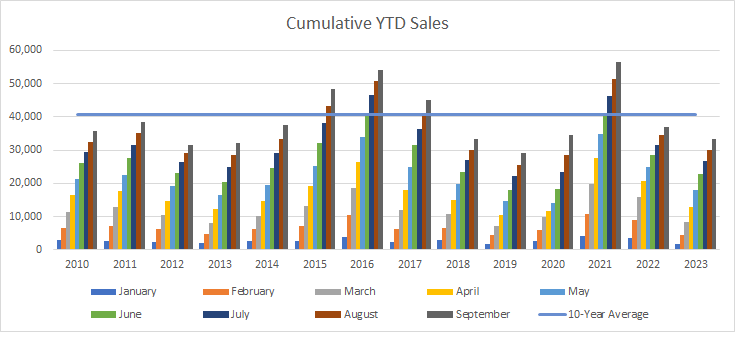
Sales in September 2023 (3,026) were 15% higher than September 2022 (2,584), and were 25% below the 10-year average (4,082).
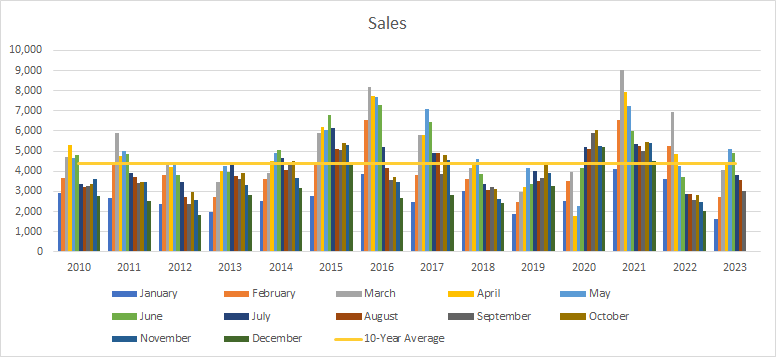
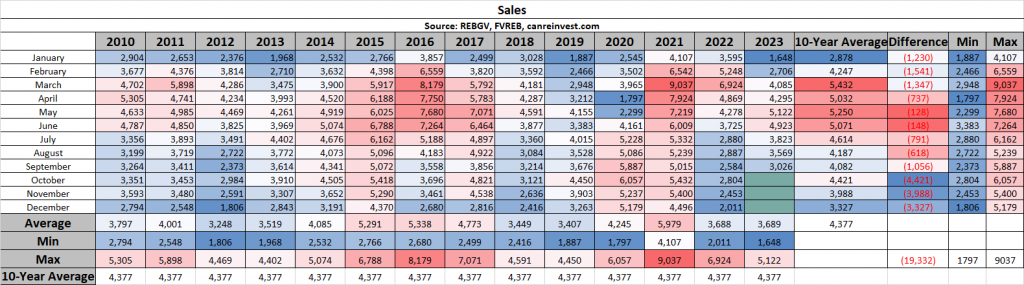
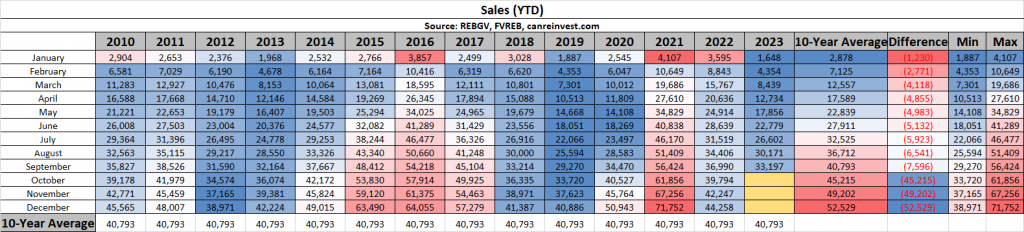
Cumulative Year-to-date Sales
2023 continues to be slower as sales (33,197) remain below the 10-year average (40,793).
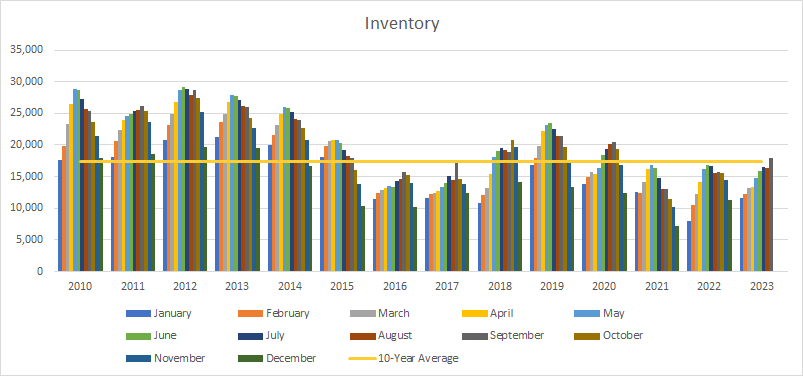
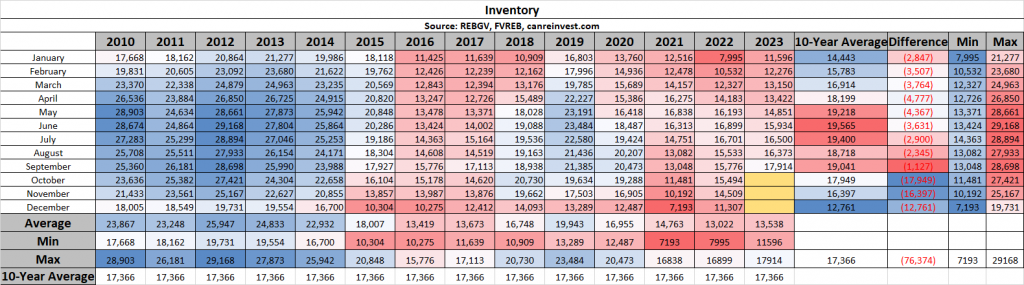
Inventory
September inventory (17,914 active listings) increased slightly from the previous month, and are nearly 6% below the 10-year average (19,041 average).
Sales to Active Listings
Low sales but lower inventory kept the Sales to Active Listing Ratio at 17%, indicating flat prices.
Months of Inventory
Similarly, Months of Inventory rose to 5.9 MOI, indicating a balanced market and flat prices.
Want to learn more about these stats or discuss your move to Macdonald Realty?
Check out careersinbcrealestate.com to connect today!
by Macrealty Marketing Team | Oct 5, 2023 | Market Updates
Here are the latest real estate market statistics from Macdonald Realty on the Greater Vancouver listings and sales in September 2023. Find all the infographics by visiting the Facebook Album.
The month-over-month price gains seen earlier this year abated in the Metro Vancouver housing market in September due to a seasonal decline in
sales and a modest increase in inventory levels across the region.
The Real Estate Board of Greater Vancouver (REBGV) reports that residential home sales in the region totalled 1,926 in September 2023, a 13.2 per cent increase from the 1,701 sales recorded in September 2022. This was 26.3 per cent below the 10-year seasonal average (2,614).
“A key dynamic that we’ve been watching this year has been the reluctance of some homeowners to list their homes given that mortgage rates are the highest they’ve been in over ten years,” Andrew Lis, REBGV’s director of economics and data analytics said. “With fewer listings coming to the market earlier this year than usual, inventory levels remained very low, which led prices to increase throughout the spring and summer months.”
There were 5,446 detached, attached and apartment properties newly listed for sale on the Multiple Listing Service® (MLS®) in Metro Vancouver in September 2023. This represents a 28.4 per cent increase compared to the 4,243 homes listed in September 2022. This was 5.2 per cent above the 10-year seasonal average (5,179).
The total number of homes currently listed for sale on the MLS® system in Metro Vancouver is 11,382, a 9.2 per cent increase compared to September 2022 (10,427). This was 6.2 per cent below the 10-year seasonal average (12,136).
Across all detached, attached and apartment property types, the sales-to-active listings ratio for September 2023 is 17.7 per cent. By property type, the ratio is 12.6 per cent for detached homes, 21.6 per cent for townhomes, and 21.3 per cent for apartments.
Analysis of the historical data suggests downward pressure on home prices occurs when the ratio dips below 12 per cent for a sustained period, while home prices often experience upward pressure when it surpasses 20 per cent over several months.
“In contrast to the spring and summer, the September data suggests there may be a renewed interest on the part of sellers to participate in the market, with new listing activity rising back in line with long-term historical averages. This upward shift in new listings has allowed overall
inventory levels to recover modestly from the low levels we saw earlier this year,” Lis said. “When we pair this dynamic with the slowdown in sales that typically occurs in the fall as a result of seasonal patterns, the outcome is more balanced market conditions overall.”
The MLS® Home Price Index composite benchmark price for all residential properties in Metro Vancouver is currently $1,203,300. This represents a 4.4 per cent increase over September 2022 and a 0.4 per cent decrease compared to August 2023.
*Areas covered by the Real Estate Board of Greater Vancouver include Burnaby, Coquitlam, Maple Ridge, New Westminster, North Vancouver, Pitt Meadows, Port Coquitlam, Port Moody, Richmond, South Delta, Squamish, Sunshine Coast, Vancouver, West Vancouver, and Whistler. Check out the infographics of Squamish, Sunshine Coast and Whistler, HERE.
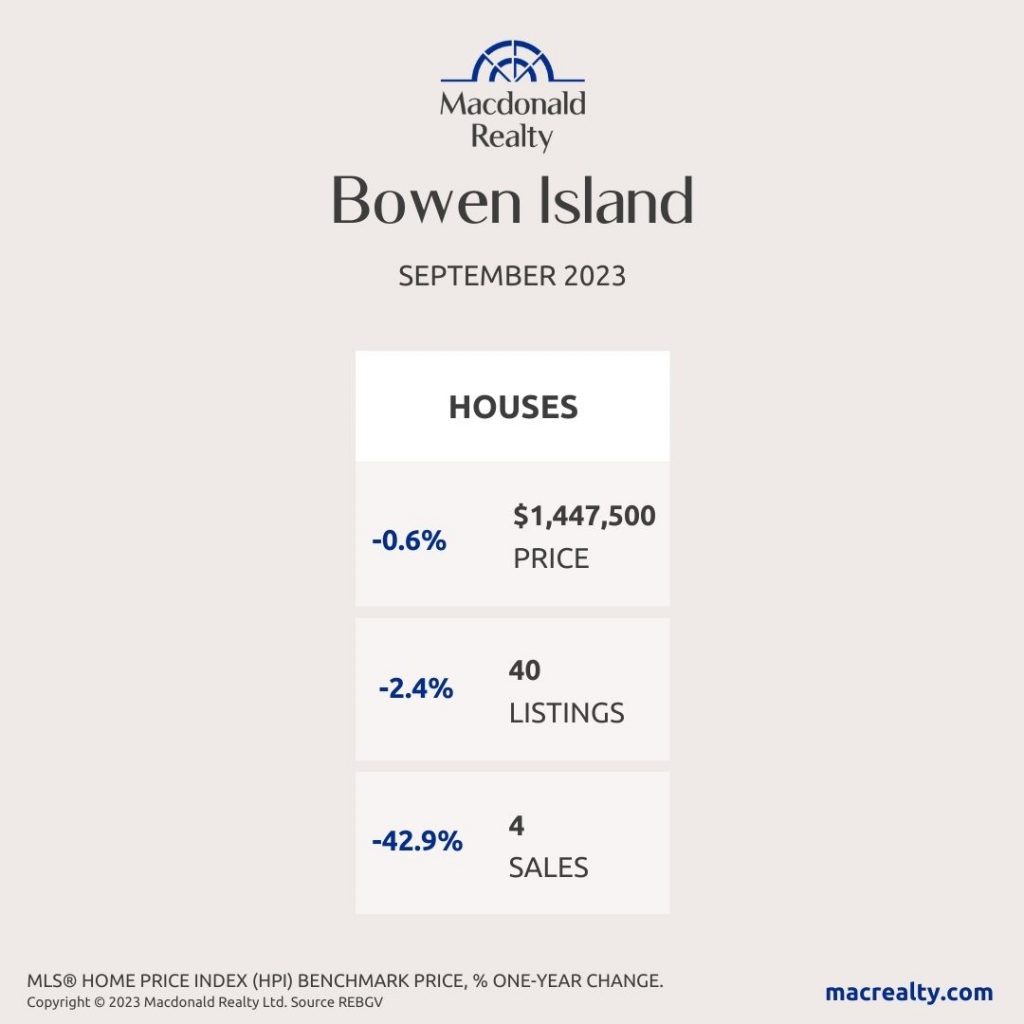
Bowen Island
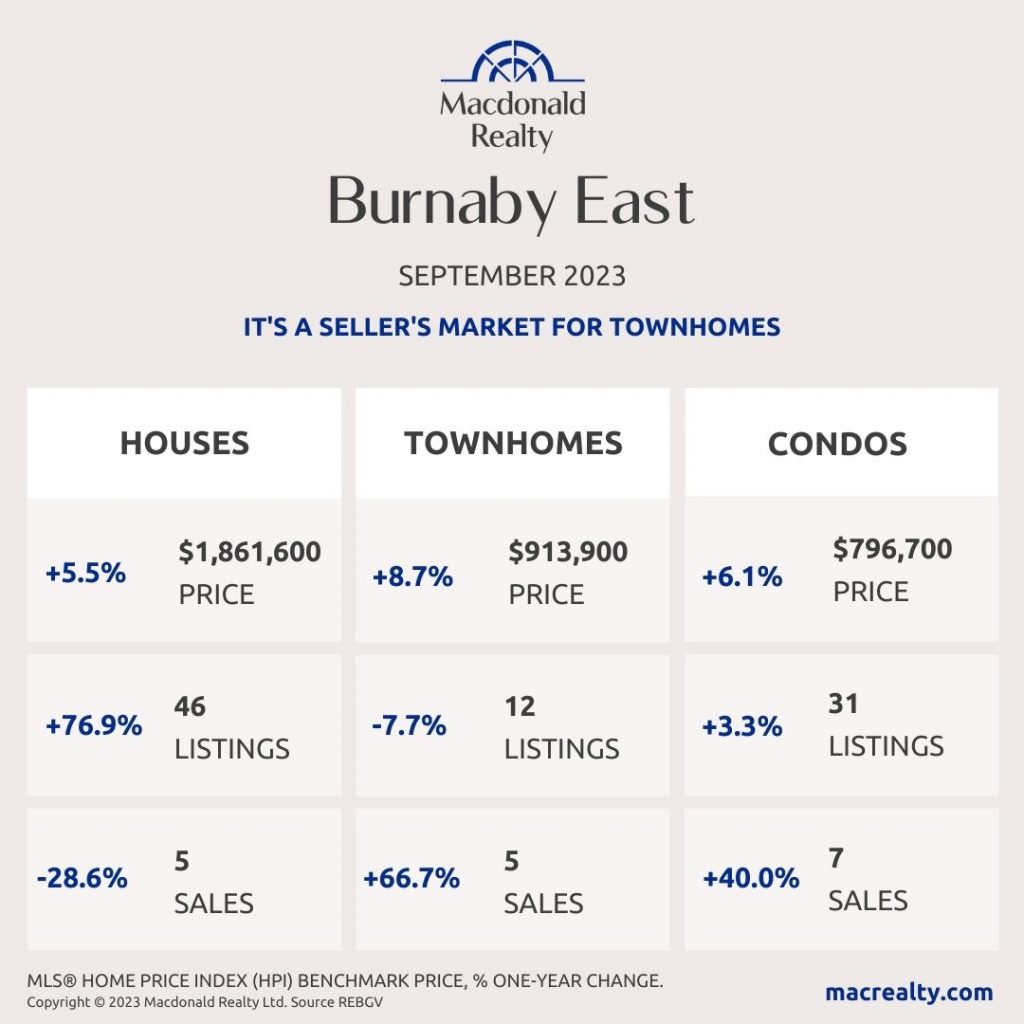
Burnaby East
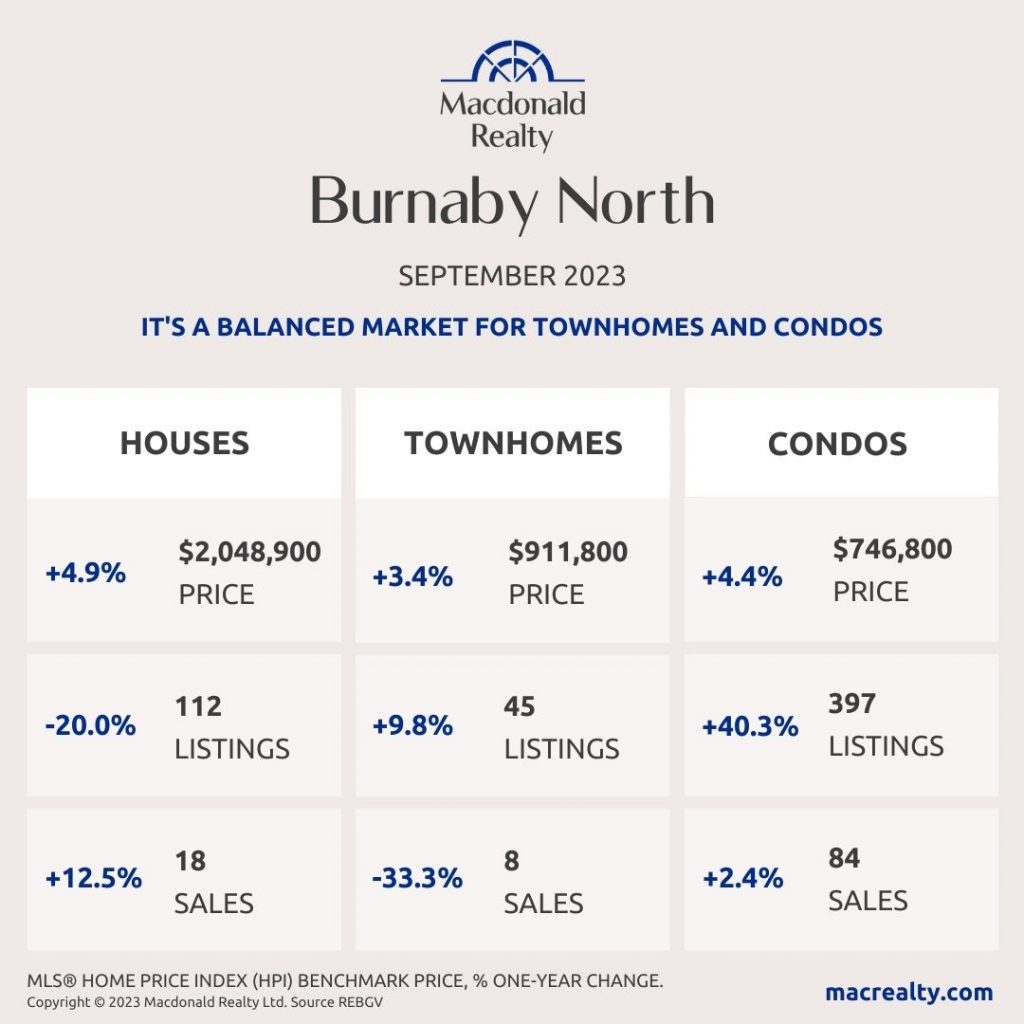
Burnaby North
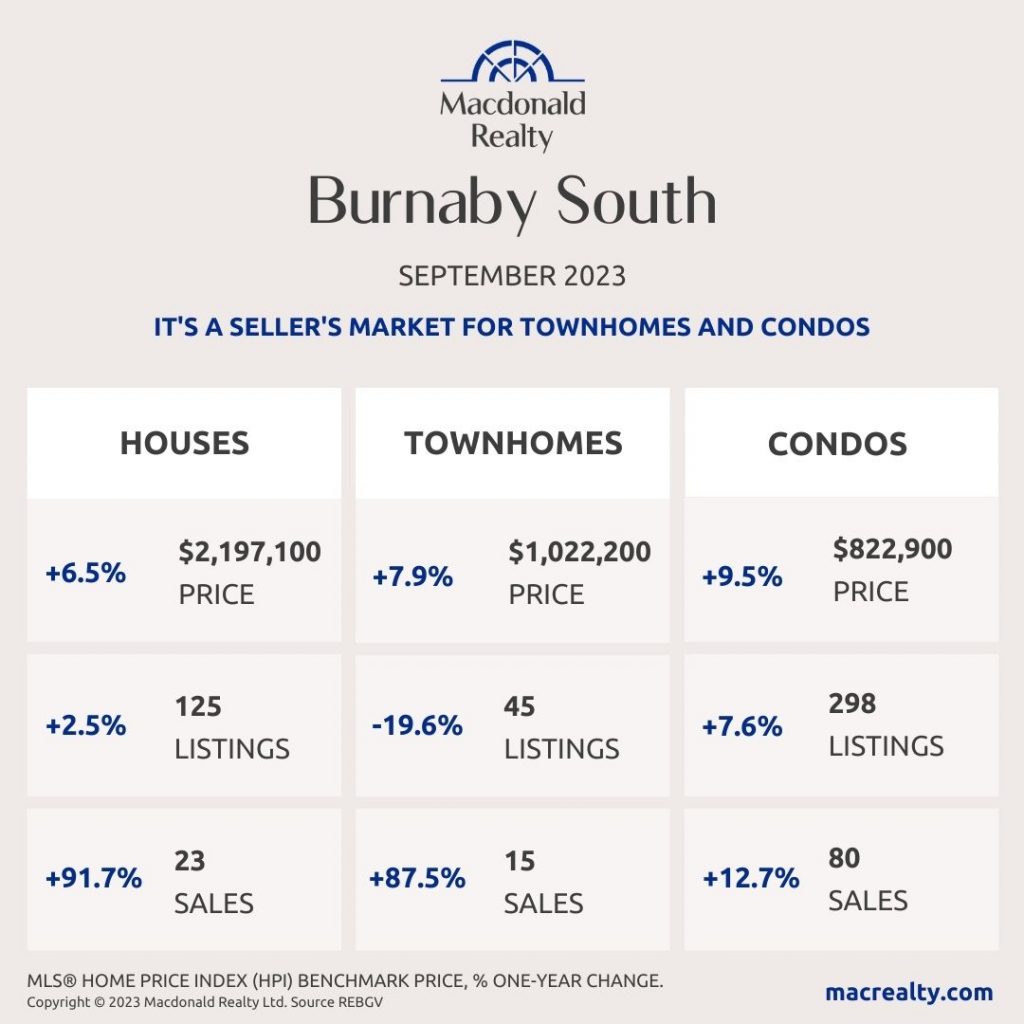
Burnaby South
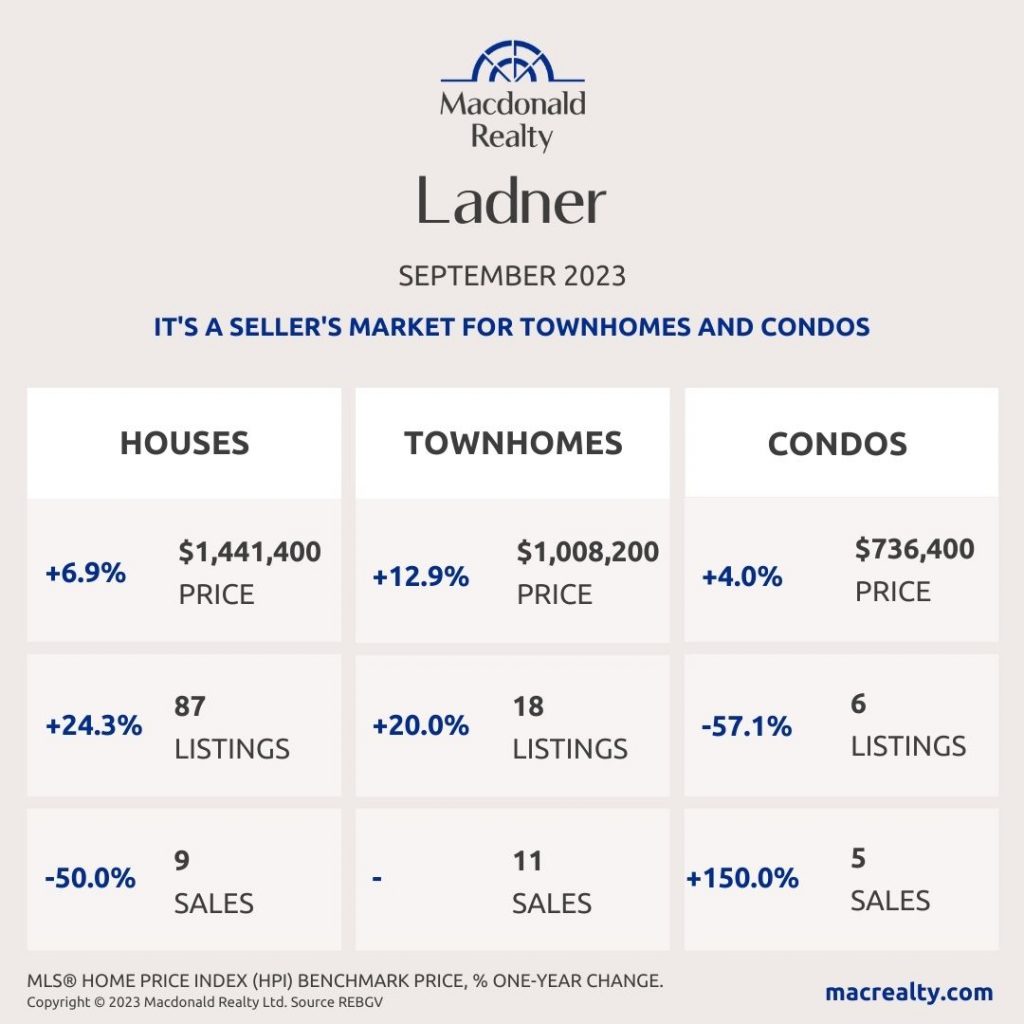
Ladner
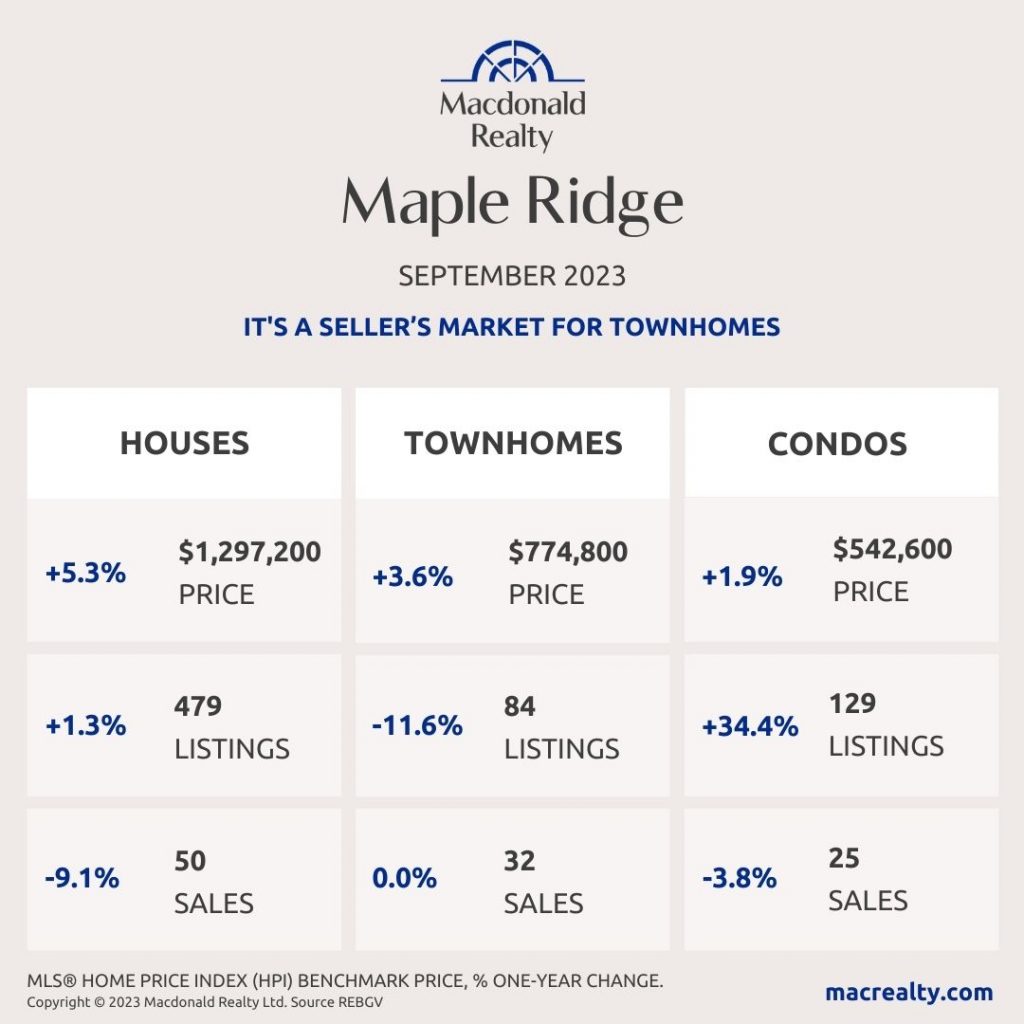
Maple Ridge
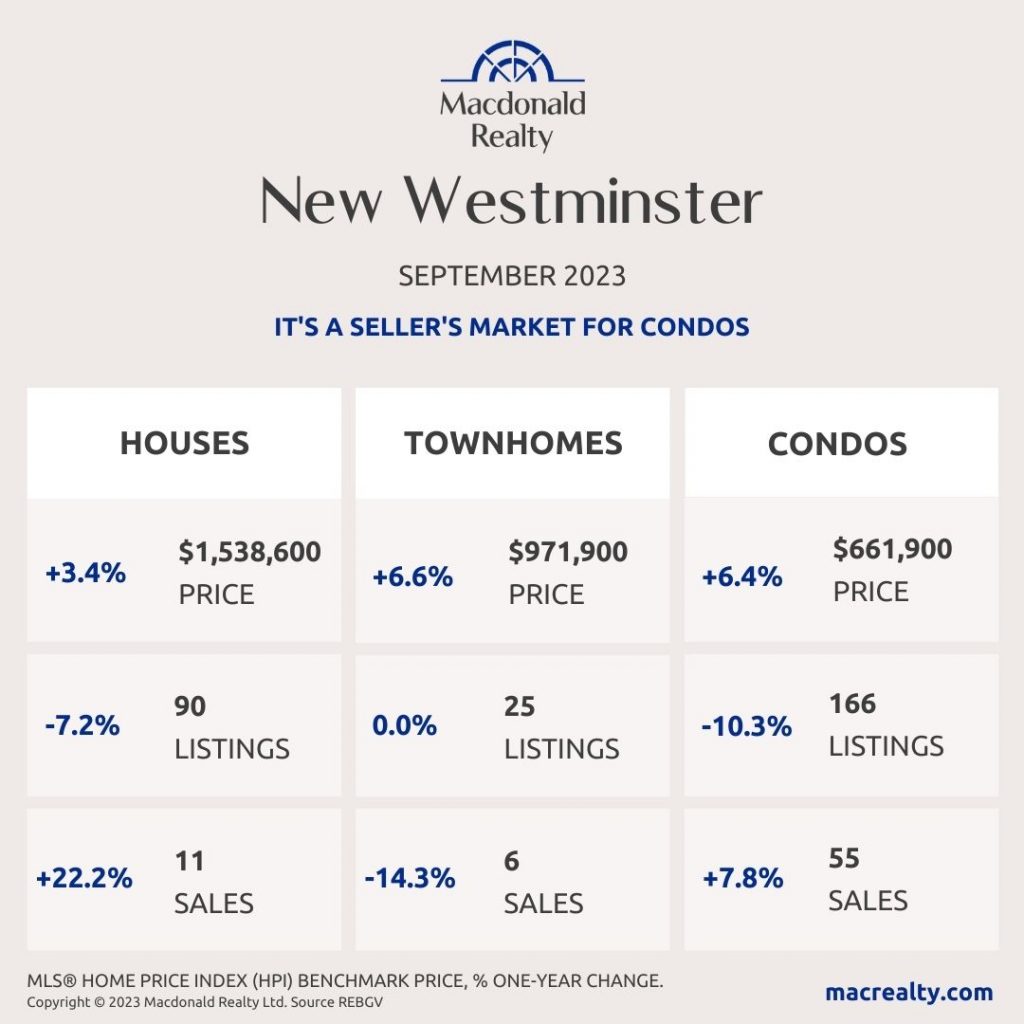
New Westminster
North Vancouver

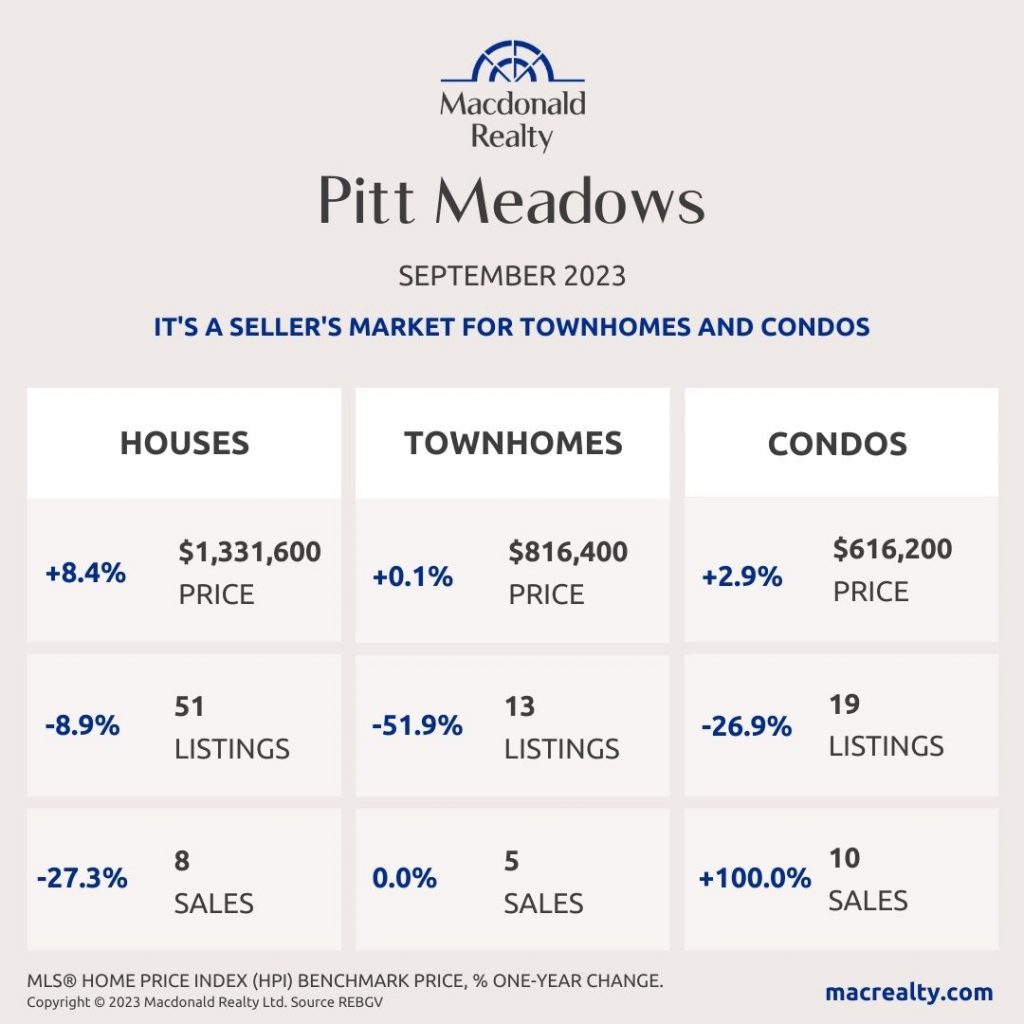
Pitt Meadows
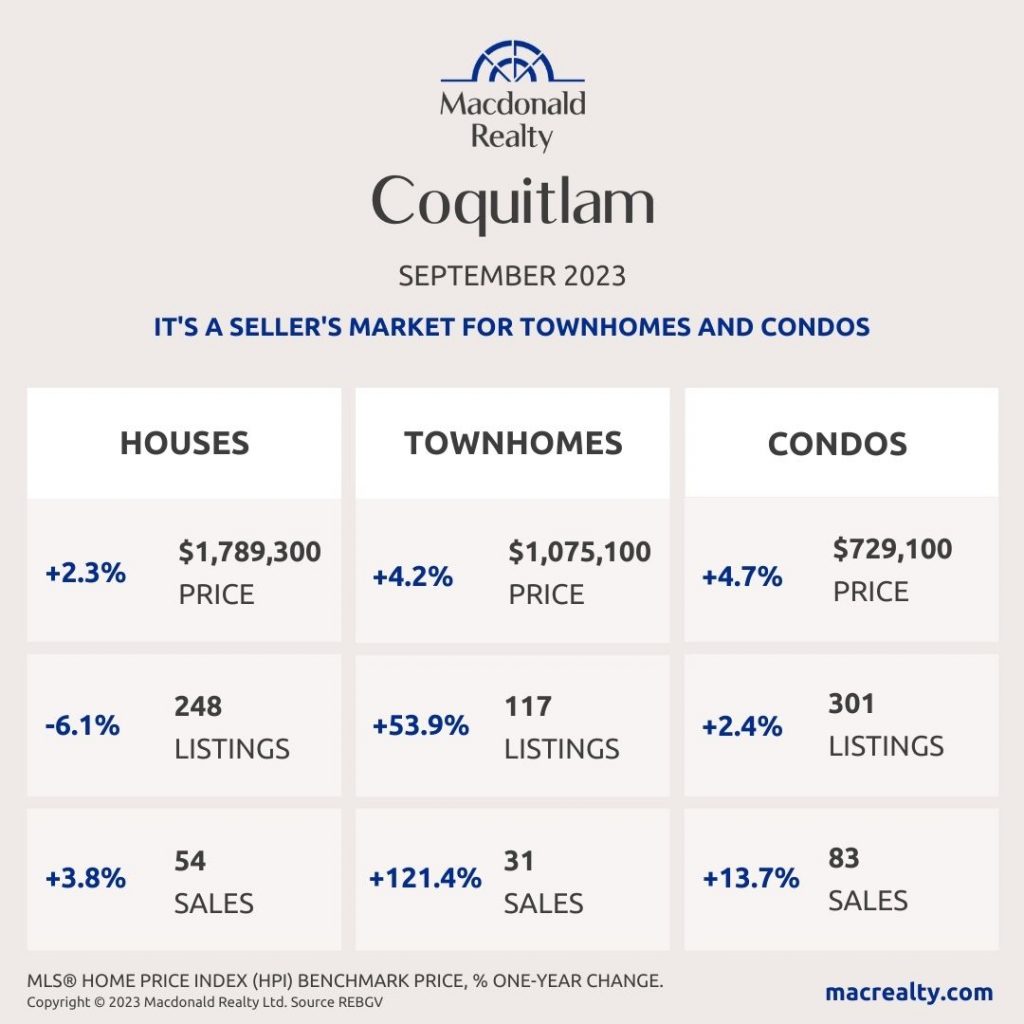
Coquitlam
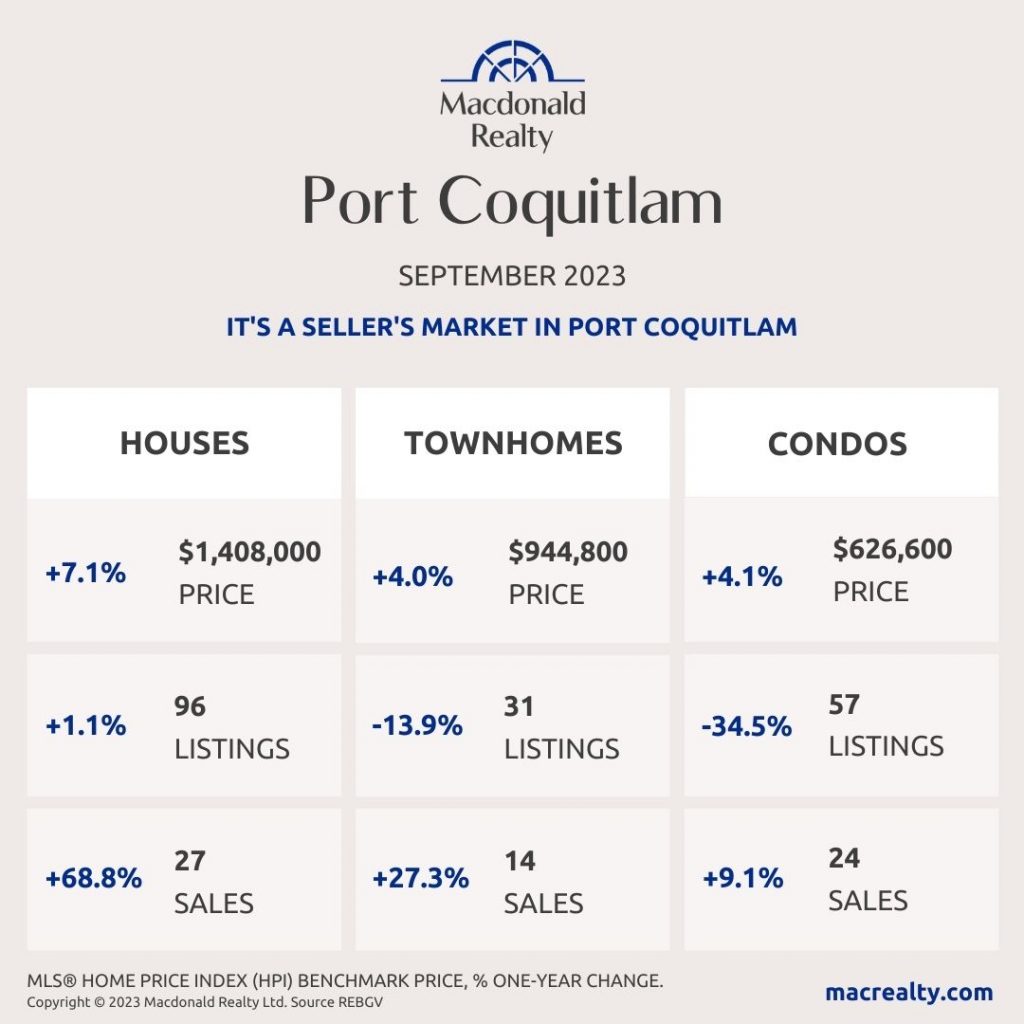
Port Coquitlam
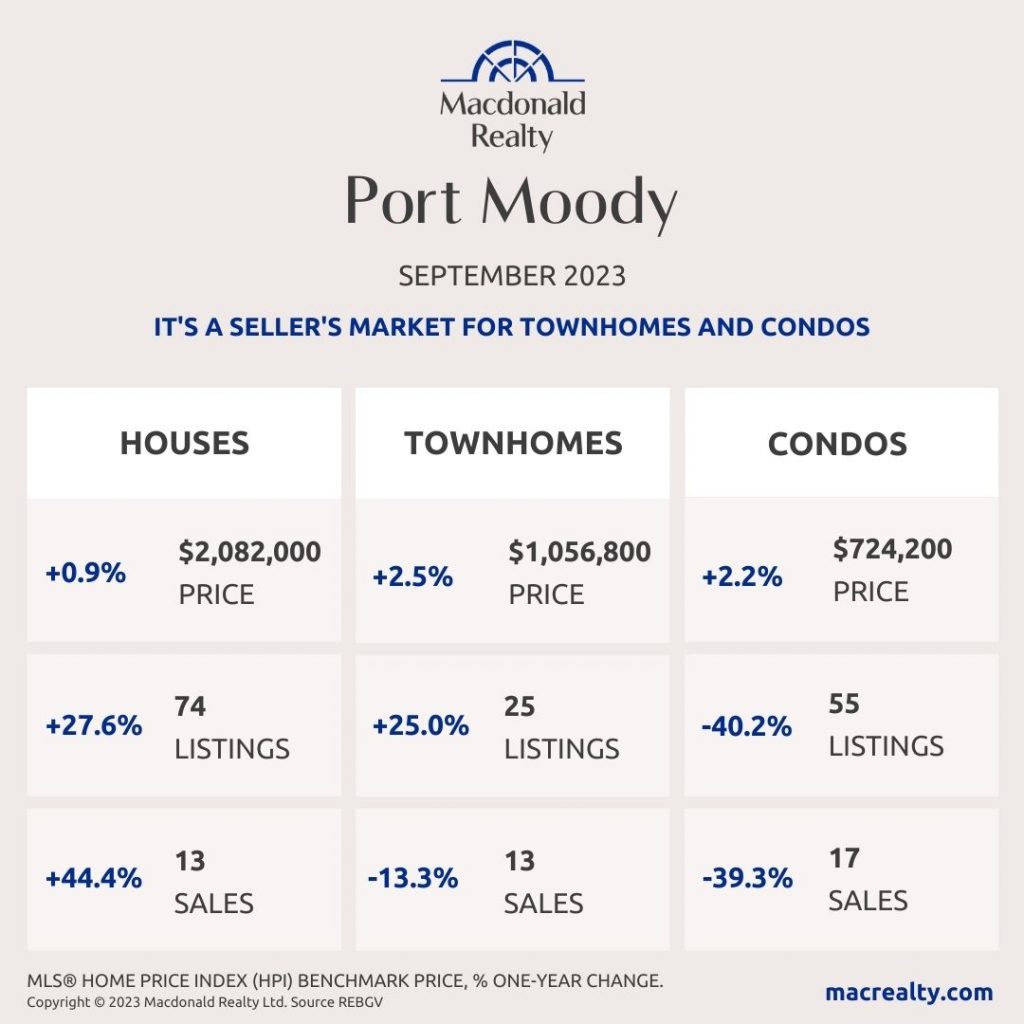
Port Moody
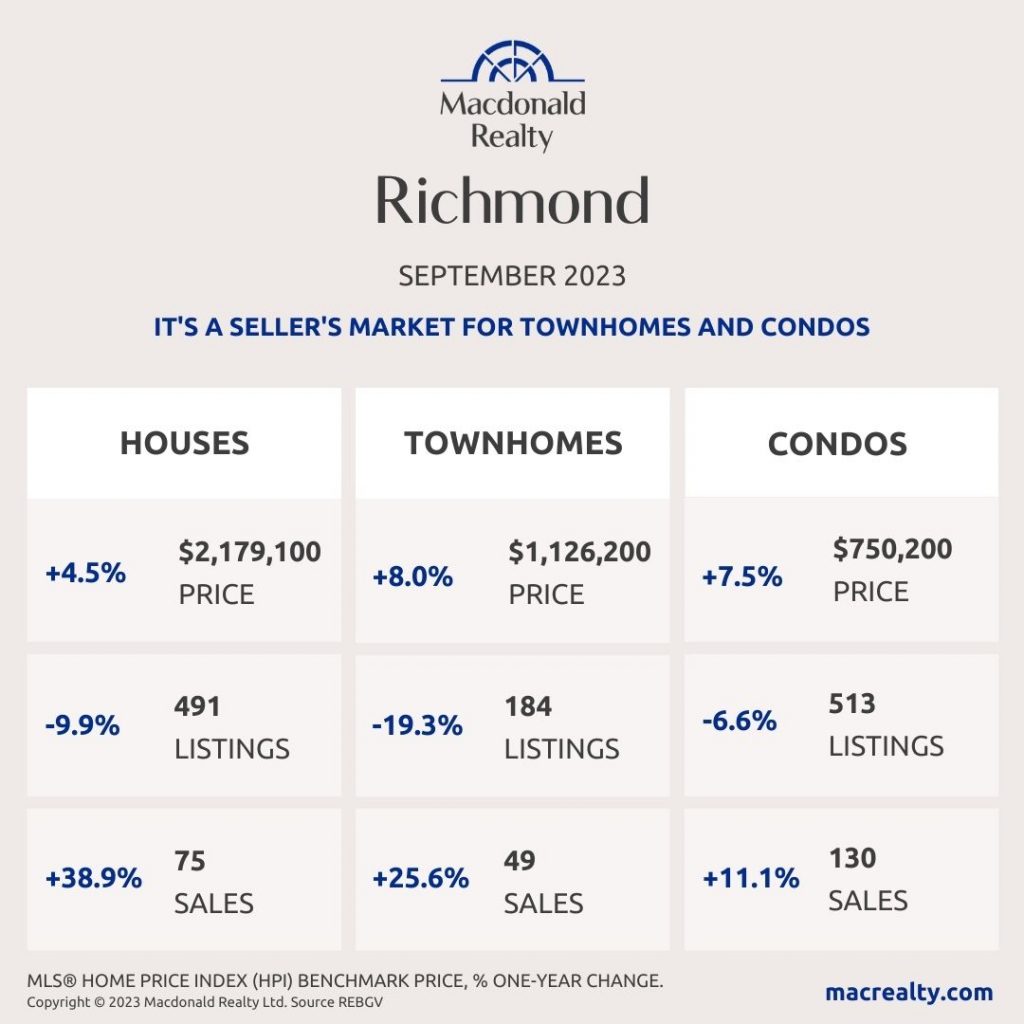
Richmond
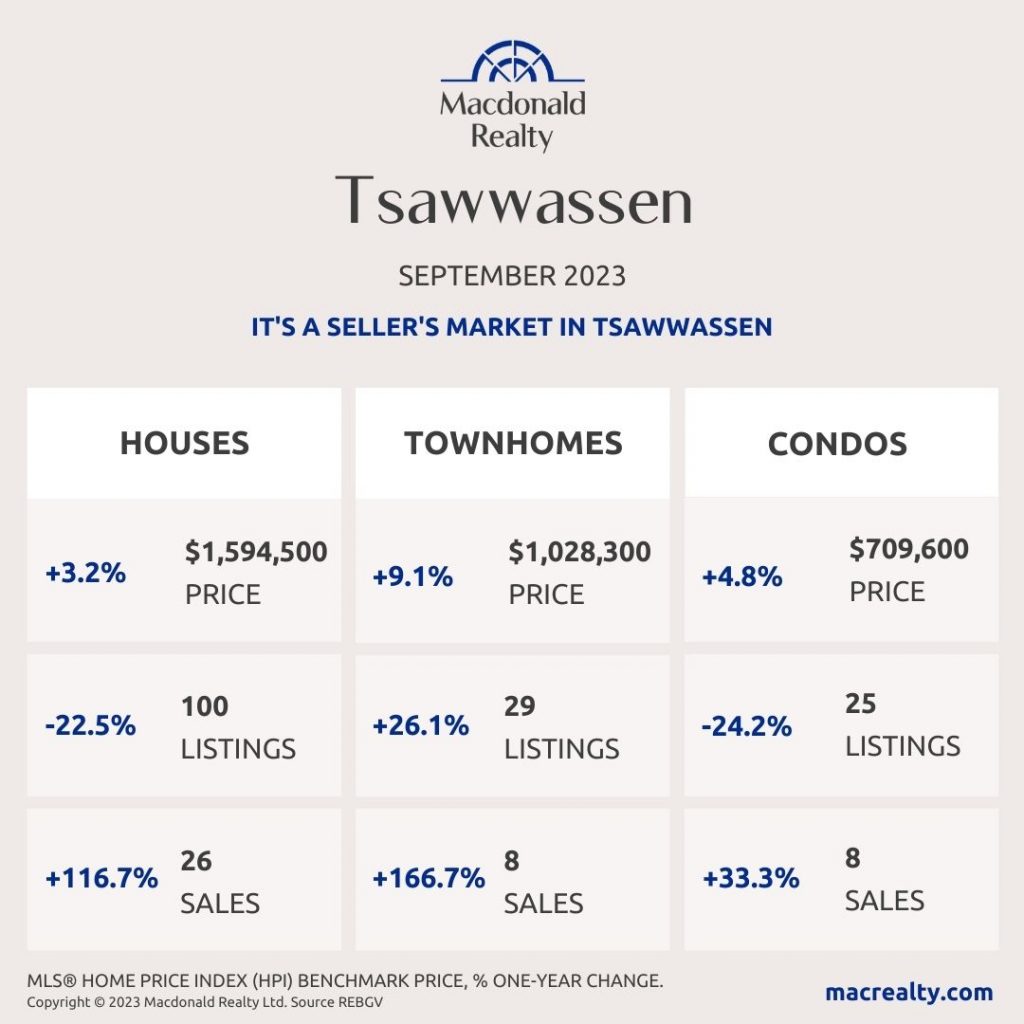
Tsawwassen
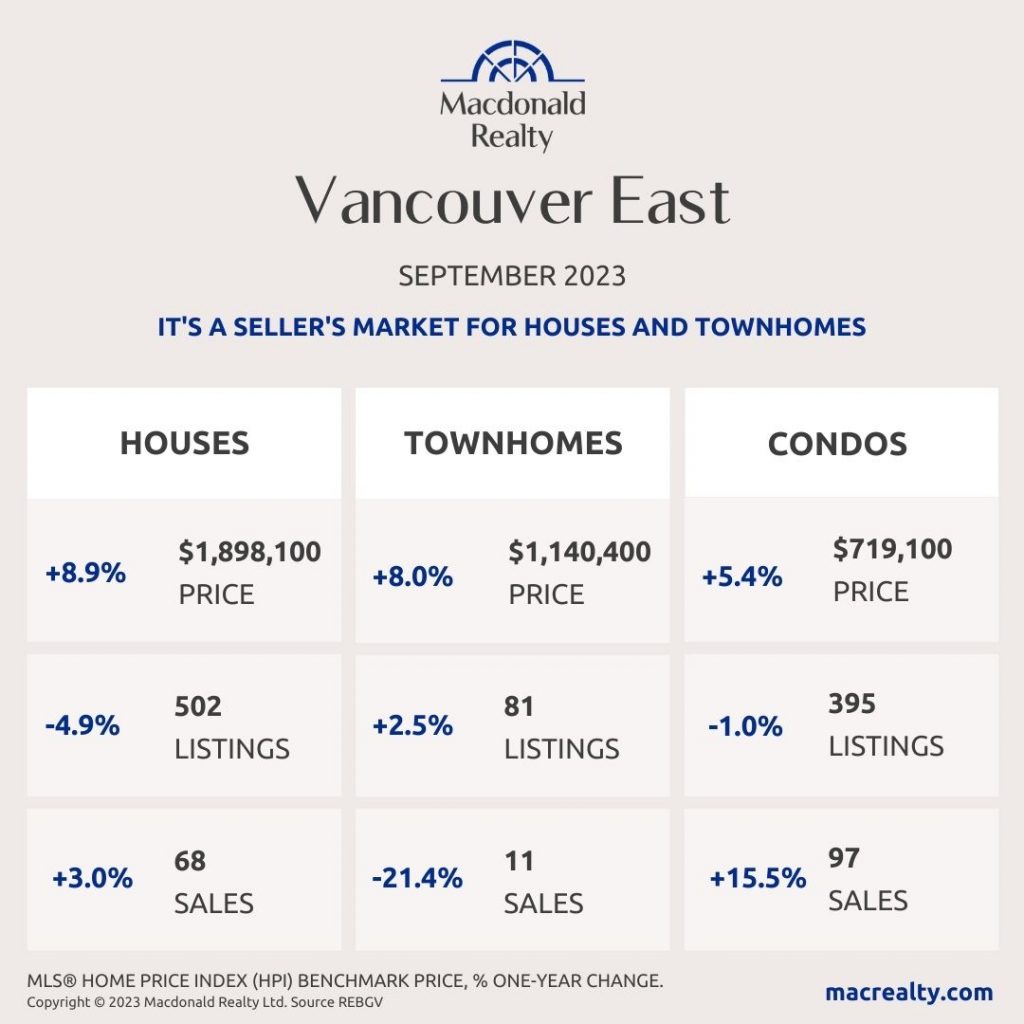
Vancouver East
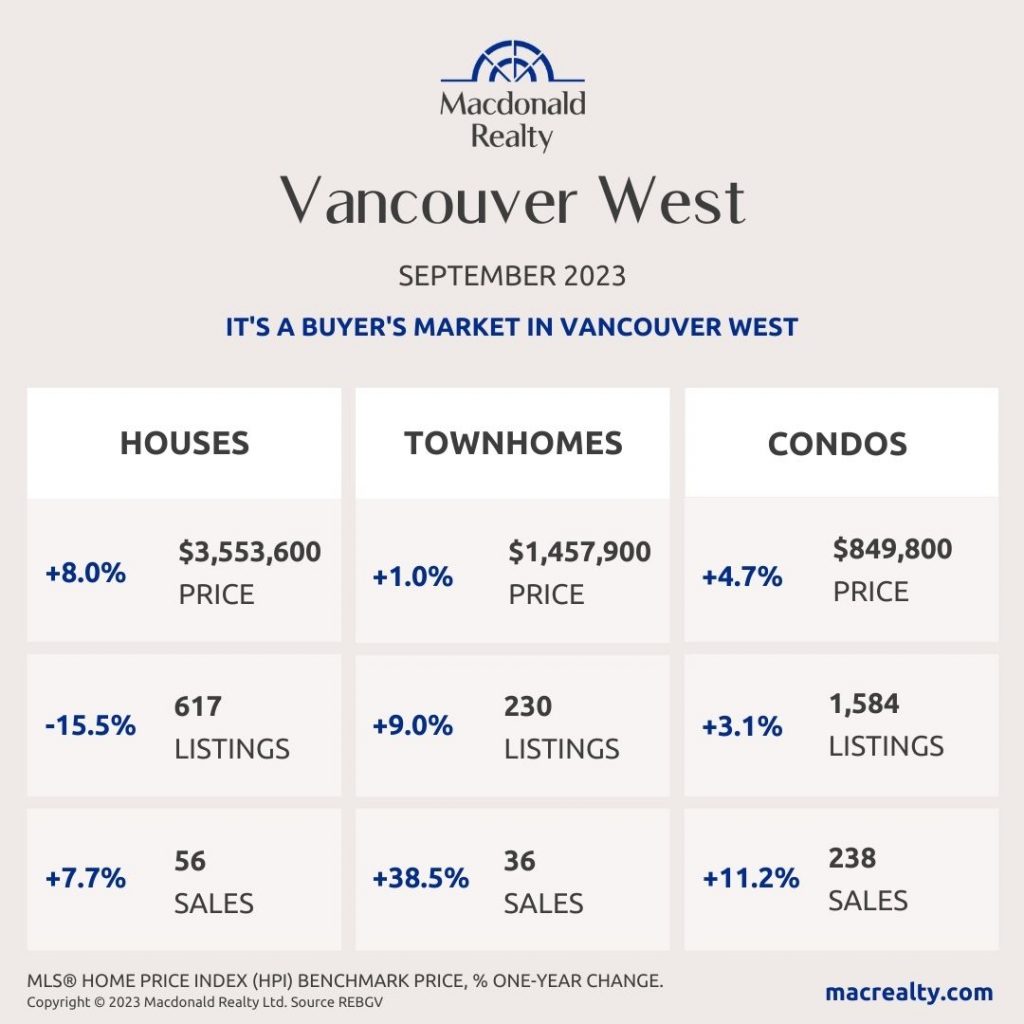
Vancouver West
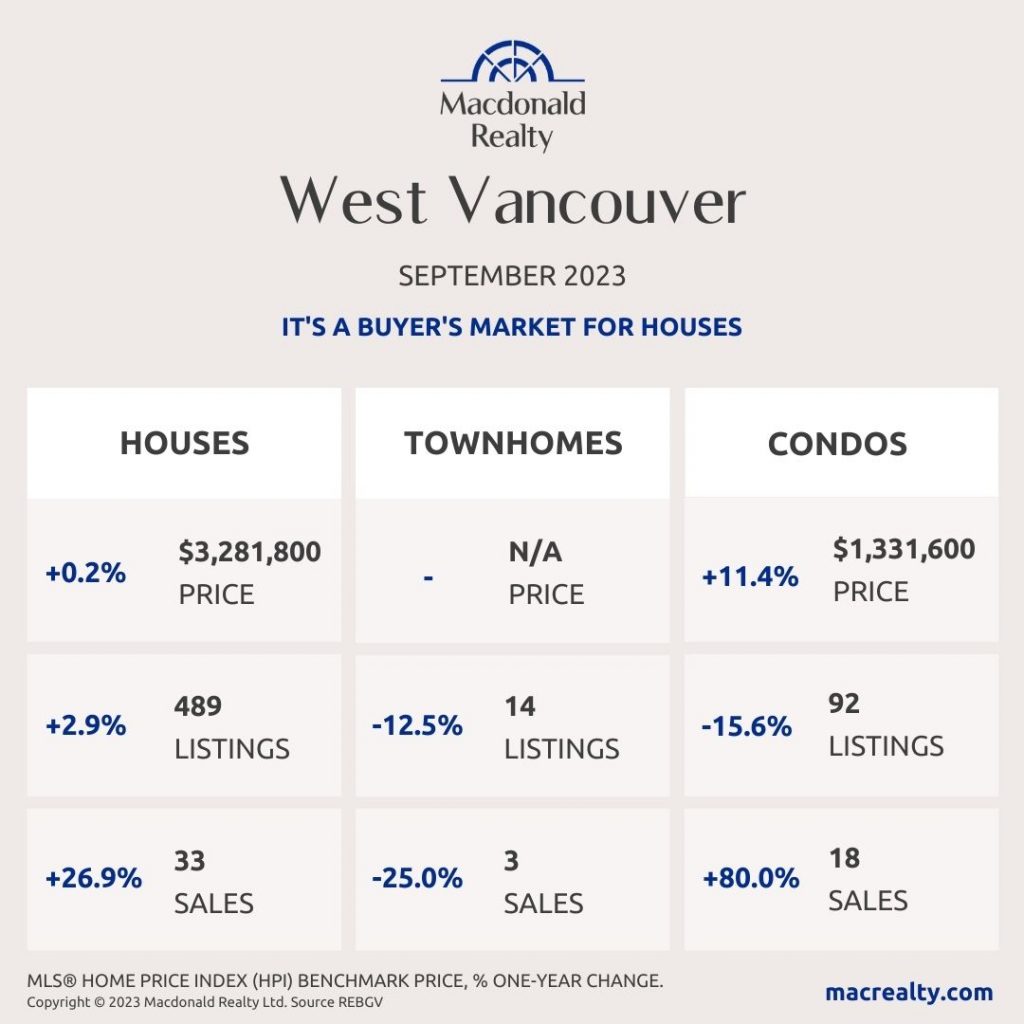
West Vancouver
Looking for more information about the real estate market in specific neighbourhoods in the Greater Vancouver?
Macdonald Realty has offices across the Greater Vancouver. Please email [email protected] or call 1-877-278-3888 to be matched with a REALTOR® working in your area.
MLS® Home Price Index (HPI) Benchmark Price
Average and median home prices are often misinterpreted, are affected by change in the mix of homes sold, and can swing dramatically from month to month (based on the types and prices of properties that sold in a given month). The MLS® HPI overcomes these shortcomings and uses the concept of a benchmark home, a notional home with common attributes of typical homes in a defined area. Visit www.housepriceindex.ca for more information.
This blog post is based on market data provided by the Real Estate Board of Greater Vancouver (REBGV) www.rebgv.org
by Macrealty Marketing Team | Oct 5, 2023 | Market Updates
Here are the latest real estate market statistics from Macdonald Realty on Squamish, Whistler, and Sunshine Coast listings and sales in September 2023.
Find all the infographics related to the September Market Statistics by visiting the Facebook Album.
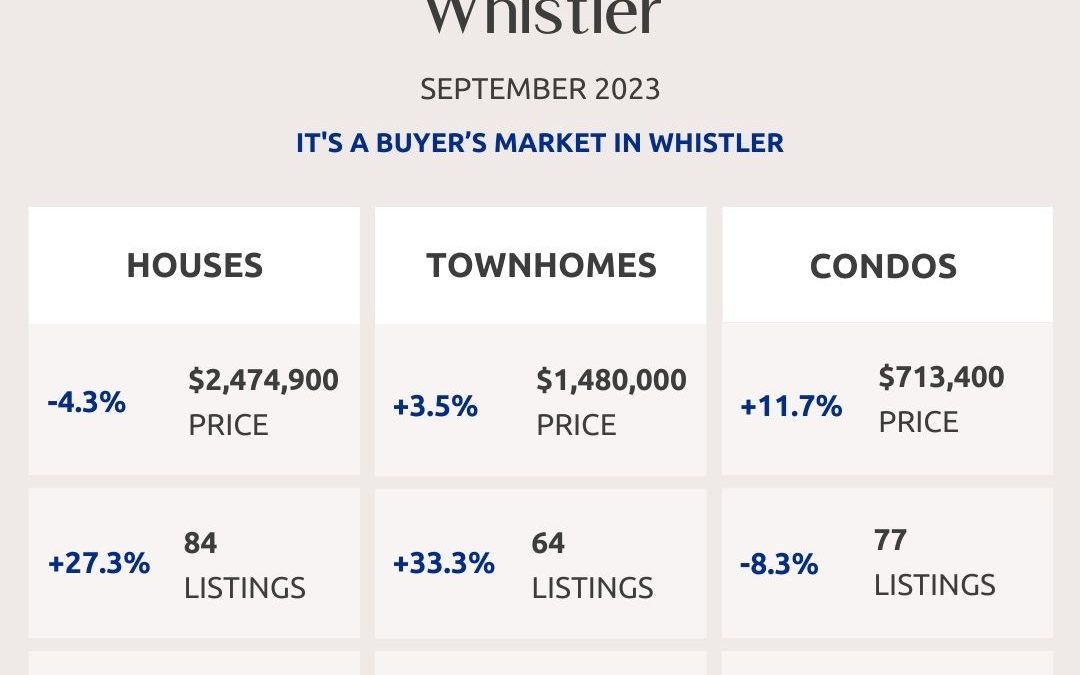
Whistler
In September 2023, there were 4 sales of detached homes and 84 active listings. The benchmark sale price was $2,474,900.
The condo market had 12 sales and 77 active listings at the end of the month. The benchmark sale price was $713,400.
The townhome market had 9 sales and the active listings were 64. The benchmark sale price was $1,480,000.
It’s a buyer’s market in Whistler.

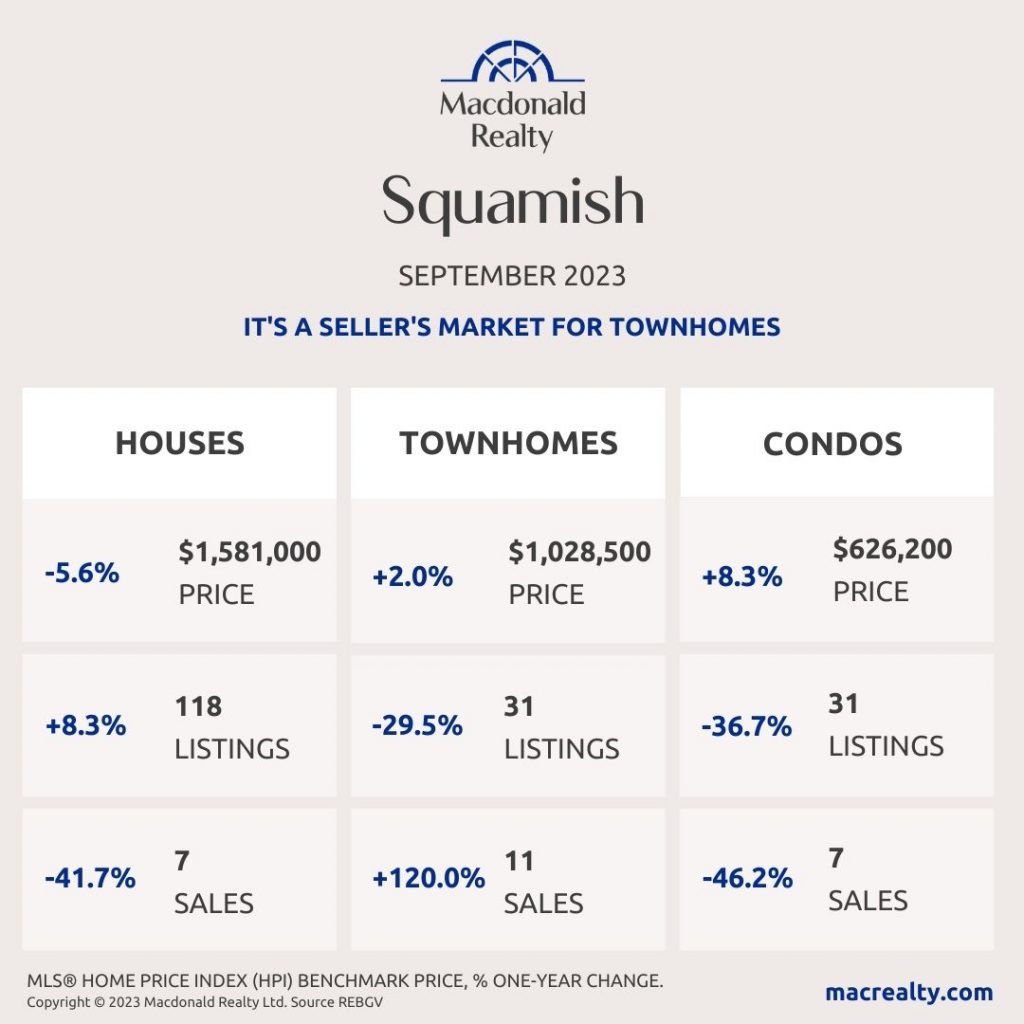
Squamish
In September 2023, there were 7 sales of detached homes and 118 active listings. The benchmark sale price was $1,581,000.
The condo market had 7 sales and 31 active listings at the end of the month. The benchmark sale price was $626,200.
The townhome market had 11 sales and the active listings were 31. The benchmark sale price was $1,028,500.
It’s a seller’s market for townhomes in Squamish.
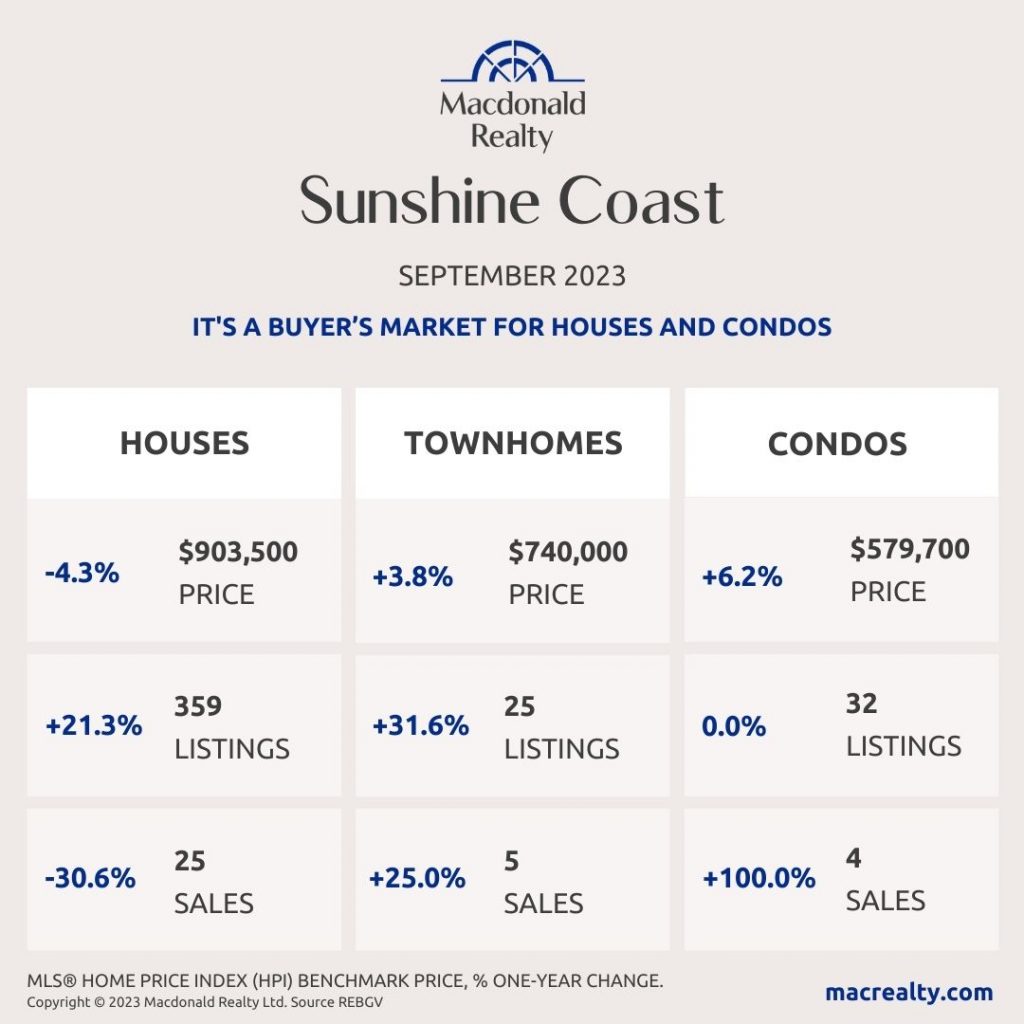
Sunshine Coast
In September 2023, there were 25 sales of detached homes and 359 active listings. The benchmark sale price was $903,500.
The condo market had 4 sales and 32 active listings at the end of the month. The townhome market had 5 sales and the active listings were 25.
It’s a buyer’s market for houses and condos in Sunshine Coast.
Looking for more information about the real estate market in specific neighbourhoods in Squamish, Whistler, and Sunshine Coast? Macdonald Realty has offices in Squamish, Whistler, and Sunshine Coast. Please email [email protected] or call 1-877-278-3888 to be matched with a REALTOR® working in your area.
MLS® Home Price Index (HPI) Benchmark Price
Average and median home prices are often misinterpreted, are affected by change in the mix of homes sold, and can swing dramatically from month to month (based on the types and prices of properties that sold in a given month). The MLS® HPI overcomes these shortcomings and uses the concept of a benchmark home, a notional home with common attributes of typical homes in a defined area. Visit www.housepriceindex.ca for more information.
This blog post is based on market data provided by the Real Estate Board of Greater Vancouver (REBGV) www.rebgv.org
by Macrealty Marketing Team | Oct 5, 2023 | Market Updates
Continued slowing sales and a healthy rise in new listings in September has brought the Fraser Valley housing market into balance. Three months of declining sales has seen Benchmark prices dip for a second straight month.
The Fraser Valley Real Estate Board recorded 1,100 sales on its Multiple Listing Service® (MLS®) in September 2023, a decrease of 13.6 per cent compared to August. Sales were up 22.6 per cent compared to September 2022.
New listings rose to 2,860 in September, an increase of 9.1 per cent over last month, and 25.8 per cent above this time last year. Active listings have been rising since last December and grew again in September by 3.8 per cent to 6,532, 3.5 per cent below the ten-year average.
“With inventory levels continuing on a slow and steady rise, together with slow sales, what we are seeing is a more balanced market,” said Narinder Bains, Chair of the Fraser Valley Real Estate Board. “If this trend continues, increased new listings will help to maintain a balanced market, giving buyers greater choice.”
The market for detached homes softened again in September, with a sales-to-active listings ratio of 14 per cent, down from 16 per cent in August. Demand for townhomes and apartments remained stronger (31 per cent and 25 per cent, respectively). The overall sales-to-active listing ratio is at 17 per cent, representing a balanced market. The market is considered balanced when the sales-to-active-listings ratio is between 12 per cent and 20 per cent.
Benchmark prices in the Fraser Valley dipped compared to last month with losses of less than one per cent across all property types.
“With interest rate uncertainty still in play, September sales were slower than the trends for this time of year,” said FVREB CEO, Baldev Gill. “Market activity and prices can vary from neighbourhood to neighbourhood, so consulting your REALTOR® will be a vital step for buyers and sellers who need expert guidance and advice to navigate local market conditions.”
Find all the infographics related to the September Market Statistics by visiting the Facebook Album.
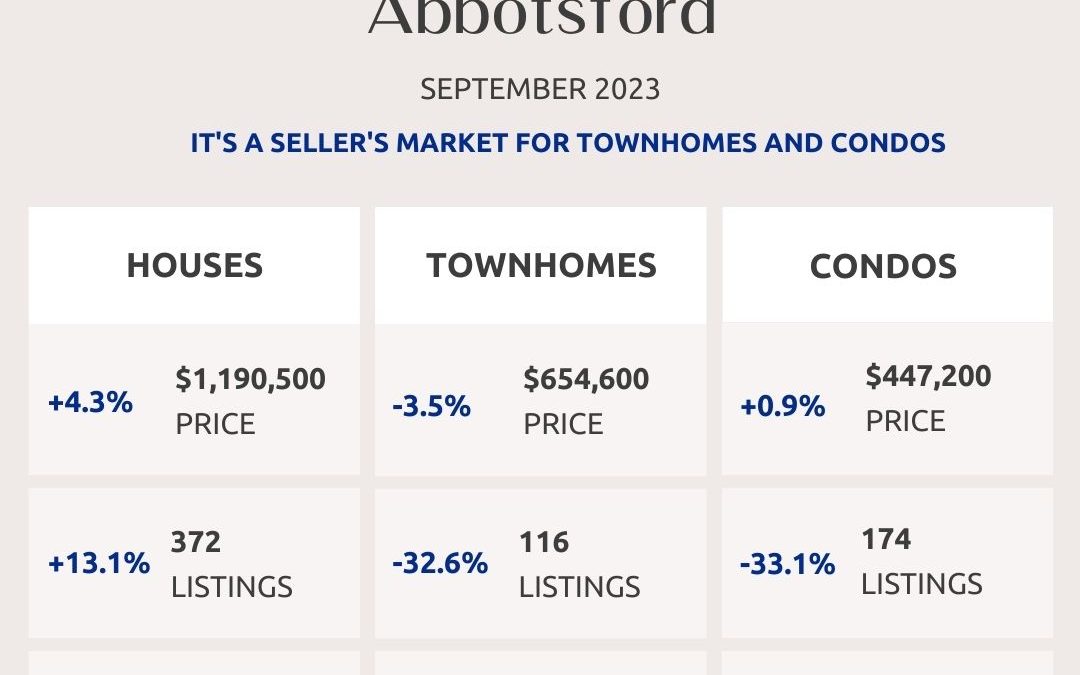
Abbotsford

Cloverdale

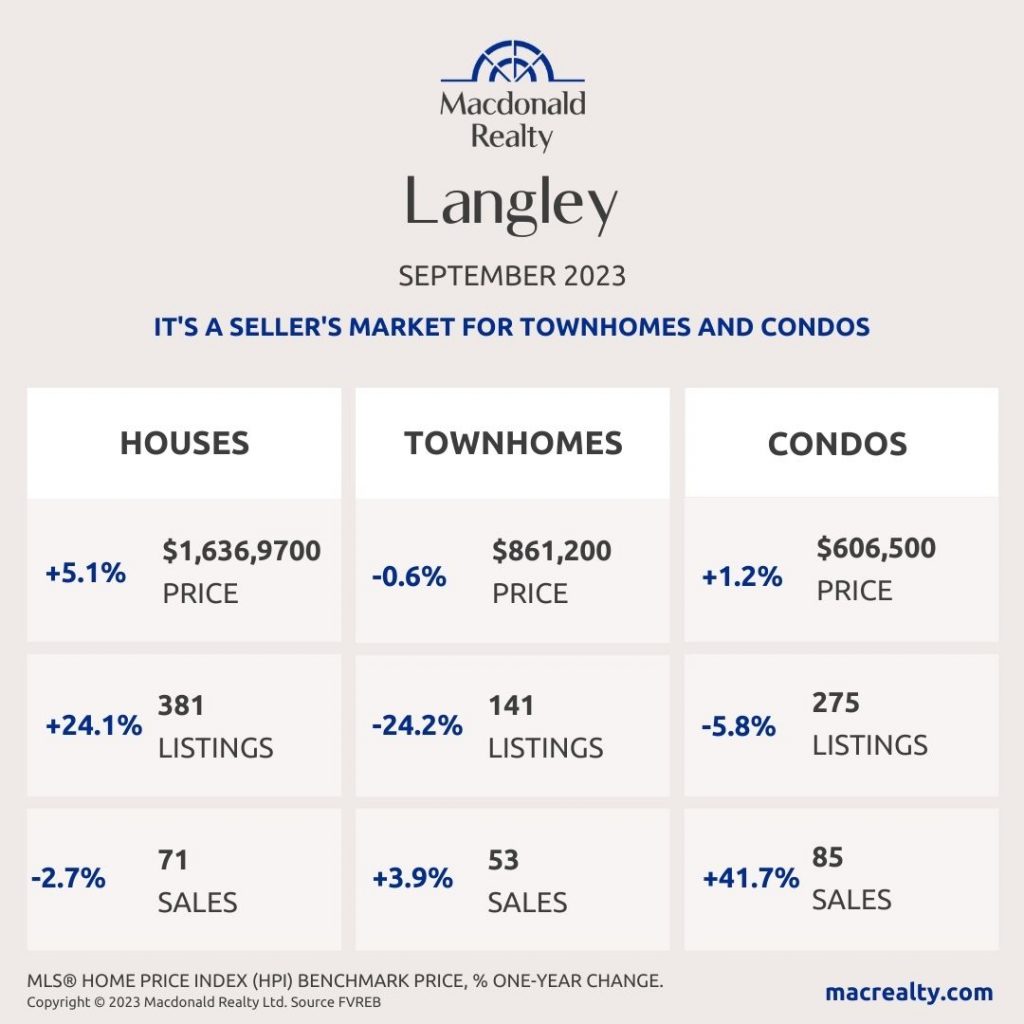
Langley
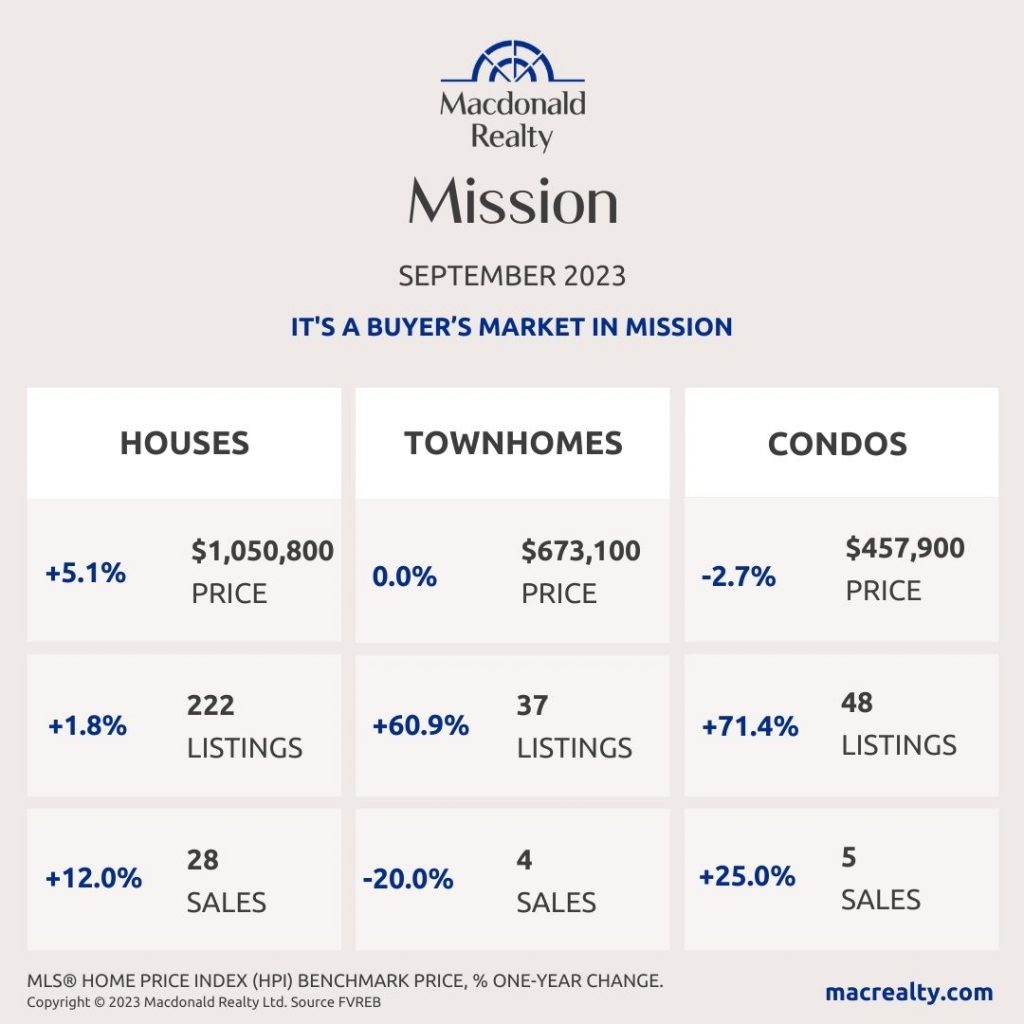
Mission
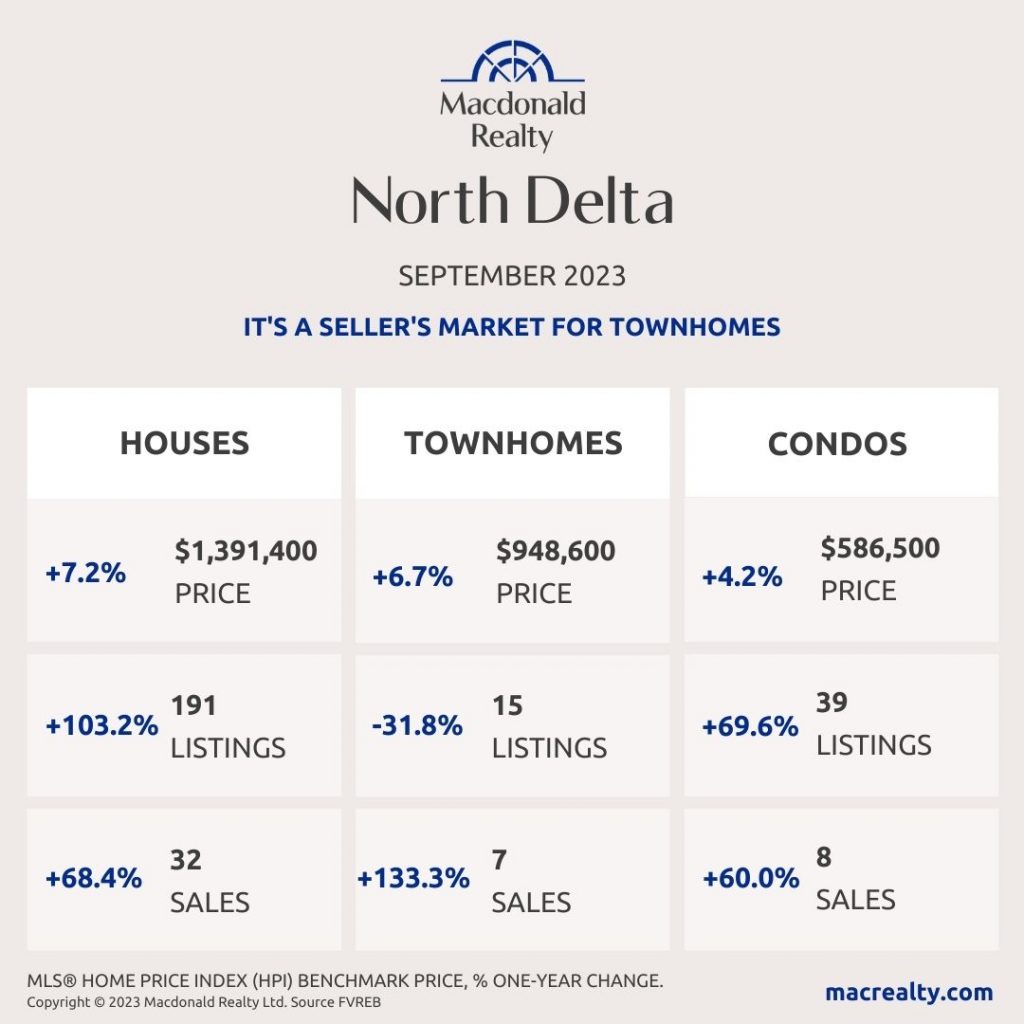
North Delta
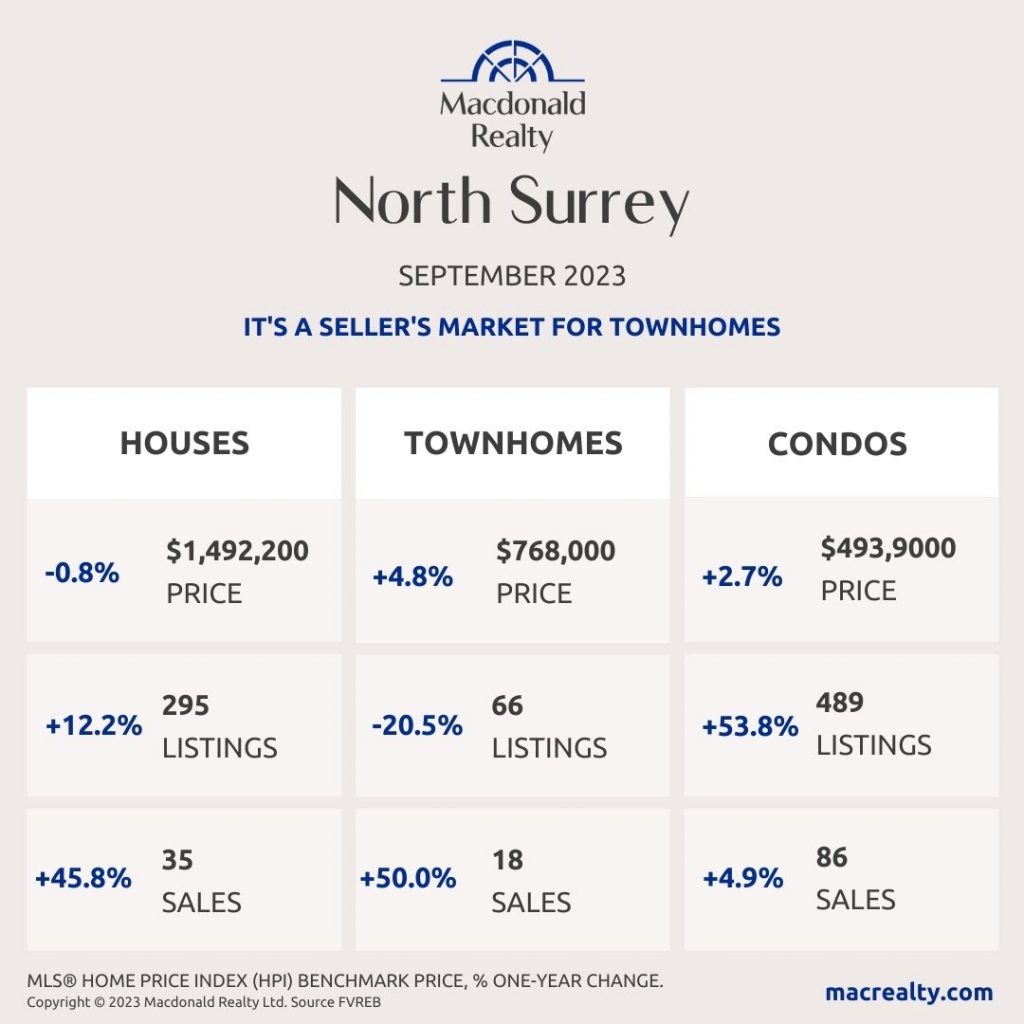
North Surrey
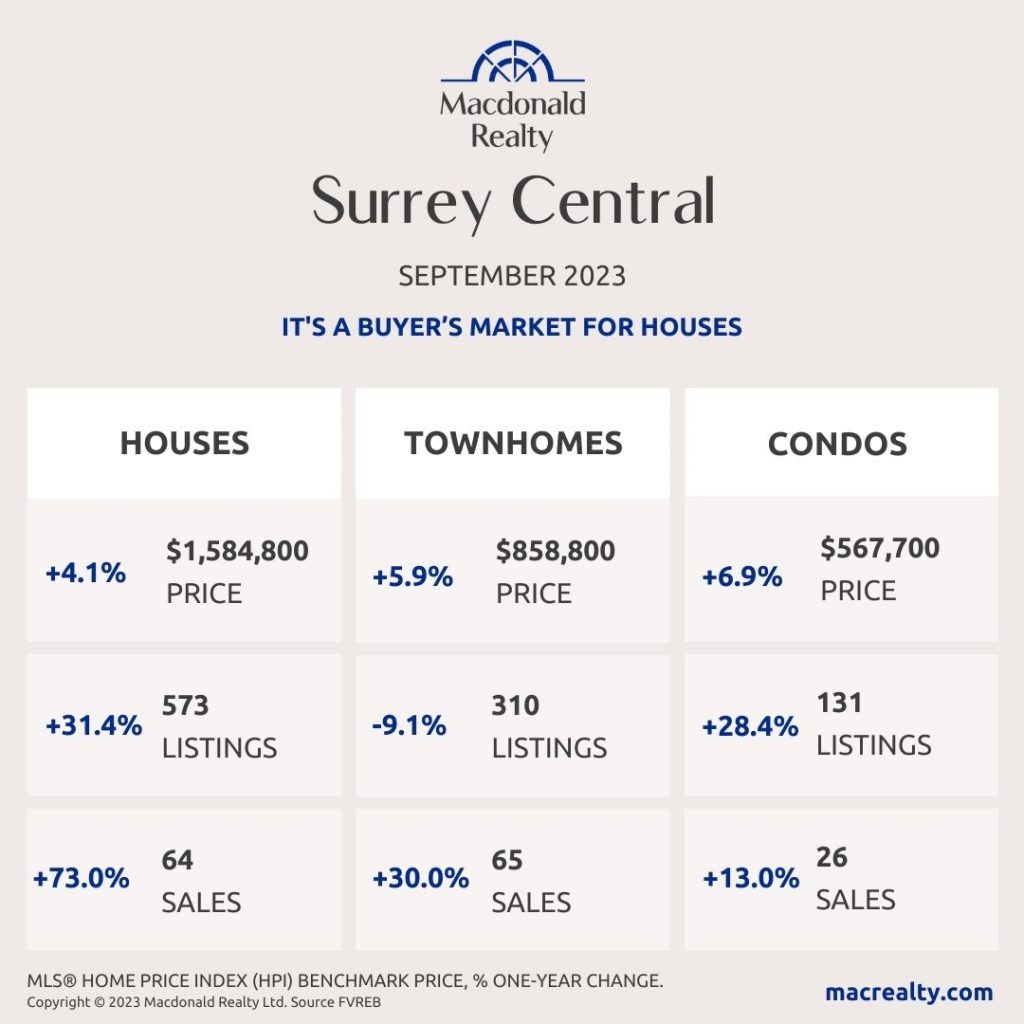
Surrey Central
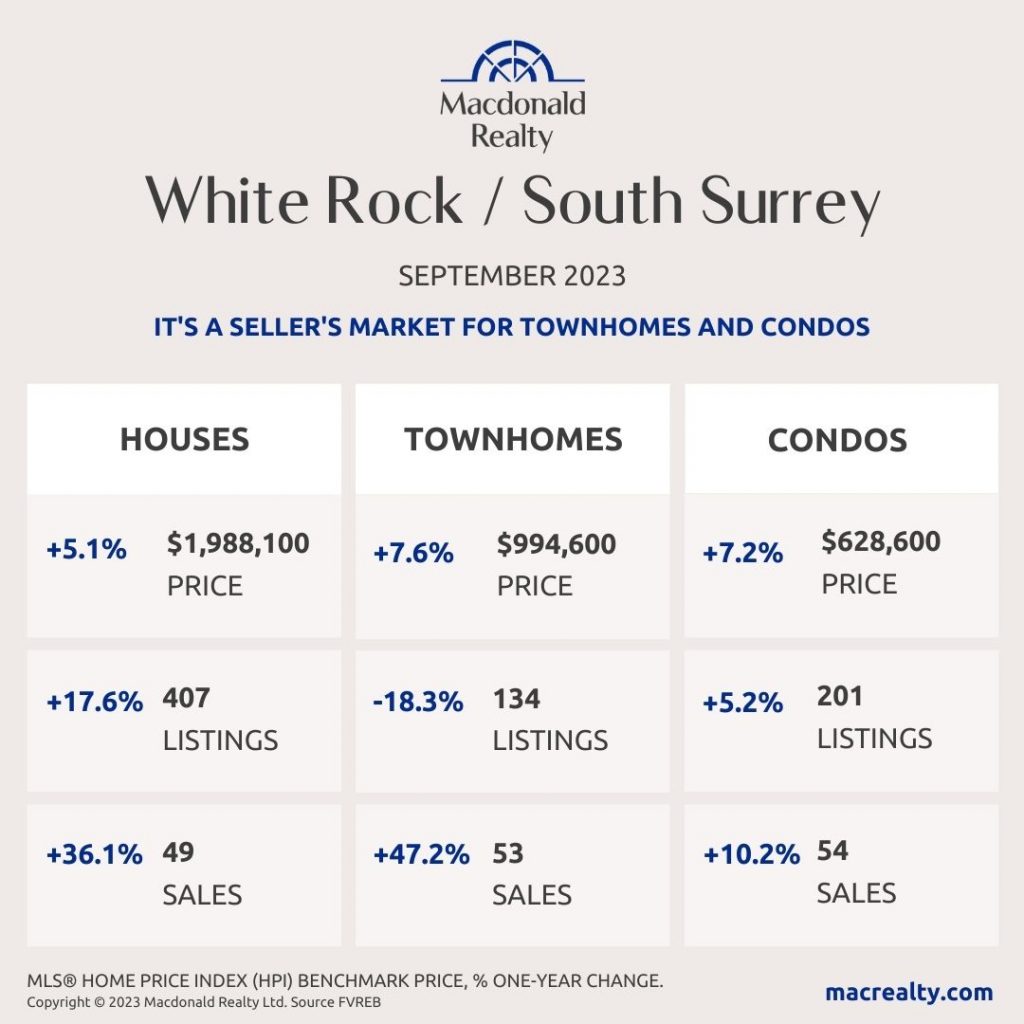
White Rock / South Surrey
Looking for more information about the real estate market in specific neighbourhoods in Surrey, Langley and Fraser Valley?
Macdonald Realty has offices in North Delta, White Rock/South Surrey, and Langley. Please email [email protected] or call 1-877-278-3888 to be matched with a REALTOR® working in your area.
MLS® Home Price Index (HPI) Benchmark Price
Average and median home prices are often misinterpreted, are affected by change in the mix of homes sold, and can swing dramatically from month to month (based on the types and prices of properties that sold in a given month). The MLS® HPI overcomes these shortcomings and uses the concept of a benchmark home, a notional home with common attributes of typical homes in a defined area. Visit www.housepriceindex.ca for more information.
This blog post is based on market data provided by the Fraser Valley Real Estate Board (FVREB) www.fvreb.bc.ca
by Macrealty Marketing Team | Sep 6, 2023 | Market Updates
Here are the latest real estate market statistics from Macdonald Realty on Okanagan listings and sales in August 2023.
Find the infographics by visiting the Facebook Album.
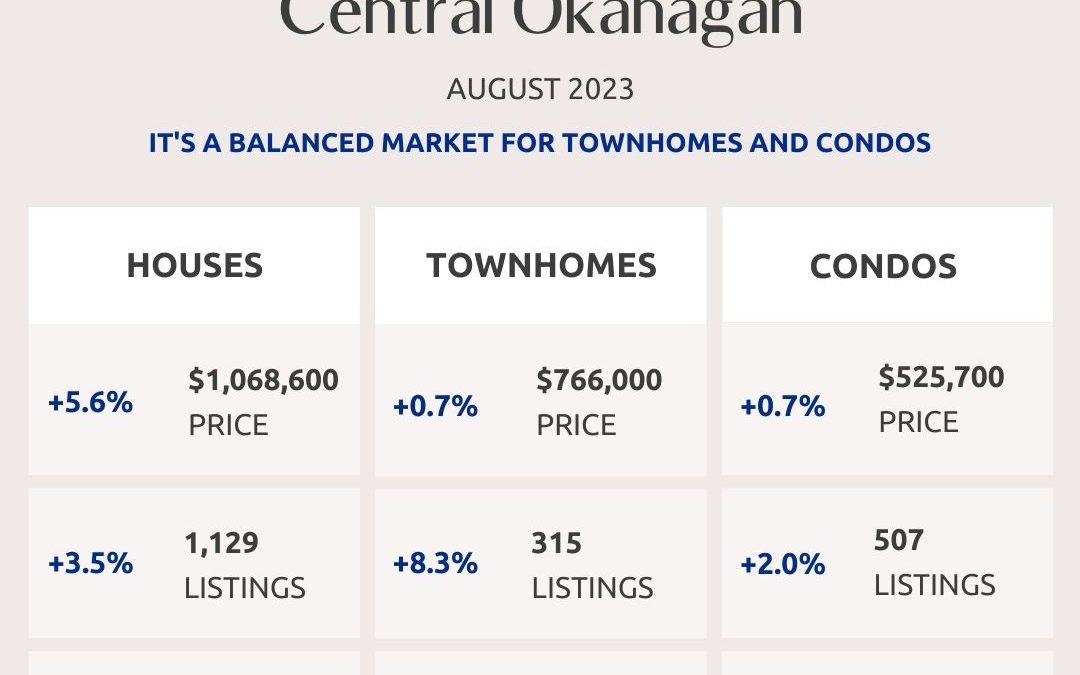
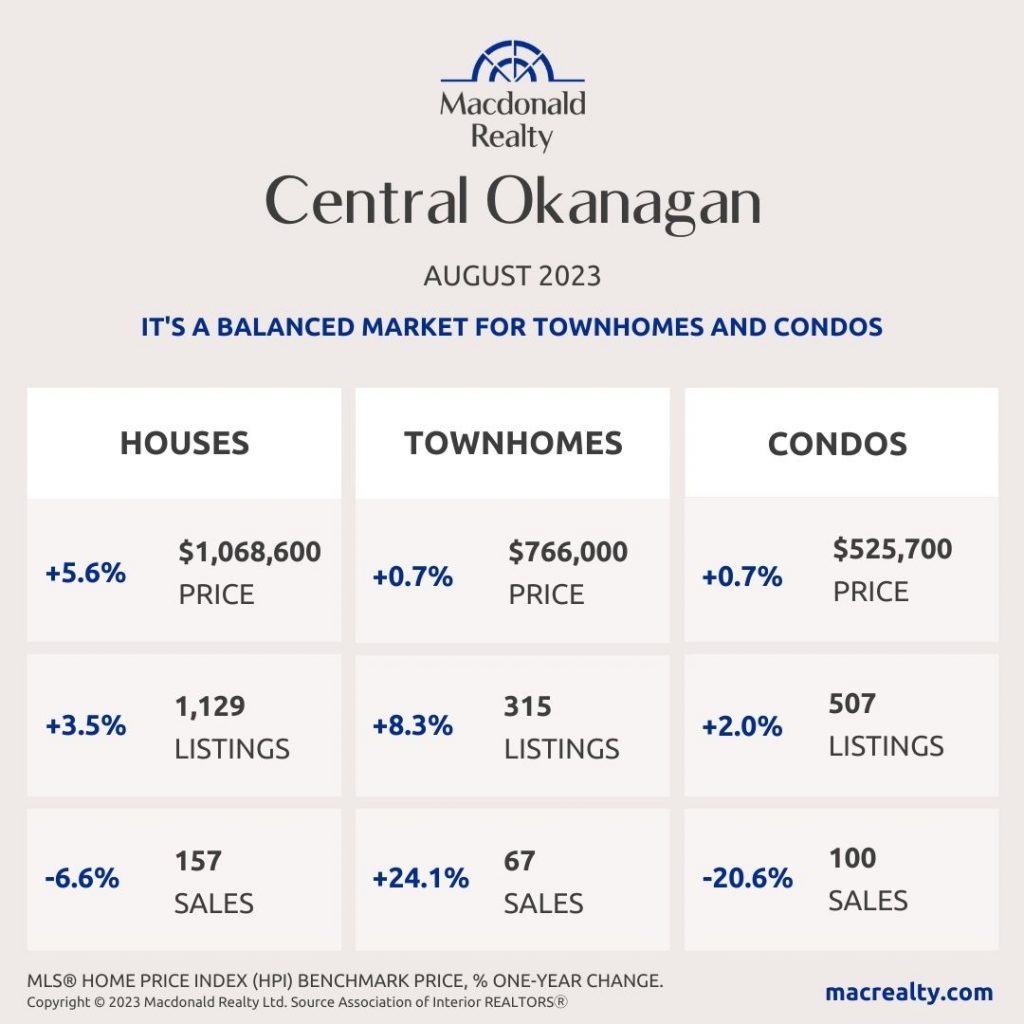
Central Okanagan: Kelowna and Lake Country
There were 157 sales, 1,129 active listings, and $1,068,600 average sale price for detached homes in the Central Okanagan market, including Kelowna and Lake Country. The condo market featured 100 sales and 507 active listings at the end of the month. The average sale price was $525,700. Townhome sales were 67, active listings were 315 and the average sale price was $766,000. It’s a balanced market for townhomes and condos in Central Okanagan.
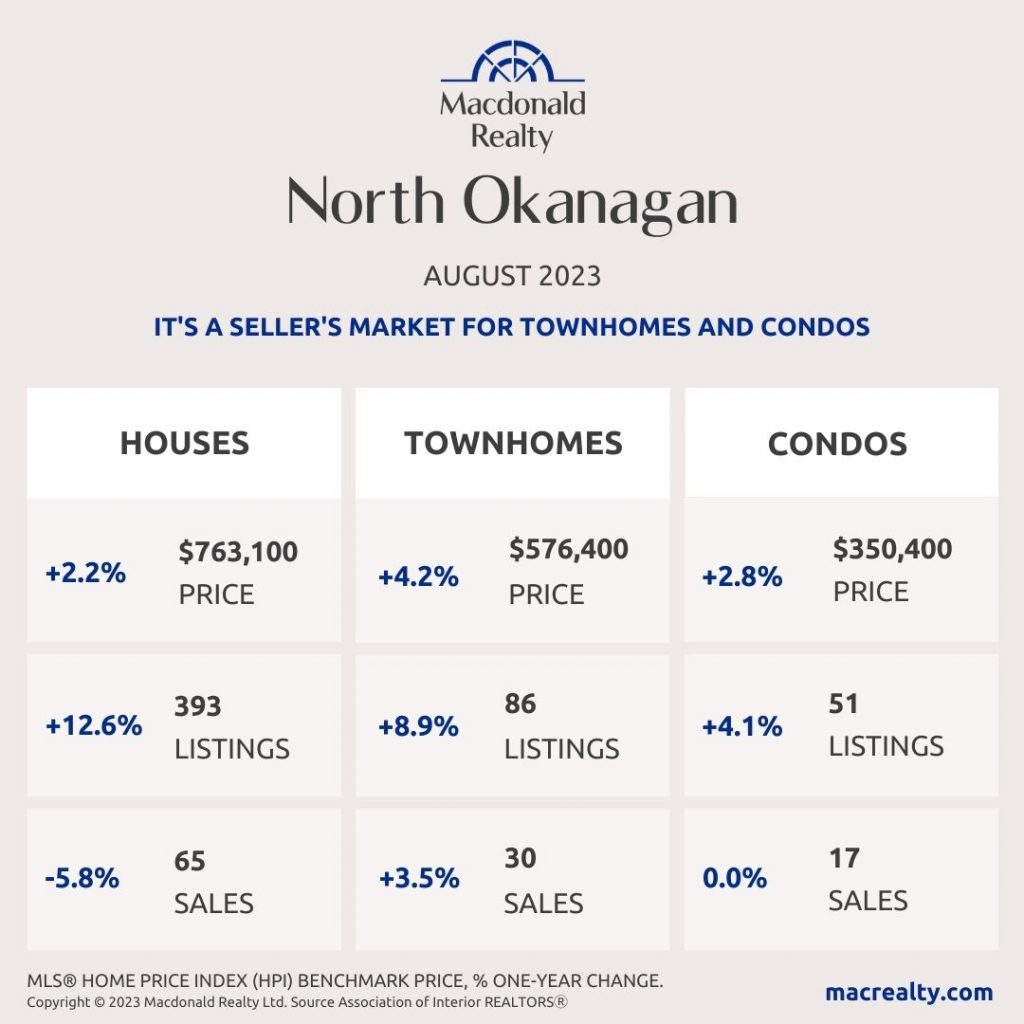
North Okanagan: Vernon and surrounding area
In North Okanagan, including Vernon and the surrounding area and the average detached home sale price was $763,100. At the end of the month, there were 65 sales and 393 active listings. There were 17 sales and 51 active listings for condos. The average sale price was $350,400. In comparison, townhomes featured 30 sales, 86 active listings and a $576,400 average sale price. It’s a seller’s market for townhomes and condos in North Okanagan.
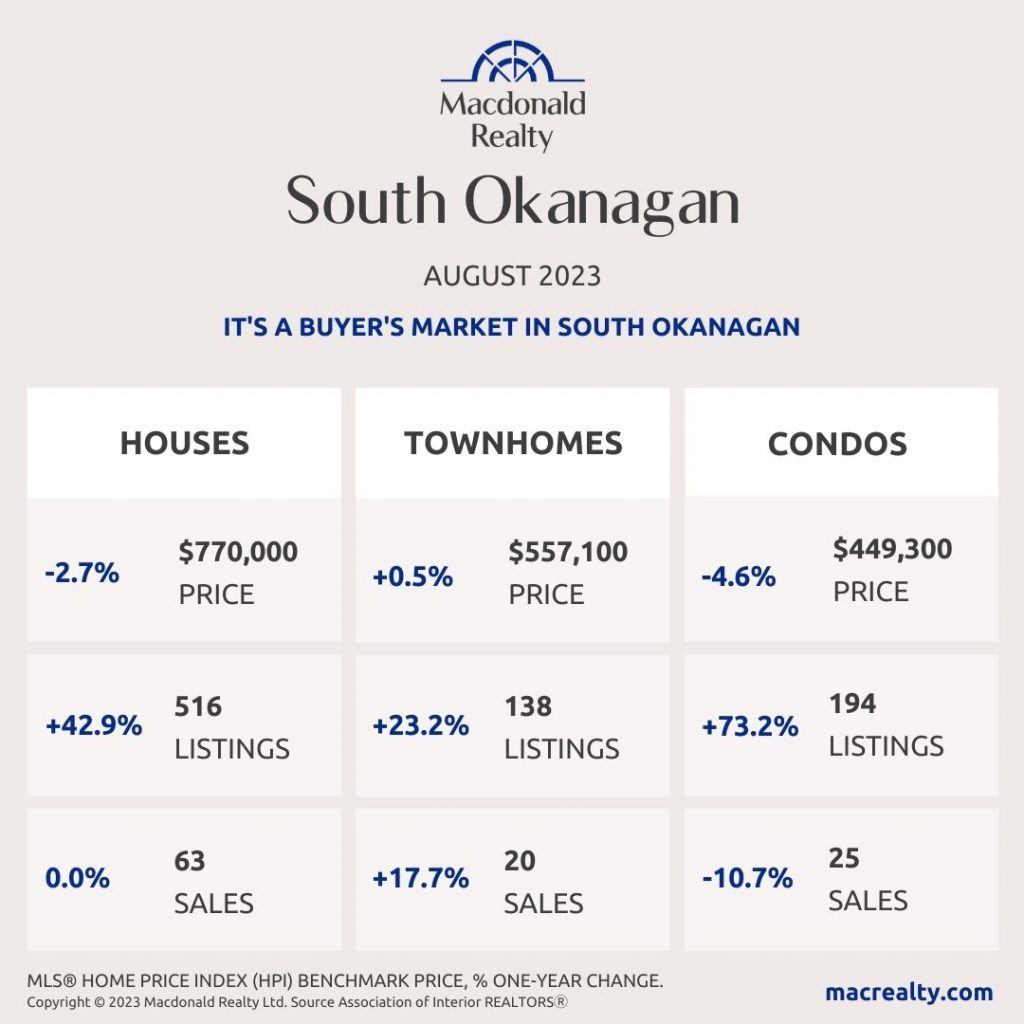
South Okanagan
There were 63 sales, 516 active listings, and $770,000 average sale price for detached homes in the South Okanagan market.
The condo market featured 25 sales and 194 active listings at the end of the month. The average sale price was $449,300. Townhome sales were 20, active listings were 138 and the average sale price was $557,100. It’s a buyer’s market in South Okanagan.
Looking for more information about the real estate market in specific neighbourhoods in Okanagan?
Macdonald Realty has offices in Kelowna and across BC. Please email [email protected] or call 1-877-278-3888 to be matched with a REALTOR® working in your area.
This blog post is based on market data provided by the Association Of Interior REALTORS® https://www.interiorrealtors.ca/.
by Macrealty Marketing Team | Sep 6, 2023 | Market Updates
Here are the latest real estate market statistics from Macdonald Realty on Greater Victoria, Saanich Peninsula, Parksville/Qualicum, and Nanaimo listings and sales in August 2023. Find all the infographics related to the August Market Statistics by visiting the Facebook Album.
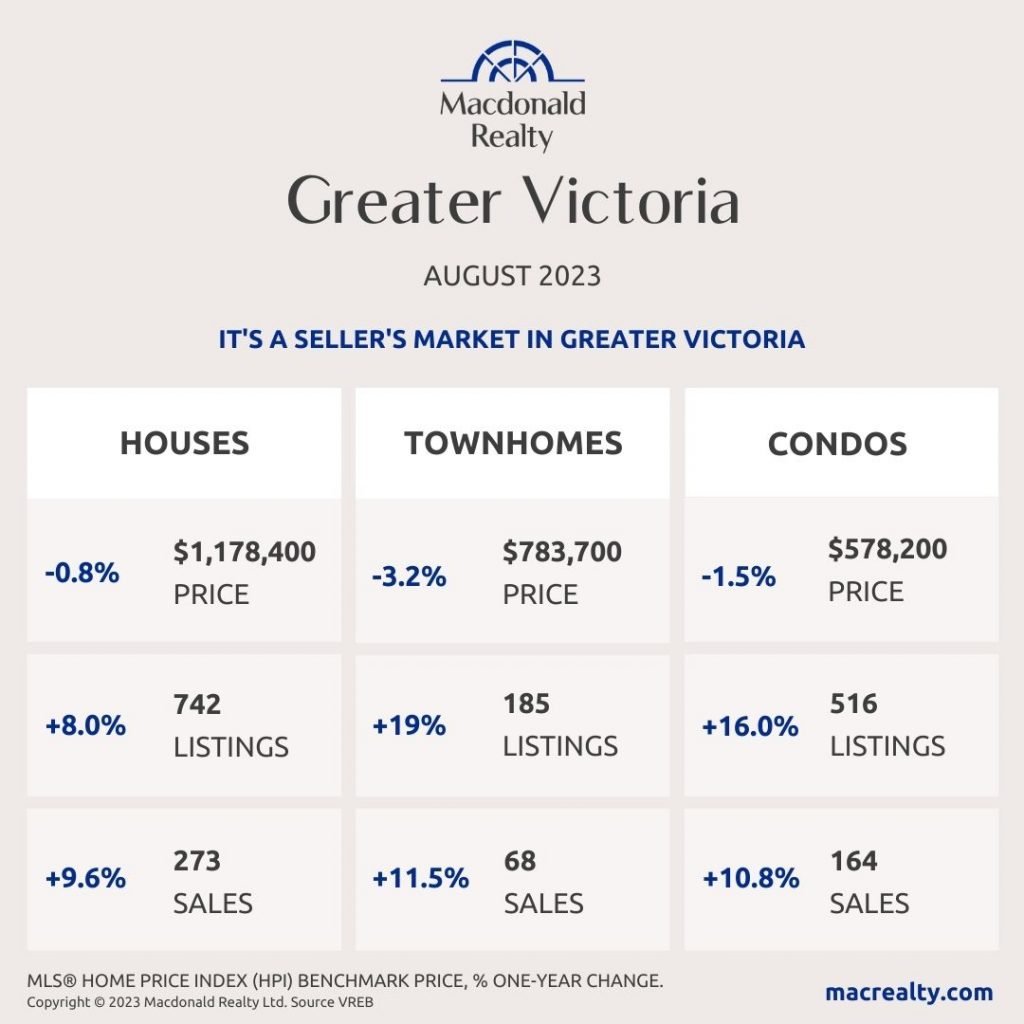
A total of 544 properties sold in the Victoria Real Estate Board region this August, 13.8 per cent more than the 478 properties sold in August 2022 and an 8.6 per cent decrease from July 2023. Sales of condominiums were up 10.8 per cent from August 2022 with 164 units sold. Sales of single family homes increased 9.6 per cent from August 2022 with 273 sold.
“Real estate activity this month reflected what we’d expect to see in an average late summer housing market,” said Victoria Real Estate Board Chair Graden Sol. “The beginning of the month was reasonably slow, and sales ramped up through the last half of the month. The brisk sales pace leading up to the end of August may very well continue into September.”
There were 2,490 active listings for sale on the Victoria Real Estate Board Multiple Listing Service® at the end of August 2023, an increase of 2.9 per cent compared to the previous month of July and a 16.5 per cent increase from the 2,137 active listings for sale at the end of August 2022.
“The focus in our market and by all levels of government needs to be on opening up more supply,” Sol notes. “Our inventory levels, though up from last year, are still too low to support a well-balanced market. A decade ago, we saw over 5,000 active listings in August. Another important piece of supply is the housing mix that is available. Most residential properties for sale in our market last month were single family homes – this type of property is generally at the top price point. Missing middle homes, such as townhomes and condos represented only 37.1% of listings for sale. Townhomes, which in my experience are what a lot of families hope to purchase, represented only 9.8% of the residential properties for sale. This imbalance in the mix of housing options means there is the potential for more price pressure on these types of properties because demand is concentrated at more attainable price points.”
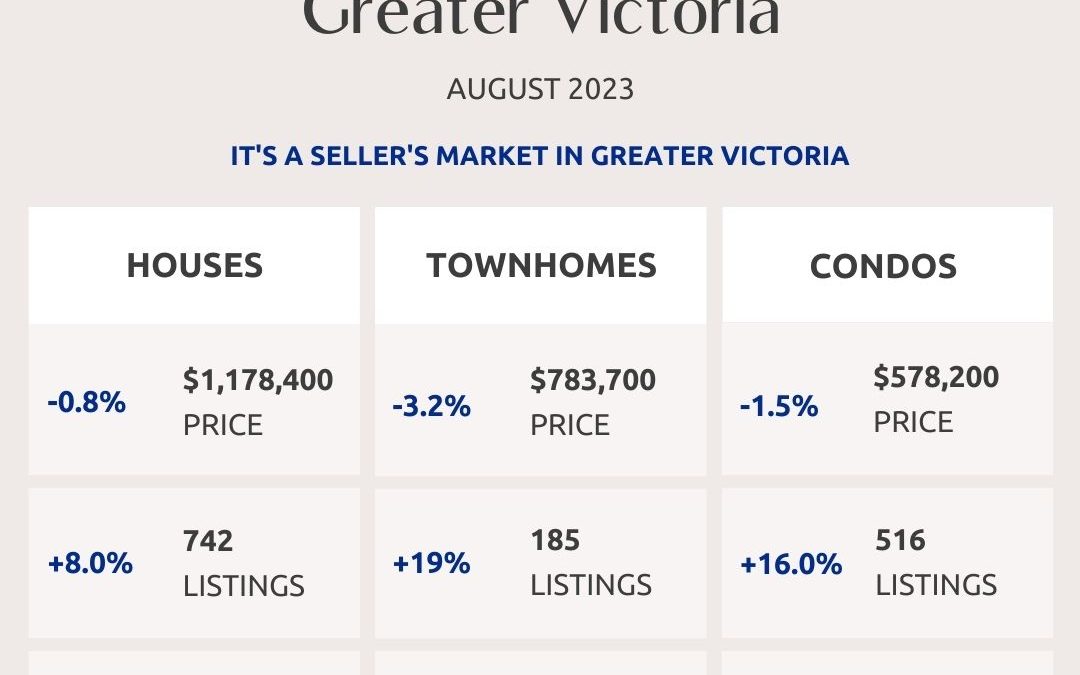
The Multiple Listing Service® Home Price Index benchmark value for a single family home in the Victoria Core in August 2022 was $1,327,700. The benchmark value for the same home in August 2023 decreased by 0.3 per cent to $1,323,900, which is up from July’s value of $1,318,800. The MLS® HPI benchmark value for a condominium in the Victoria Core area in August 2022 was $583,700, while the benchmark value for the same condominium in August 2023 decreased by 0.3 per cent to $582,000, which is up from the July value of $578,000.
Greater Victoria
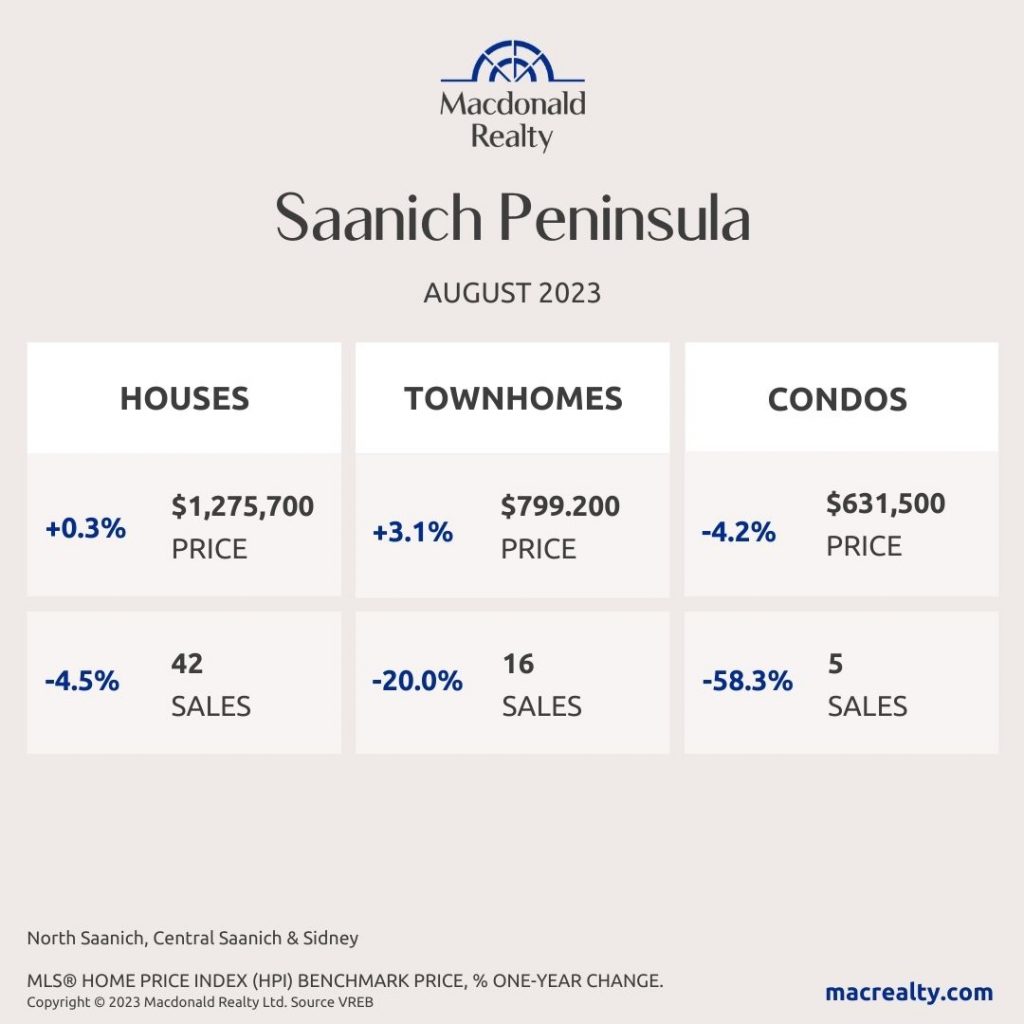
Saanich Peninsula
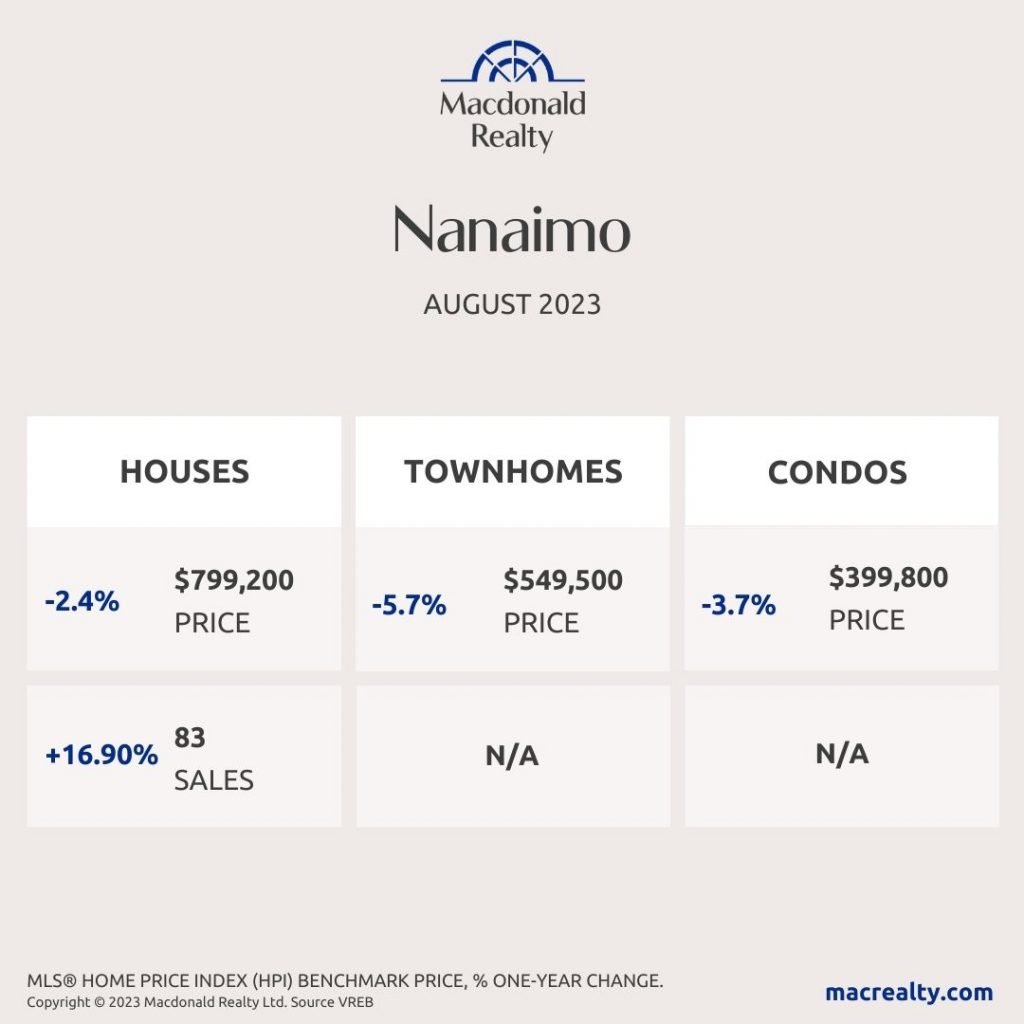
Nanaimo
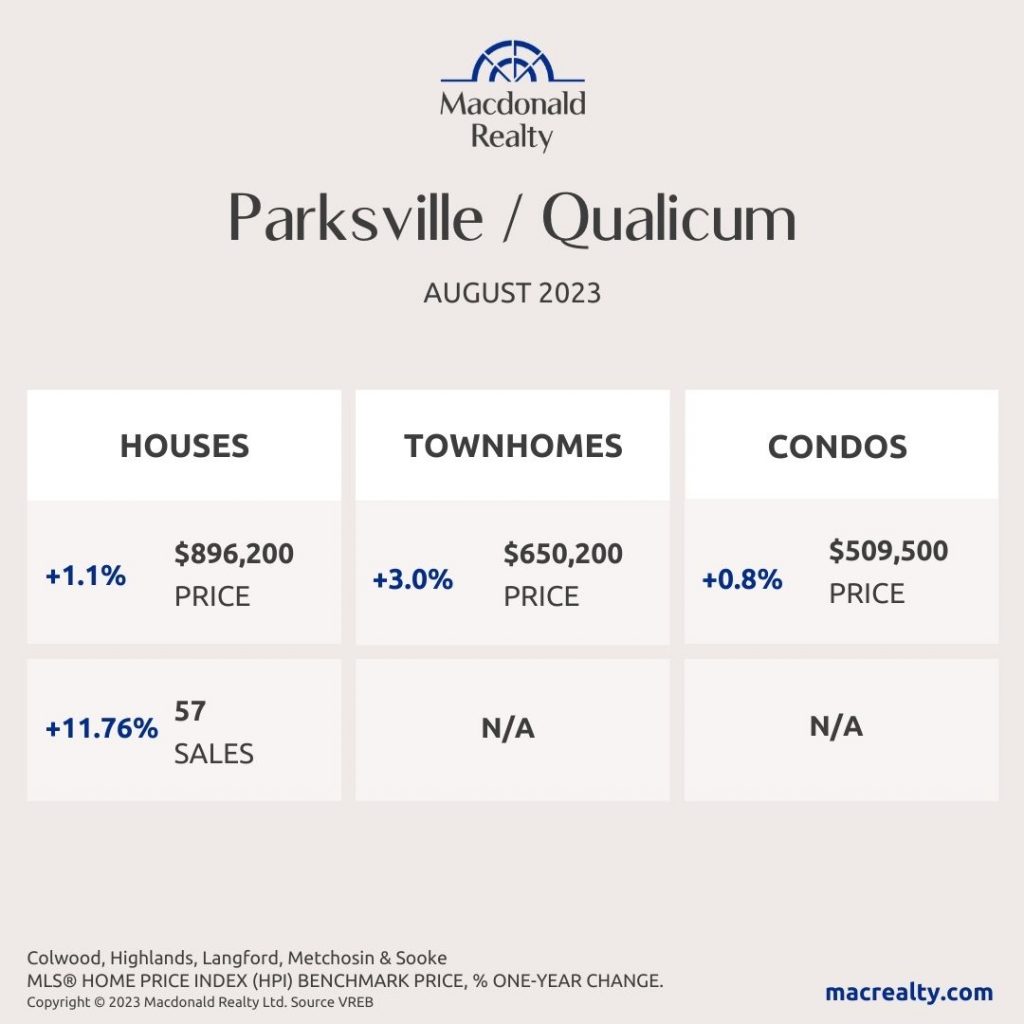
Parksville / Qualicum
Looking for more information about the real estate market in specific neighbourhoods in Victoria, Saanich Peninsula, Parksville, Nanaimo, Vancouver Island and the Gulf Islands?
Macdonald Realty has offices in downtown Victoria, Sidney, Parksville and Salt Spring Island. Please email [email protected] or call 1-877-278-3888 to be matched with a REALTOR® working in your area.
MLS® Home Price Index (HPI) Benchmark Price
Average and median home prices are often misinterpreted, are affected by change in the mix of homes sold, and can swing dramatically from month to month (based on the types and prices of properties that sold in a given month). The MLS® HPI overcomes these shortcomings and uses the concept of a benchmark home, a notional home with common attributes of typical homes in a defined area. Visit www.housepriceindex.ca for more information.
This blog post is based on market data provided by the Victoria Real Estate Board (VREB) www.vreb.org and the Vancouver Island Real Estate Board (VIREB) www.vireb.com. Market data from the VIREB includes listings and sales in Campbell River, Comox Valley, Cowichan Valley Nanaimo, Parksville/Qualicum, Port Alberni/West, North Island, and the Islands.