by Macrealty Marketing Team | Sep 5, 2023 | Market Updates
September 2023 – Lower Mainland Monthly Update
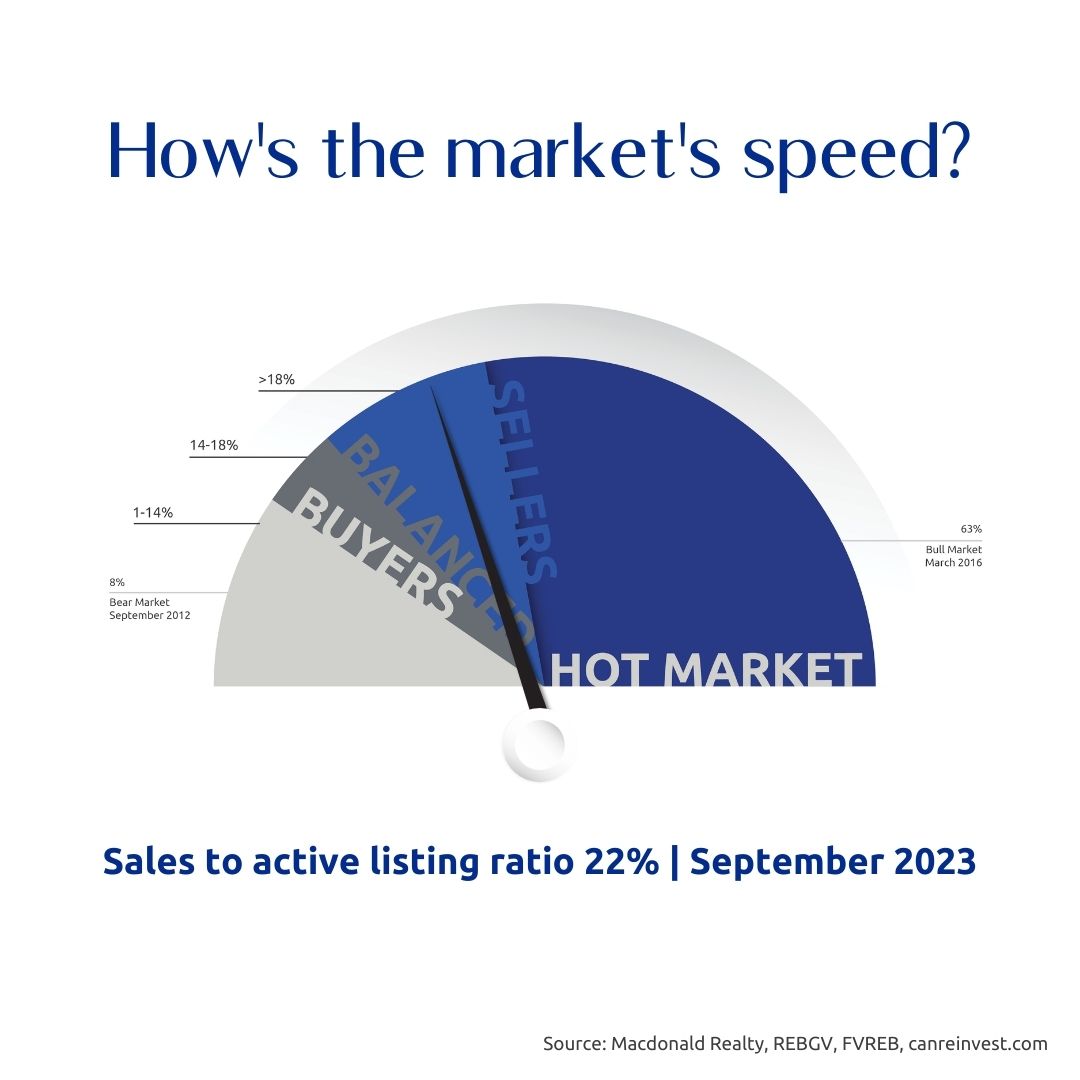
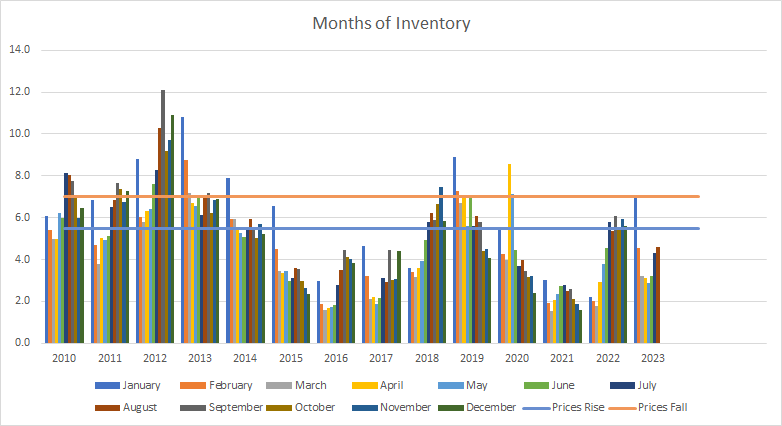
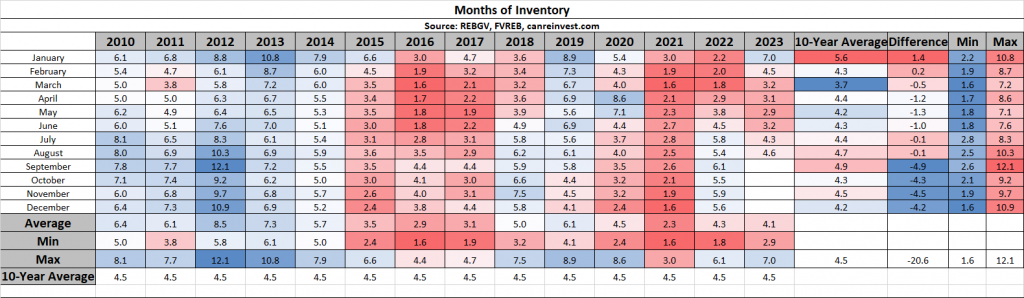
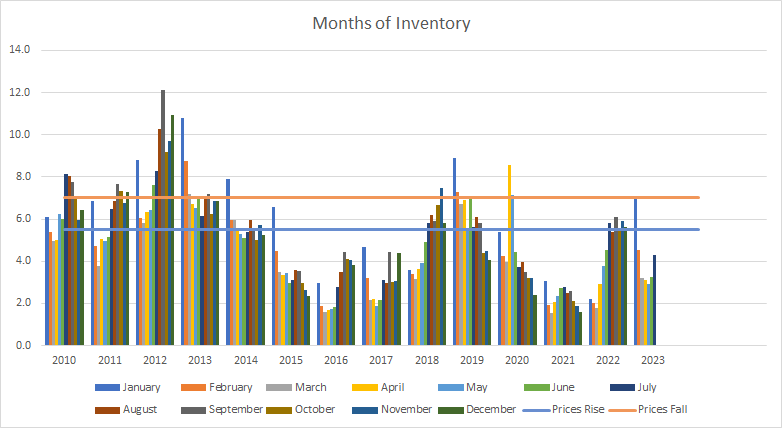
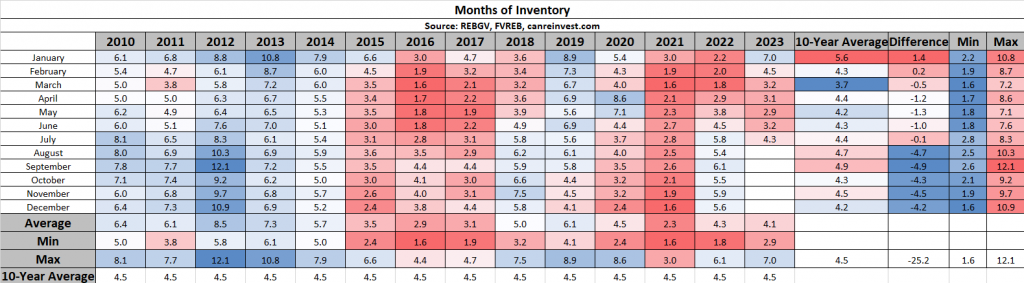
At only 4.6 Months of Inventory, Prices are expected to Rise.
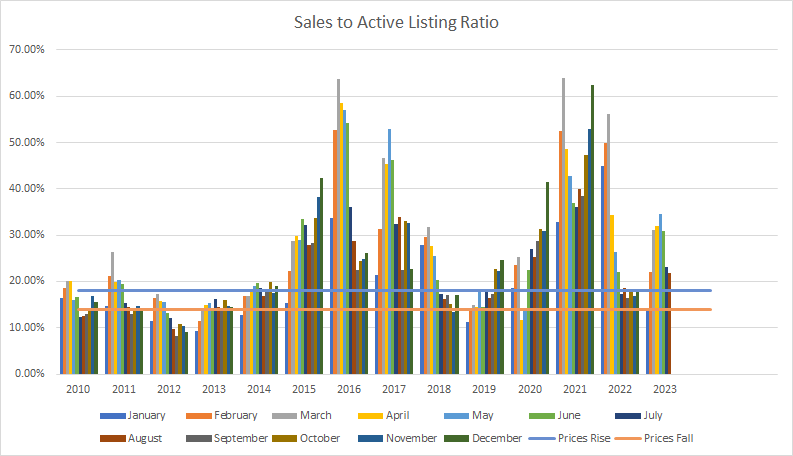
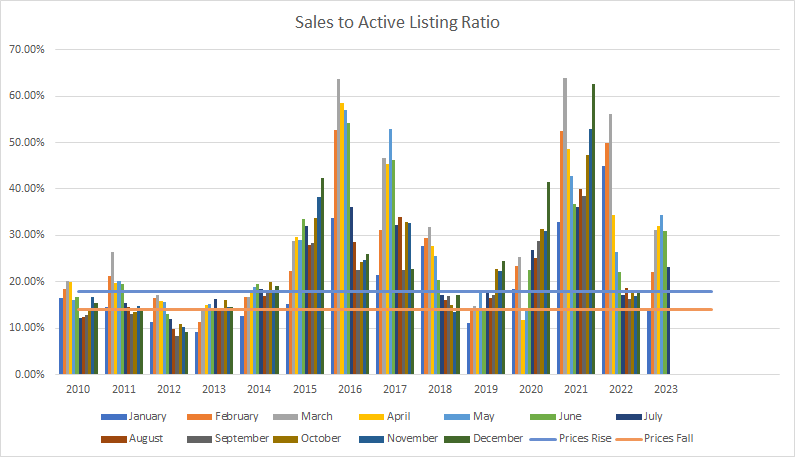
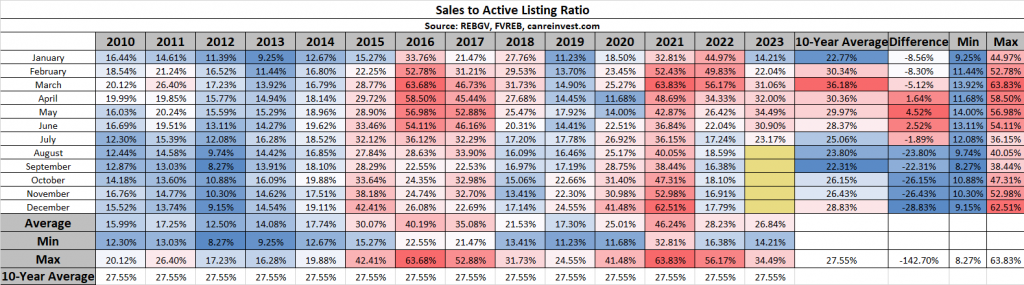
The most reliable indicator of market prices is the Sales to Active Listings Ratio (SAL). This is the ratio between the number of sales in a given month and the number of active listings at month-end.
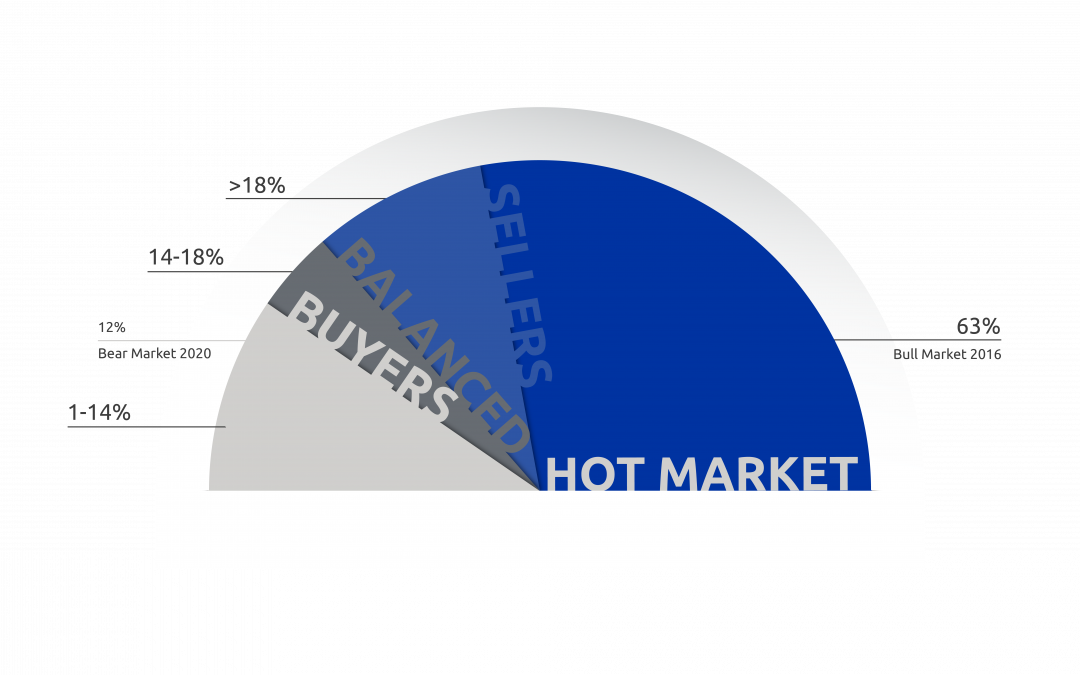
In hotter markets in BC, a long-term analysis has shown that prices will usually act in the following ways:
- 7+ Months of Inventory (Under 14% SAL): Prices will likely DECLINE
- 5 – 7 Months of Inventory (14% – 18% SAL): Prices will likely be STABLE
- Less than 5.5 Months of Inventory (Over 18% SAL): Prices will likely RISE
Visit this link to learn more about house prices and inventory.
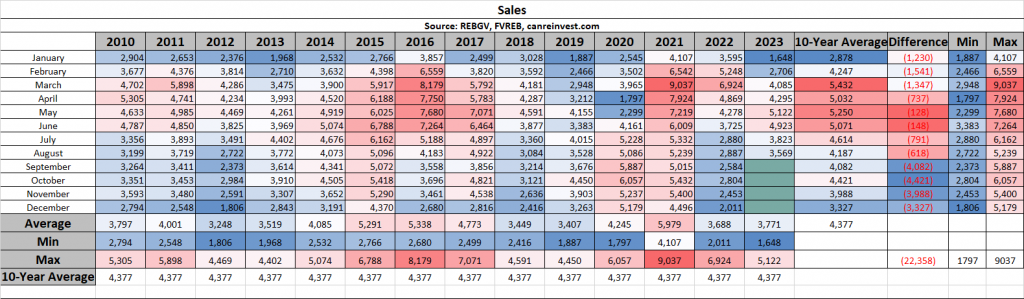
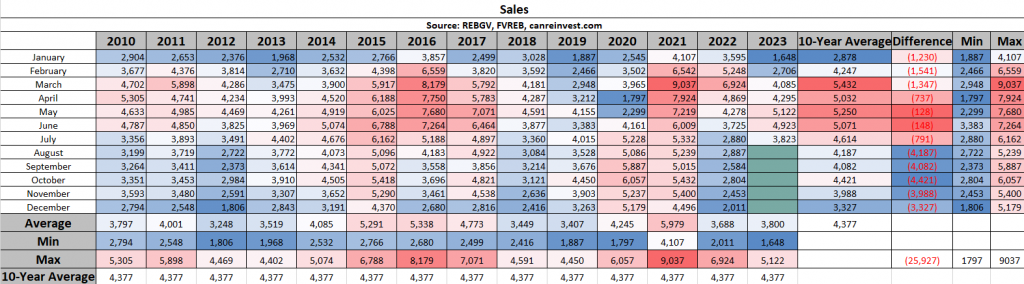
Sales
Sales in August 2023 (3,569) were 25% higher than August 2022 (2,887), and were 15% below the 10-year average (4,187).
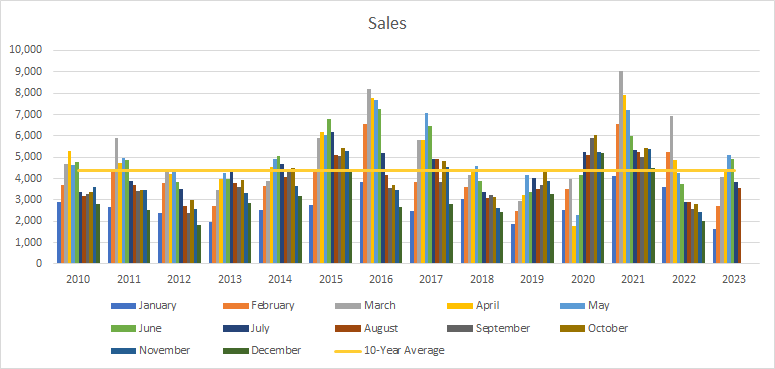
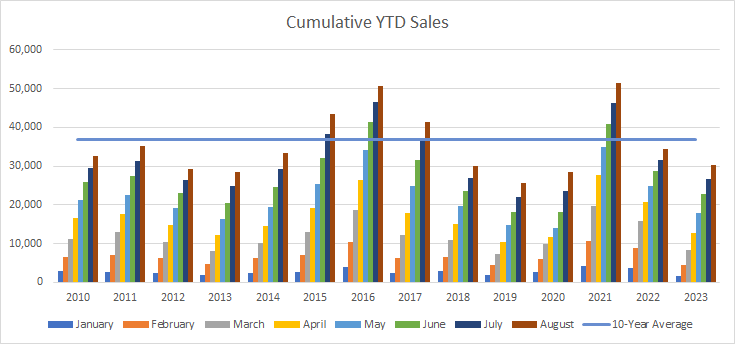
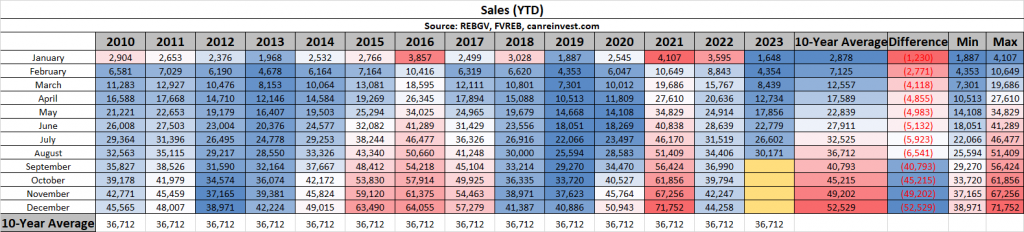
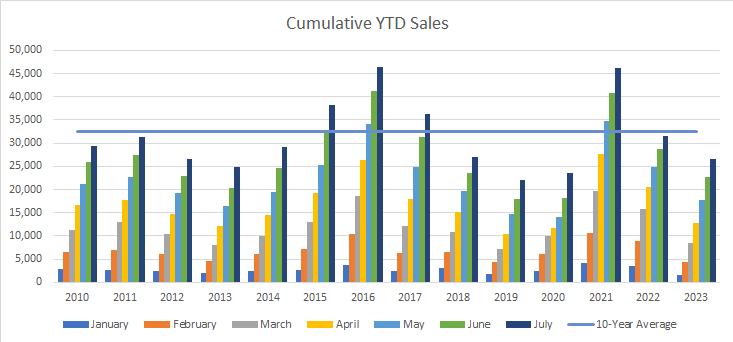
Cumulative Year-to-date Sales
2023 continues to be slower as sales (30,171) remain below the 10-year average (36,712).
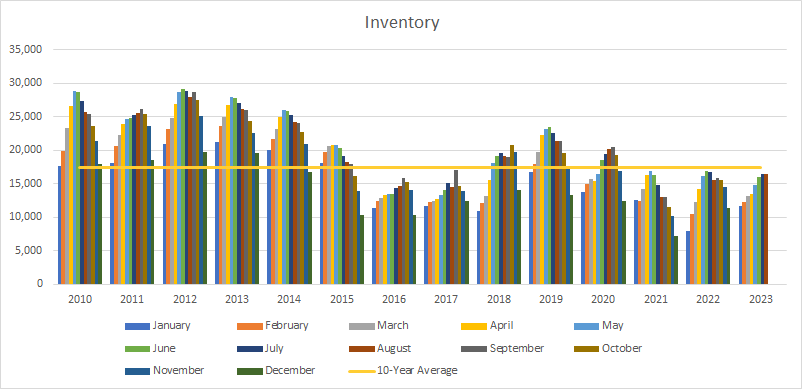
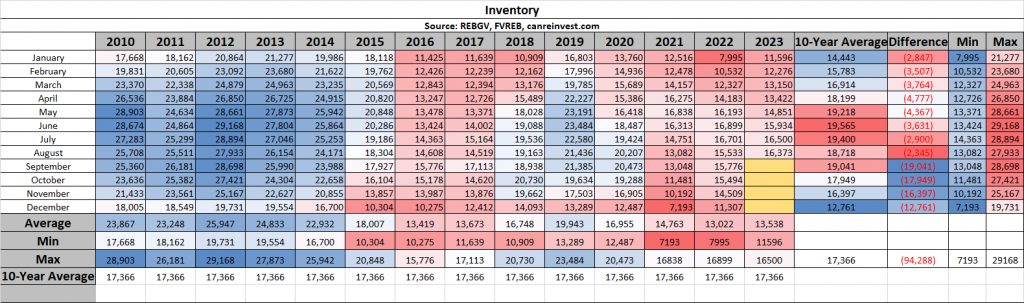
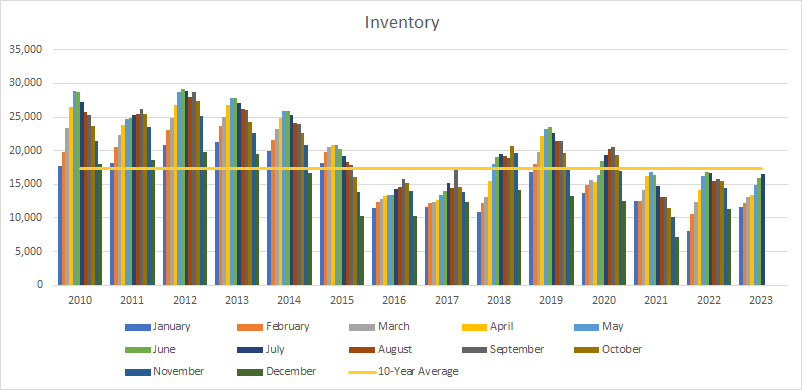
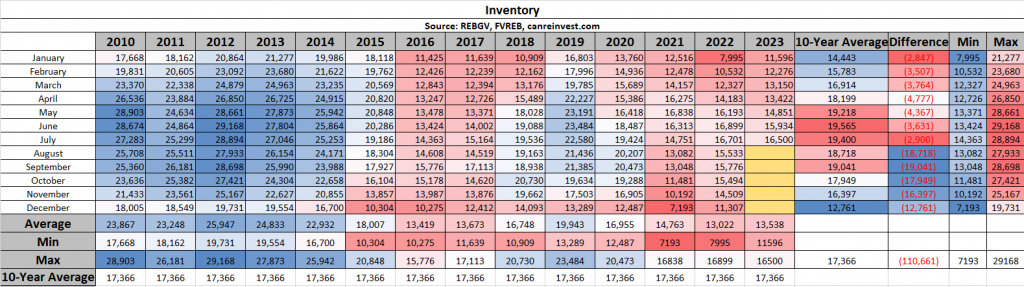
Inventory
August inventory (16,373 active listings) decreased slightly from the previous month, and are nearly 15% below the 10-year average (18,718 average).
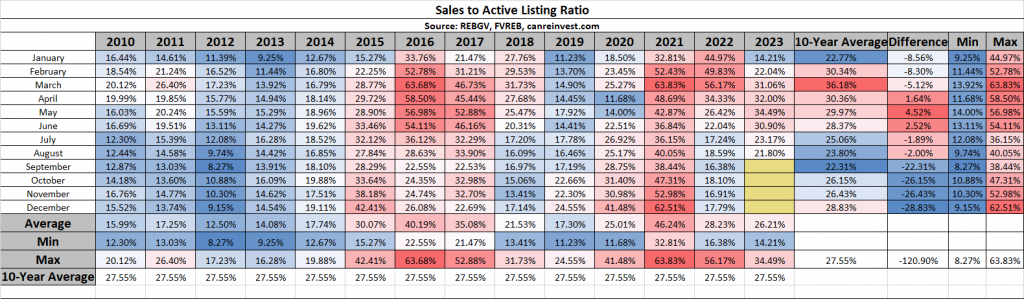
Sales to Active Listings
Low sales but lower inventory kept the Sales to Active Listing Ratio at 22%, indicating rising prices.
Months of Inventory
Similarly, Months of Inventory rose only slightly to 4.6 MOI, indicating a continued seller’s market and continued upward pressure on prices.
Want to learn more about these stats or discuss your move to Macdonald Realty?
Check out careersinbcrealestate.com to connect today!
by Macrealty Marketing Team | Sep 5, 2023 | Market Updates
Here are the latest real estate market statistics from Macdonald Realty on the Greater Vancouver listings and sales in August 2023. Find all the infographics by visiting the Facebook Album.
As summer winds to a close, higher borrowing costs have begun to permeate the Metro Vancouver housing market in predictable ways, with price gains cooling and sales slowing along the typical seasonal pattern.
The Real Estate Board of Greater Vancouver (REBGV) reports that residential home sales in the region totalled 2,296 in August 2023, a 21.4 per cent increase from the 1,892 sales recorded in August 2022. This was 13.8 per cent below the 10-year seasonal average (2,663).
“It’s been an interesting spring and summer market, to say the least” Andrew Lis, REBGV’s director of economics and data analytics said. “Borrowing costs are fluctuating around the highest levels we’ve seen in over ten years, yet Metro Vancouver’s housing market bucked many pundits’ predictions of a major slowdown, instead posting relatively strong sales numbers and year-to-date price gains north of eight per cent, regardless of home type.”
There were 3,943 detached, attached and apartment properties newly listed for sale on the Multiple Listing Service® (MLS®) in Metro Vancouver in August 2023. This represents an 18.1 per cent increase compared to the 3,340 homes listed in August 2022. This was 5.3 per cent below the 10-year seasonal average (4,164).
The total number of homes currently listed for sale on the MLS® system in Metro Vancouver is 10,082, a 0.2 per cent decrease compared to August 2022 (10,099). This was 13.4 per cent below the 10-year seasonal average (11,647).
Across all detached, attached and apartment property types, the sales-to-active listings ratio for August 2023 is 23.9 per cent. By property type, the ratio is 14.2 per cent for detached homes, 30.3 per cent for townhomes, and 31.9 per cent for apartments.
Analysis of the historical data suggests downward pressure on home prices occurs when the ratio dips below 12 per cent for a sustained period, while home prices often experience upward pressure when it surpasses 20 per cent over several months.
“It’s a bit of a tortoise and hare story this year, with sales starting the year slowly while prices increased due to low inventory levels,” Lis said. “As fall approaches, sales have caught up with the price gains, but both metrics are now slowing to a pace that is more in-line with historical seasonal patterns, and with what one might expect given that borrowing costs are where they are.”
The MLS® Home Price Index composite benchmark price for all residential properties in Metro Vancouver is currently $1,208,400. This represents a 2.5 per cent increase over August 2022 and a 0.2 per cent decrease compared to July 2023.
*Areas covered by the Real Estate Board of Greater Vancouver include Burnaby, Coquitlam, Maple Ridge, New Westminster, North Vancouver, Pitt Meadows, Port Coquitlam, Port Moody, Richmond, South Delta, Squamish, Sunshine Coast, Vancouver, West Vancouver, and Whistler. Check out the infographics of Squamish, Sunshine Coast and Whistler, HERE.
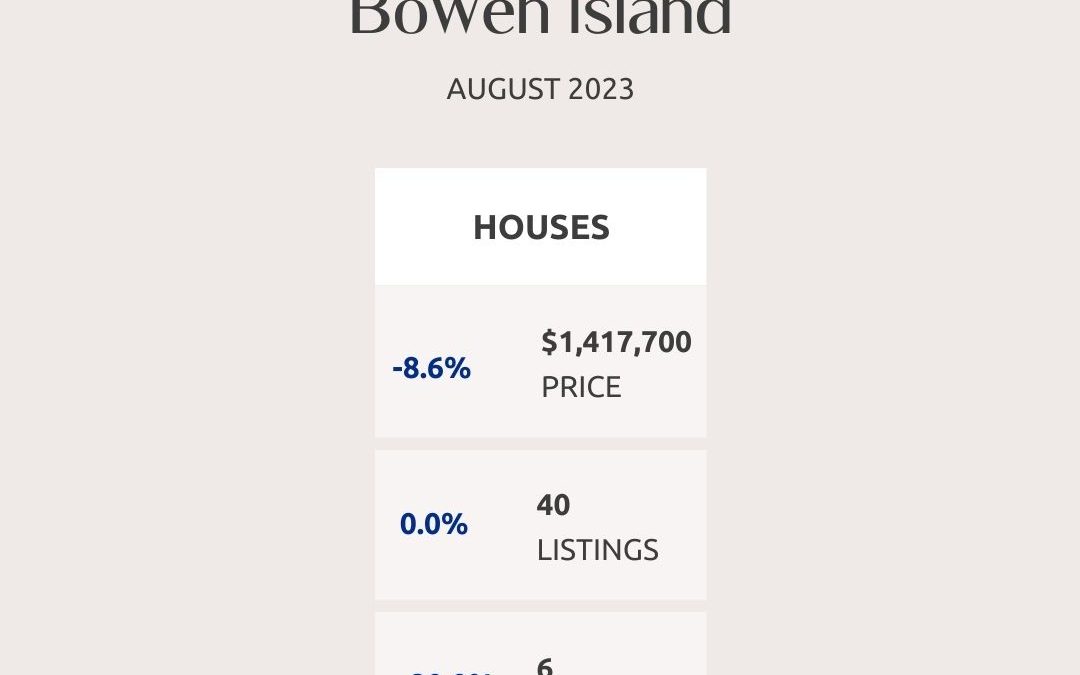
Bowen Island

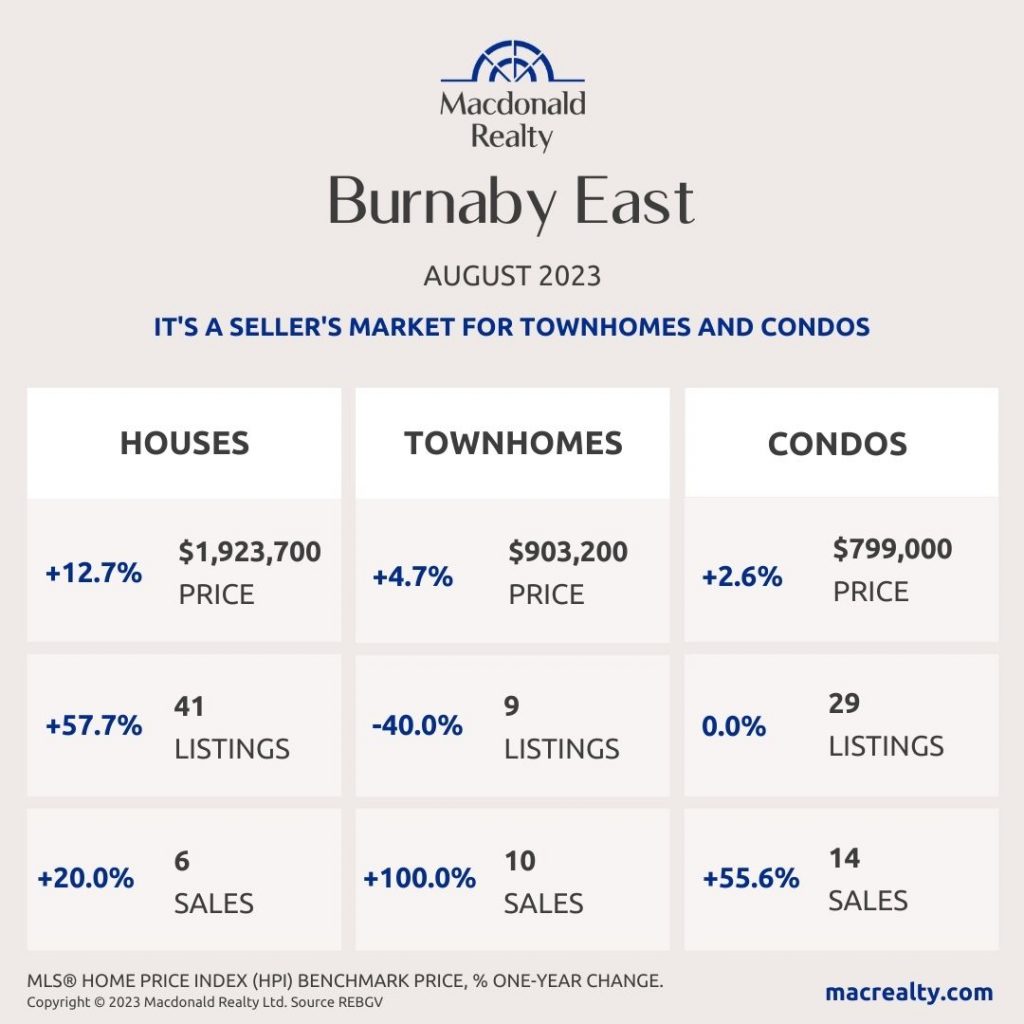
Burnaby East
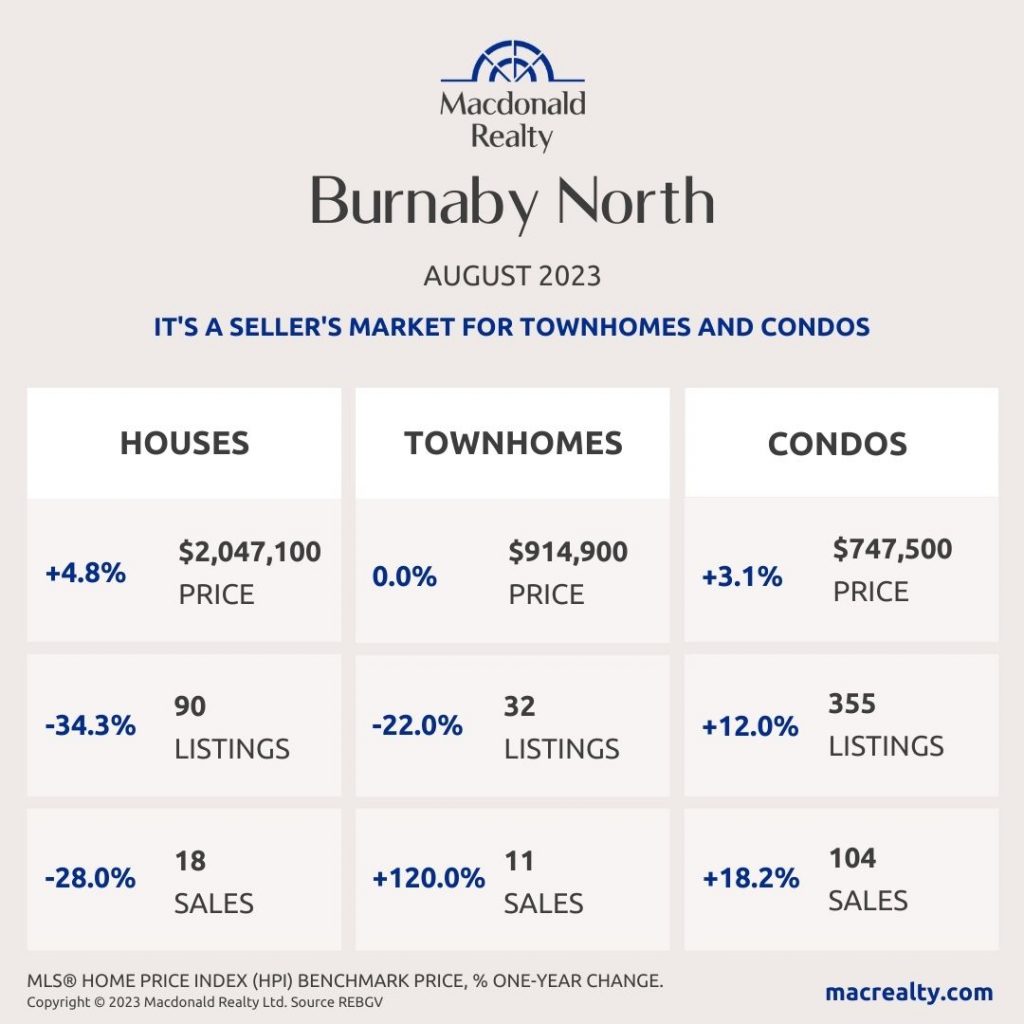
Burnaby North
Burnaby South

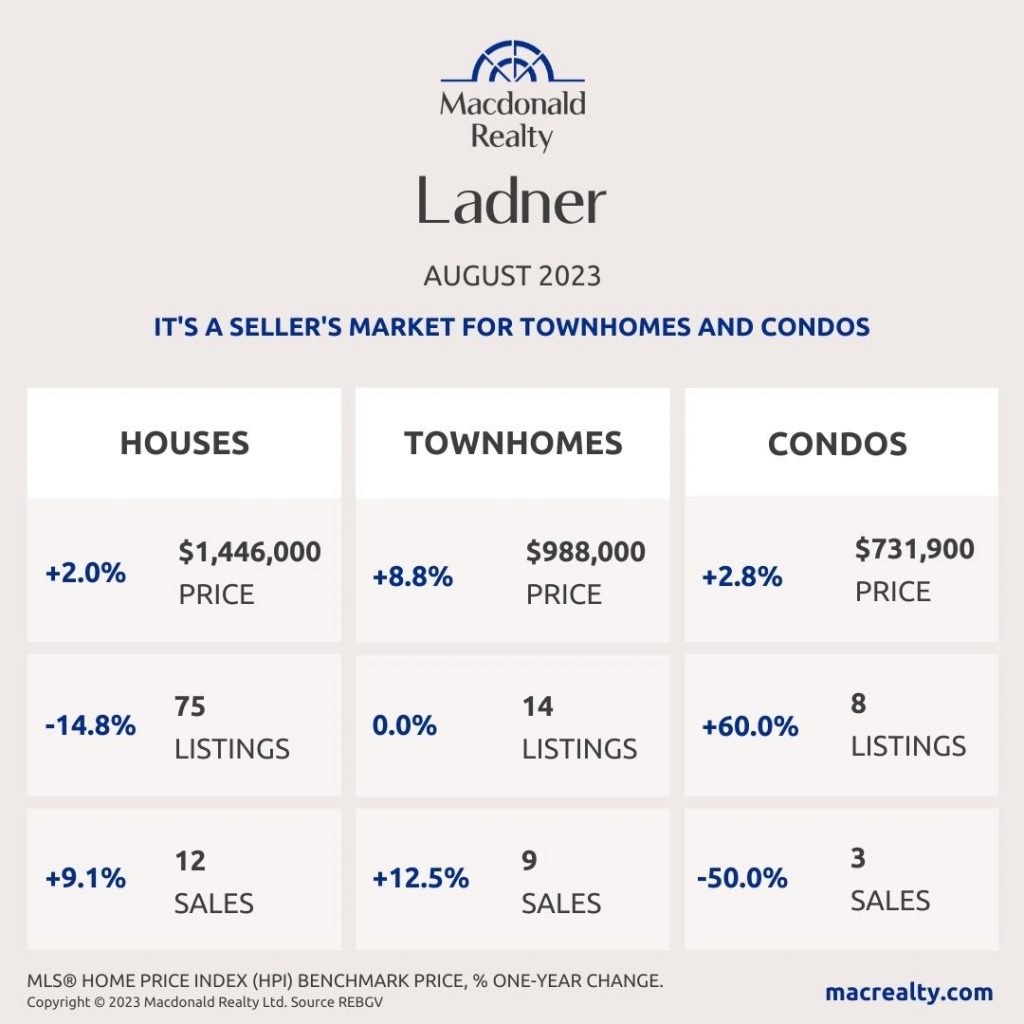
Ladner
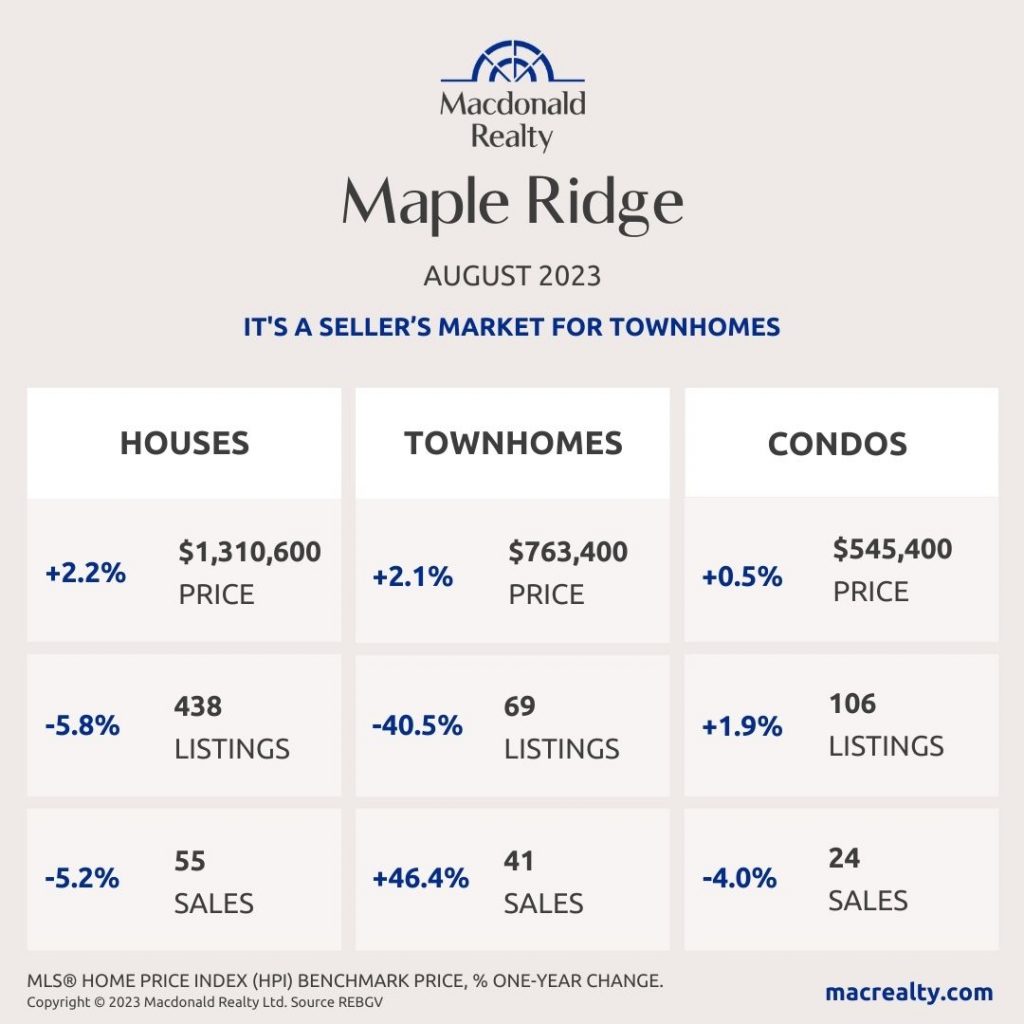
Maple Ridge
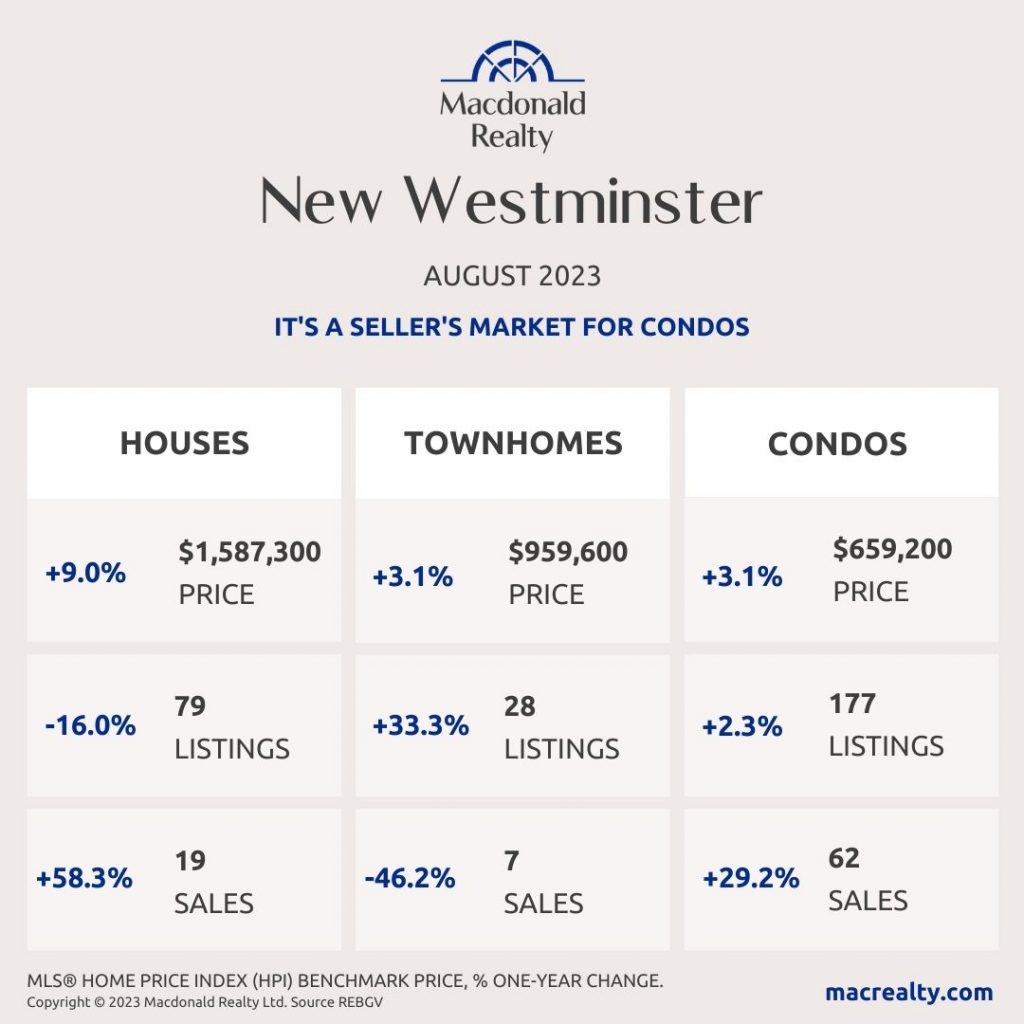
New Westminster
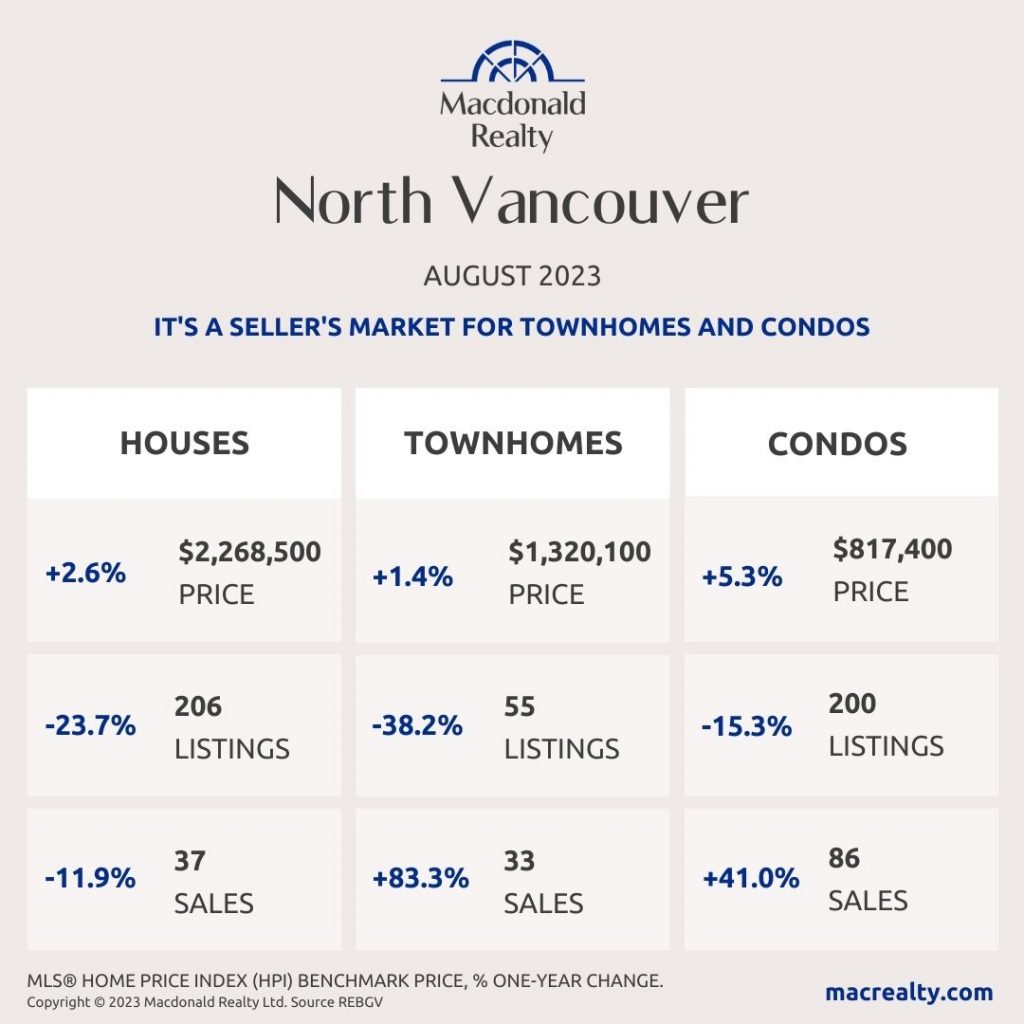
North Vancouver
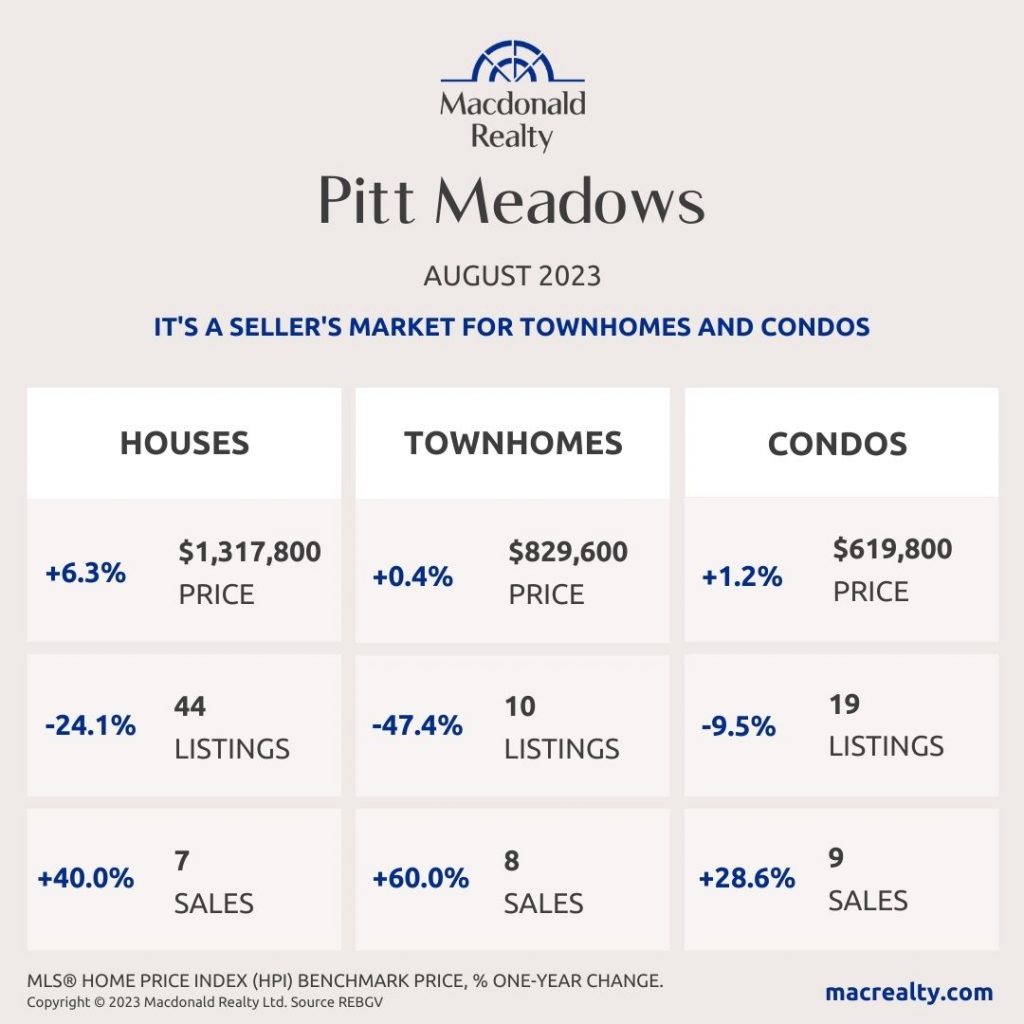
Pitt Meadows
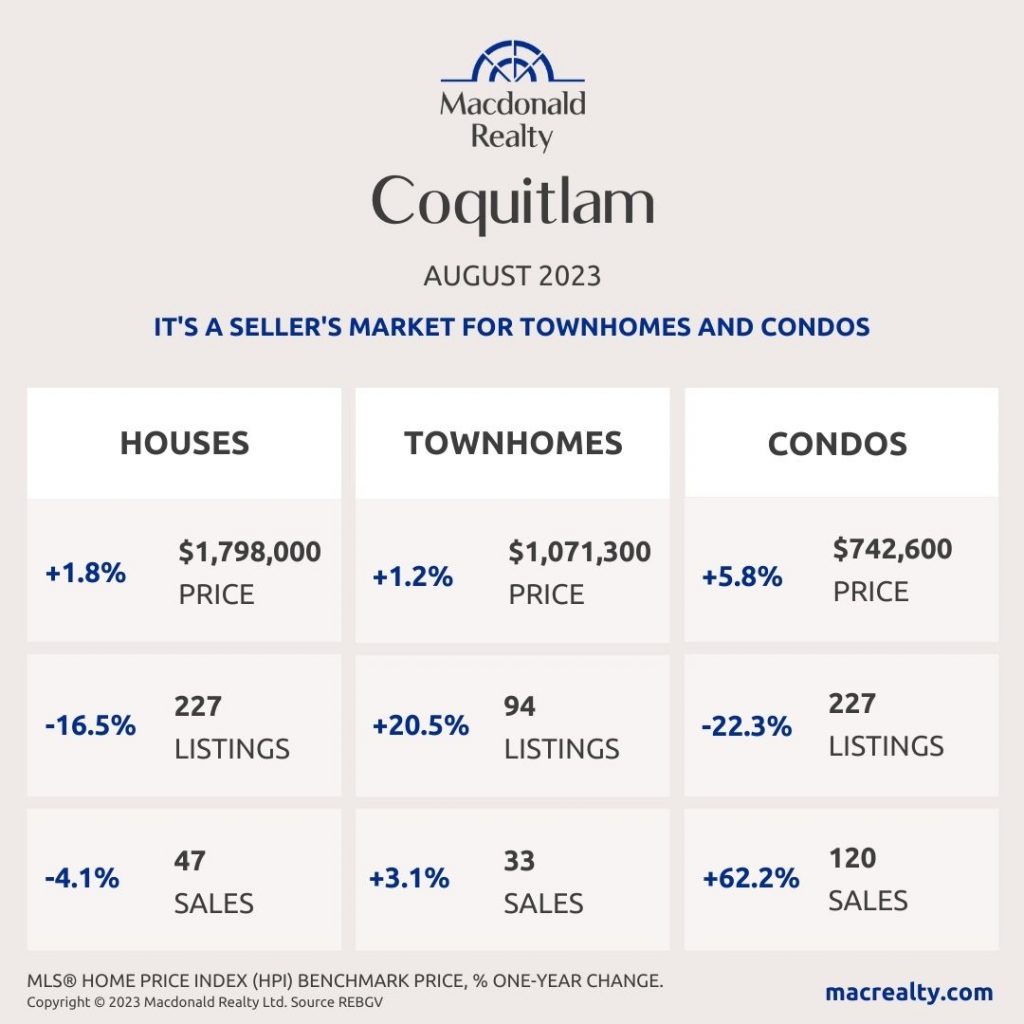
Coquitlam
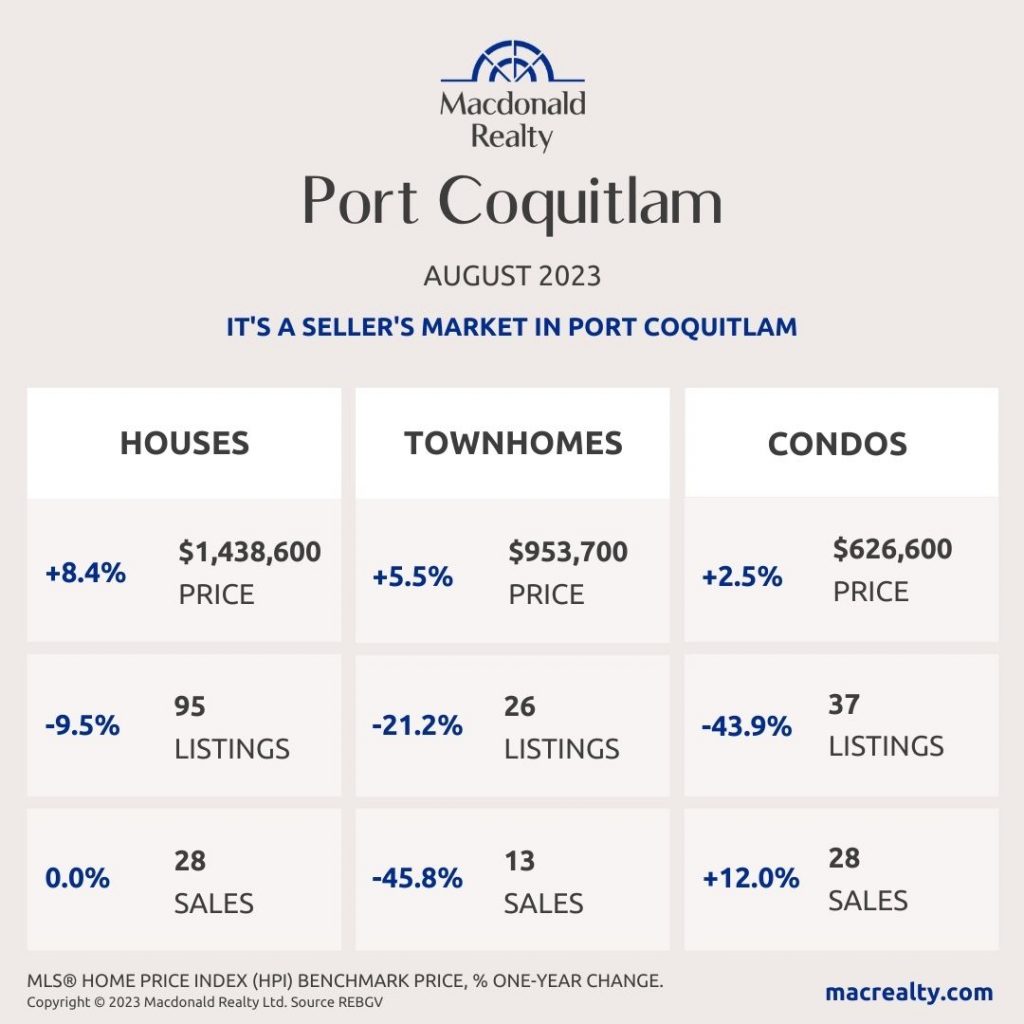
Port Coquitlam
Port Moody

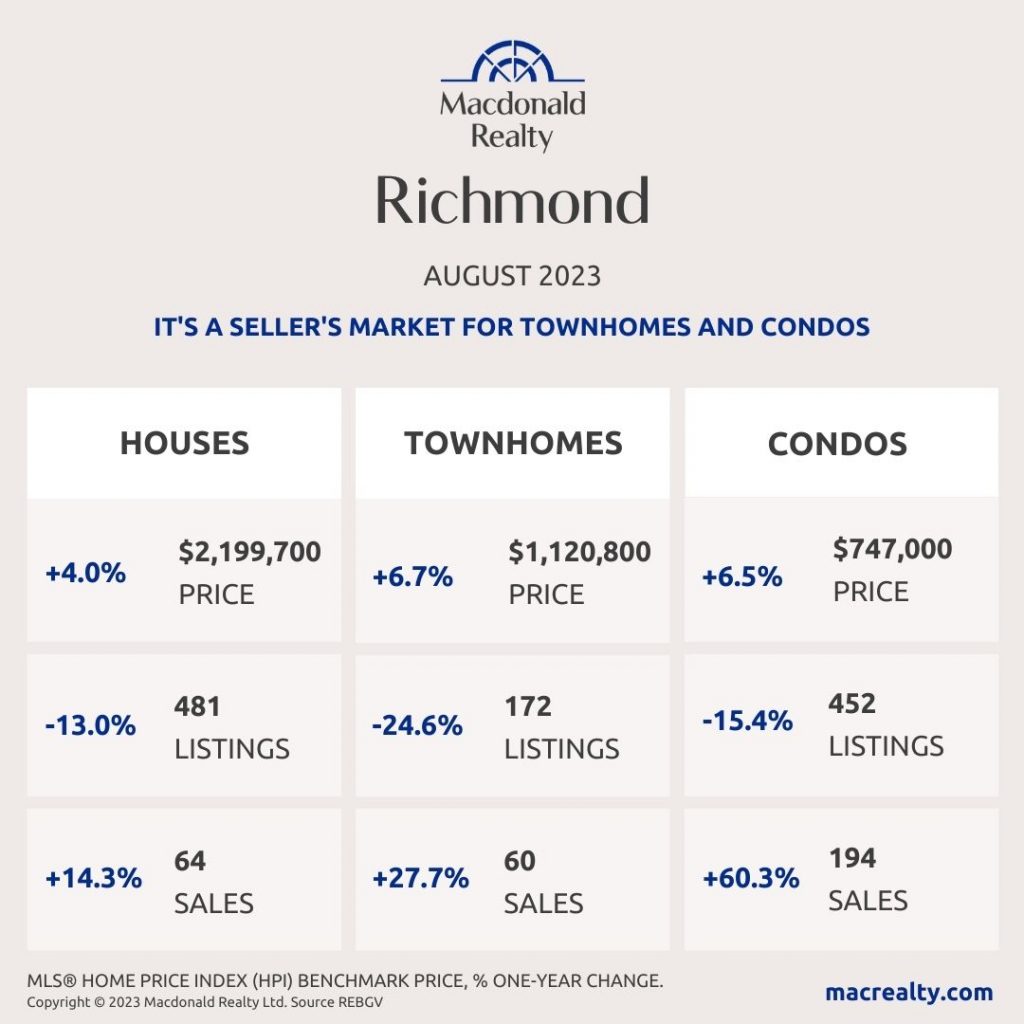
Richmond
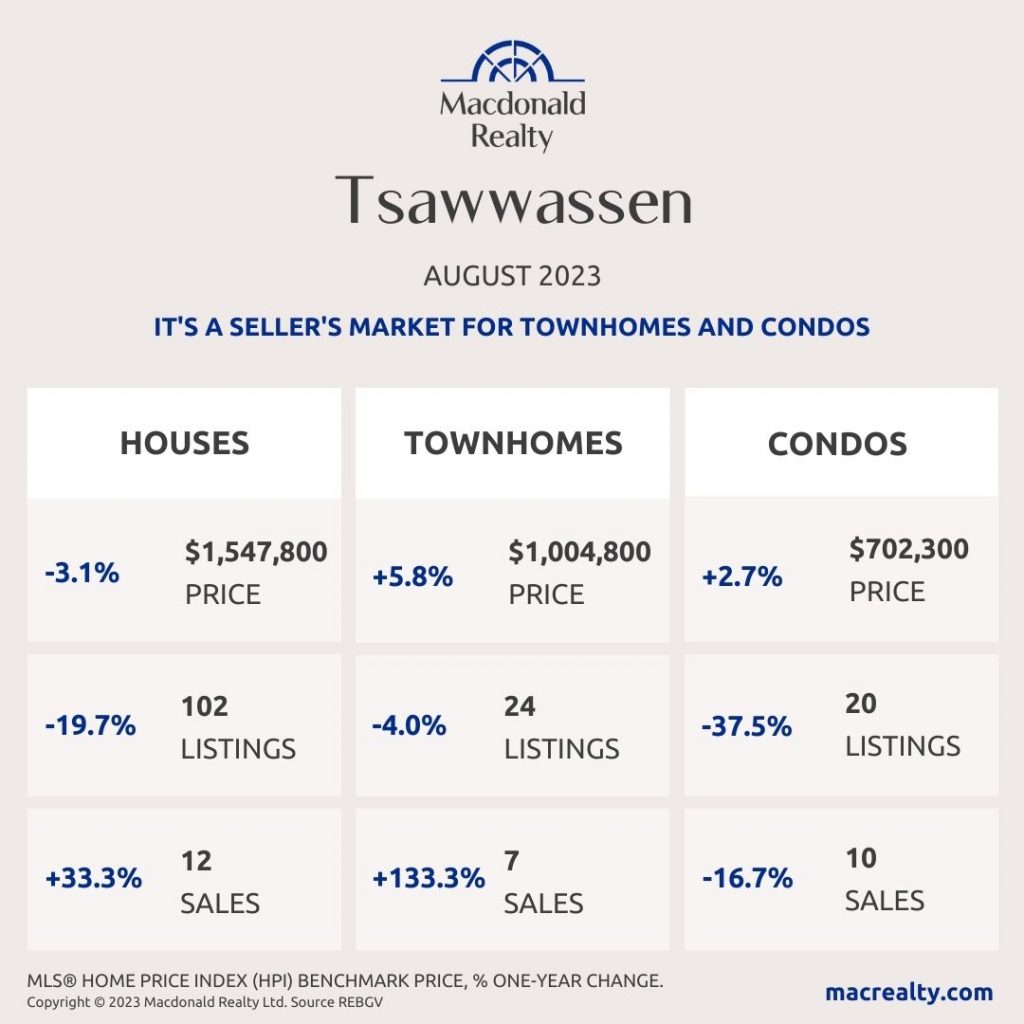
Tsawwassen
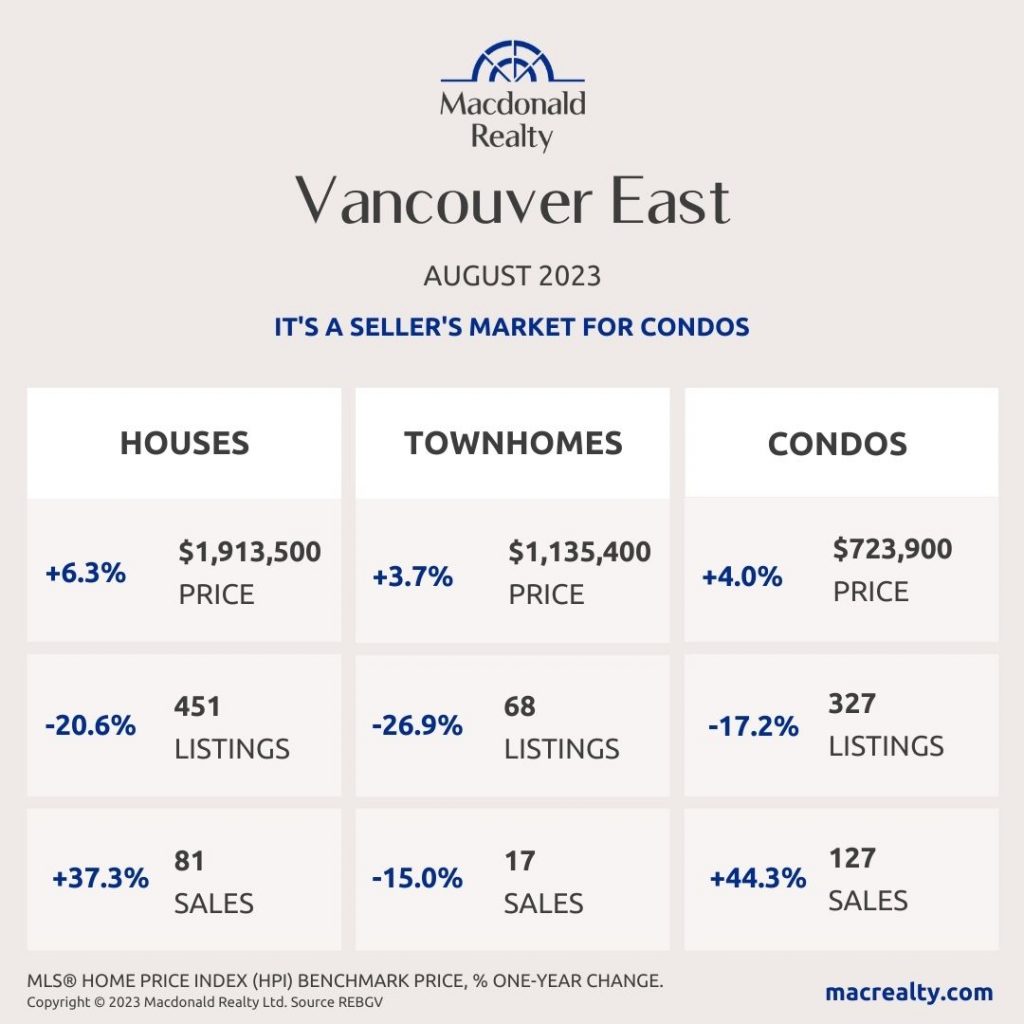
Vancouver East
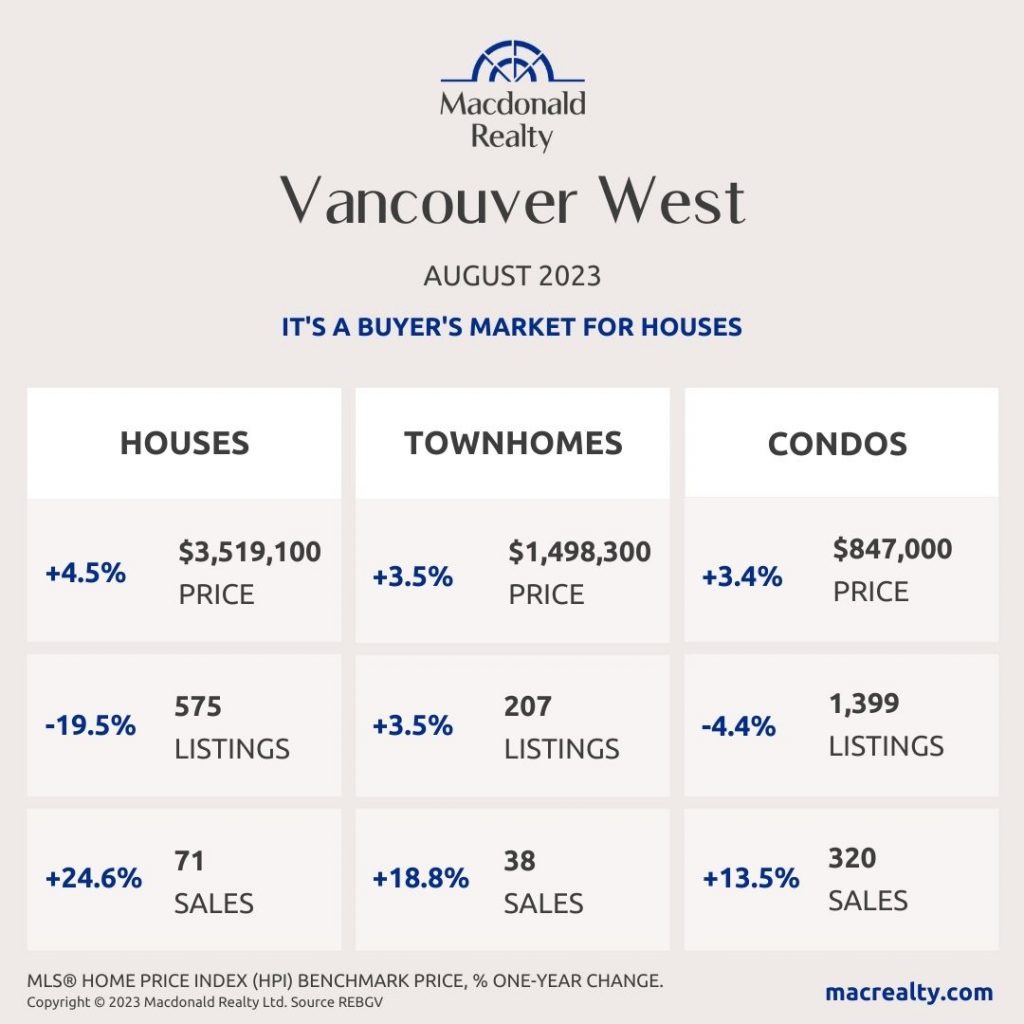
Vancouver West
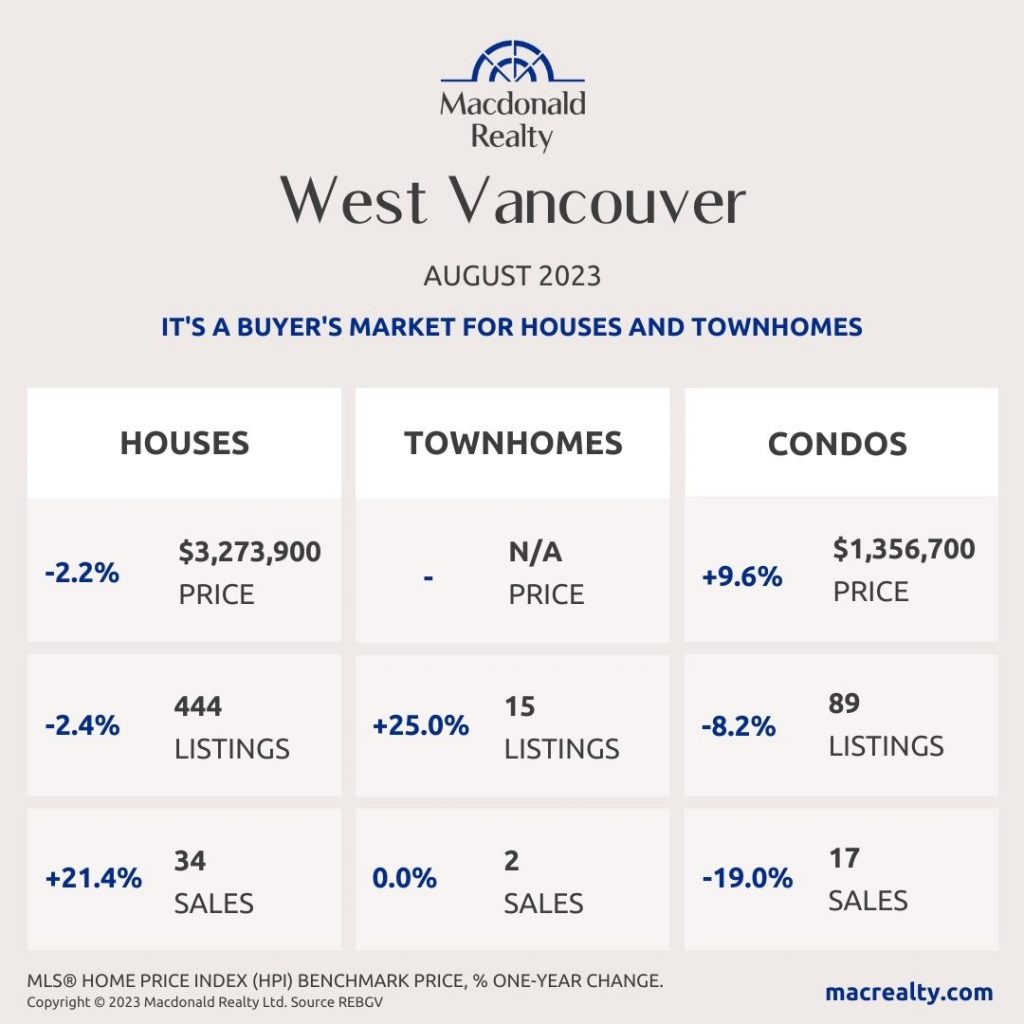
West Vancouver
Looking for more information about the real estate market in specific neighbourhoods in the Greater Vancouver?
Macdonald Realty has offices across the Greater Vancouver. Please email [email protected] or call 1-877-278-3888 to be matched with a REALTOR® working in your area.
MLS® Home Price Index (HPI) Benchmark Price
Average and median home prices are often misinterpreted, are affected by change in the mix of homes sold, and can swing dramatically from month to month (based on the types and prices of properties that sold in a given month). The MLS® HPI overcomes these shortcomings and uses the concept of a benchmark home, a notional home with common attributes of typical homes in a defined area. Visit www.housepriceindex.ca for more information.
This blog post is based on market data provided by the Real Estate Board of Greater Vancouver (REBGV) www.rebgv.org
by Macrealty Marketing Team | Sep 5, 2023 | Market Updates
Here are the latest real estate market statistics from Macdonald Realty on Squamish, Whistler, and Sunshine Coast listings and sales in August 2023.
Find all the infographics related to the August Market Statistics by visiting the Facebook Album.
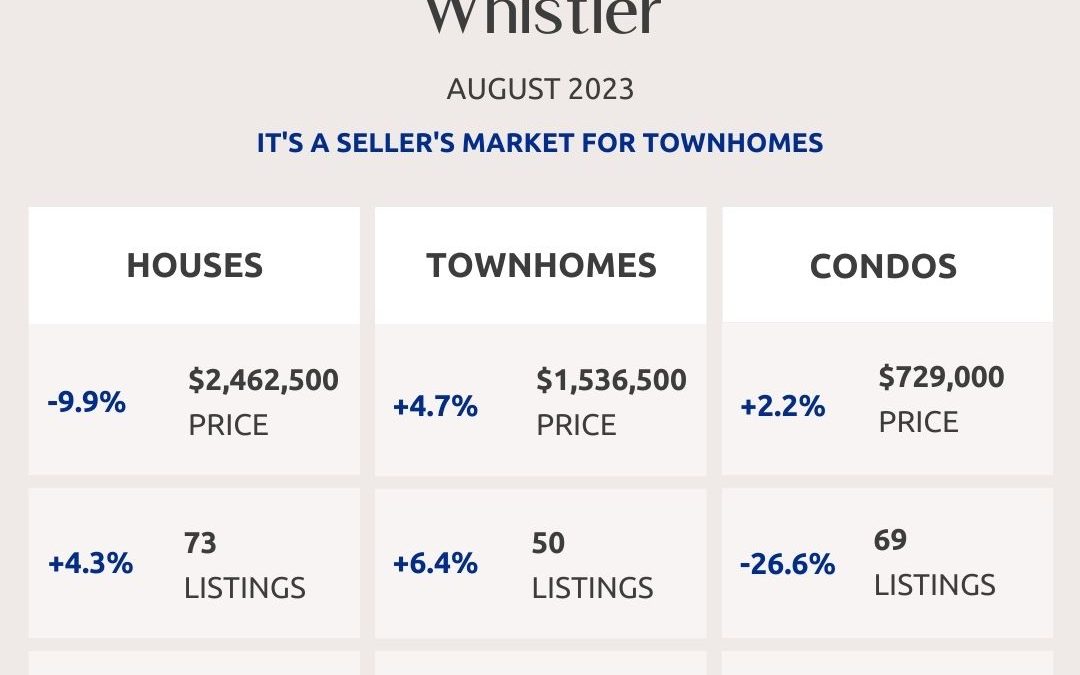
Whistler
In August 2023, there were 5 sales of detached homes and 73 active listings. The benchmark sale price was $2,462,500.
The condo market had 15 sales and 69 active listings at the end of the month. The benchmark sale price was $729,000.
The townhome market had 14 sales and the active listings were 50. The benchmark sale price was $1,536,500.
It’s a seller’s market for townhomes in Whistler.

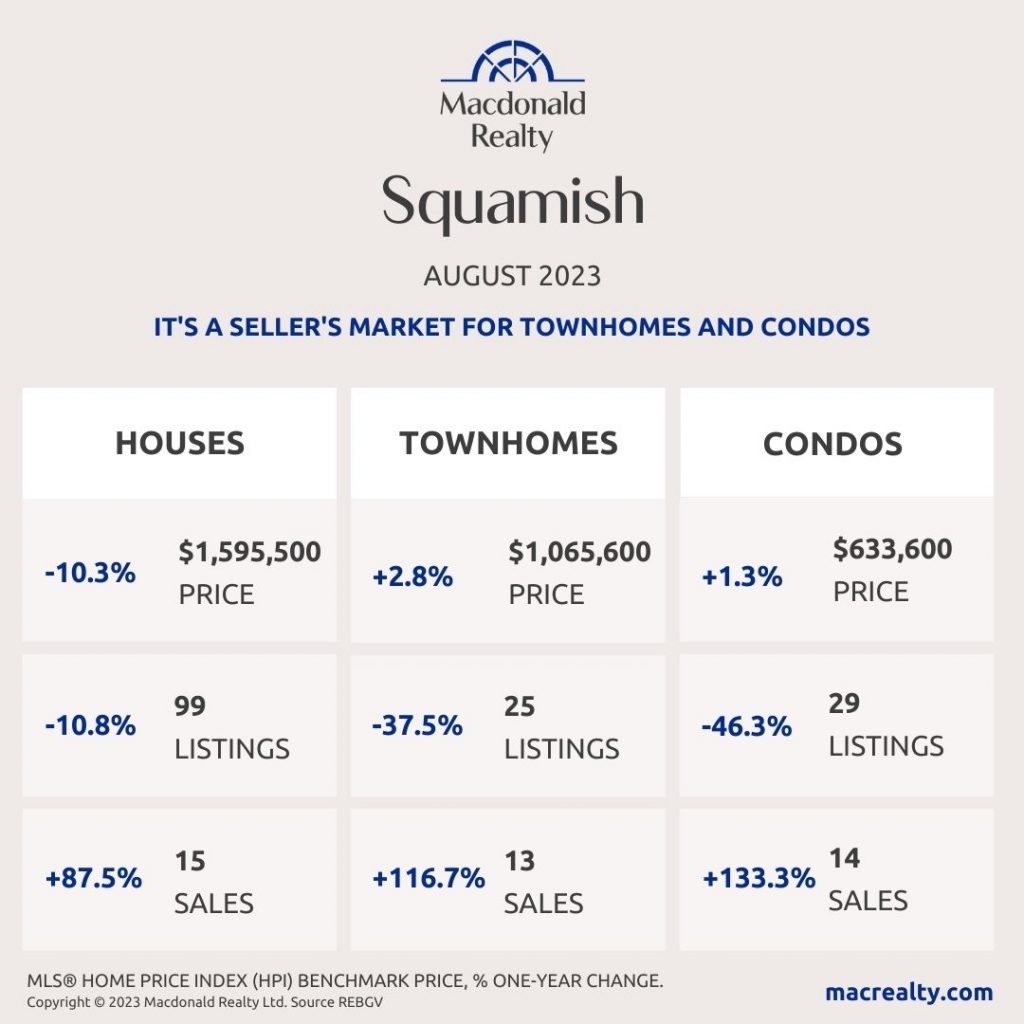
Squamish
In August 2023, there were 15 sales of detached homes and 99 active listings. The benchmark sale price was $1,595,500.
The condo market had 14 sales and 29 active listings at the end of the month. The benchmark sale price was $633,600.
The townhome market had 13 sales and the active listings were 25. The benchmark sale price was $1,065,600.
It’s a seller’s market for townhomes and condos in Squamish.
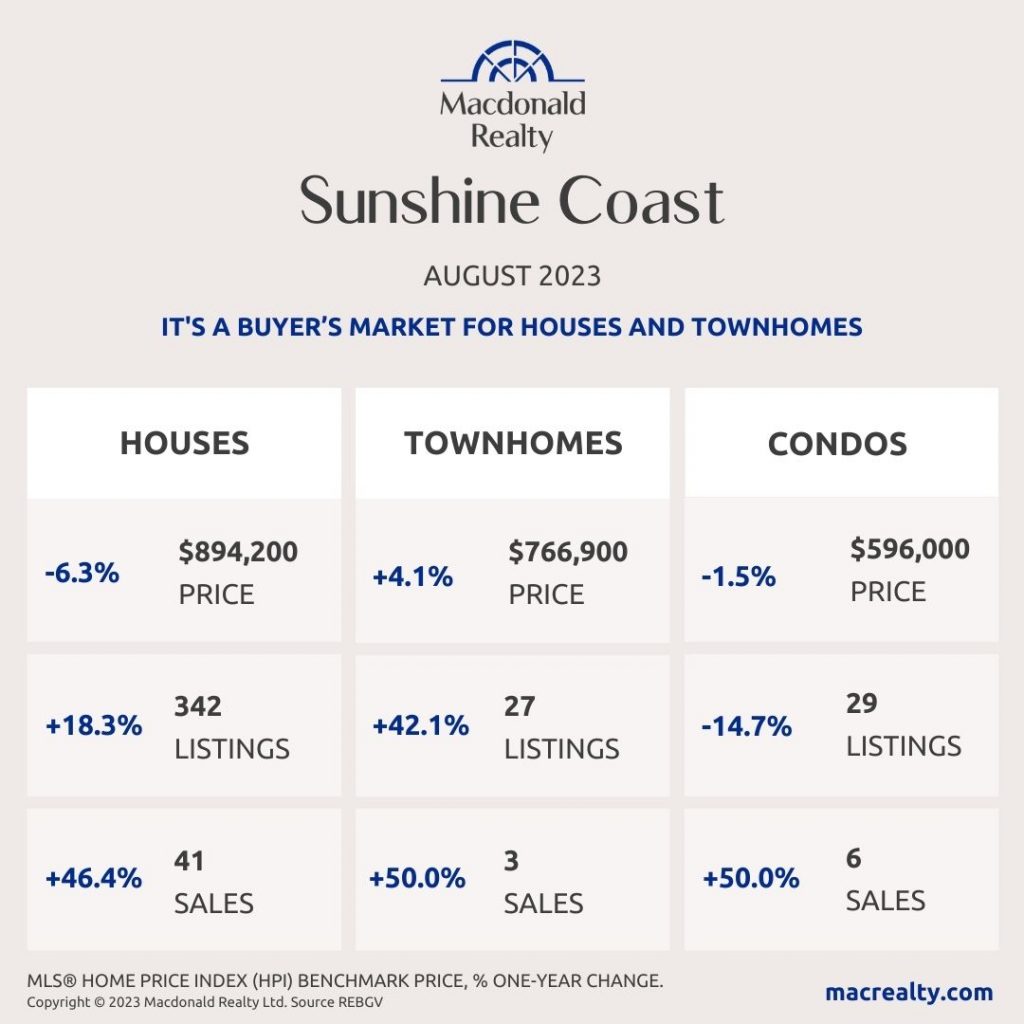
Sunshine Coast
In August 2023, there were 41 sales of detached homes and 342 active listings. The benchmark sale price was $894,200.
The condo market had 6 sales and 29 active listings at the end of the month. The townhome market had 3 sales and the active listings were 27.
It’s a seller’s market for houses and townhomes in Sunshine Coast.
Looking for more information about the real estate market in specific neighbourhoods in Squamish, Whistler, and Sunshine Coast? Macdonald Realty has offices in Squamish, Whistler, and Sunshine Coast. Please email [email protected] or call 1-877-278-3888 to be matched with a REALTOR® working in your area.
MLS® Home Price Index (HPI) Benchmark Price
Average and median home prices are often misinterpreted, are affected by change in the mix of homes sold, and can swing dramatically from month to month (based on the types and prices of properties that sold in a given month). The MLS® HPI overcomes these shortcomings and uses the concept of a benchmark home, a notional home with common attributes of typical homes in a defined area. Visit www.housepriceindex.ca for more information.
This blog post is based on market data provided by the Real Estate Board of Greater Vancouver (REBGV) www.rebgv.org
by Macrealty Marketing Team | Sep 5, 2023 | Market Updates
A combination of seasonal trends and cautious anticipation of the next rate announcement saw the Fraser Valley real estate market slow in August as sales fell slightly for the second month, after reaching a 15-month high in June.
The Fraser Valley Real Estate Board recorded 1,273 sales on its Multiple Listing Service (MLS®) in August 2023, a decrease of 6.9 per cent compared to July. Sales were up 25.2 per cent compared to August 2022.
New listings dropped to 2,622 in August, a decrease of 8.2 per cent over last month, but 28.2 per cent above this time last year. Active listings have been rising since last December and grew again in August by 1.5 per cent to 6,291, just 7 per cent off the ten-year average.
“Many buyers are in “watchful waiting” mode as they hold off on decisions in anticipation of potential further rate changes,” said Narinder Bains, Chair of the Fraser Valley Real Estate Board. “With prices relatively stable and active inventory on the rise, we hope to see more new listings come on stream over the next couple of months, especially if rates hold steady.”
With a sales-to-active-listings ratio of 16 per cent, the market for detached homes was balanced between supply and demand. Demand for townhomes and apartments remained stronger (38 per cent and 32 per cent, respectively). The market is considered balanced when the sales-to-active-listings ratio is between 12 per cent and 20 per cent.
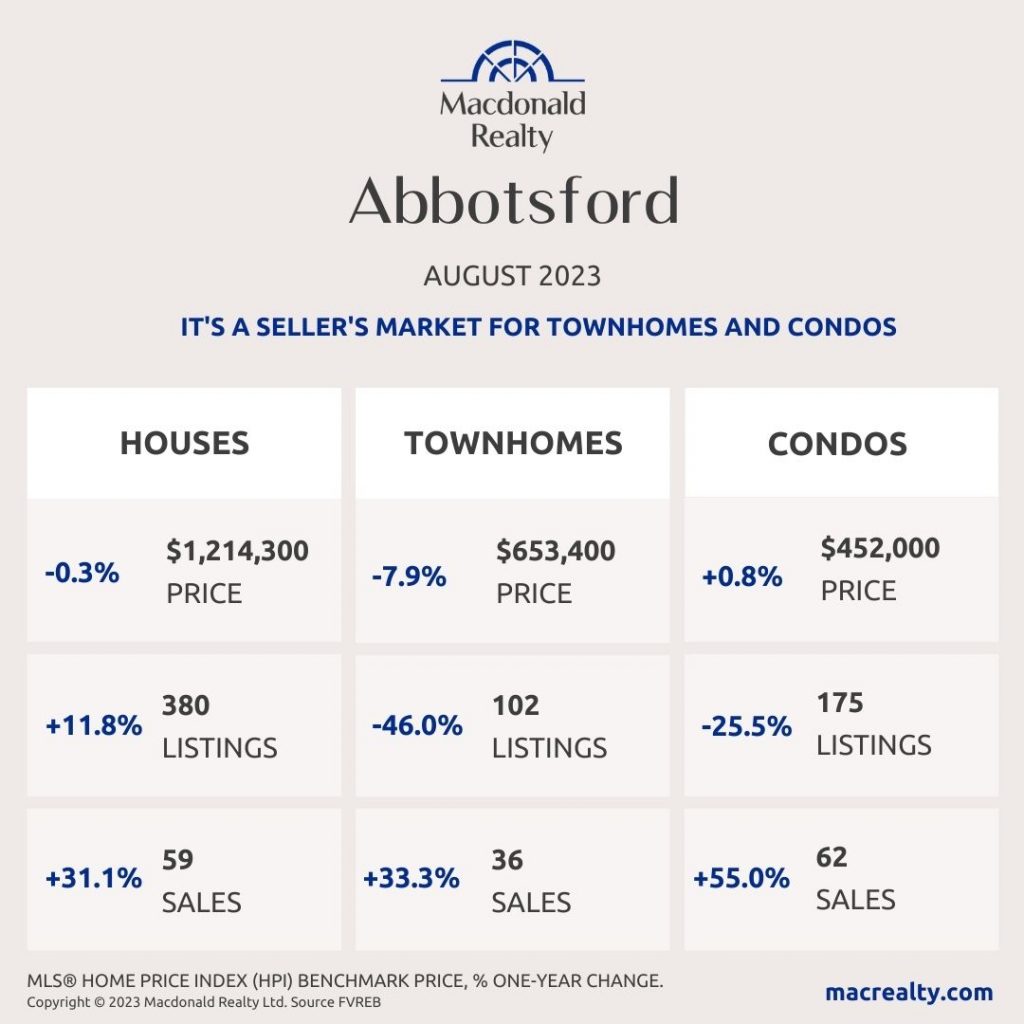
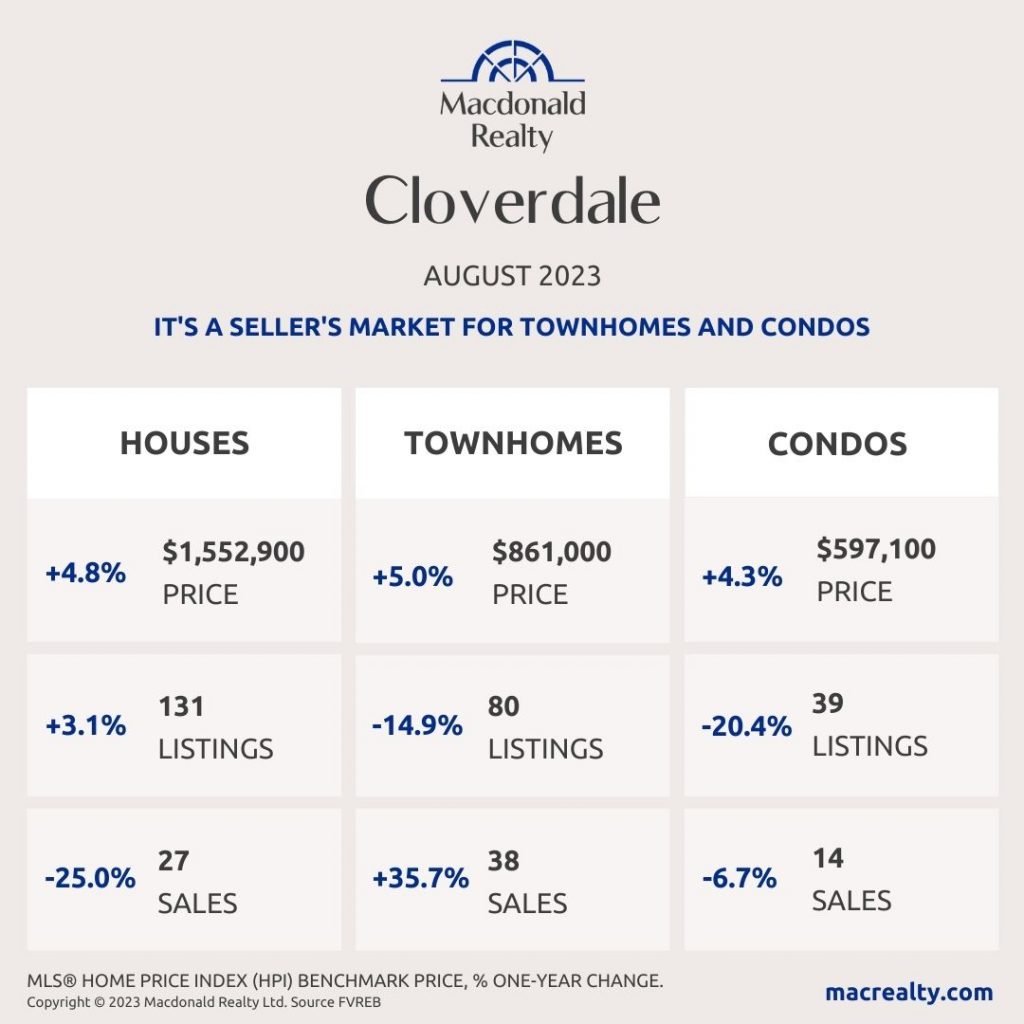
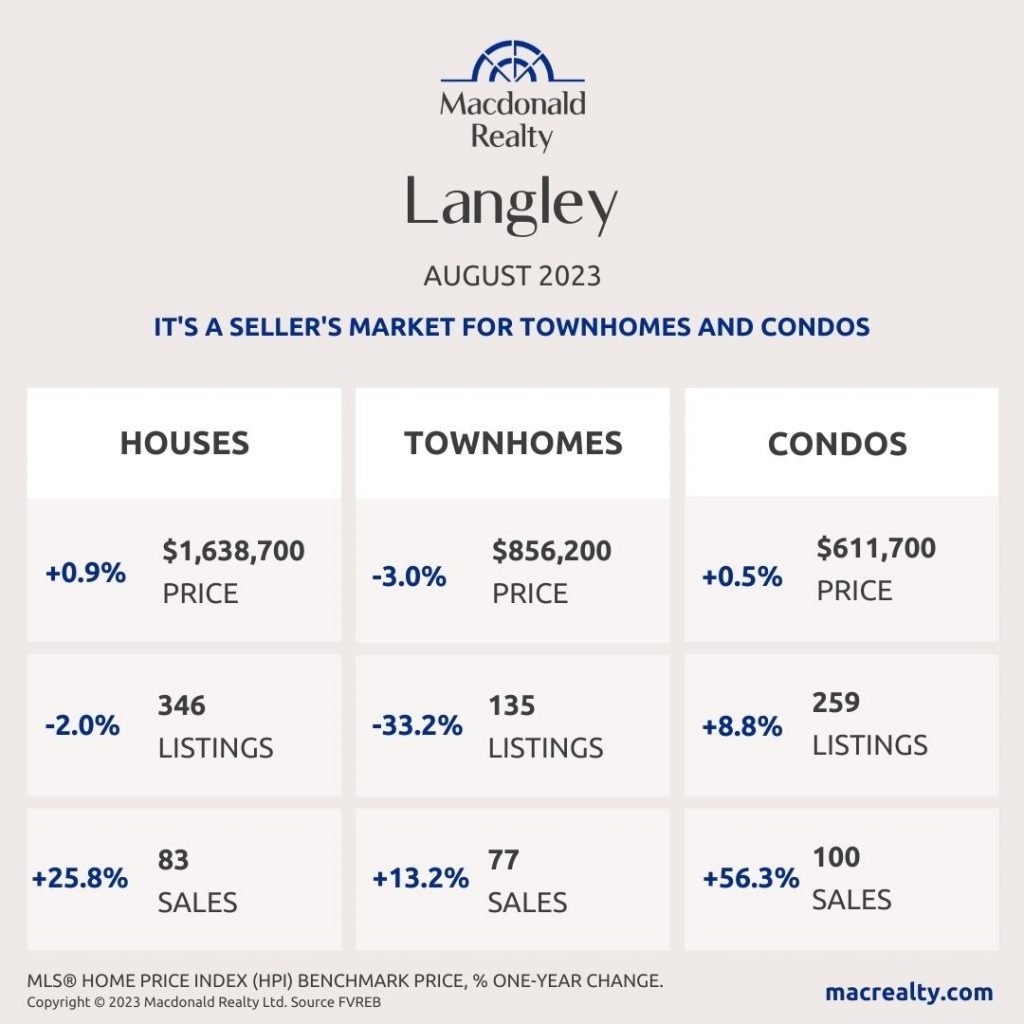
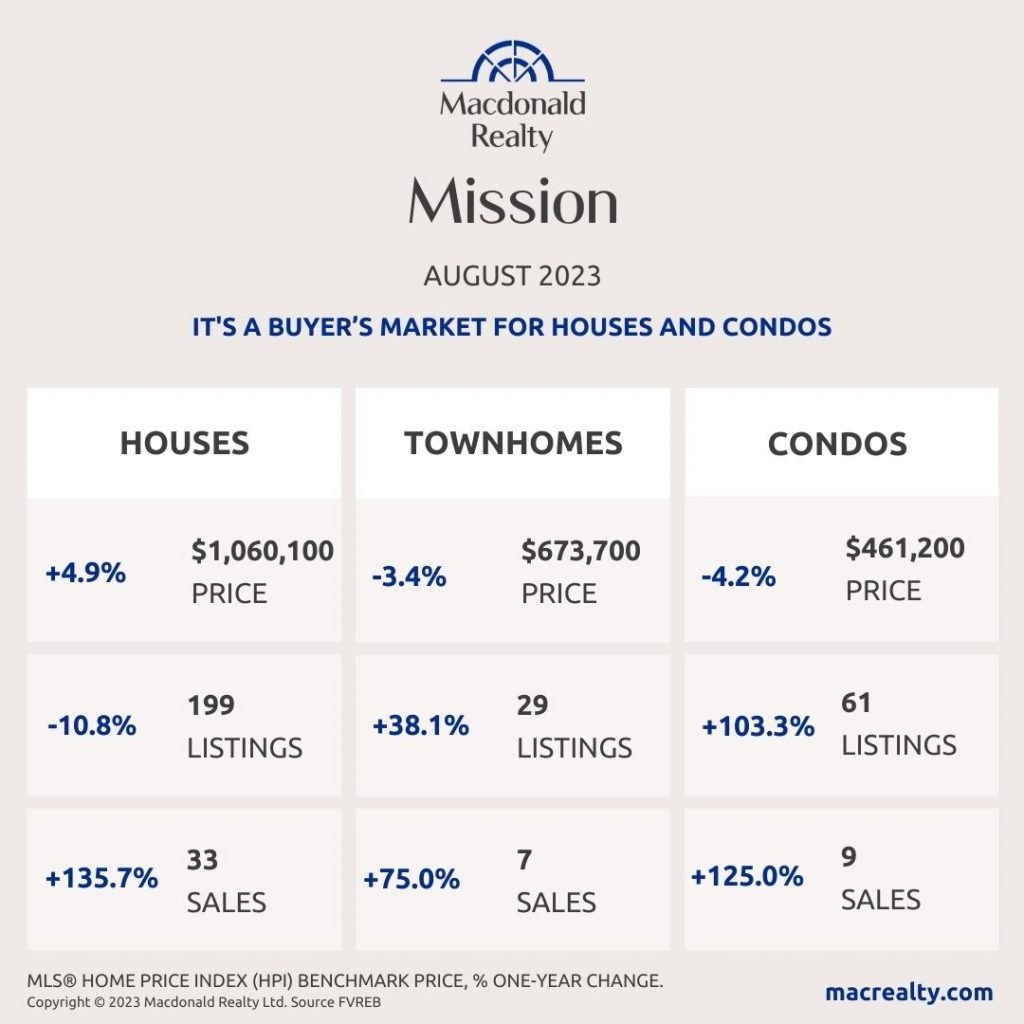
Benchmark prices in the Fraser Valley, remained relatively unchanged compared to last month with gains of less than one per cent across all property types. See below for more information.
“We expect to see market activity pick up heading into the fall months,” said FVREB CEO, Baldev Gill. “That said, with the uncertainty surrounding interest rates as well as the potential impact of provincial housing strategy initiatives, buyers and sellers would be well-advised to consult with a professional REALTOR® to assess any risks and opportunities before making a decision.”
Find all the infographics related to the August Market Statistics by visiting the Facebook Album.
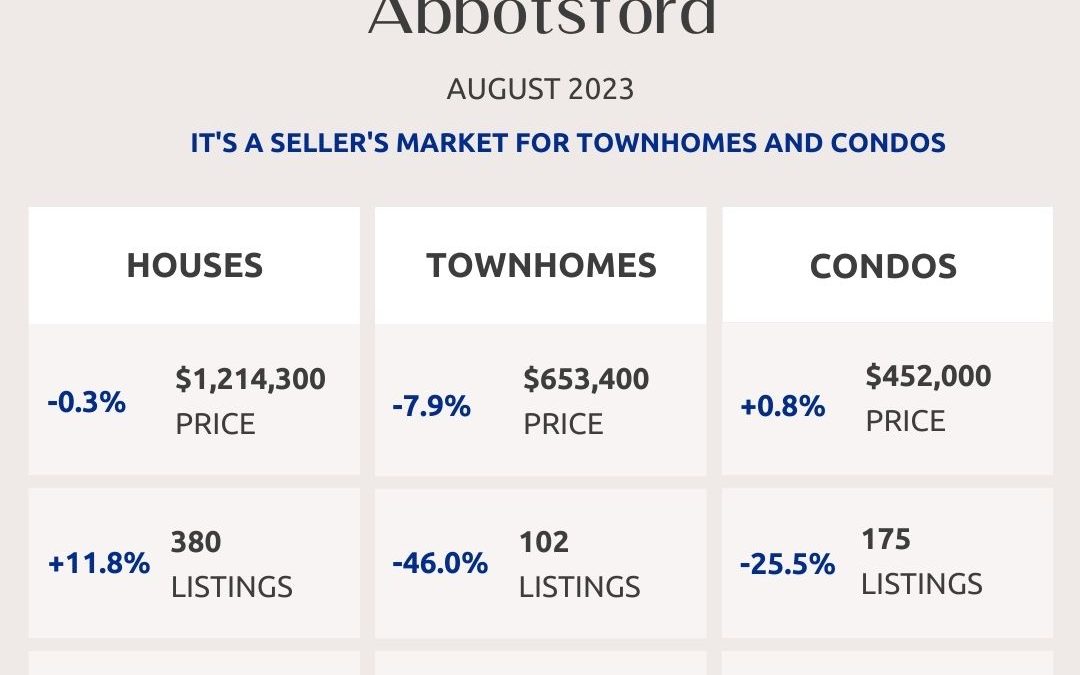
Abbotsford
Cloverdale
Langley
Mission
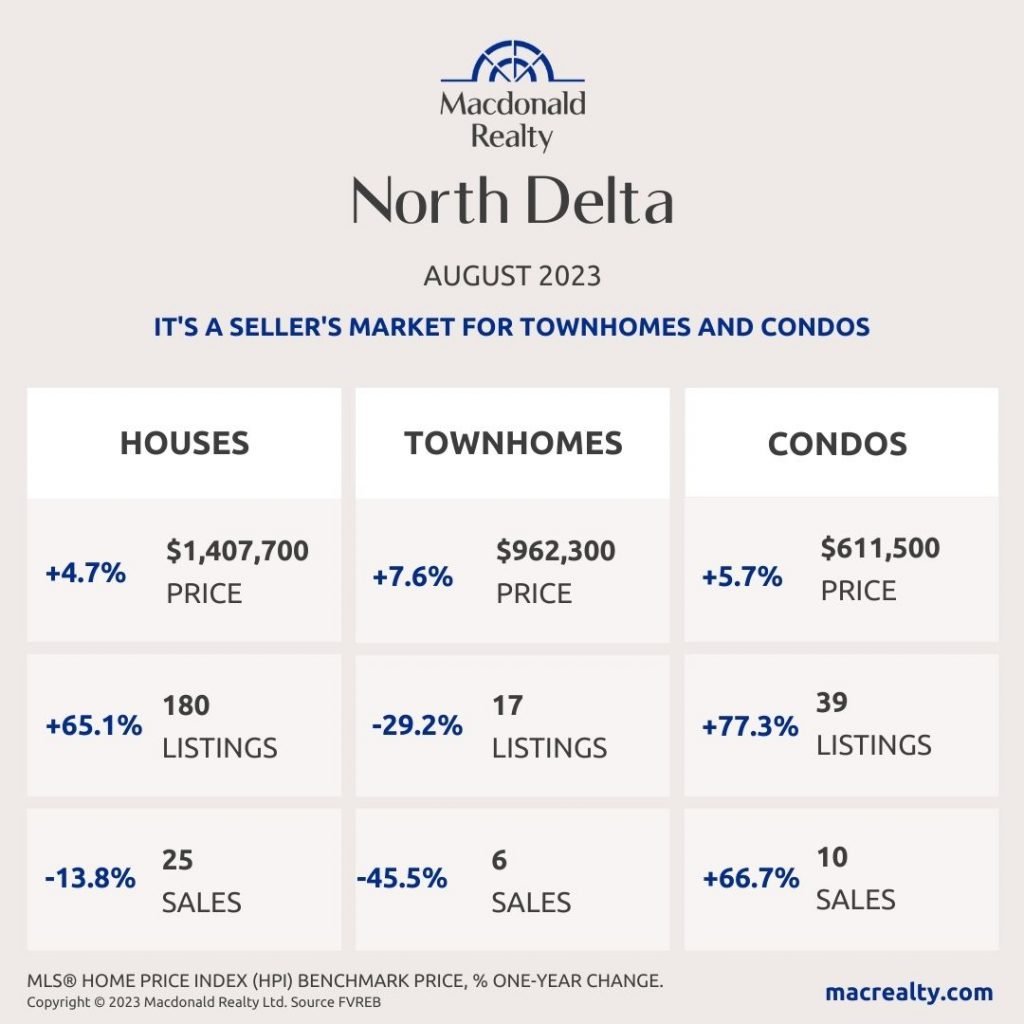
North Delta
North Surrey

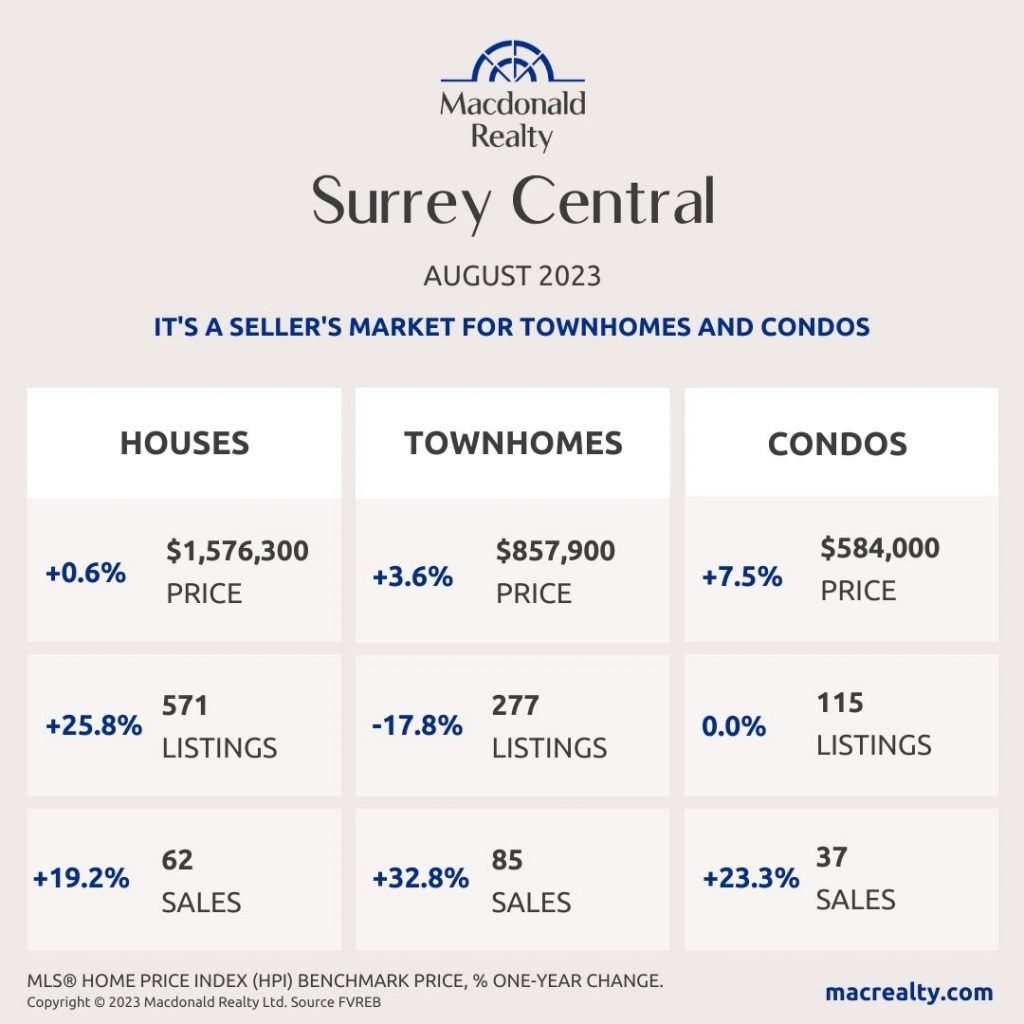
Surrey Central
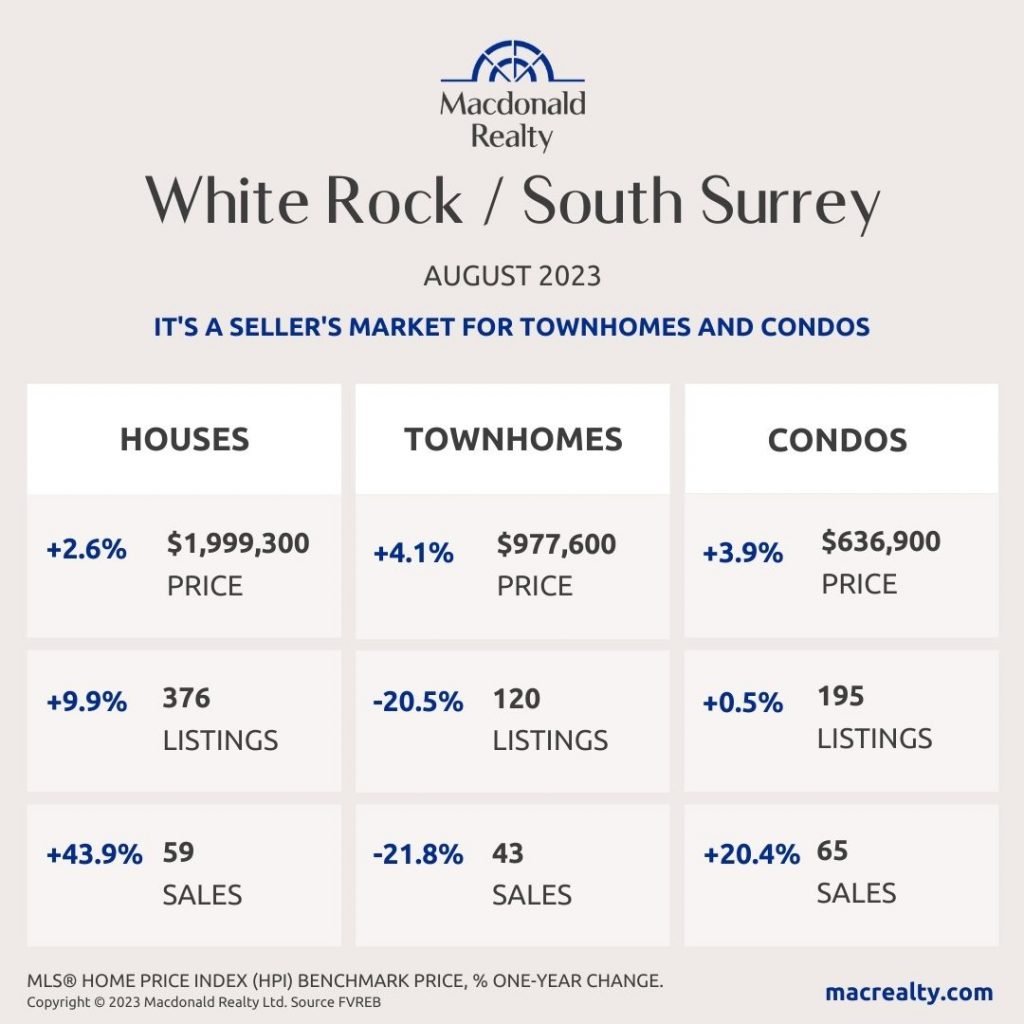
White Rock / South Surrey
Looking for more information about the real estate market in specific neighbourhoods in Surrey, Langley and Fraser Valley?
Macdonald Realty has offices in North Delta, White Rock/South Surrey, and Langley. Please email [email protected] or call 1-877-278-3888 to be matched with a REALTOR® working in your area.
MLS® Home Price Index (HPI) Benchmark Price
Average and median home prices are often misinterpreted, are affected by change in the mix of homes sold, and can swing dramatically from month to month (based on the types and prices of properties that sold in a given month). The MLS® HPI overcomes these shortcomings and uses the concept of a benchmark home, a notional home with common attributes of typical homes in a defined area. Visit www.housepriceindex.ca for more information.
This blog post is based on market data provided by the Fraser Valley Real Estate Board (FVREB) www.fvreb.bc.ca
by Macrealty Marketing Team | Aug 4, 2023 | Market Updates
Here are the latest real estate market statistics from Macdonald Realty on Okanagan listings and sales in July 2023.
Find the infographics by visiting the Facebook Album.
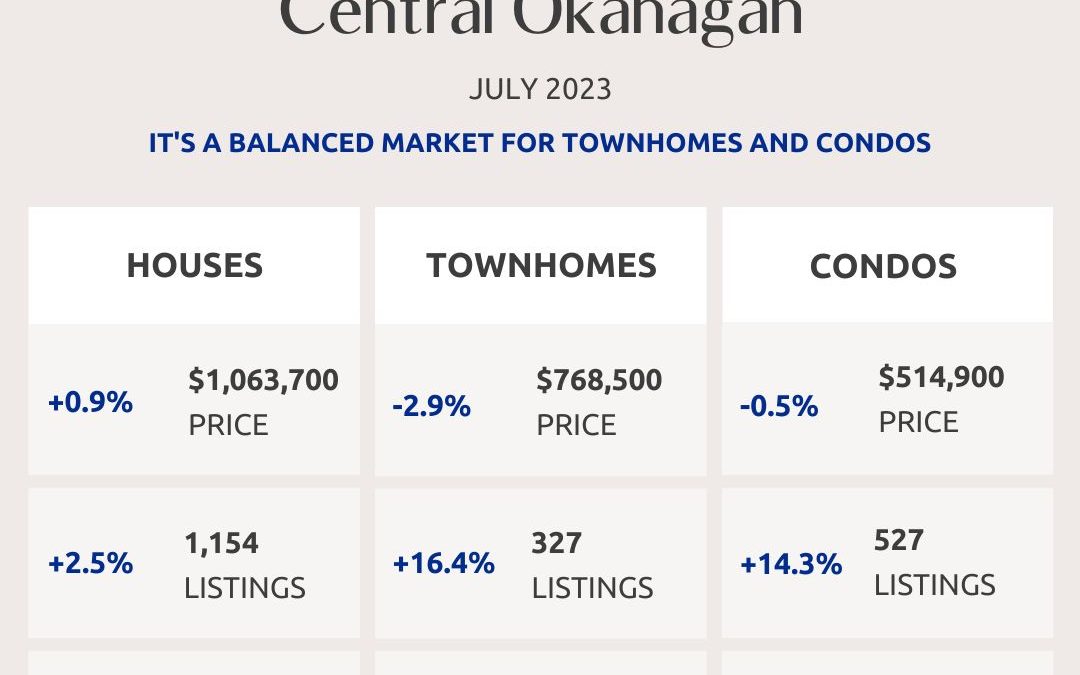
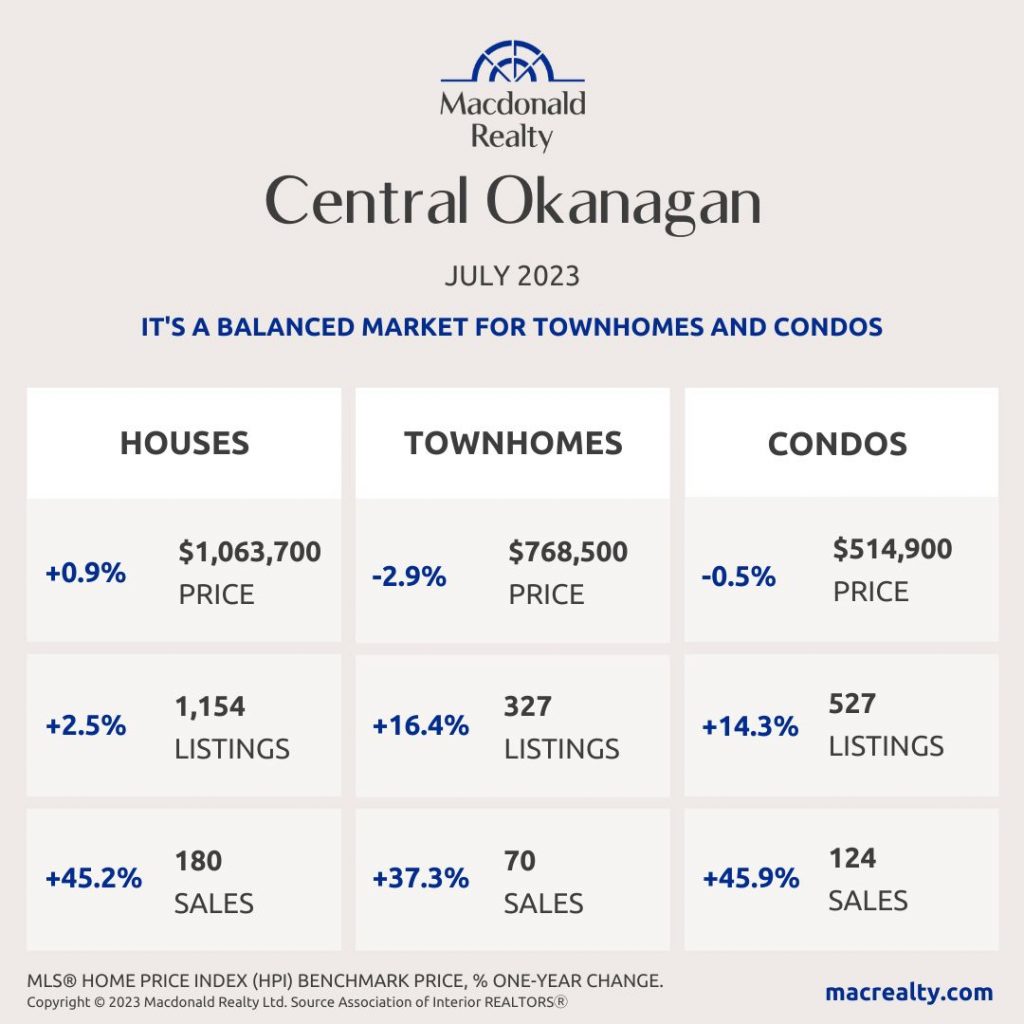
Central Okanagan: Kelowna and Lake Country
There were 180 sales, 1,154 active listings, and $1,063,700 average sale price for detached homes in the Central Okanagan market, including Kelowna and Lake Country. The condo market featured 124 sales and 527 active listings at the end of the month. The average sale price was $514,900. Townhome sales were 70, active listings were 327 and the average sale price was $768,500. It’s a balanced market for townhomes and condos in Central Okanagan.
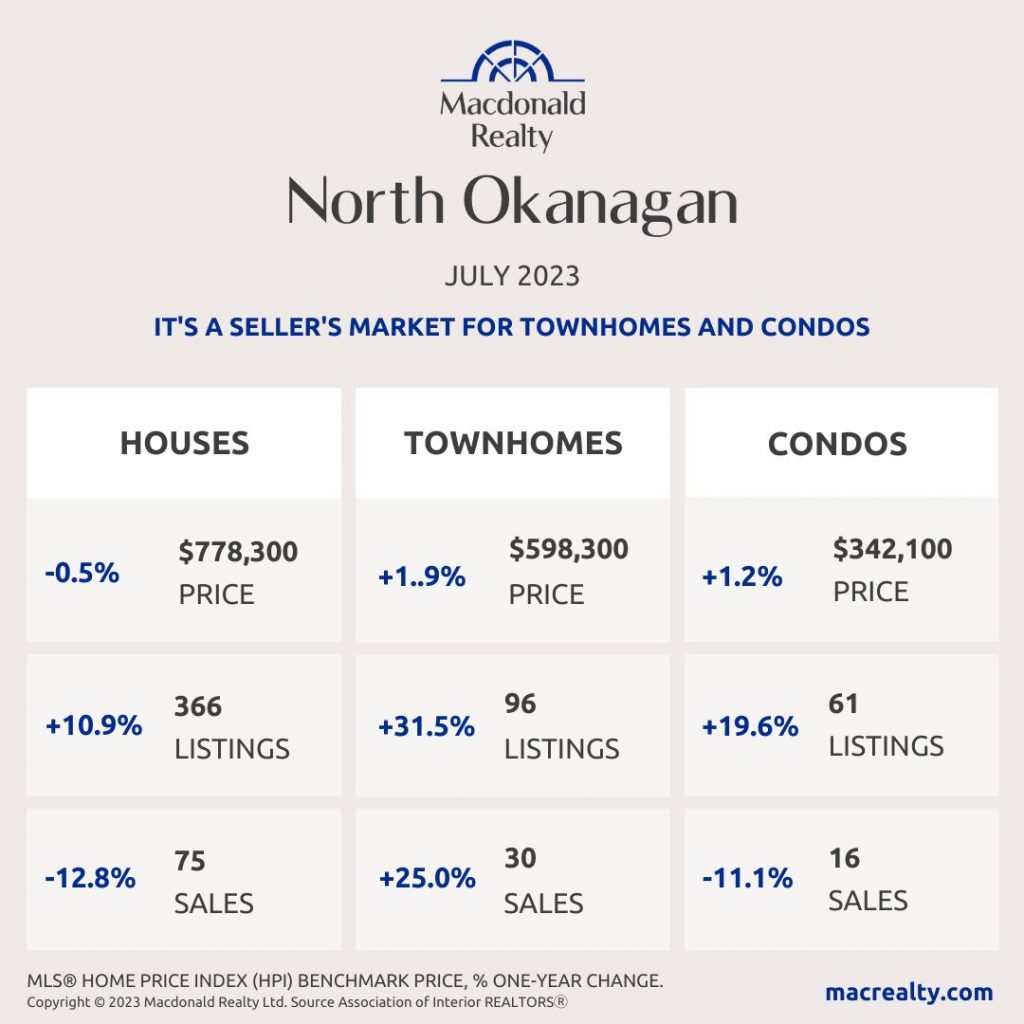
North Okanagan: Vernon and surrounding area
In North Okanagan, including Vernon and the surrounding area and the average detached home sale price was $778,300. At the end of the month, there were 75 sales and 366 active listings. There were 16 sales and 61 active listings for condos. The average sale price was $342,100. In comparison, townhomes featured 30 sales, 96 active listings and a $598,300 average sale price. It’s a seller’s market for townhomes and condos in North Okanagan.
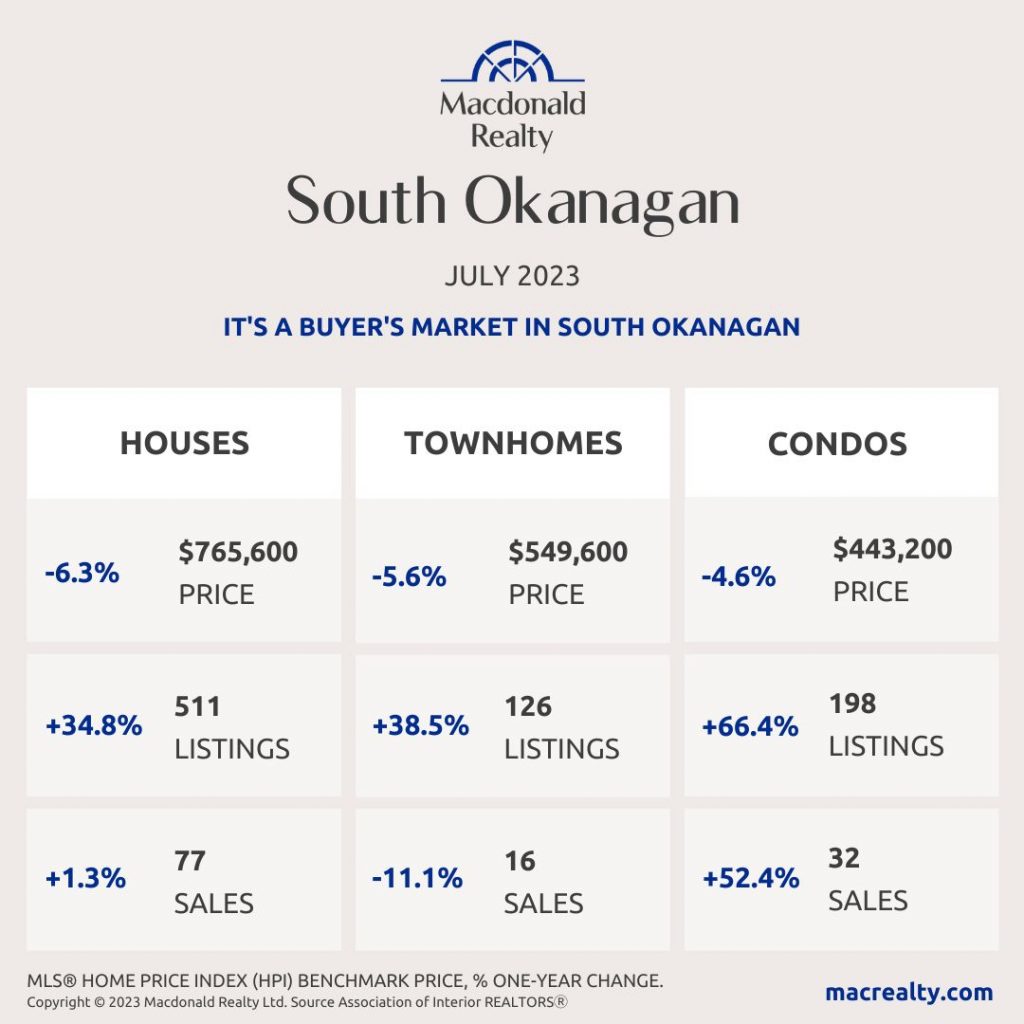
South Okanagan
There were 77 sales, 511 active listings, and $765,600 average sale price for detached homes in the South Okanagan market.
The condo market featured 32 sales and 198 active listings at the end of the month. The average sale price was $443,200. Townhome sales were 16, active listings were 126 and the average sale price was $549,600. It’s a buyer’s market in South Okanagan.
Looking for more information about the real estate market in specific neighbourhoods in Okanagan?
Macdonald Realty has offices in Kelowna and across BC. Please email [email protected] or call 1-877-278-3888 to be matched with a REALTOR® working in your area.
This blog post is based on market data provided by the Association Of Interior REALTORS® https://www.interiorrealtors.ca/.
by Macrealty Marketing Team | Aug 3, 2023 | Market Updates
August 2023 – Lower Mainland Monthly Update
(REBGV & FVREB)
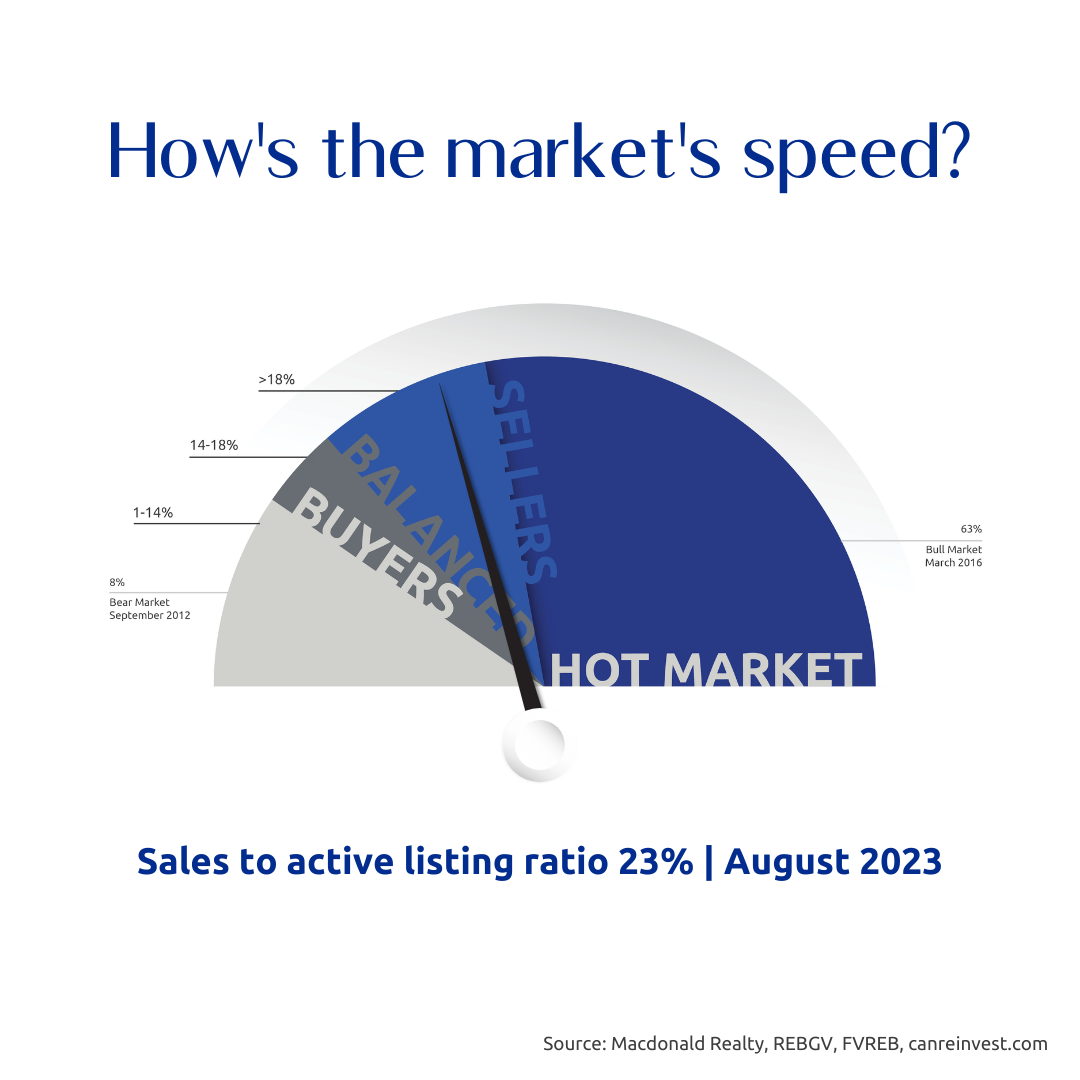
At only 4.3 Months of Inventory, Prices are expected to Rise.
The most reliable indicator of market prices is the Sales to Active Listings Ratio (SAL). This is the ratio between the number of sales in a given month and the number of active listings at month-end.
In hotter markets in BC, a long-term analysis has shown that prices will usually act in the following ways:
- 7+ Months of Inventory (Under 14% SAL): Prices will likely DECLINE
- 5 – 7 Months of Inventory (14% – 18% SAL): Prices will likely be STABLE
- Less than 5.5 Months of Inventory (Over 18% SAL): Prices will likely RISE
Visit this link to learn more about house prices and inventory.
Sales
Sales in July 2023 (3,823) were 25% higher than July 2022 (2,880), and were close to the 10-year average (5,071).
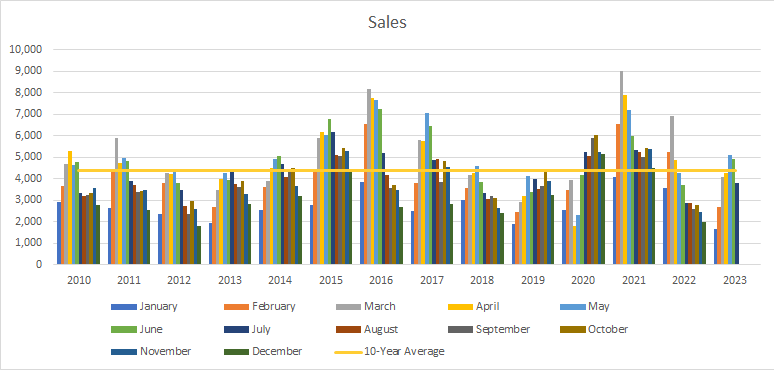
Cumulative Year-to-date Sales
2023 is off to a slower start as sales (26,602) remain below the 10-year average (32,525).

Inventory
July inventory (16,500 active listings) increased only slightly from the previous month, and are nearly 15% below the 10-year average (19,400 average).
Sales to Active Listings
Low sales but lower inventory kept the Sales to Active Listing Ratio above 23%, indicating rising prices.
Months of Inventory
Similarly, Months of Inventory rose only slightly to 4.3 MOI, indicating a continued seller’s market and continued upward pressure on prices.
Want to learn more about these stats or discuss your move to Macdonald Realty?
Check out careersinbcrealestate.com to connect today!