by Macrealty Marketing Team | Nov 3, 2020 | Market Updates
Here are the latest real estate market statistics from Macdonald Realty on Greater Victoria, Parksville/Qualicum, and Nanaimo listings and sales in October 2020.
Find all the infographics related to the February Market Statistics by visiting the Facebook Album.
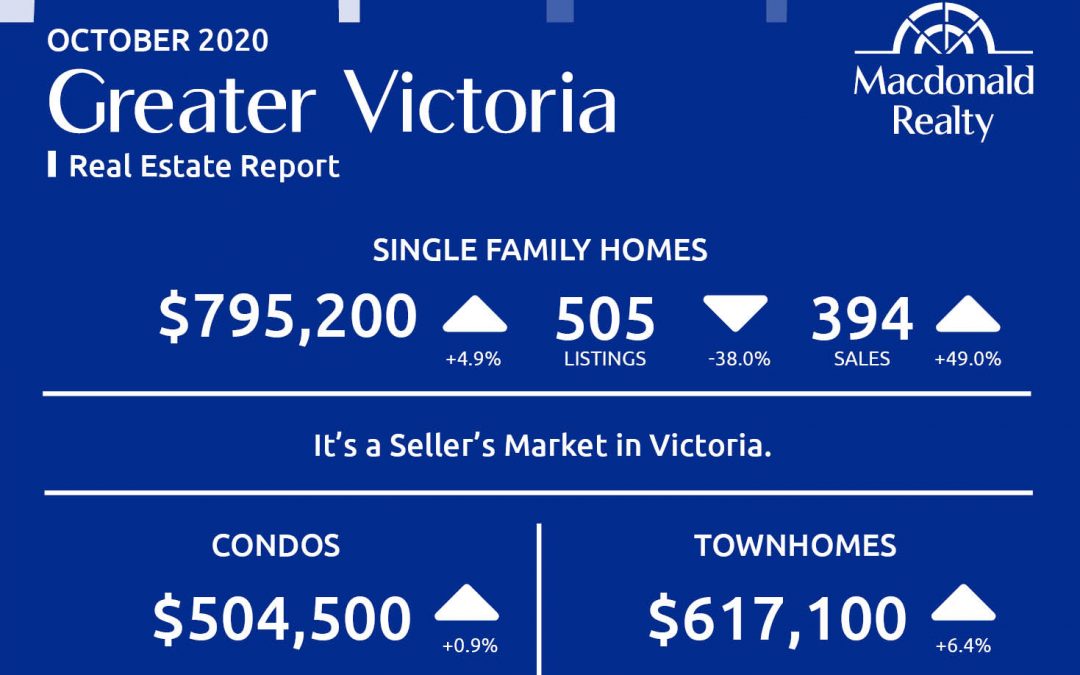
Greater Victoria
According to the Victoria Real Estate Board “A total of 990 properties sold in the Victoria Real Estate Board region this October, 59.9% more than the 619 properties sold in October 2019 and 0.1% more than the previous month of September 2020. Sales of condominiums were up 70.8% from October 2019 with 304 units sold. Sales of single-family homes were up 53.1% from October 2019 with 487 sold.”
“Once again, another month concluded with numbers that surprised many of us,” said Victoria Real Estate Board President Sandi-Jo Ayers. “Sales for October broke the record for the month and inventory continues to be snapped up quickly. Due to this high demand, low supply environment, we are seeing many multiple offer situations. Condos and single family homes both continue to be popular choices for buyers.”

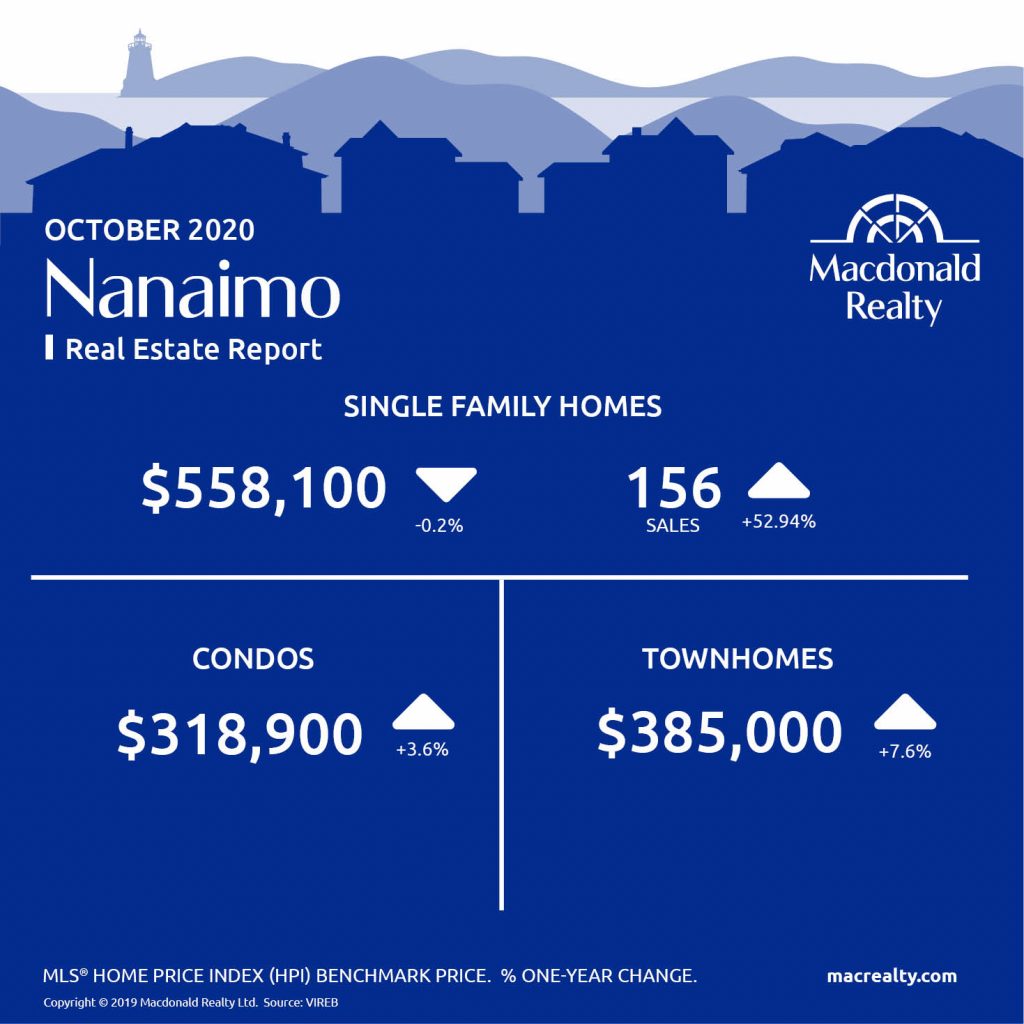
Nanaimo
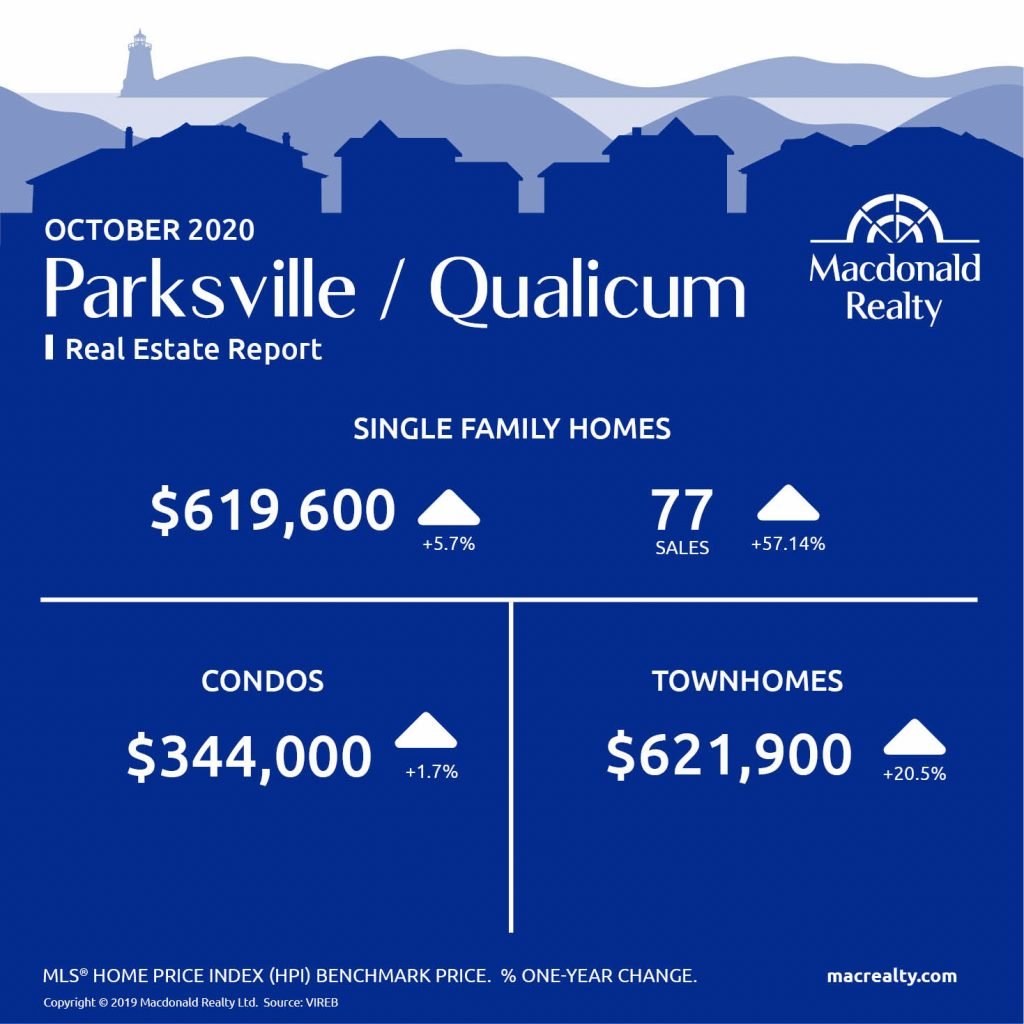
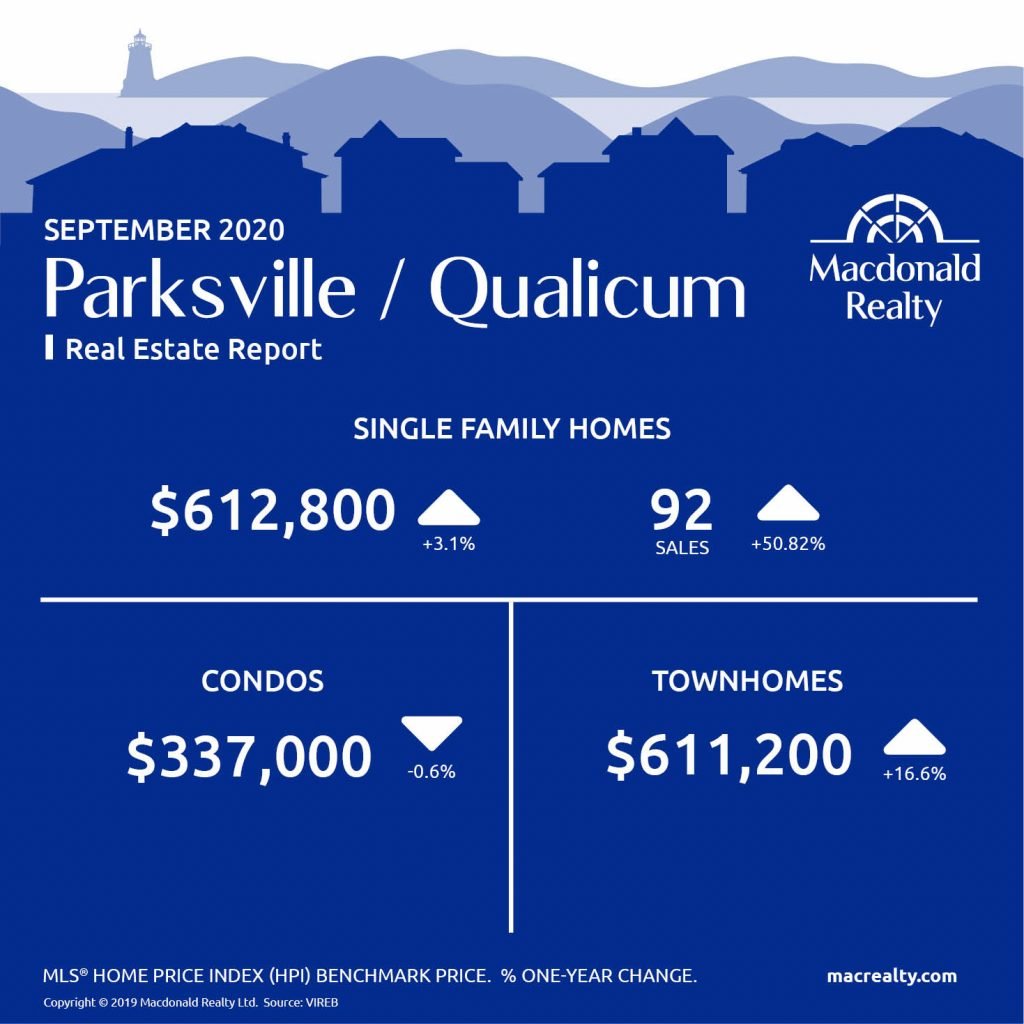
Parksville / Qualicum
Looking for more information about the real estate market in specific neighbourhoods in Victoria, Parksville, Nanaimo, Vancouver Island and the Gulf Islands?
Macdonald Realty has offices in downtown Victoria, Sidney, Parksville and on Salt Spring Island. Please email [email protected] or call 1-877-278-3888 to be matched with a REALTOR® working in your area.
MLS® Home Price Index (HPI) Benchmark Price
Average and median home prices are often misinterpreted, are affected by change in the mix of homes sold, and can swing dramatically from month to month (based on the types and prices of properties that sold in a given month). The MLS® HPI overcomes these shortcomings and uses the concept of a benchmark home, a notional home with common attributes of typical homes in a defined area. Visit www.housepriceindex.ca for more information.
This blog post is based on market data provided by the Victoria Real Estate Board (VREB) www.vreb.org and the Vancouver Island Real Estate Board (VIREB) www.vireb.com. Market data from the VIREB includes listings and sales in Campbell River, Comox Valley, Cowichan Valley Nanaimo, Parksville/Qualicum, Port Alberni/West, North Island, and the Islands.
by Macrealty Marketing Team | Oct 7, 2020 | Market Updates
Here are the latest real estate market statistics from Macdonald Realty on the Greater Vancouver listings and sales in September 2020.
Find all the infographics by visiting the Facebook Album.
According to the Real Estate Board of Greater Vancouver, home sale and new listing activity reached record levels in Metro Vancouver in September.
“We’ve seen robust home sale and listing activity across Metro Vancouver throughout the summer months,” Colette Gerber, REBGV Chair said. “This increased activity can be attributed, in part, to lower interest rates and changing housing needs during the COVID-19 pandemic.”
Colette also has talked about the pressure on home prices:
“While the pace of new MLS® listings entering the market is increasing, the heightened demand from home buyers is keeping overall supply levels down,” Gerber said. “This is creating upward pressure on home prices, which have been edging up since the spring.”
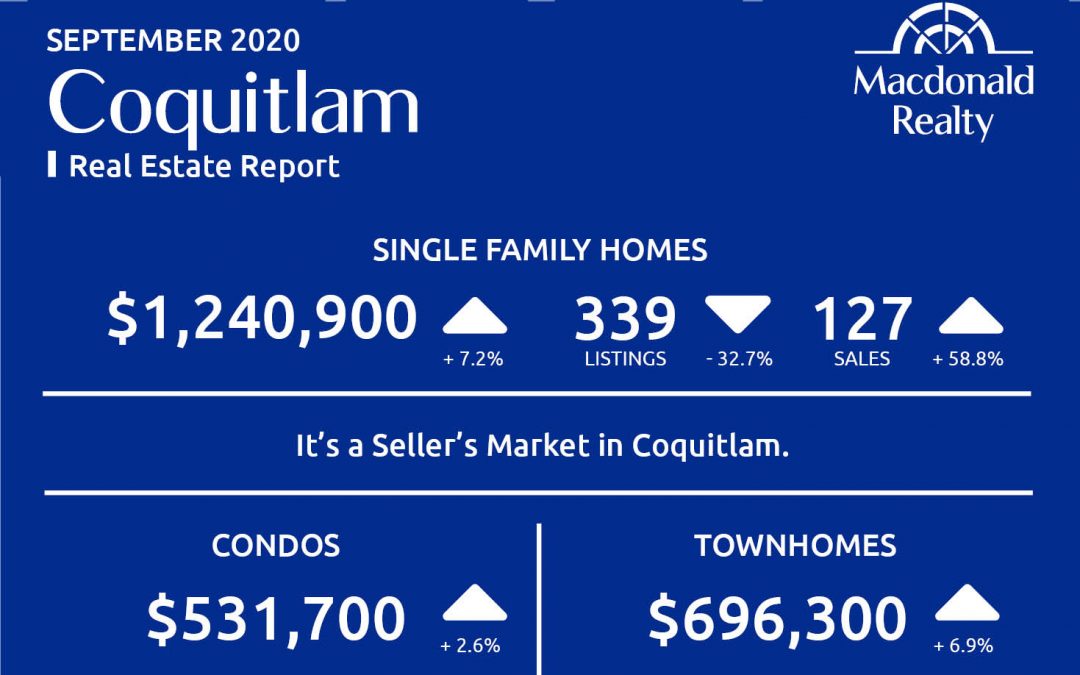
Coquitlam
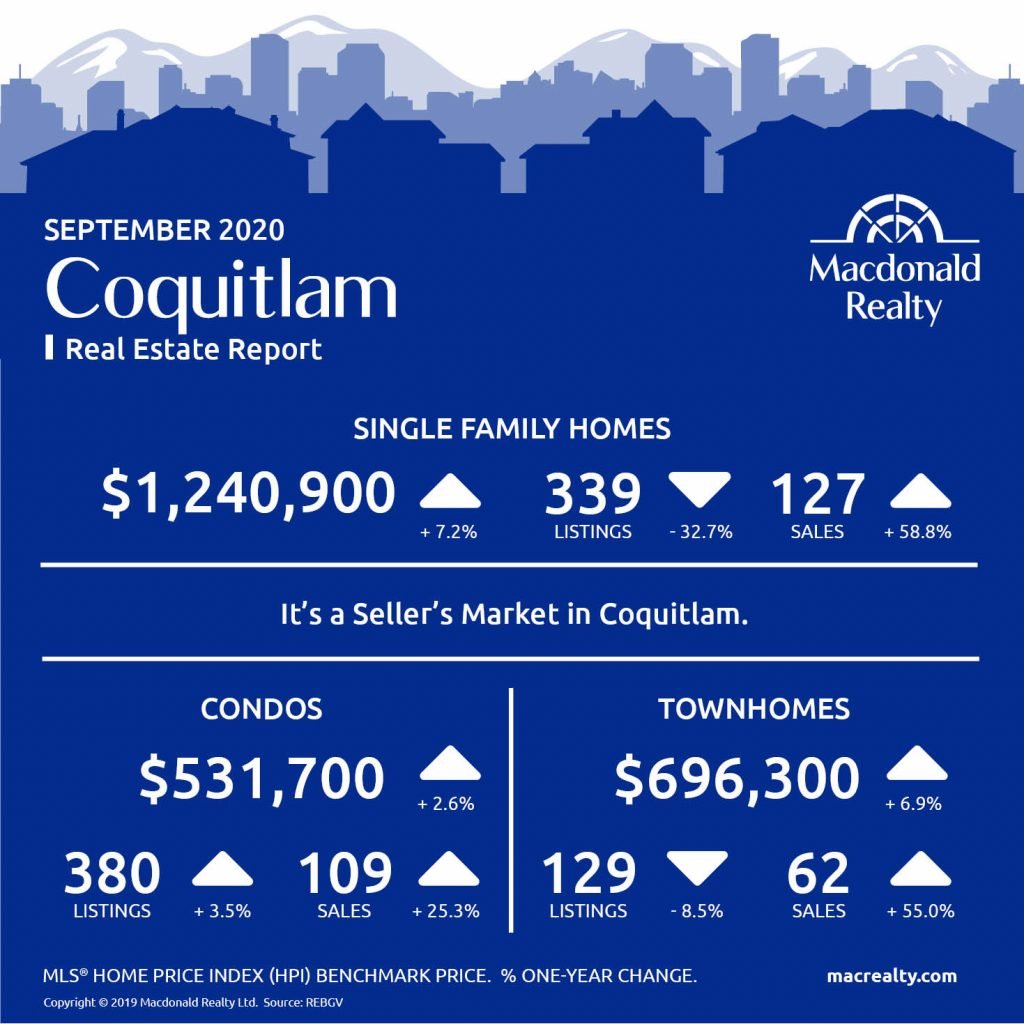
In September 2020, there were 127 sales of detached homes and 339 active listings in Coquitlam, BC. The benchmark sale price was $1,240,900.
The condo market had 109 sales and 380 active listings at the end of the month. The benchmark sale price was $531,700.
The townhome market had 62 sales and, the active listings were 129. The benchmark sale price was $696,300.
It’s a Seller’s Market in Coquitlam.
Port Coquitlam
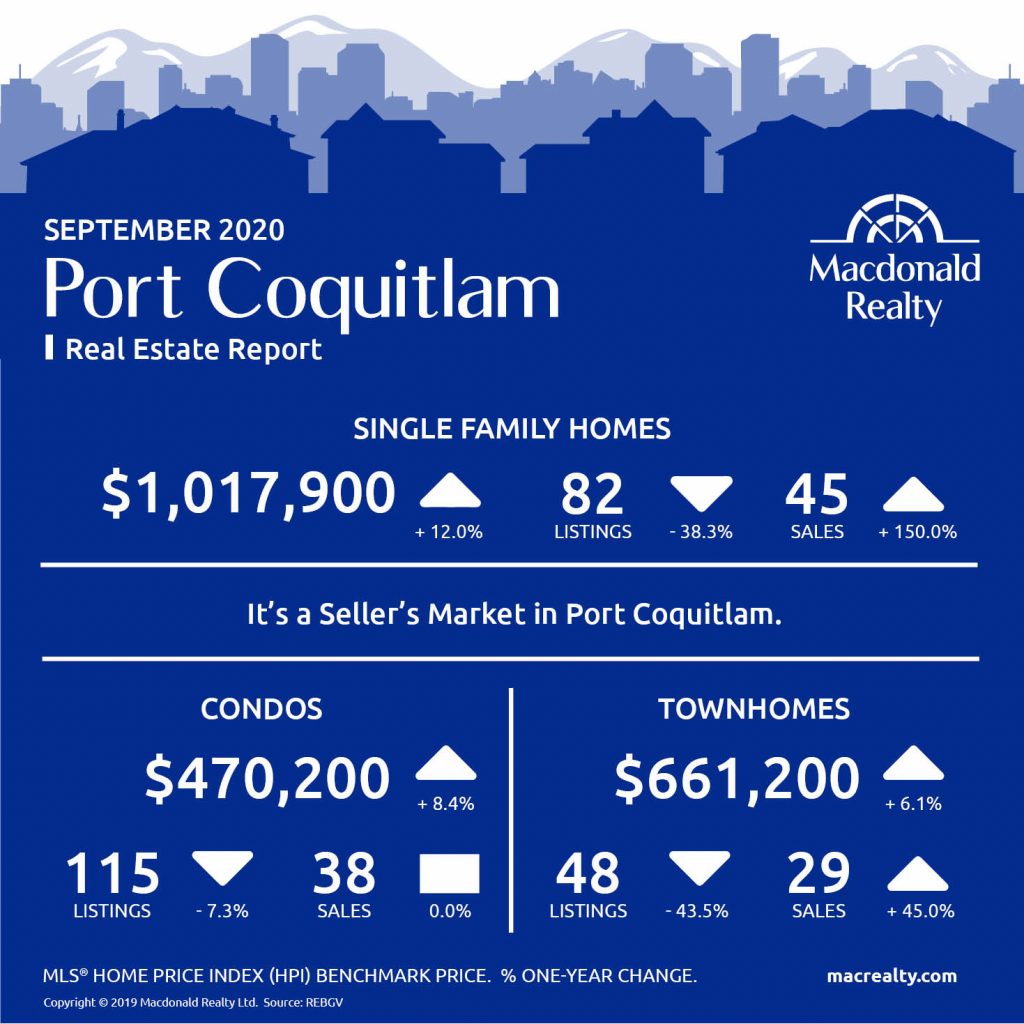
In September 2020, there were 45 sales of detached homes and 82 active listings in Port Coquitlam, BC. The benchmark sale price was $1,017,900.
The condo market had 38 sales and 115 active listings at the end of the month. The benchmark sale price was $470,200.
The townhome market had 29 sales and, the active listings were 48. The benchmark sale price was $661,200.
It’s a Seller’s Market in Port Coquitlam.
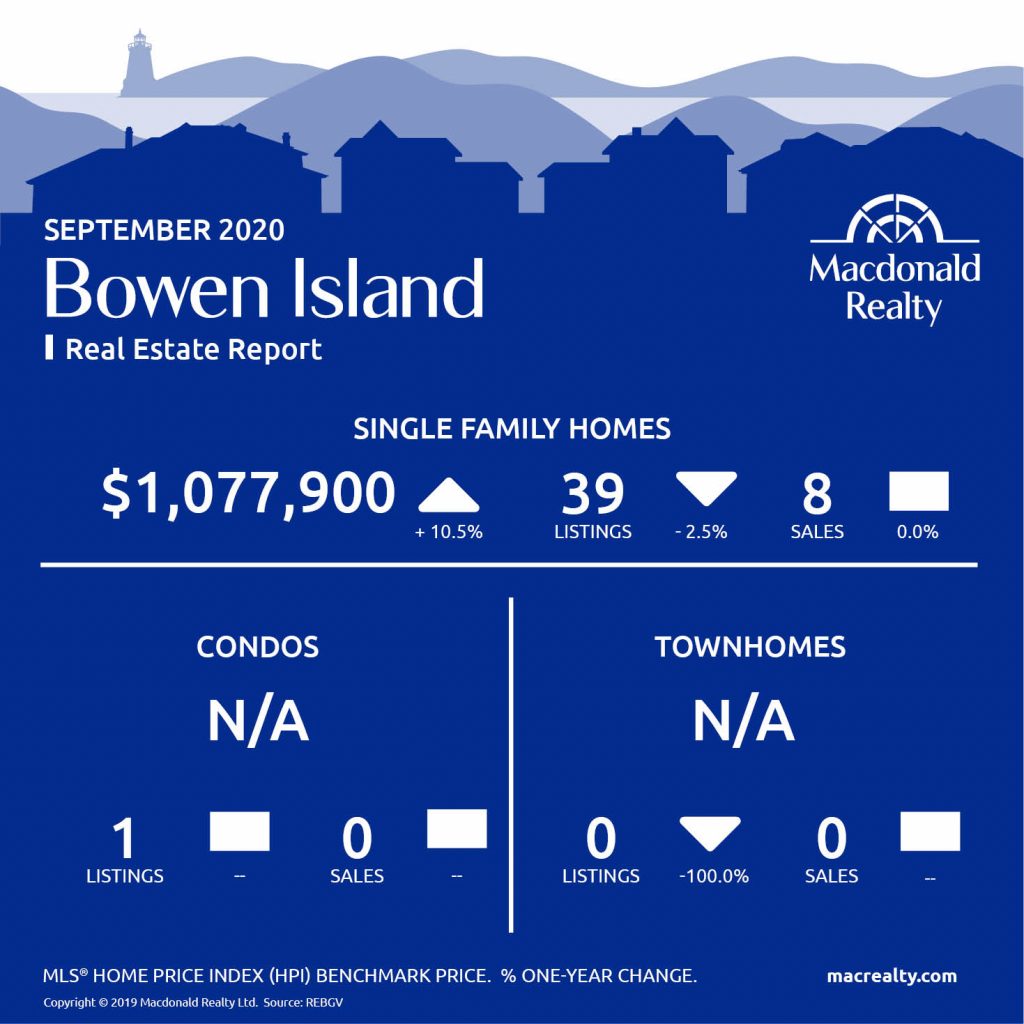
Bowen Island
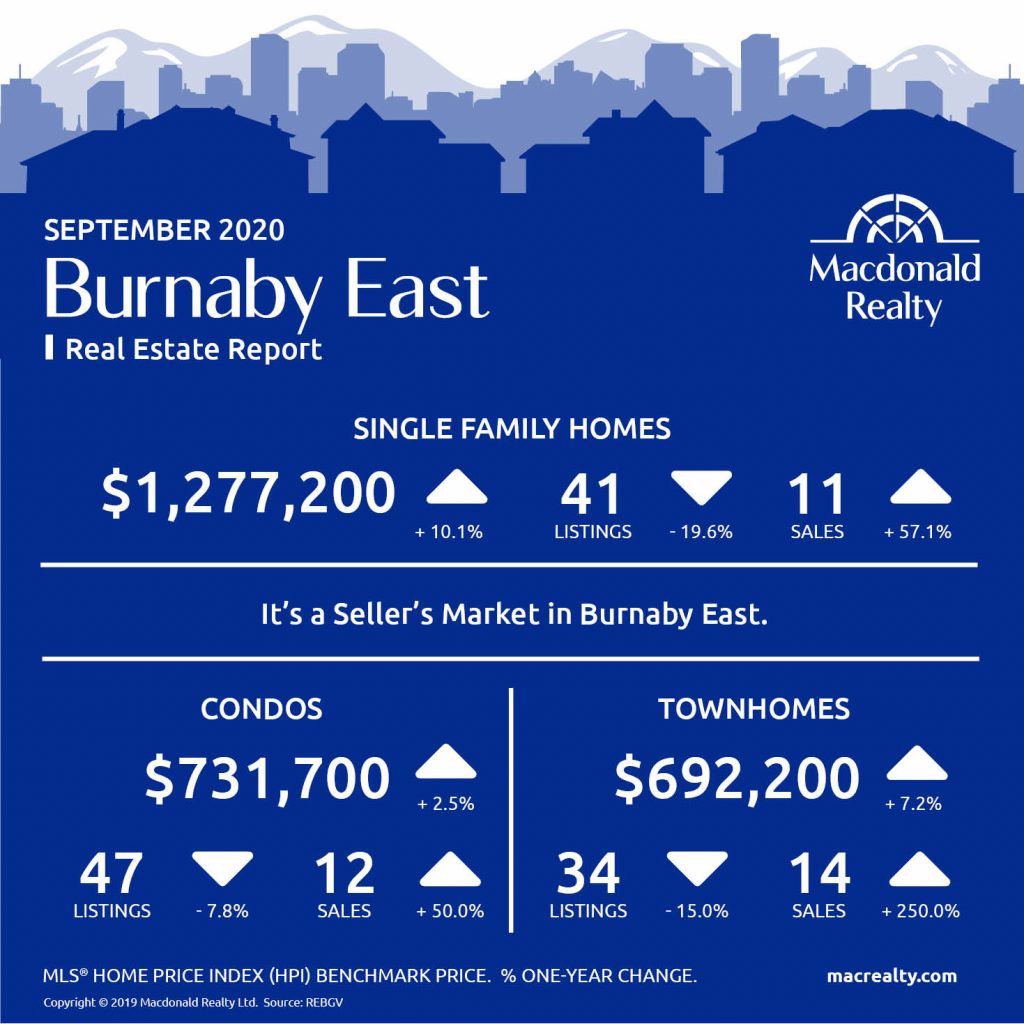
Burnaby East
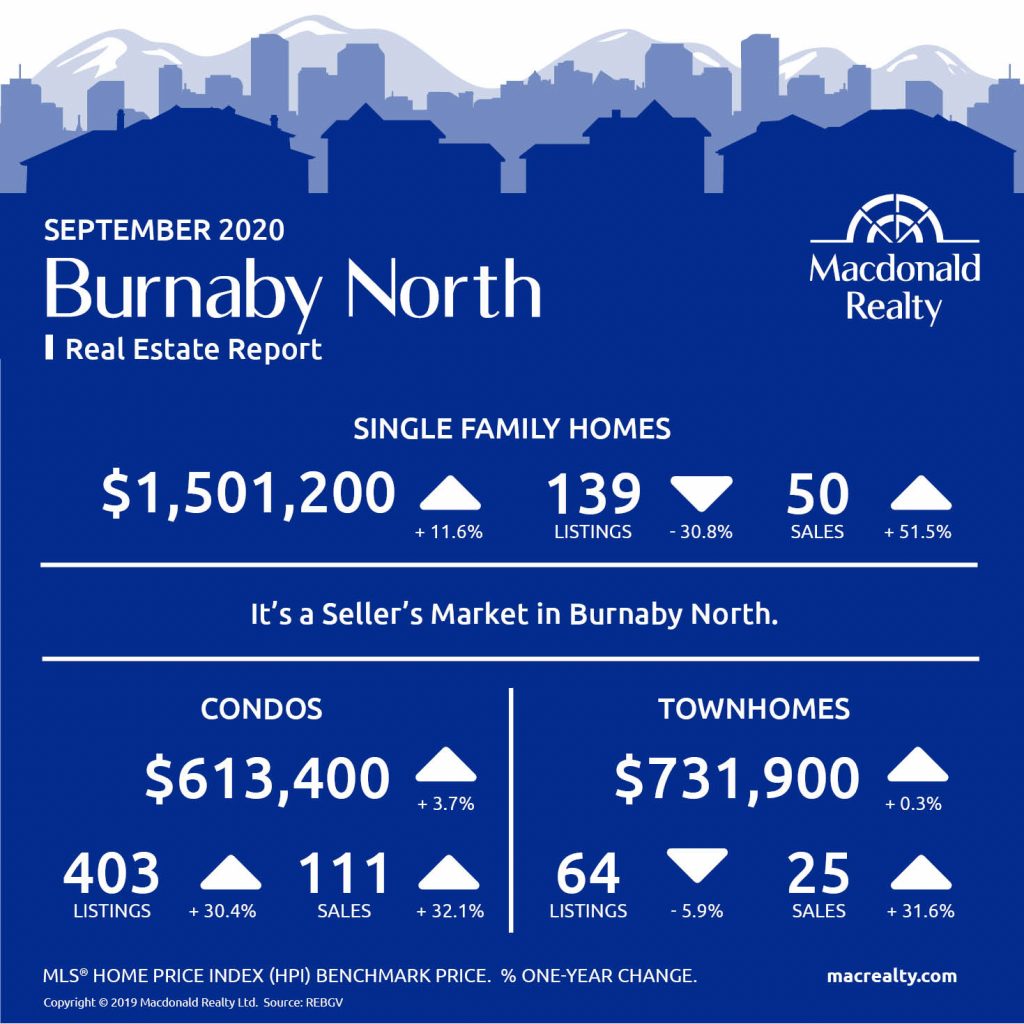
Burnaby North
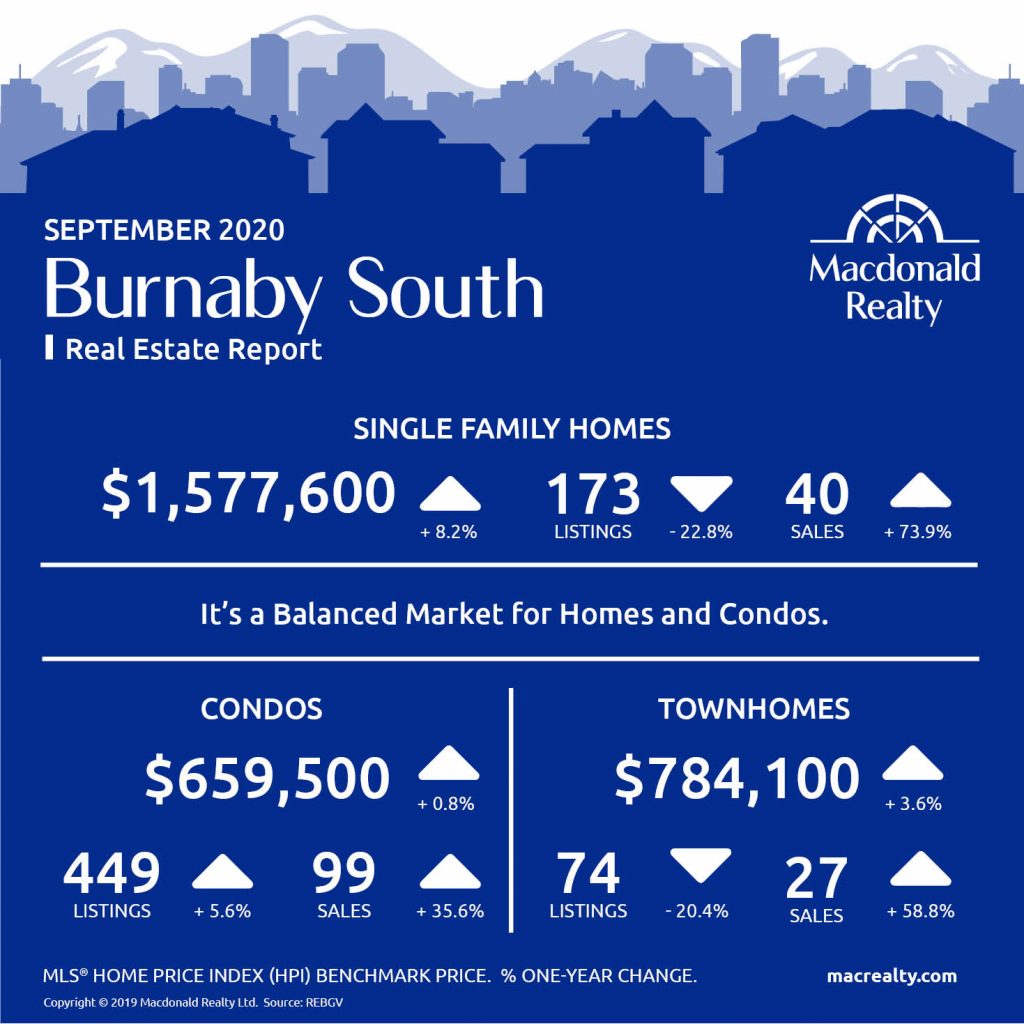
Burnaby South
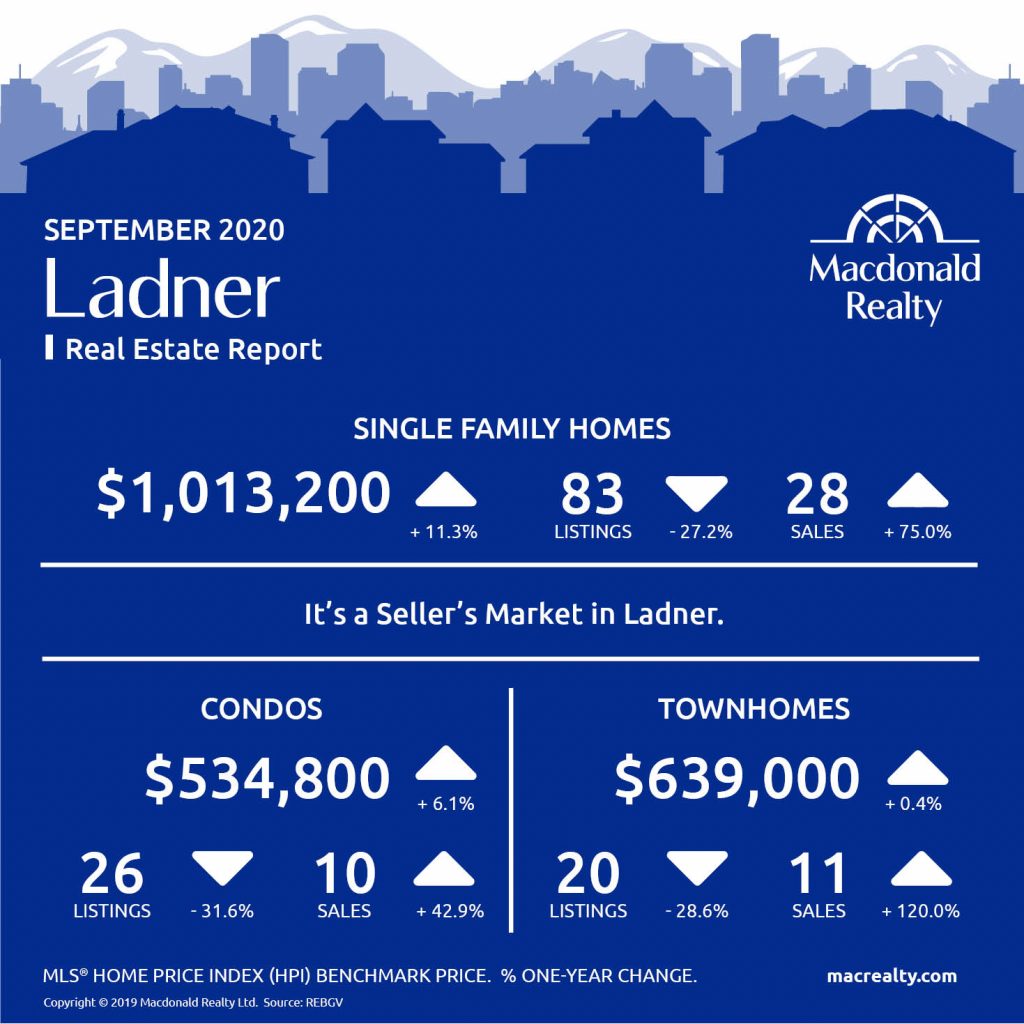
Ladner
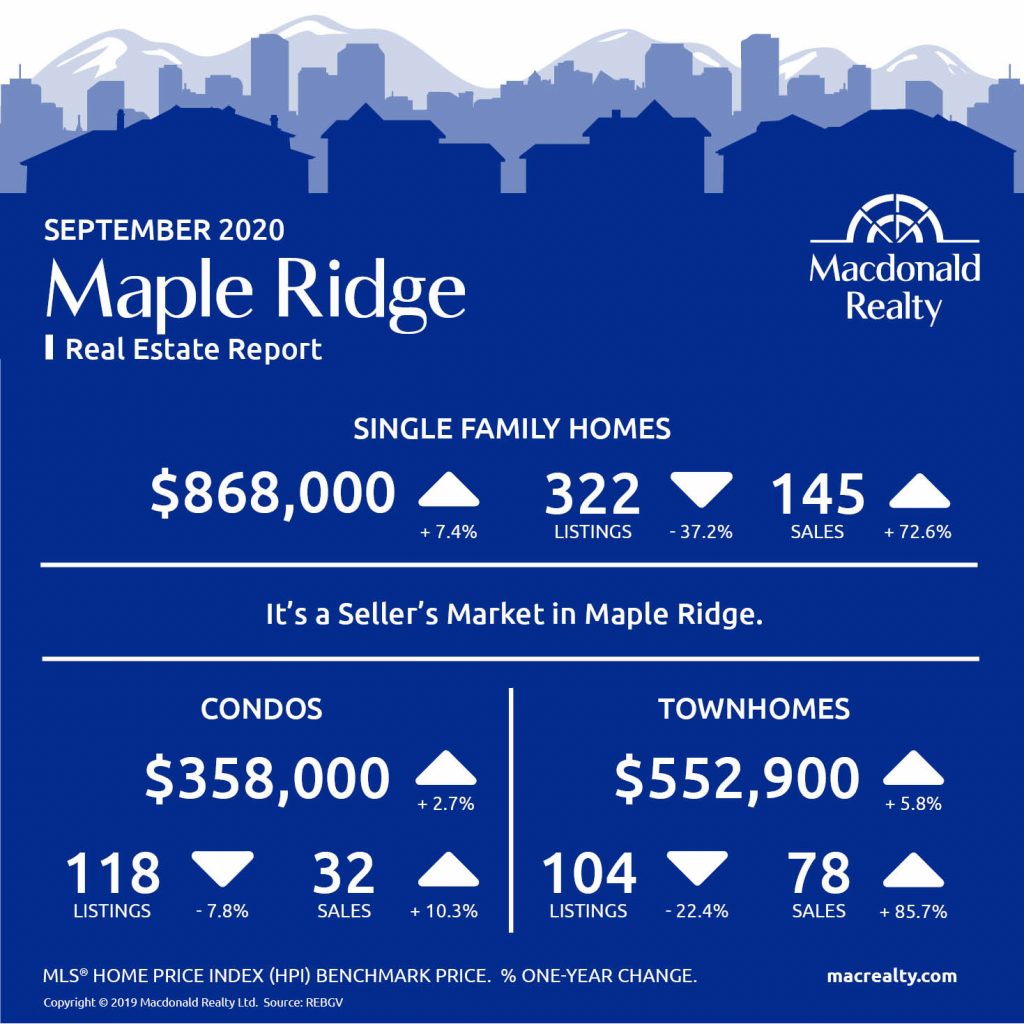
Maple Ridge
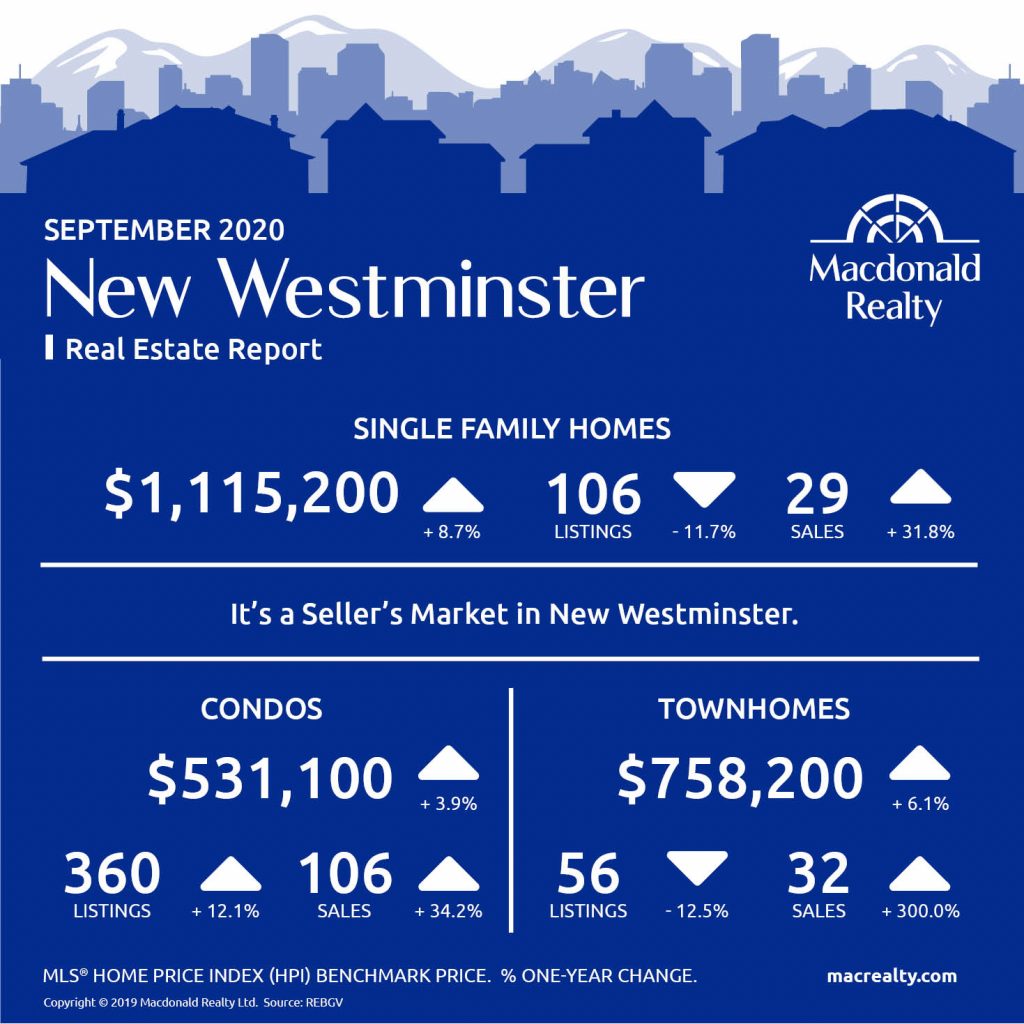
New Westminster
North Vancouver

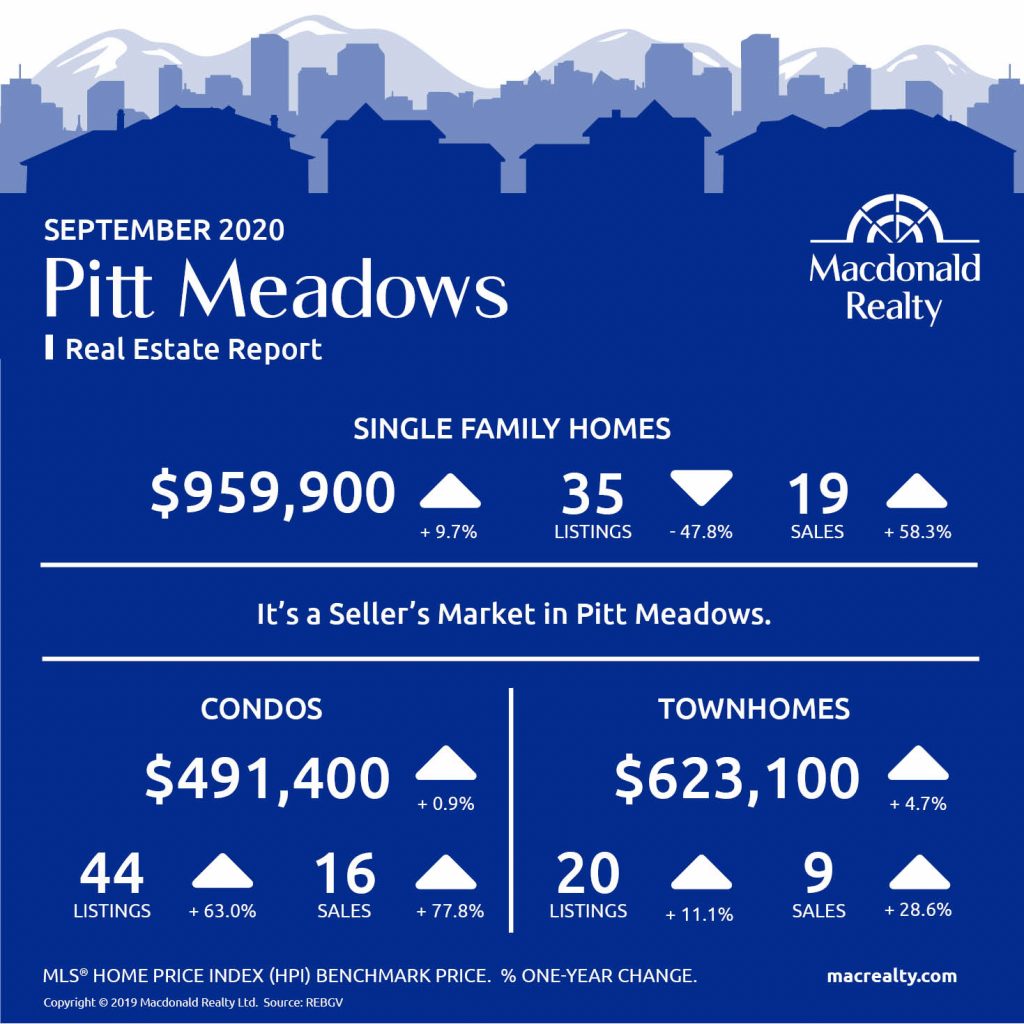
Pitt Meadows
Port Moody

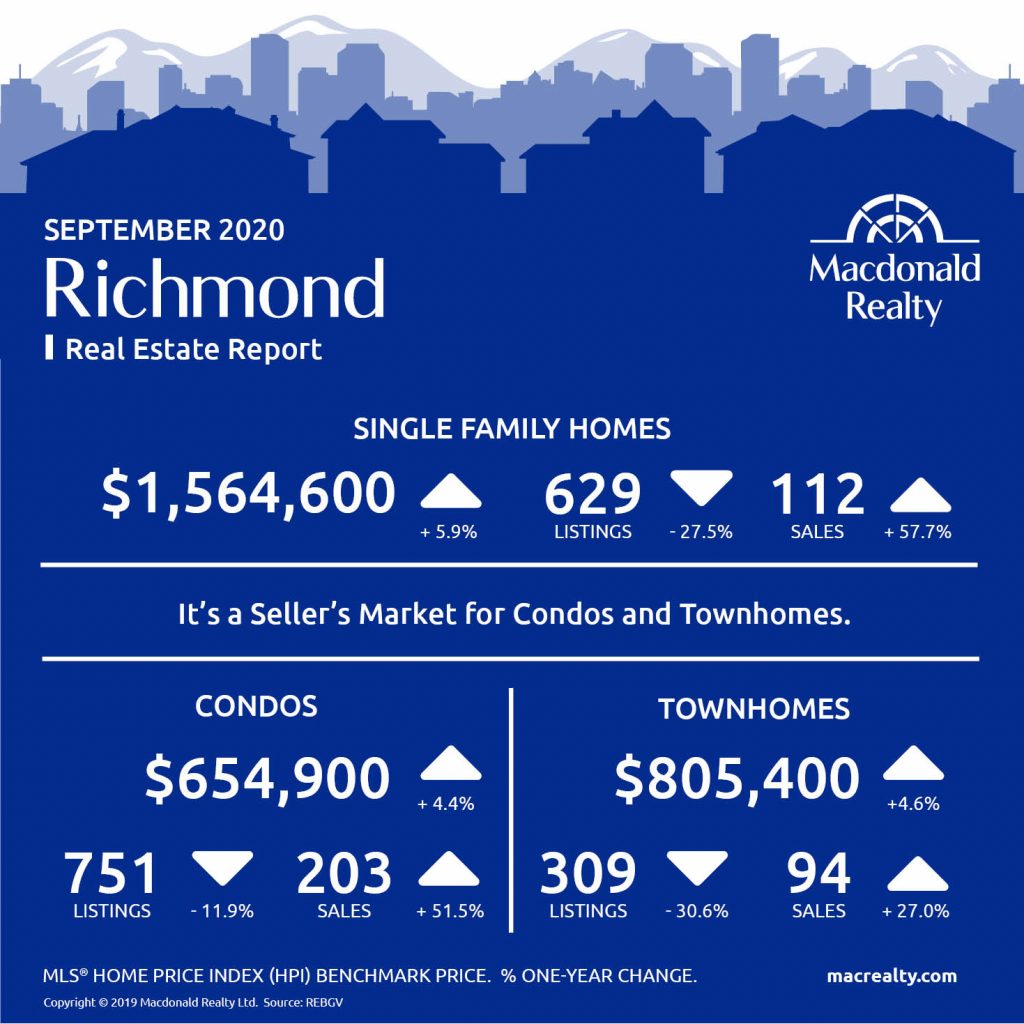
Richmond
Tsawwassen

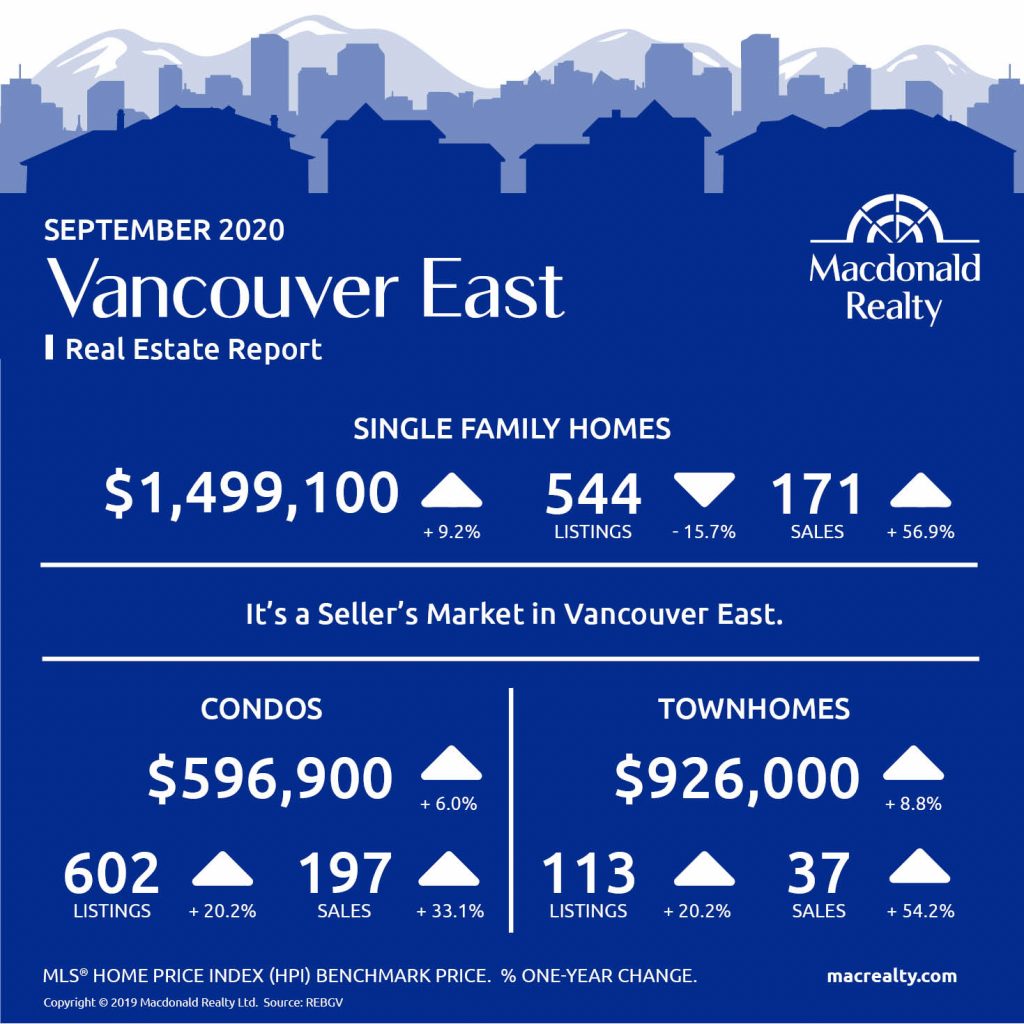
Vancouver East
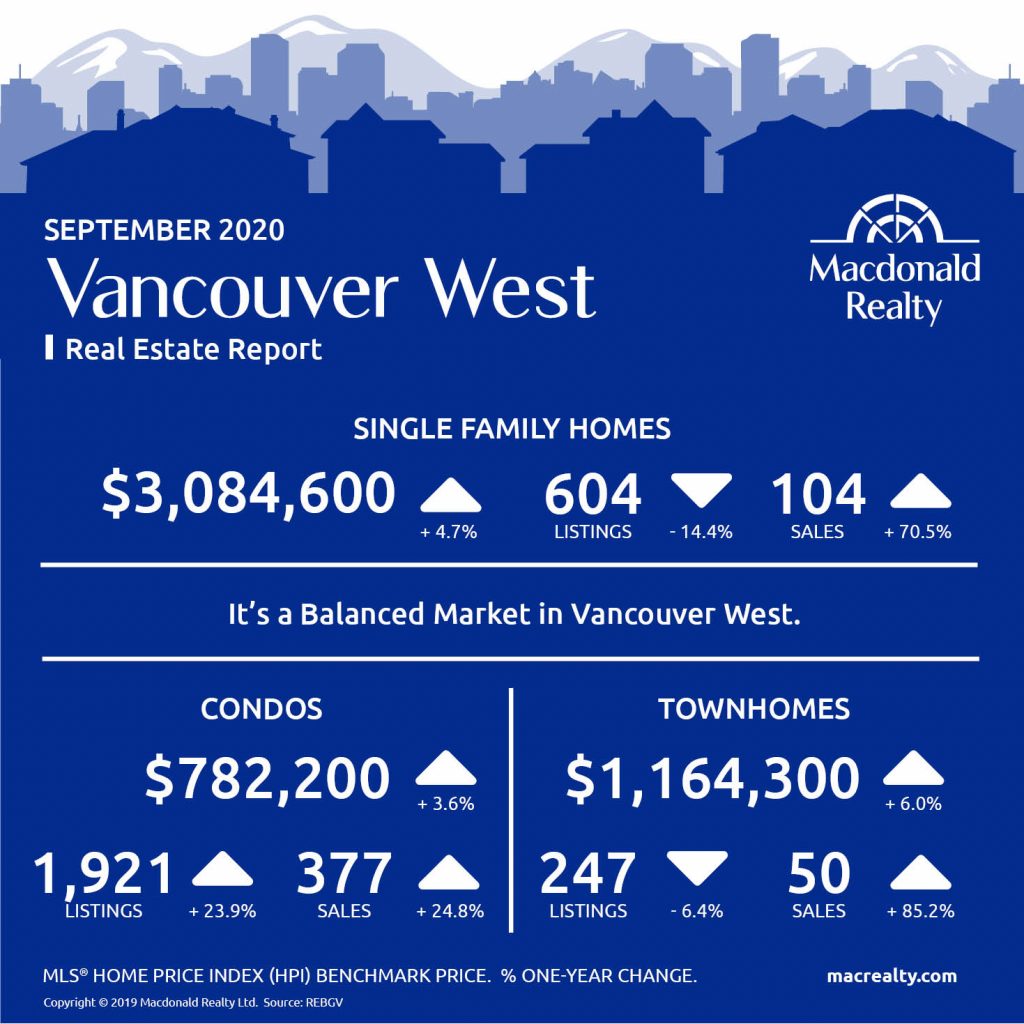
Vancouver West
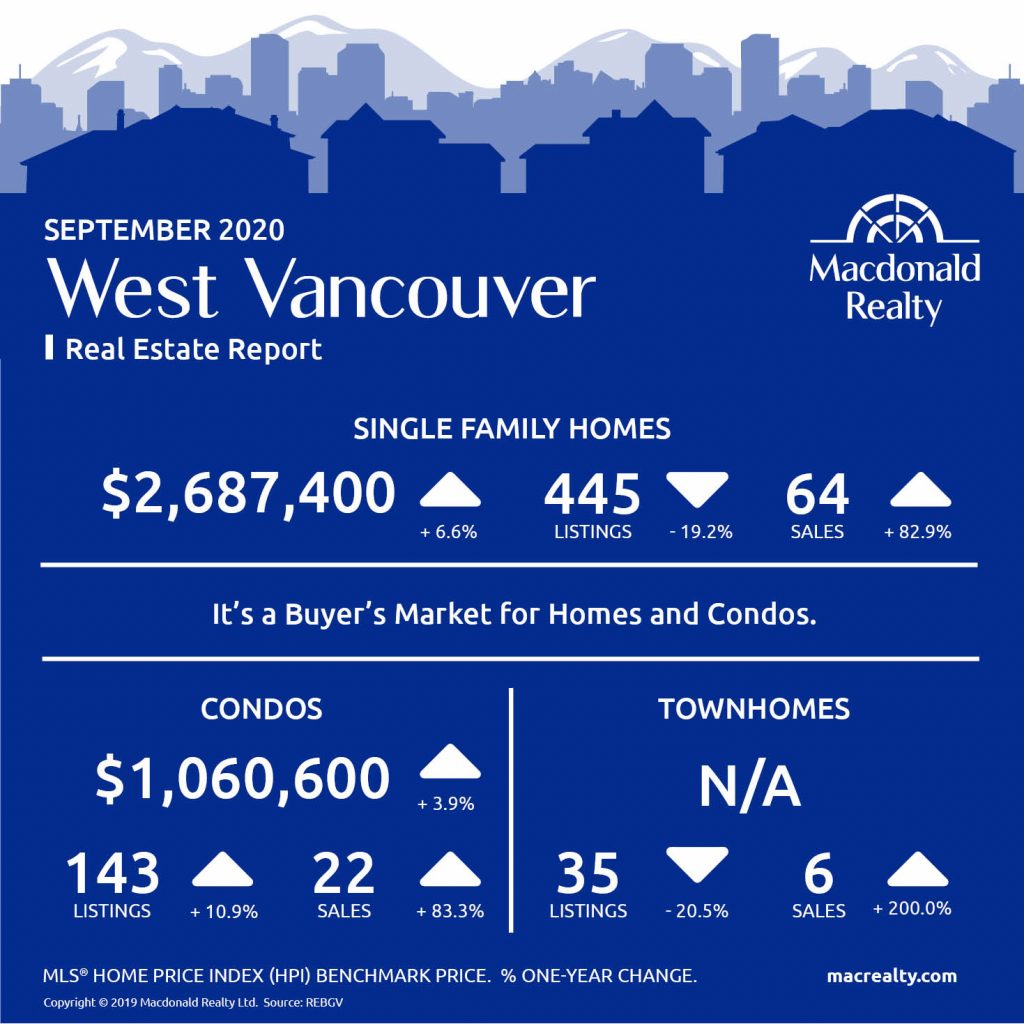
West Vancouver
Looking for more information about the real estate market in specific neighbourhoods in the Greater Vancouver?
Macdonald Realty has offices across the Greater Vancouver. Please email [email protected] or call 1-877-278-3888 to be matched with a REALTOR® working in your area.
MLS® Home Price Index (HPI) Benchmark Price
Average and median home prices are often misinterpreted, are affected by change in the mix of homes sold, and can swing dramatically from month to month (based on the types and prices of properties that sold in a given month). The MLS® HPI overcomes these shortcomings and uses the concept of a benchmark home, a notional home with common attributes of typical homes in a defined area. Visit www.housepriceindex.ca for more information.
This blog post is based on market data provided by the Real Estate Board of Greater Vancouver (REBGV) www.rebgv.org
by Macrealty Marketing Team | Oct 7, 2020 | Market Updates
Here are the latest real estate market statistics from Macdonald Realty on Squamish, Whistler, and Sunshine Coast listings and sales in September 2020.
Find all the infographics related to the May Market Statistics by visiting the Facebook Album.
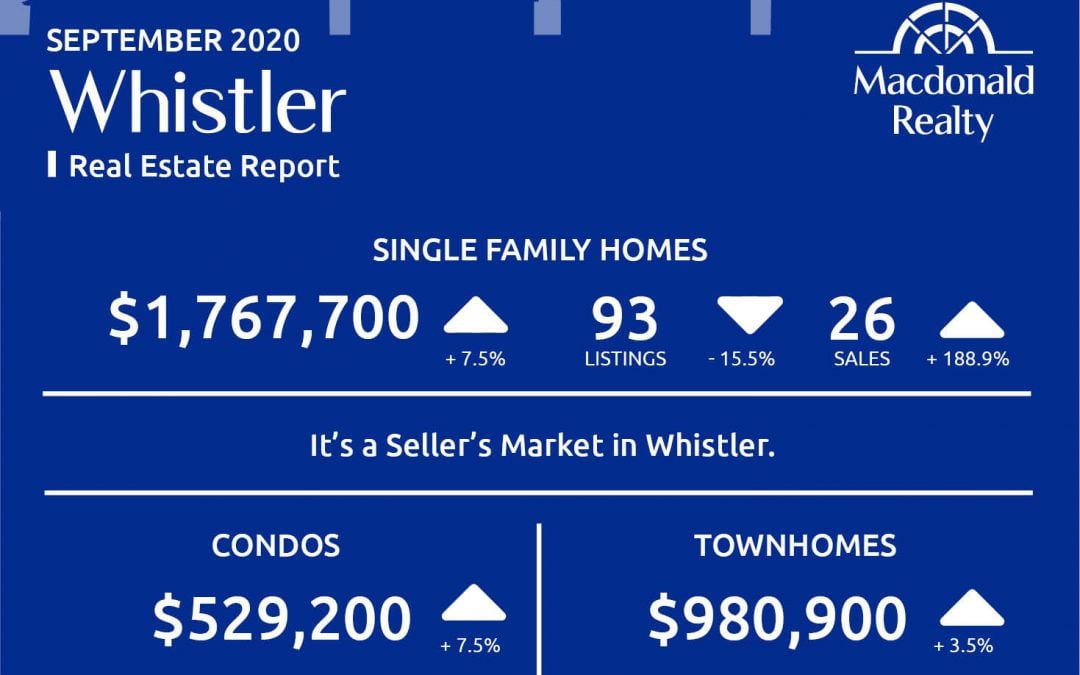
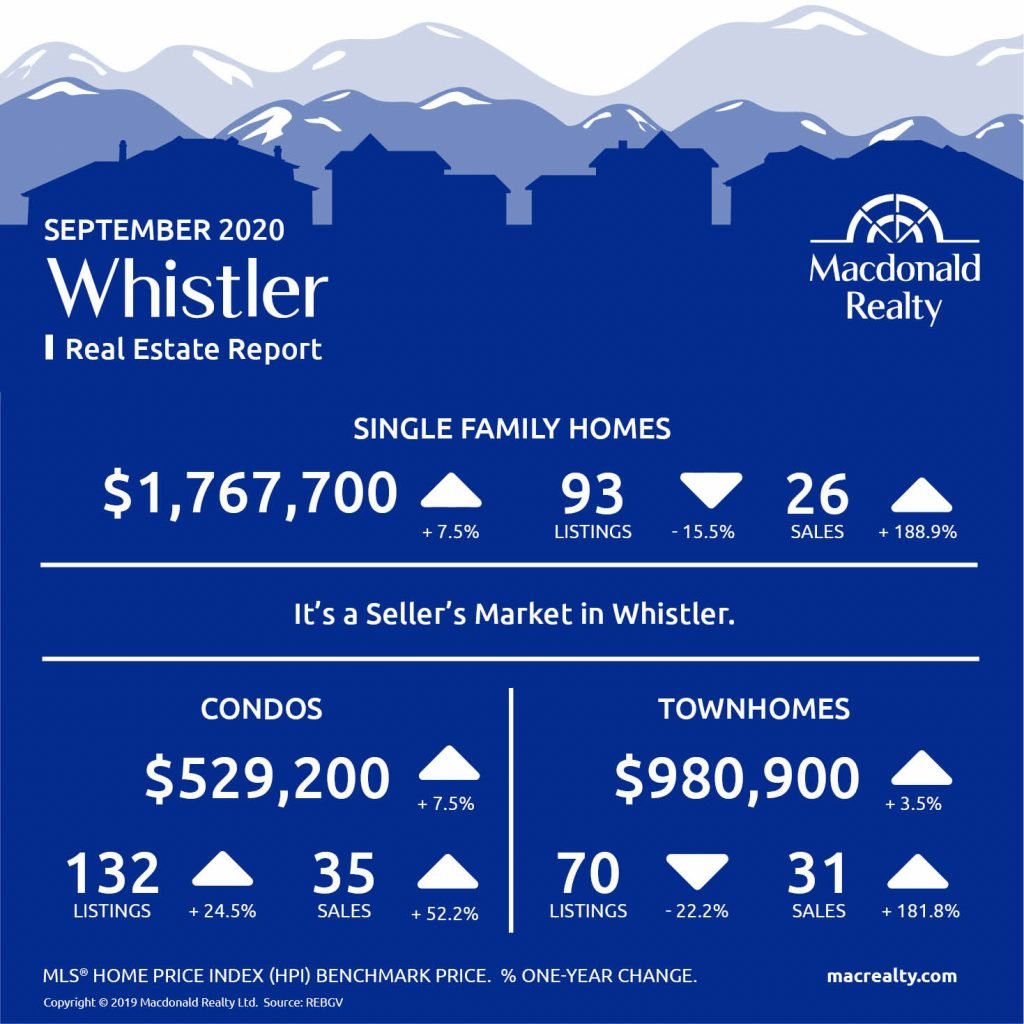
Whistler
In September 2020, there were 26 sales of detached homes and 93 active listings in Whistler. The benchmark sale price was $1,767,700.
The condo market had 35 sales and 132 active listings at the end of the month. The benchmark sale price was $529,200.
The townhome market had 31 sales and, the active listings were 70. The benchmark sale price was $980,900.
It’s a Seller’s market in Whistler.
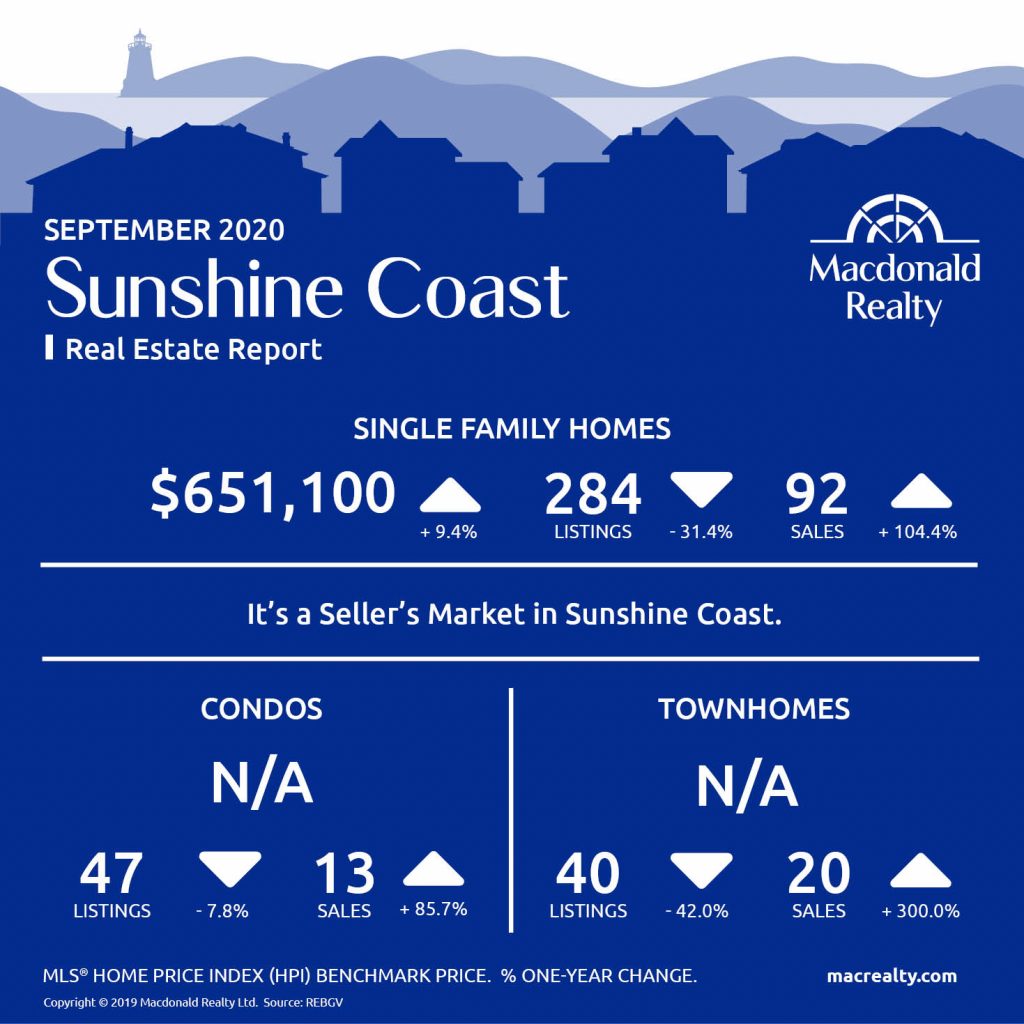
Sunshine Coast
In September 2020, there were 92 sales of detached homes and 284 active listings in Whistler. The benchmark sale price was $651,100.
The condo market had 13 sales and 47 active listings at the end of the month.
The townhome market had 20 sales and, the active listings were 40.
It’s a Seller’s market in Sunshine Coast.
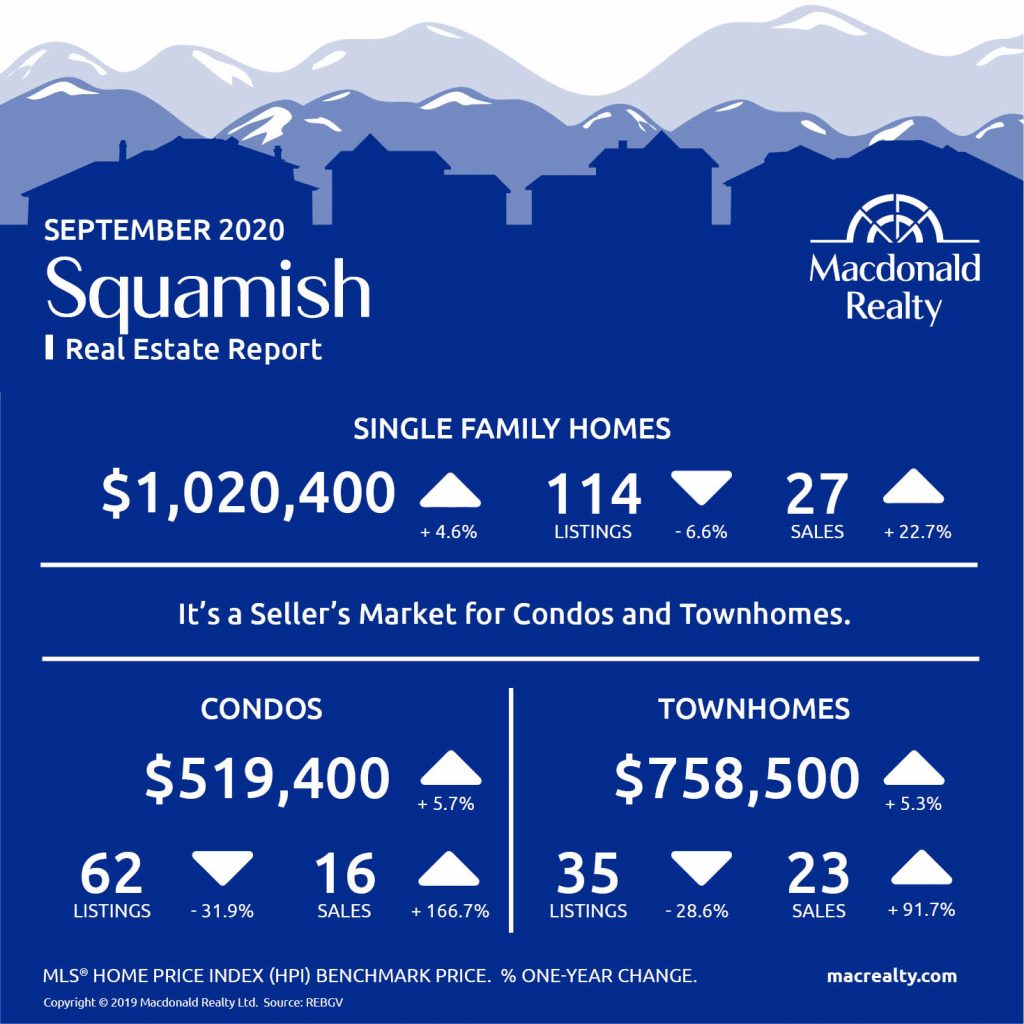
Squamish
In September 2020, there were 27 sales of detached homes and 114 active listings in Whistler. The benchmark sale price was $1,020,400.
The condo market had 16 sales and 62 active listings at the end of the month.
The townhome market had 23 sales and, the active listings were 35.
It’s a Seller’s market for Condos and Townhomes in Squamish.
Looking for more information about the real estate market in specific neighbourhoods in Squamish, Whistler, and Sunshine Coast? Macdonald Realty has offices in Squamish, Whistler, and Sunshine Coast. Please email [email protected] or call 1-877-278-3888 to be matched with a REALTOR® working in your area.
MLS® Home Price Index (HPI) Benchmark Price
Average and median home prices are often misinterpreted, are affected by change in the mix of homes sold, and can swing dramatically from month to month (based on the types and prices of properties that sold in a given month). The MLS® HPI overcomes these shortcomings and uses the concept of a benchmark home, a notional home with common attributes of typical homes in a defined area. Visit www.housepriceindex.ca for more information.
This blog post is based on market data provided by the Real Estate Board of Greater Vancouver (REBGV) www.rebgv.org

by Macrealty Marketing Team | Oct 5, 2020 | Market Updates
Here are the latest real estate market statistics from Macdonald Realty on Greater Victoria, Parksville/Qualicum, and Nanaimo listings and sales in September 2020.
Find all the infographics related to the February Market Statistics by visiting the Facebook Album.
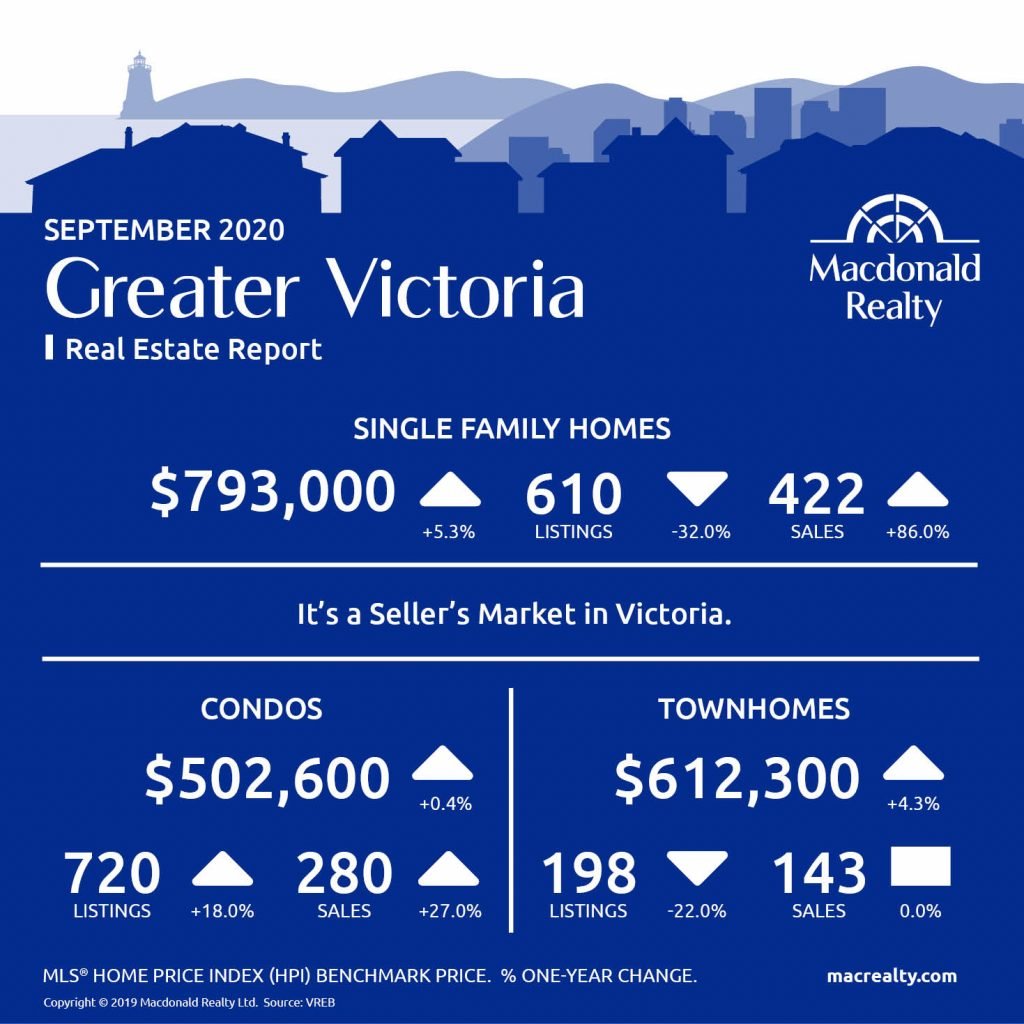
Greater Victori
According to the Victoria Real Estate Board “A total of 989 properties sold in the Victoria Real Estate Board region this September, 60.6% more than the 616 properties sold in September 2019 and 1% more than the previous month of August 2020. Sales of condominiums were up 26.7 percent from September 2019 with 280 units sold. Sales of single-family homes were 91.9% rom September 2019 with 539 sold.
“Another month has passed where we have seen surprisingly high sales numbers – which included quite a few higher end properties,” says Victoria Real Estate Board President Sandi-Jo Ayers. “I don’t think that anyone who was trying to predict market outcomes in our area over the course of the pandemic expected that the pent up demand from dampened sales in April and May would result in this level of market activity. There’s no doubt that buyers are extremely motivated and this increased demand, coupled with limited inventory, fueled the September market.”
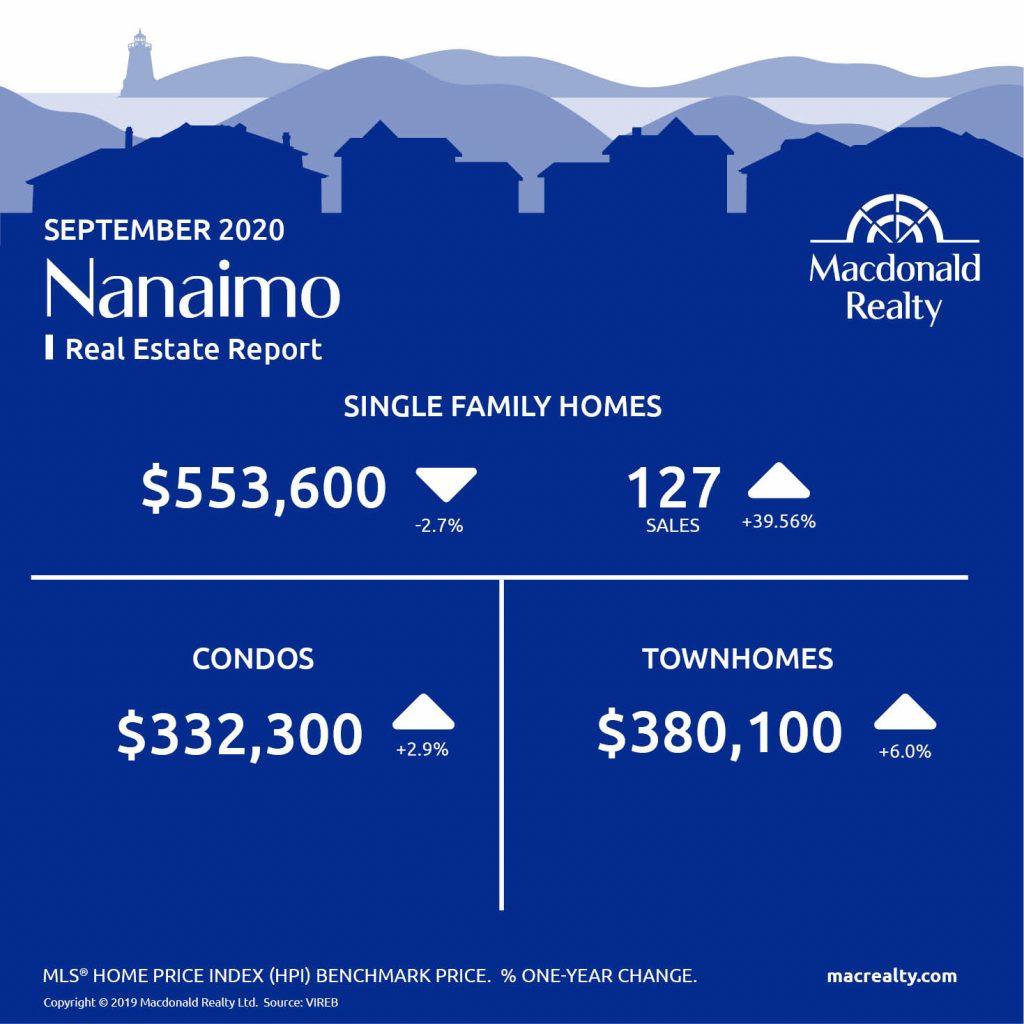
Nanaimo
Parksville / Qualicum
Looking for more information about the real estate market in specific neighbourhoods in Victoria, Parksville, Nanaimo, Vancouver Island and the Gulf Islands?
Macdonald Realty has offices in downtown Victoria, Sidney, Parksville and on Salt Spring Island. Please email [email protected] or call 1-877-278-3888 to be matched with a REALTOR® working in your area.
MLS® Home Price Index (HPI) Benchmark Price
Average and median home prices are often misinterpreted, are affected by change in the mix of homes sold, and can swing dramatically from month to month (based on the types and prices of properties that sold in a given month). The MLS® HPI overcomes these shortcomings and uses the concept of a benchmark home, a notional home with common attributes of typical homes in a defined area. Visit www.housepriceindex.ca for more information.
This blog post is based on market data provided by the Victoria Real Estate Board (VREB) www.vreb.org and the Vancouver Island Real Estate Board (VIREB) www.vireb.com. Market data from the VIREB includes listings and sales in Campbell River, Comox Valley, Cowichan Valley Nanaimo, Parksville/Qualicum, Port Alberni/West, North Island, and the Islands.
by Macrealty Marketing Team | Oct 5, 2020 | Market Updates
According to the Fraser Valley Real Estate Board the housing market activity reaches historic levels in September.
The Fraser Valley Real Estate Board processed 2,231 sales on its Multiple Listing Service® (MLS®) in September, an increase of 66.1% compared to the same month last year and an increase of 9.4%t compared to August
2020. This is the highest recorded sales for September in the history of FVREB.
Fraser Valley Real Estate Board reported that in the last three months, Fraser Valley has seen a defined shift in demand towards single-family detached homes with sales in July through to September garnering 47% of the three main residential types, compared to 43% during the same period last year.
Chris Shields, President of the Board, observes, “Our homes have never been more important. Across the Fraser Valley,
we’re seeing a trend towards buyers looking for more space and livability in both single‐family homes and townhomes.
“For many existing homeowners and first‐time buyers, their buying power is greater than it’s been in a long time.
Interest rates are very low, people have saved money over the last few months, and they’re choosing to invest it in their
most important asset. Sellers are also recognizing that with lower than normal inventory, this is a smart time to list.”
Find all the infographics related to the May Market Statistics by visiting the Facebook Album.
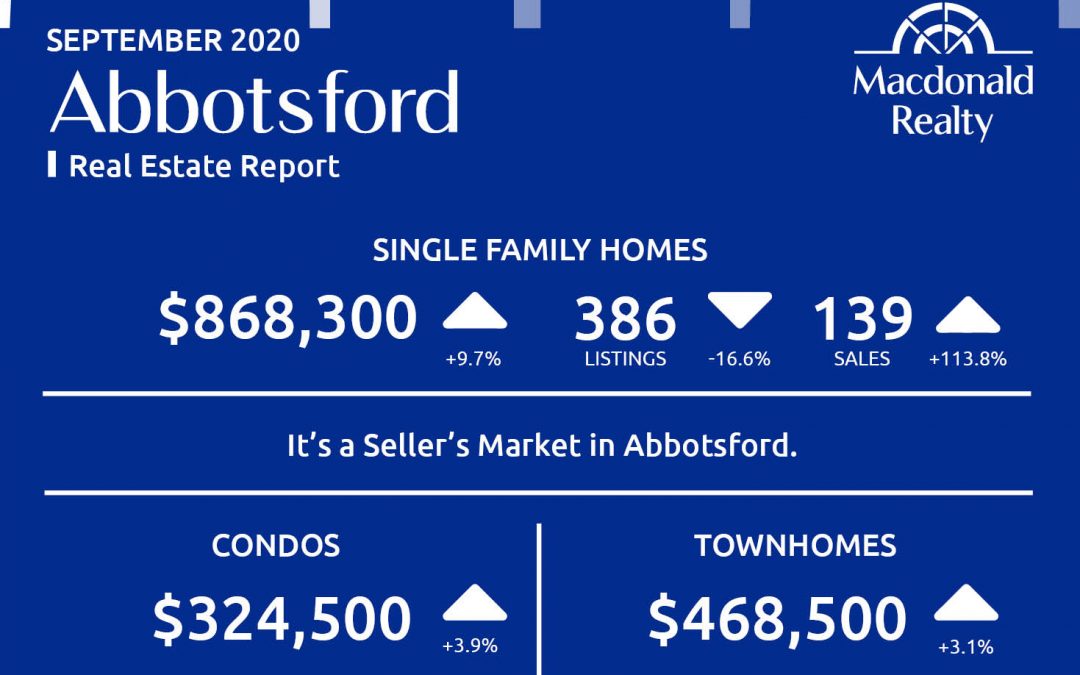
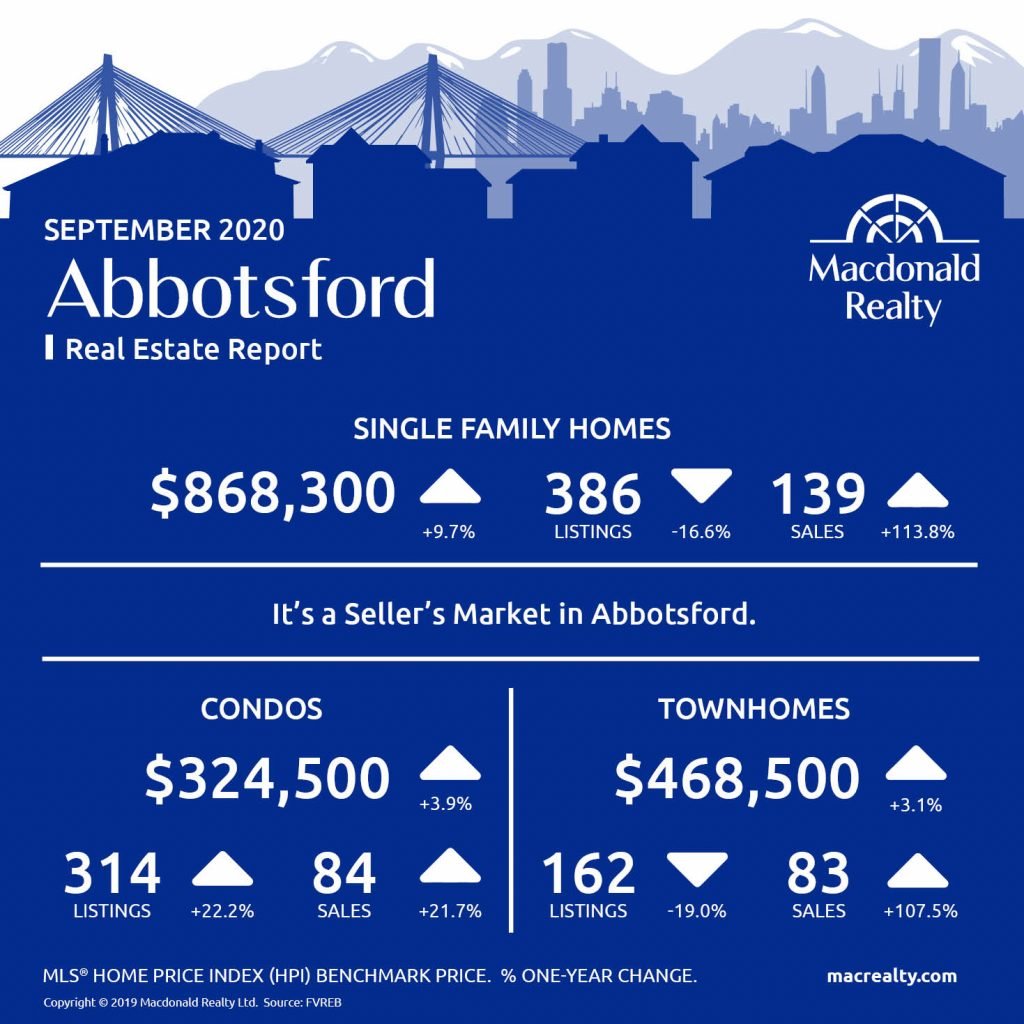
Abbotsford
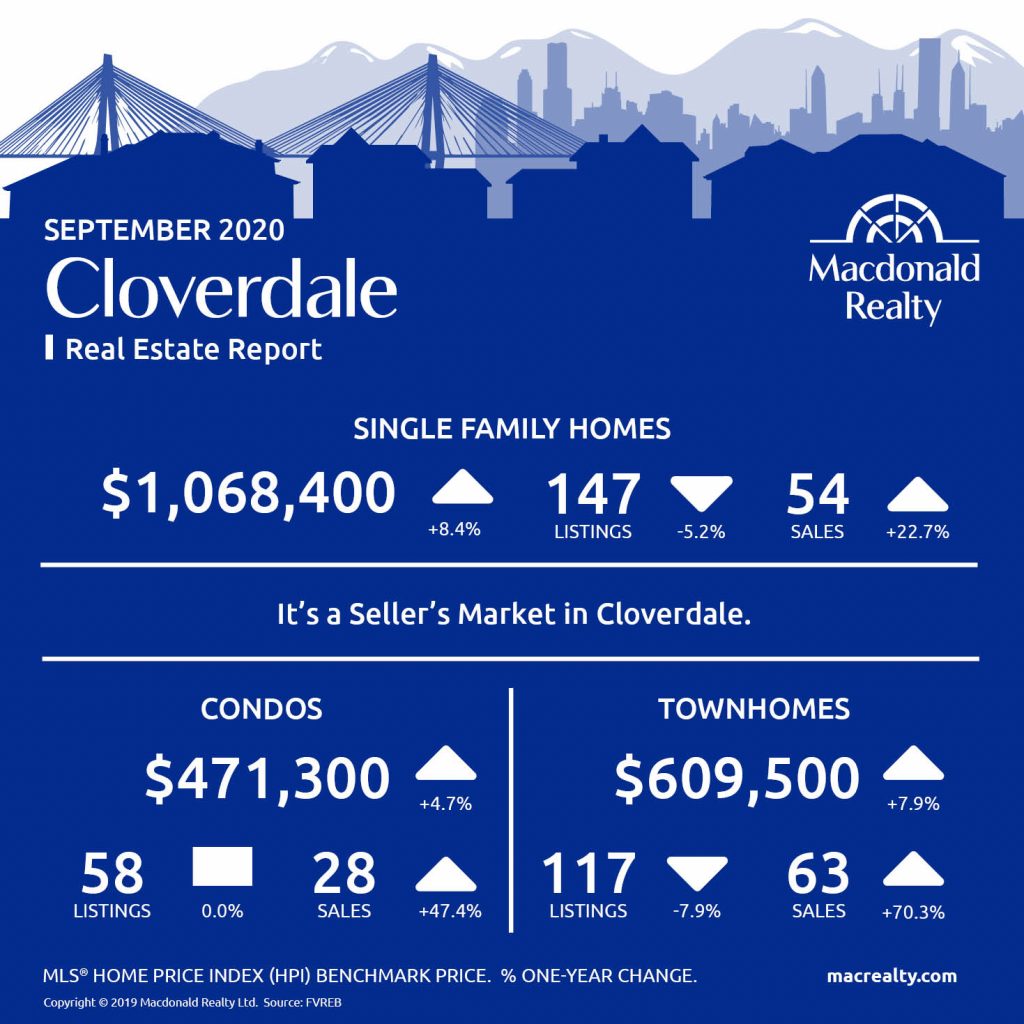
Cloverdale
Langley

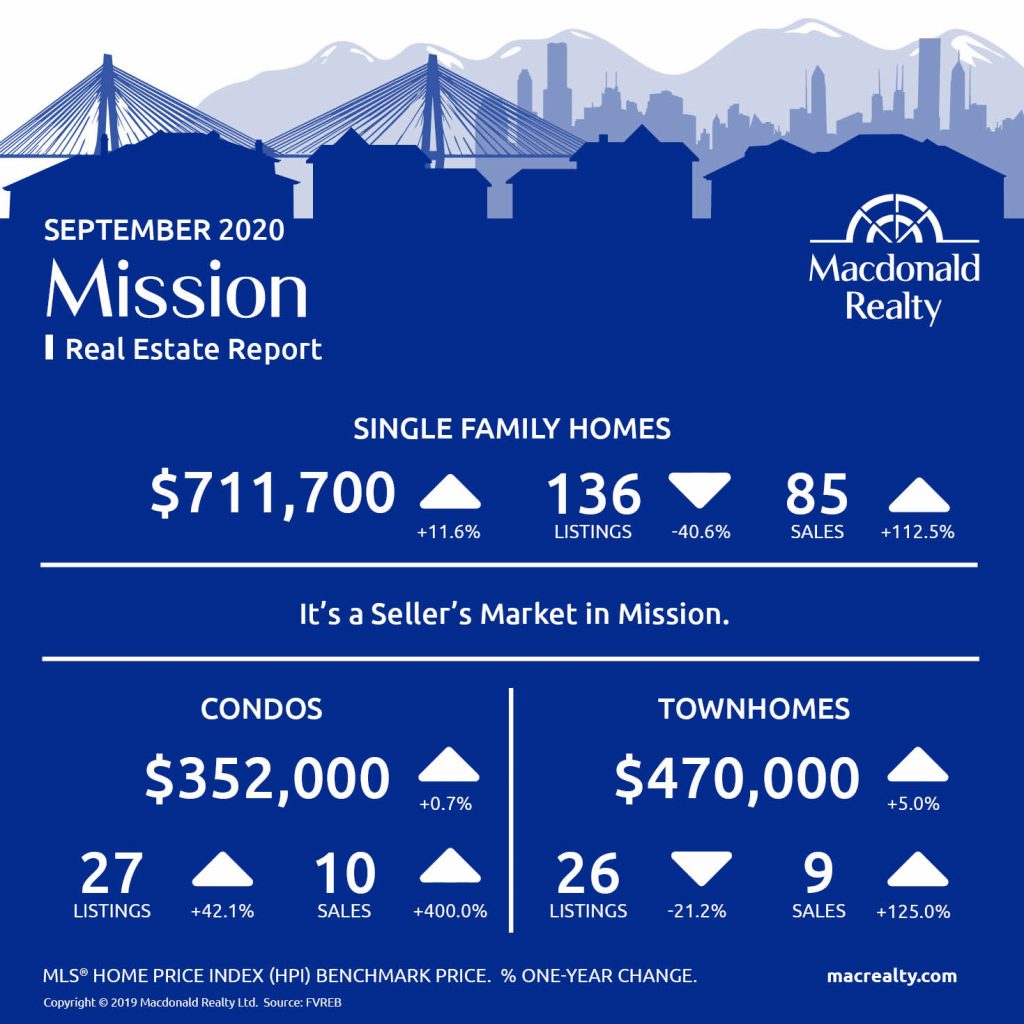
Mission
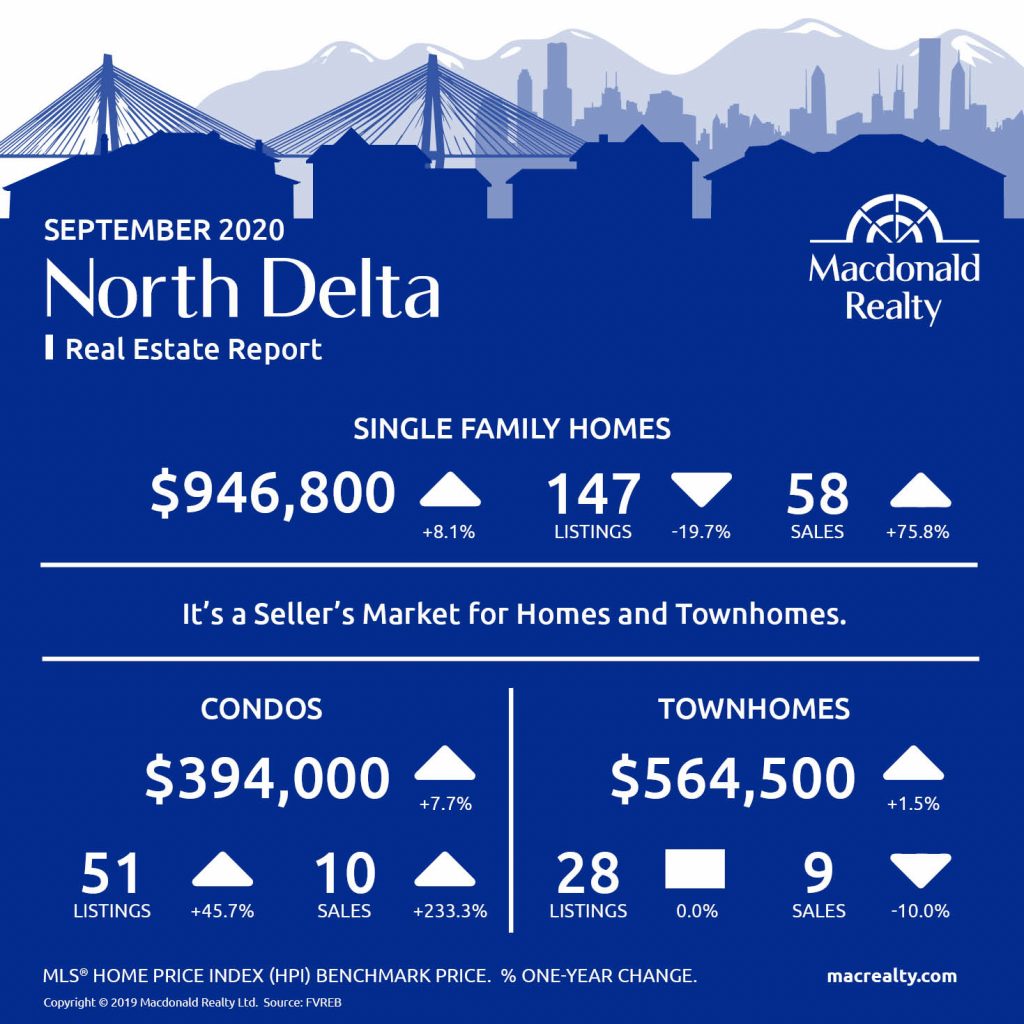
North Delta
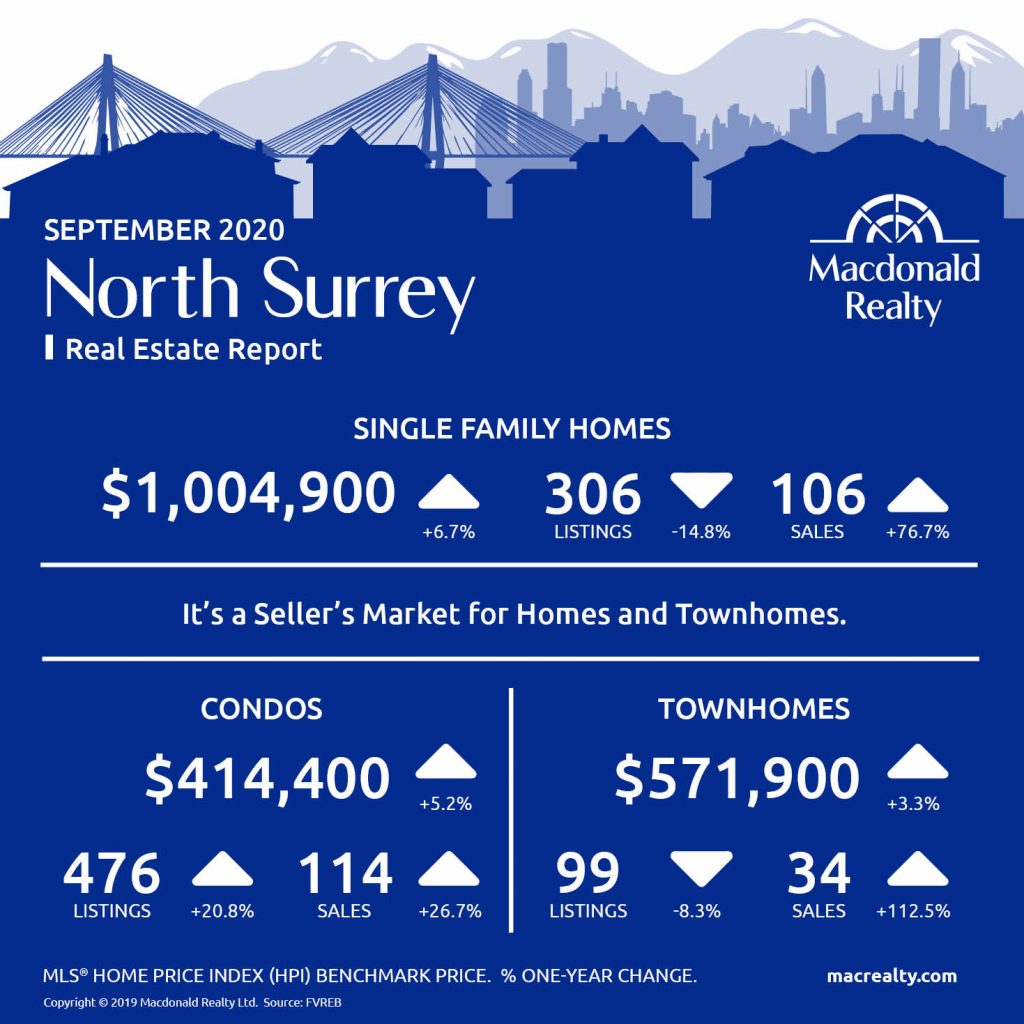
North Surrey
Surrey Centra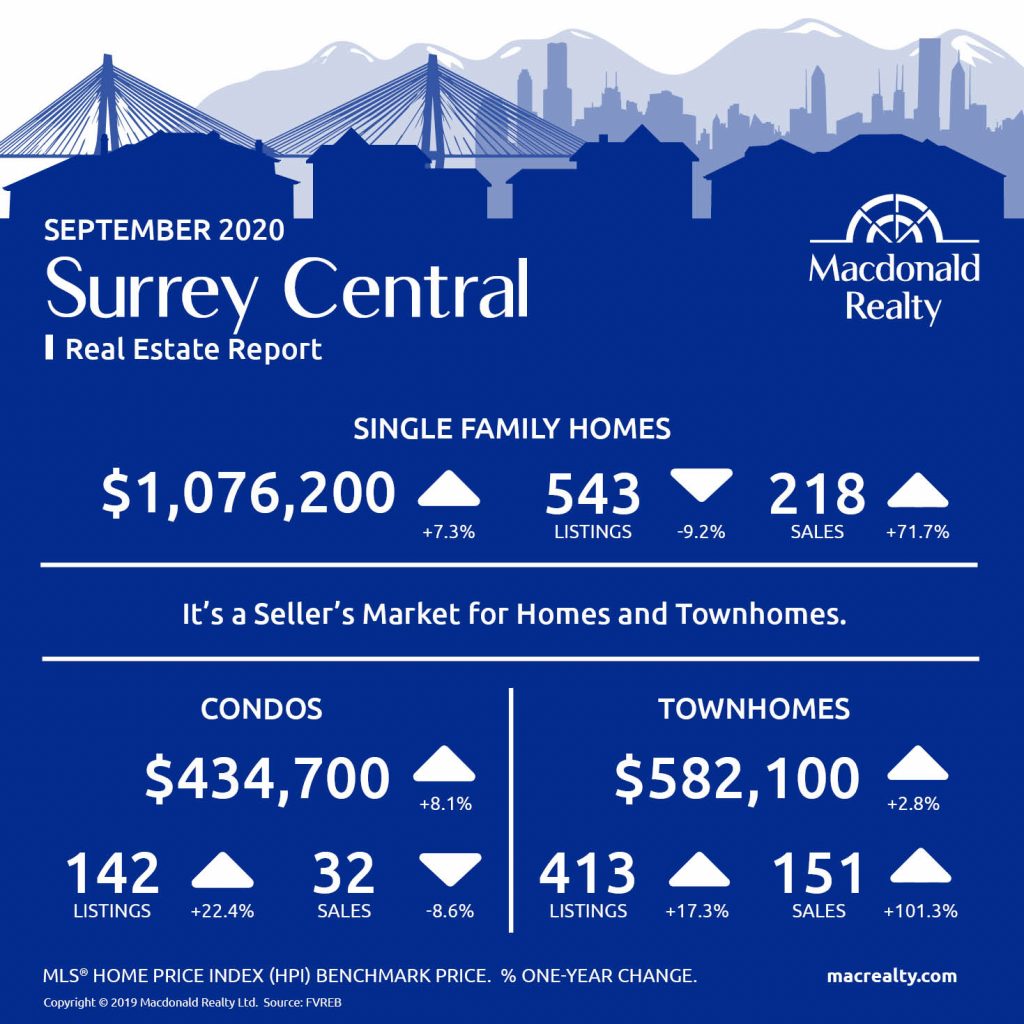
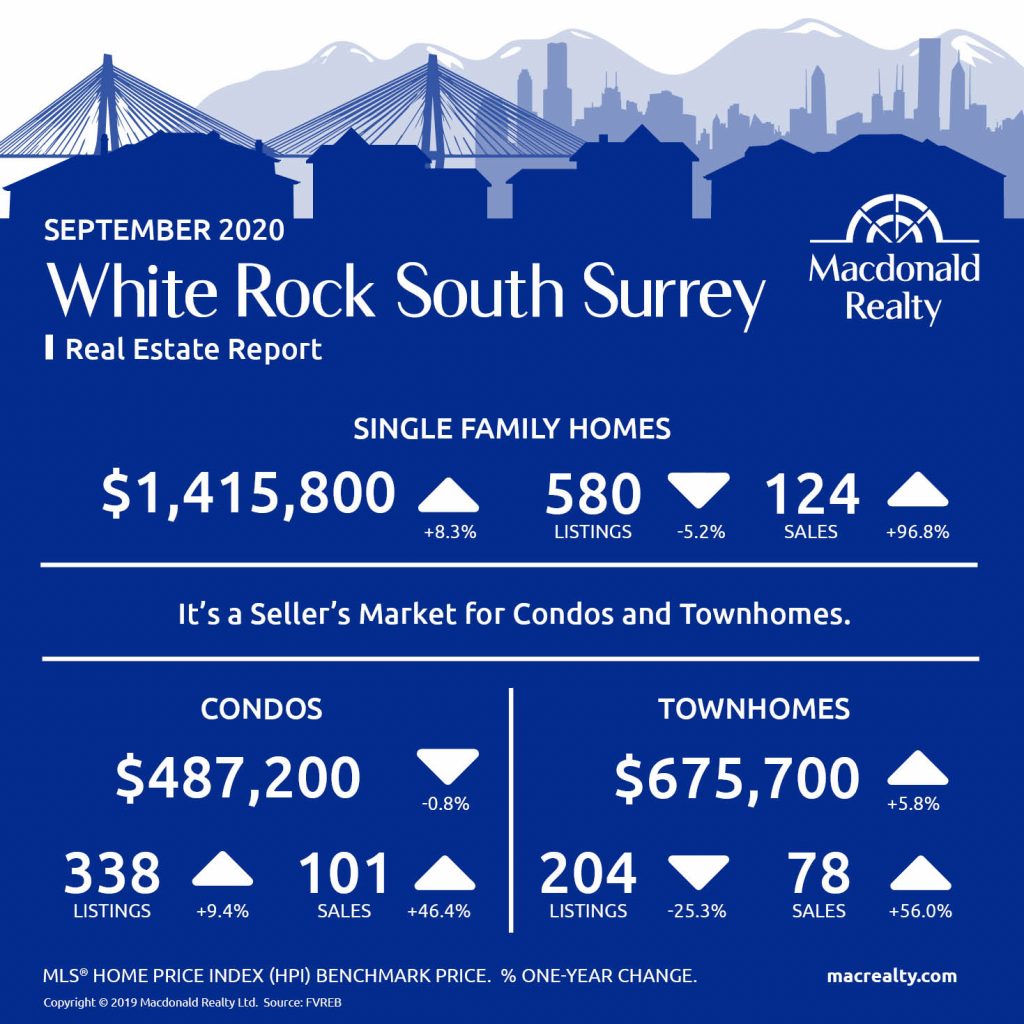
White Rock / South Surrey
Looking for more information about the real estate market in specific neighbourhoods in Surrey, Langley and Fraser Valley?
Macdonald Realty has offices in North Delta, White Rock/South Surrey, and Langley. Please email [email protected] or call 1-877-278-3888 to be matched with a REALTOR® working in your area.
MLS® Home Price Index (HPI) Benchmark Price
Average and median home prices are often misinterpreted, are affected by change in the mix of homes sold, and can swing dramatically from month to month (based on the types and prices of properties that sold in a given month). The MLS® HPI overcomes these shortcomings and uses the concept of a benchmark home, a notional home with common attributes of typical homes in a defined area. Visit www.housepriceindex.ca for more information.
This blog post is based on market data provided by the Fraser Valley Real Estate Board (FVREB) www.fvreb.bc.ca
by Macrealty Marketing Team | Oct 5, 2020 | Market Updates
Here are the latest real estate market statistics from Macdonald Realty on Okanagan listings and sales in September 2020.
Find the infographics by visiting the Facebook Album.
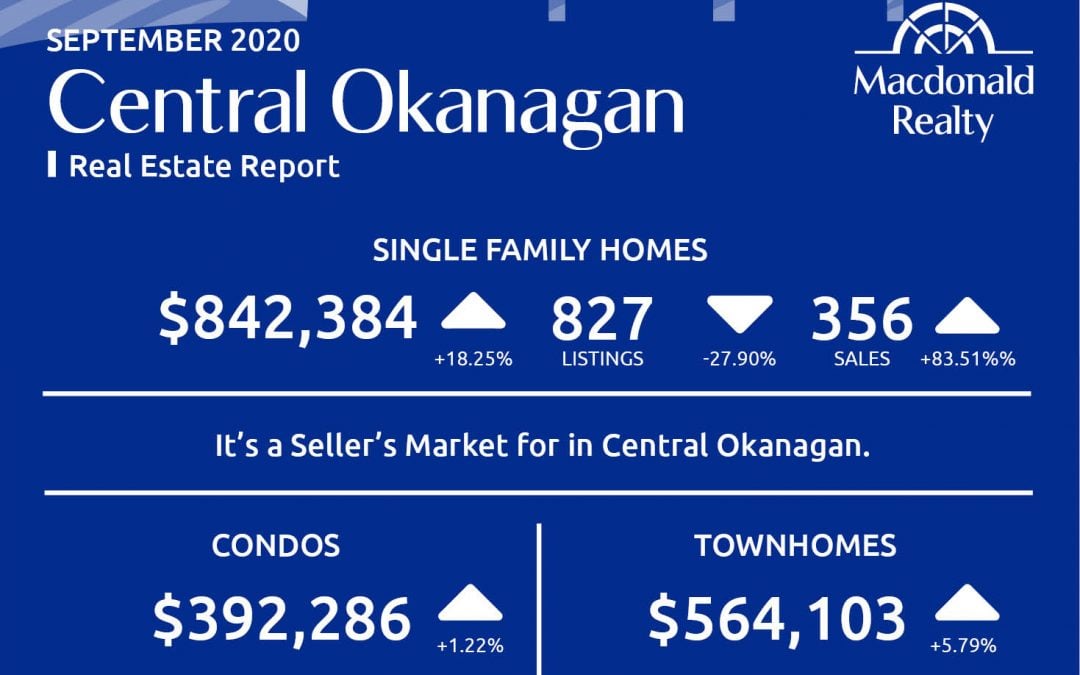
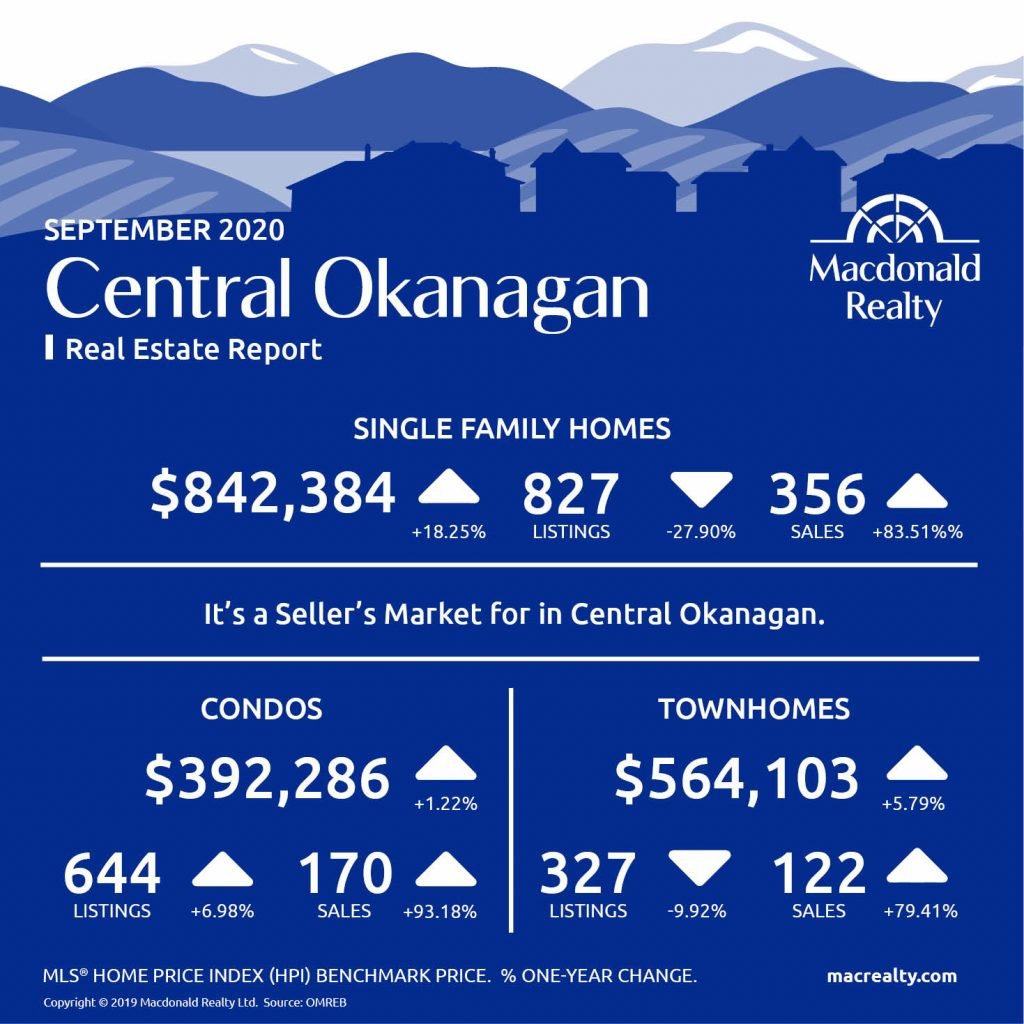
Central Okanagan: Kelowna and Lake Country
There were 356 sales, 827 active listings, and an $842,384 average sale price for detached homes in the Central Okanagan market, including Kelowna and Lake Country.
The condo market featured 170 sales and 644 active listings at the end of the month. The average sale price was $392,286.
Townhome sales were 122, active listings were 327 and the average sale price was $564,103.
It’s a seller’s market in Central Okanagan.
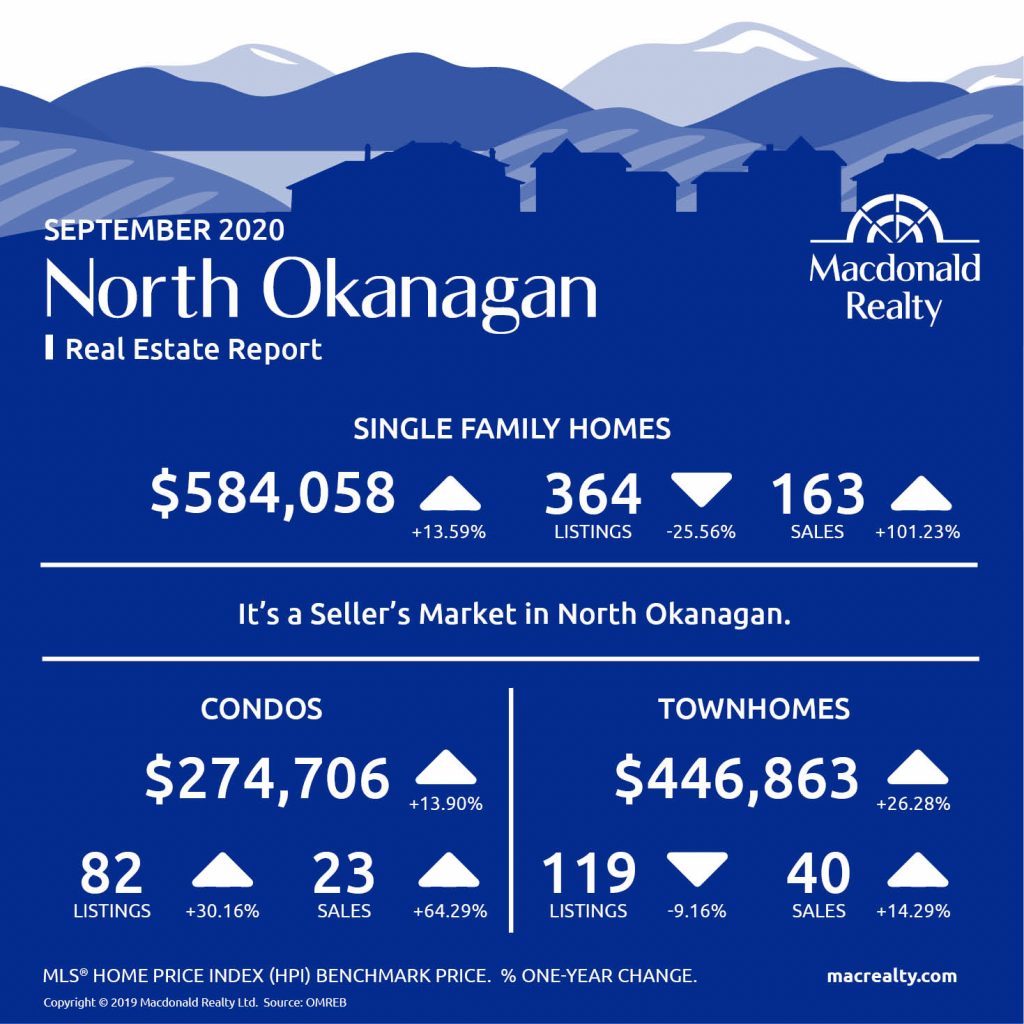
North Okanagan: Vernon and surrounding area
In North Okanagan, including Vernon and the surrounding area and the average sale price was $584,058. At the end of the month, there were 163 sales and 364 active listings.
There were 23 sales and 82 active listings for condos. The average sale price was $274,706.
In comparison, townhomes featured 40 sales, 119 active listings and a $446,863 average sale price.
It’s a seller’s market in North Okanagan.
Looking for more information about the real estate market in specific neighbourhoods in Okanagan?
Macdonald Realty has offices in Kelowna and across BC. Please email [email protected] or call 1-877-278-3888 to be matched with a REALTOR® working in your area.
This blog post is based on market data provided by Okanagan Mainline Real Estate Board (OMREB) www.omreb.com.

