by Macrealty Marketing Team | Dec 3, 2020 | Market Updates
According to the Fraser Valley Real Estate Board the housing market activity reaches historic levels in November.
The Fraser Valley Real Estate Board processed 2,173 sales of all property types on its Multiple Listing Service® (MLS®) in November, an increase of 54.7% compared to the 1,405 sales in November of last year, and an 8.3% decrease month‐over‐month compared to 2,370 sales in October.
Fraser Valley Real Estate Board reported that they received 2,217 new listings in November, a 28.0% decrease compared to October’s intake and an 18.1% increase compared to the 1,877 new listings received during the same month last year. For November, it was the second-highest volume of new inventory in the last decade.
Chris Shields, President of the Board, observes, “We’re running out of superlatives. We expected November activity to moderate due to the season, but the desire for family‐sized homes and their benefits continues to dominate. Since the summer, we’ve seen the strongest demand in our Board’s 99‐year history specifically for single‐family detached and townhomes.
Find all the infographics related to the May Market Statistics by visiting the Facebook Album.
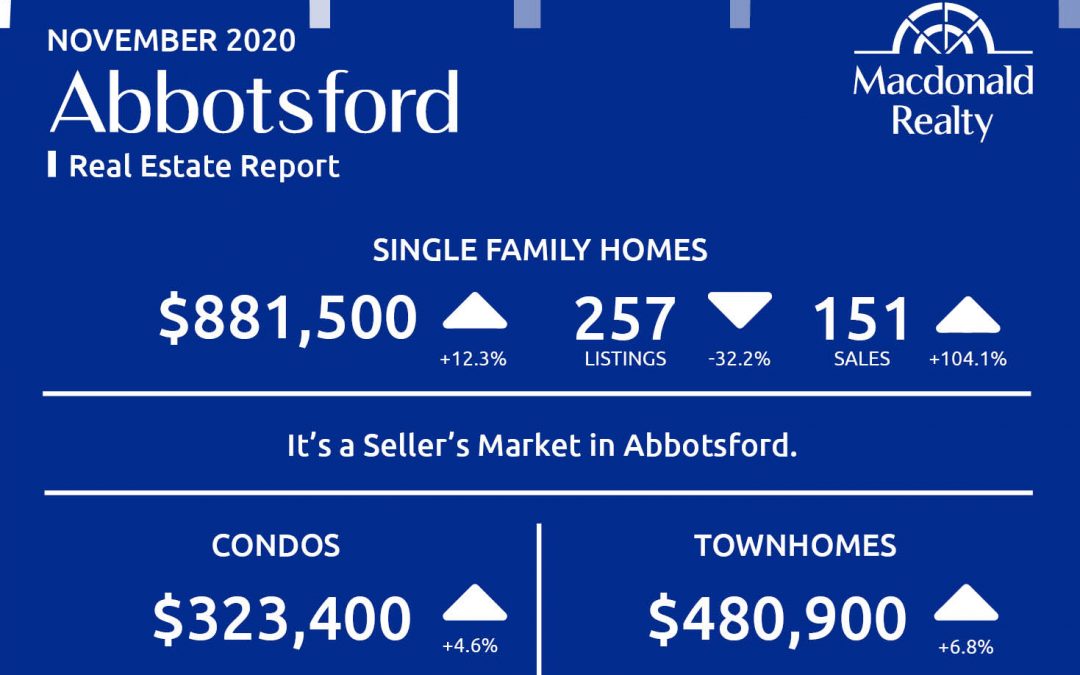
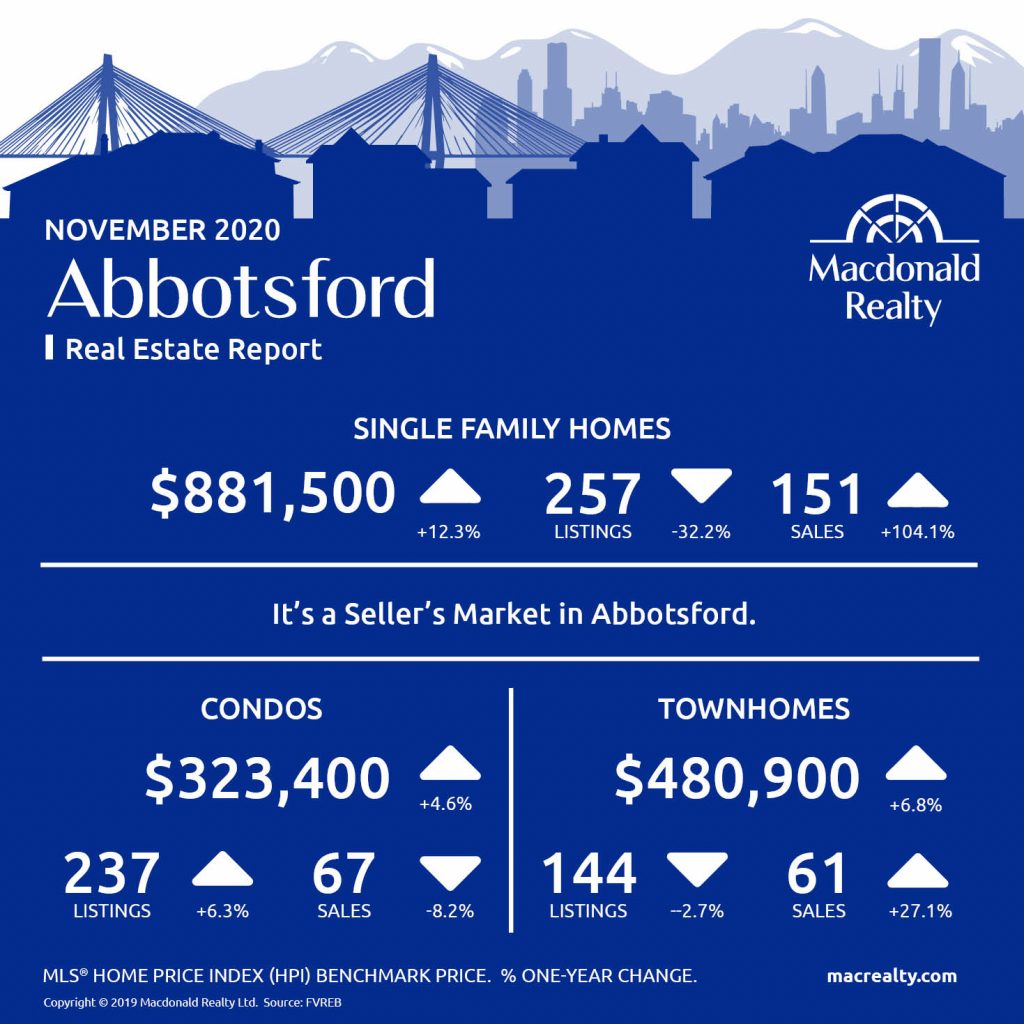
Abbotsford
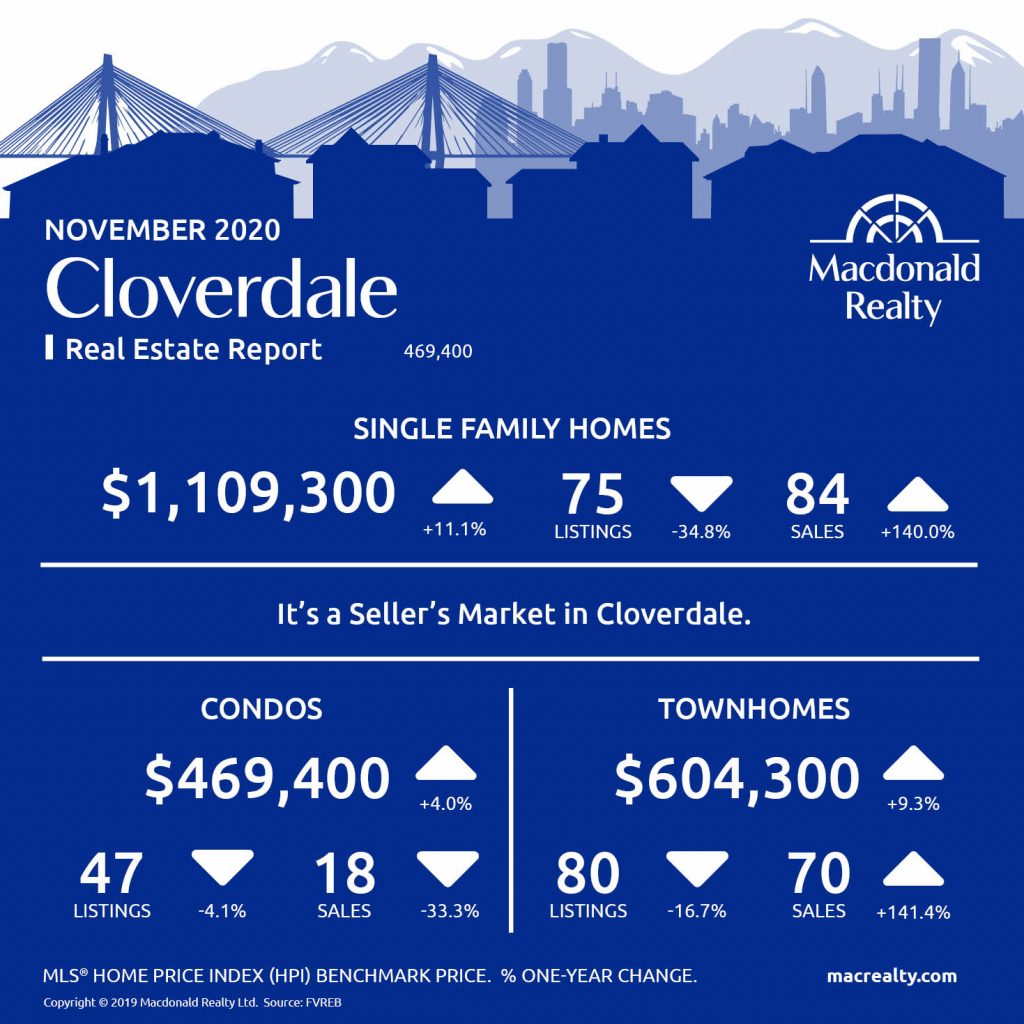
Cloverdale
Langley

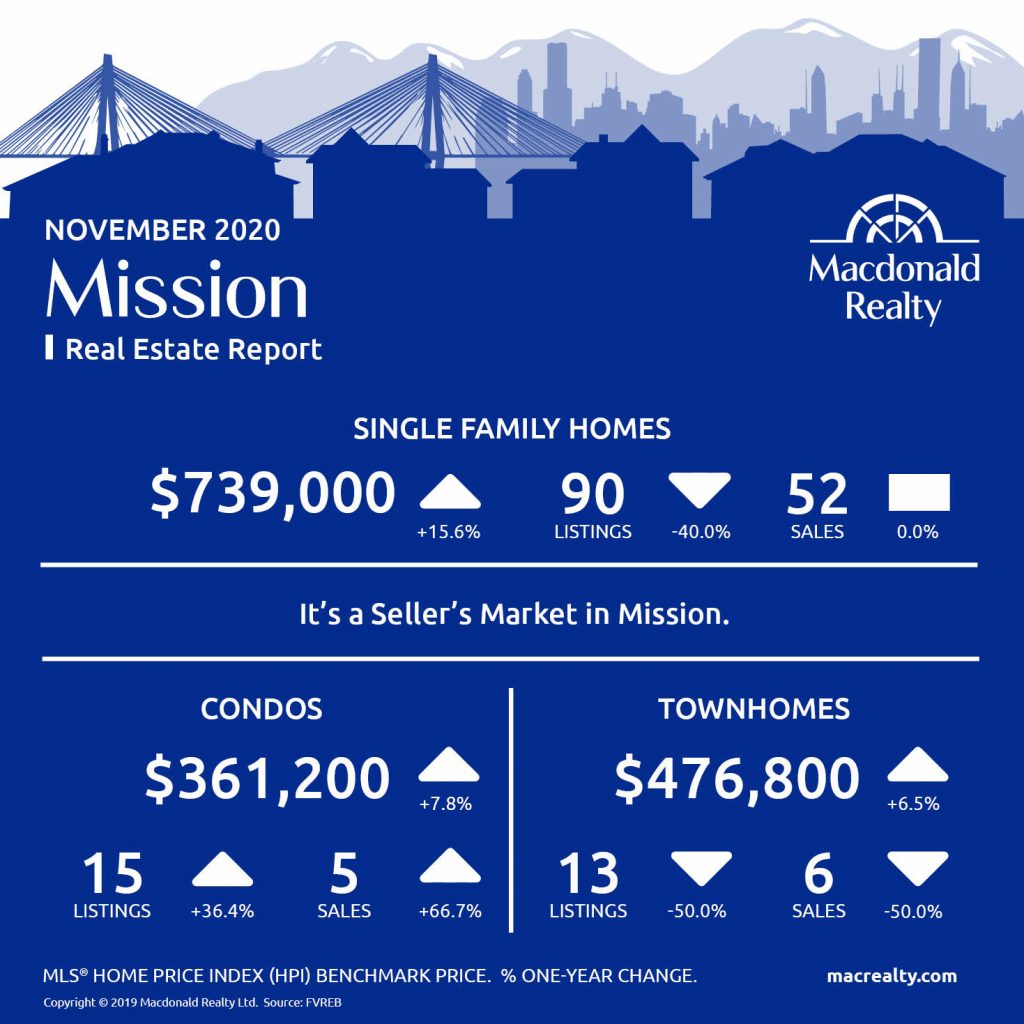
Mission
North Delta

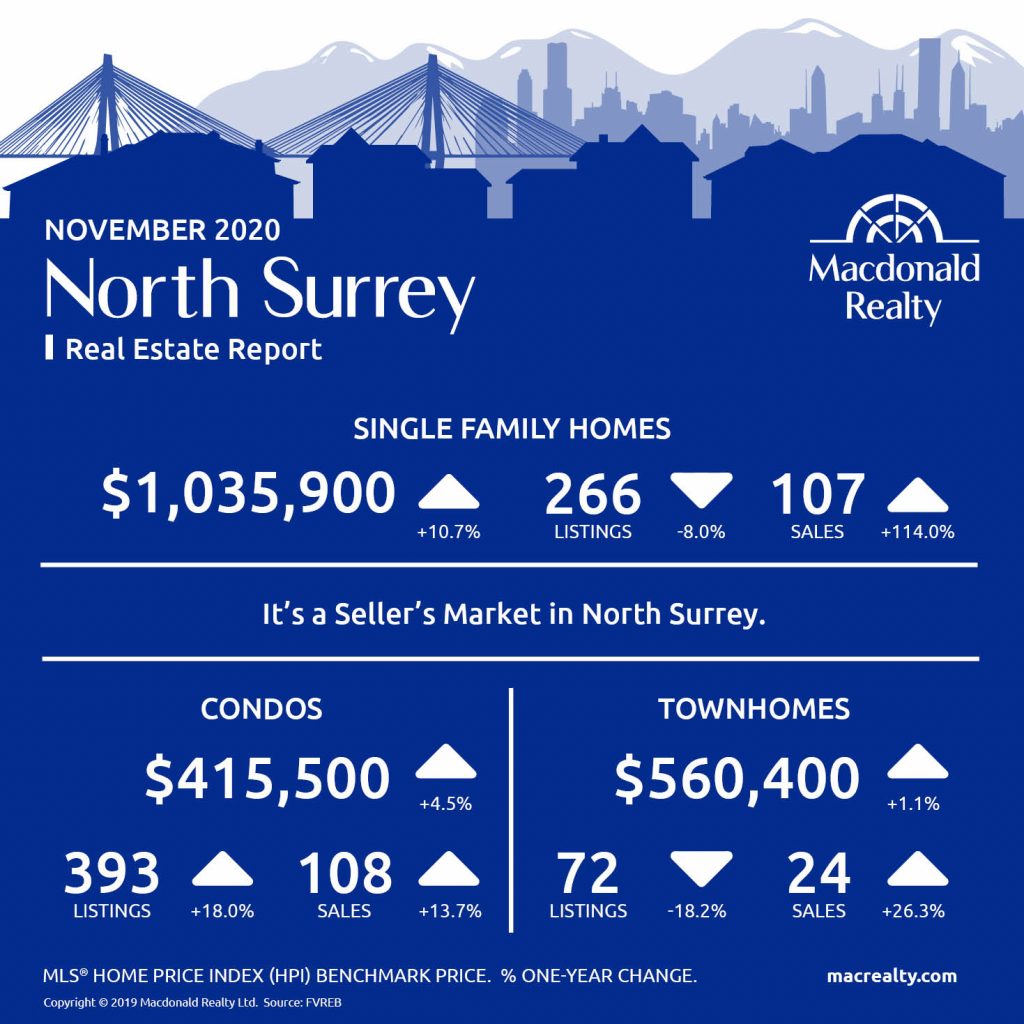
North Surrey
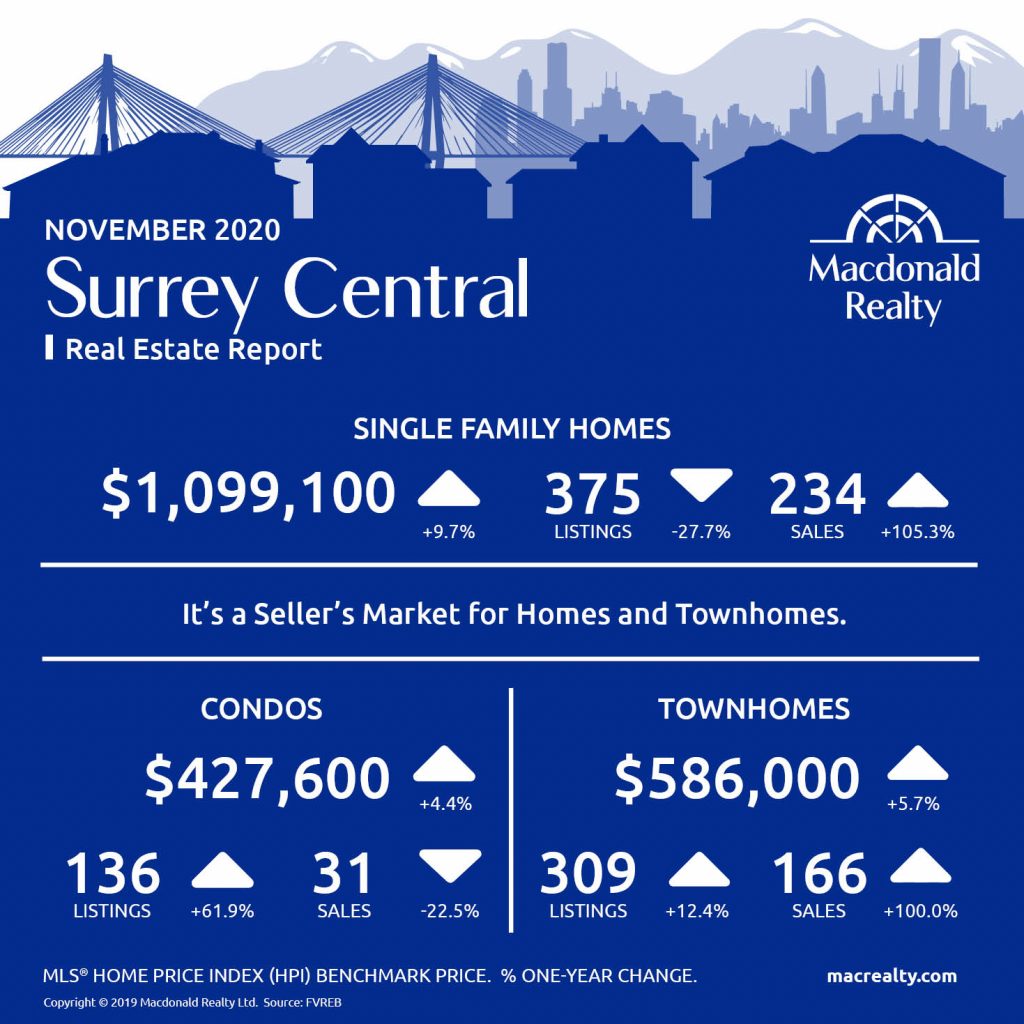
Surrey Central
White Rock / South Surrey

Looking for more information about the real estate market in specific neighbourhoods in Surrey, Langley and Fraser Valley?
Macdonald Realty has offices in North Delta, White Rock/South Surrey, and Langley. Please email [email protected] or call 1-877-278-3888 to be matched with a REALTOR® working in your area.
MLS® Home Price Index (HPI) Benchmark Price
Average and median home prices are often misinterpreted, are affected by change in the mix of homes sold, and can swing dramatically from month to month (based on the types and prices of properties that sold in a given month). The MLS® HPI overcomes these shortcomings and uses the concept of a benchmark home, a notional home with common attributes of typical homes in a defined area. Visit www.housepriceindex.ca for more information.
This blog post is based on market data provided by the Fraser Valley Real Estate Board (FVREB) www.fvreb.bc.ca
by Macrealty Marketing Team | Dec 2, 2020 | Market Updates
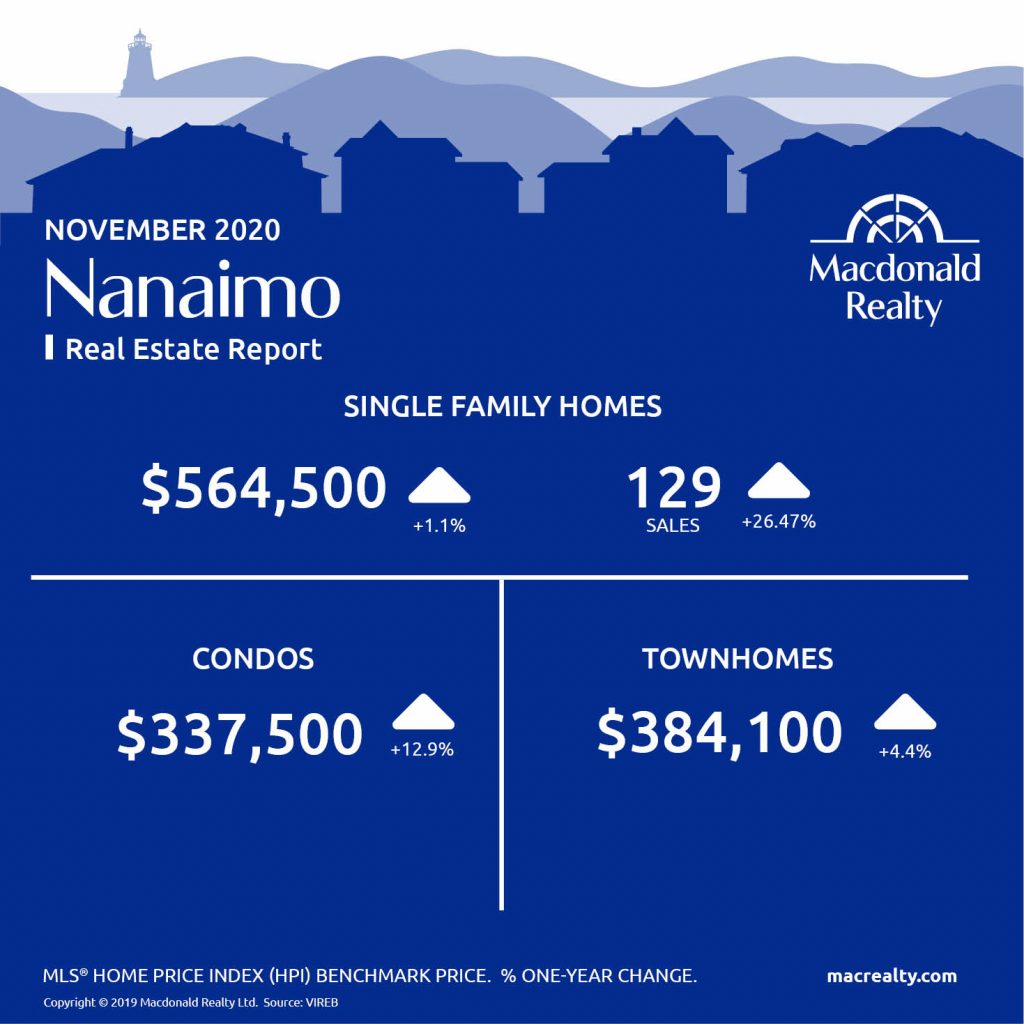
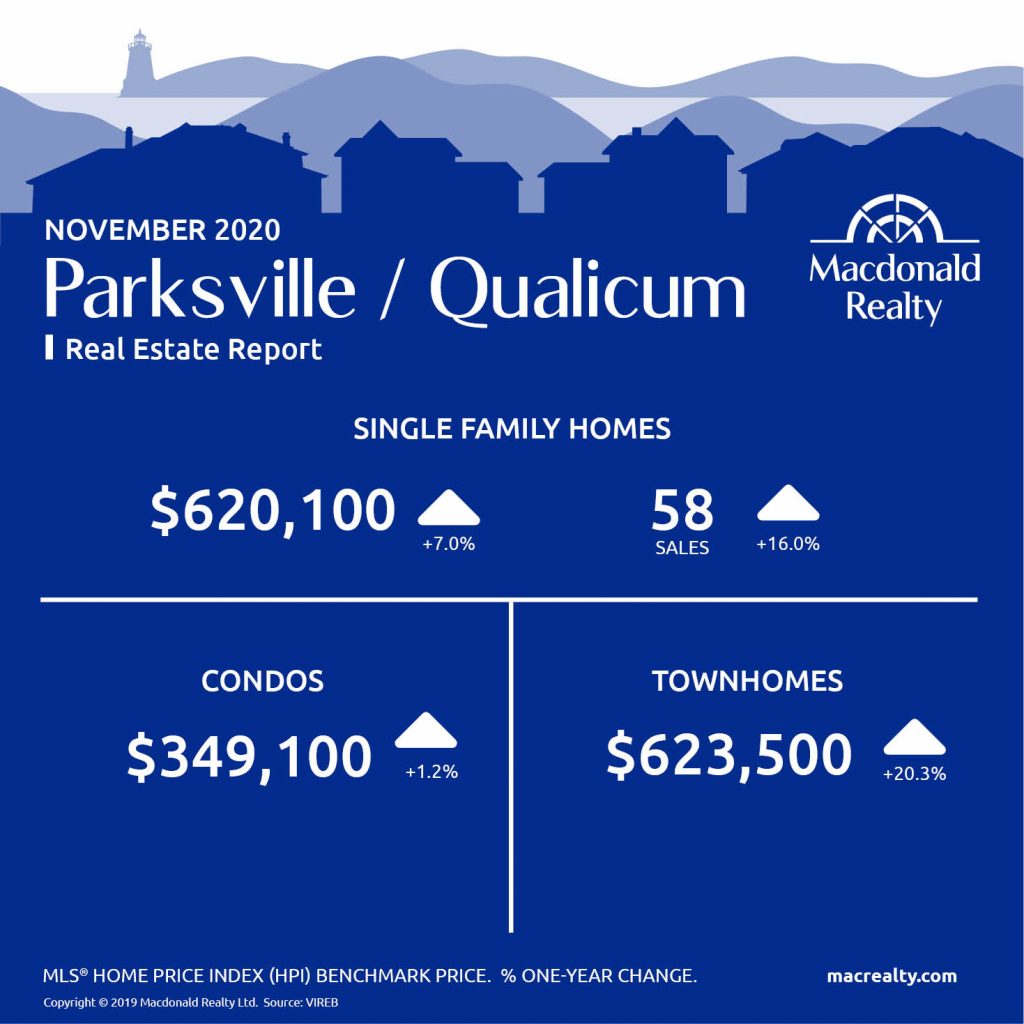
Here are the latest real estate market statistics from Macdonald Realty on Greater Victoria, Parksville/Qualicum, and Nanaimo listings and sales in November 2020.
Find all the infographics related to the February Market Statistics by visiting the Facebook Album.
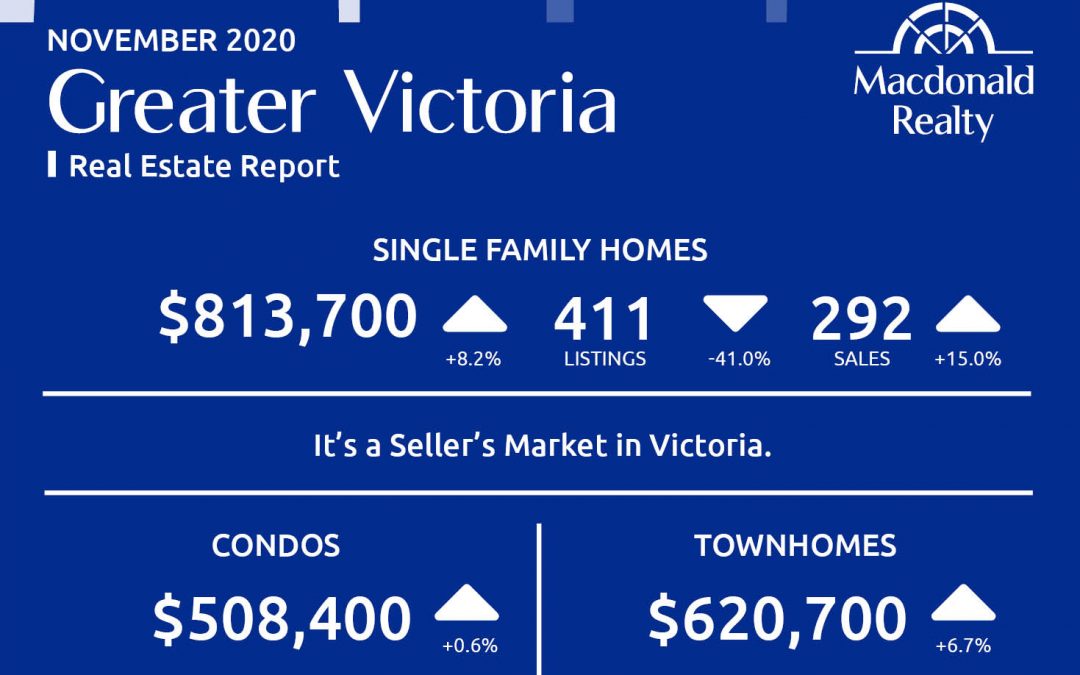
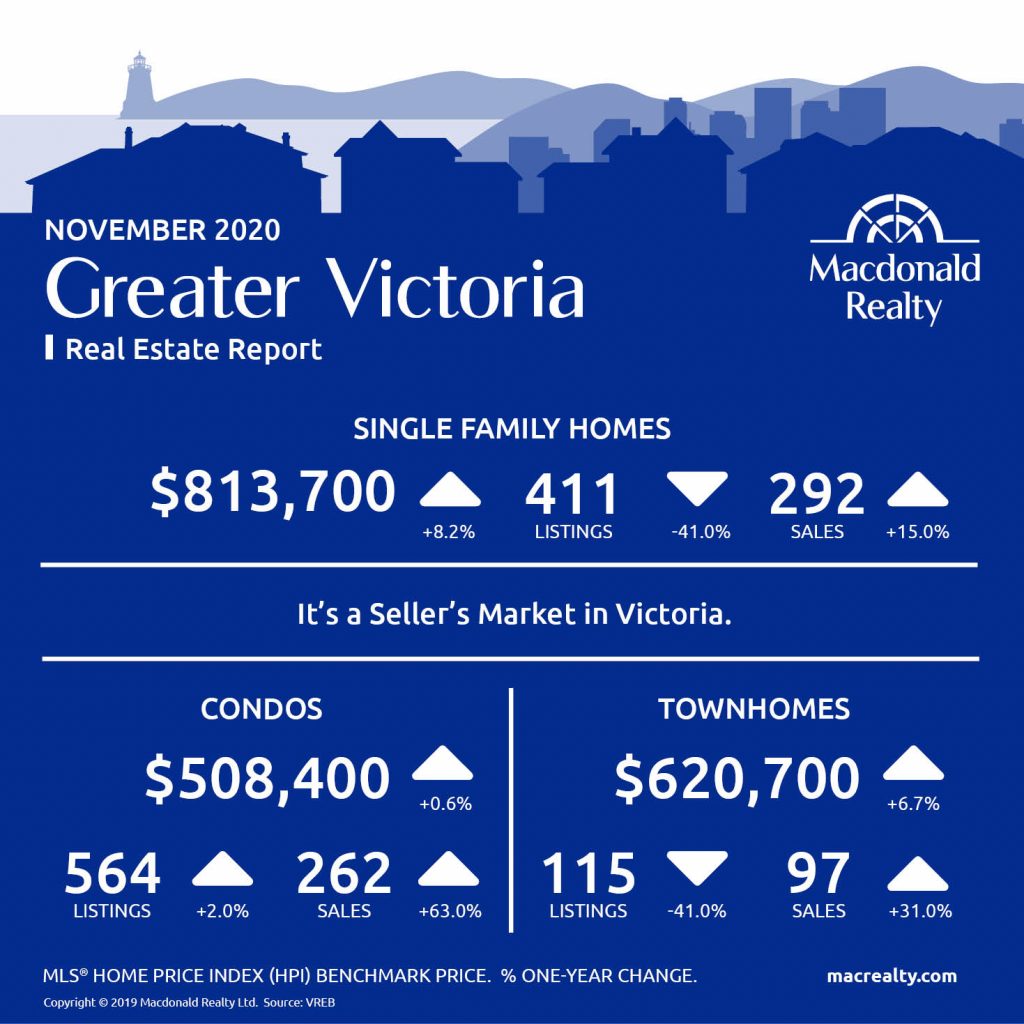
Greater Victoria
According to the Victoria Real Estate Board “A total of 795 properties sold in the Victoria Real Estate Board region this November, 37.8% more than the 577 properties sold in November 2019 but 19.7% fewer than the previous month of October 2020. Sales of condominiums were up 62.7% from November 2019 with 262 units sold. Sales of single-family homes were up 21.8% from November 2019 with 375 sold.”
“Once again, we’ve tracked an unexpectedly busy month for the Victoria area real estate market,” said Victoria Real Estate Board President Sandi-Jo Ayers. “With near 800 total sales last month, we came close to the record for sales in a November – which was 892 sales in 1989.”
Nanaimo
Parksville / Qualicum
Looking for more information about the real estate market in specific neighbourhoods in Victoria, Parksville, Nanaimo, Vancouver Island and the Gulf Islands?
Macdonald Realty has offices in downtown Victoria, Sidney, Parksville and Salt Spring Island. Please email [email protected] or call 1-877-278-3888 to be matched with a REALTOR® working in your area.
MLS® Home Price Index (HPI) Benchmark Price
Average and median home prices are often misinterpreted, are affected by change in the mix of homes sold, and can swing dramatically from month to month (based on the types and prices of properties that sold in a given month). The MLS® HPI overcomes these shortcomings and uses the concept of a benchmark home, a notional home with common attributes of typical homes in a defined area. Visit www.housepriceindex.ca for more information.
This blog post is based on market data provided by the Victoria Real Estate Board (VREB) www.vreb.org and the Vancouver Island Real Estate Board (VIREB) www.vireb.com. Market data from the VIREB includes listings and sales in Campbell River, Comox Valley, Cowichan Valley Nanaimo, Parksville/Qualicum, Port Alberni/West, North Island, and the Islands.
by Macrealty Marketing Team | Nov 10, 2020 | Market Updates
Here are the latest real estate market statistics from Macdonald Realty on the Greater Vancouver listings and sales in October 2020.
Find all the infographics by visiting the Facebook Album.
According to the Real Estate Board of Greater Vancouver, home sale and new listing activity remained at near-record levels across Metro Vancouver in October.
“Home has been a focus for residents during the pandemic. With more days and evenings spent at home this year, people are re-thinking their housing situation,” Colette Gerber, REBGV Chair said. “Throughout this period, REALTORS® have been working to understand and adapt to the latest safety protocols so that they can continue to help the public meet their housing needs in a safe and responsible way.”
Colette also has talked about demand and multiple offers:
“With demand on the rise, homes priced right for today’s market are receiving attention and, at times, garnering multiple offers,” Gerber said. “To understand the market conditions in your neighbourhood and property type of choice, work with your local REALTOR® to assess the latest MLS® housing market information.”
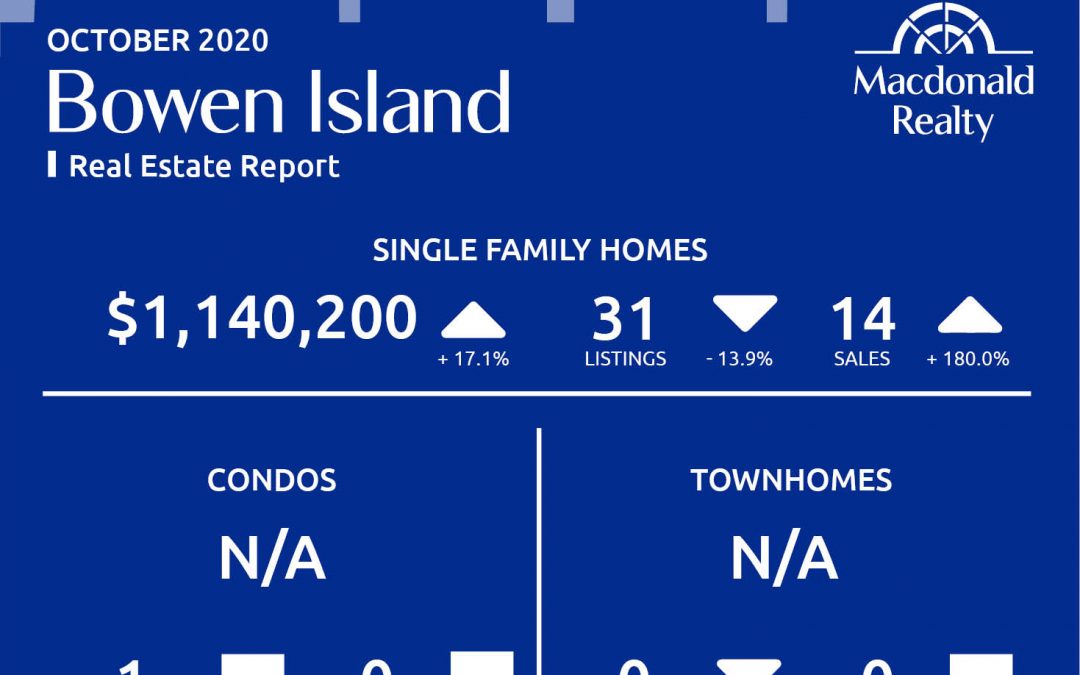
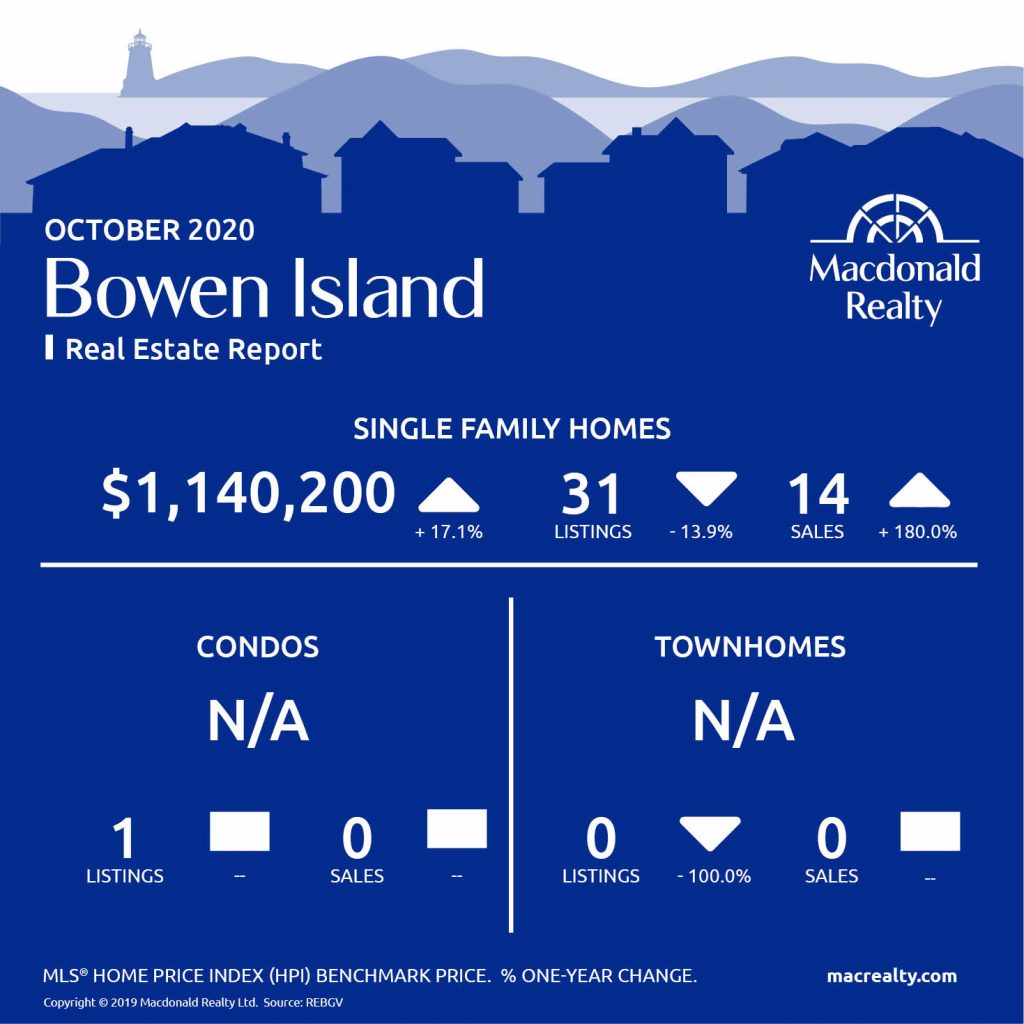
Bowen Island
In October 2020, there were 14 sales of detached homes and 31 active listings in Bowen Island. The benchmark sale price was $1,140,200.
The condo market had 1 active listing.
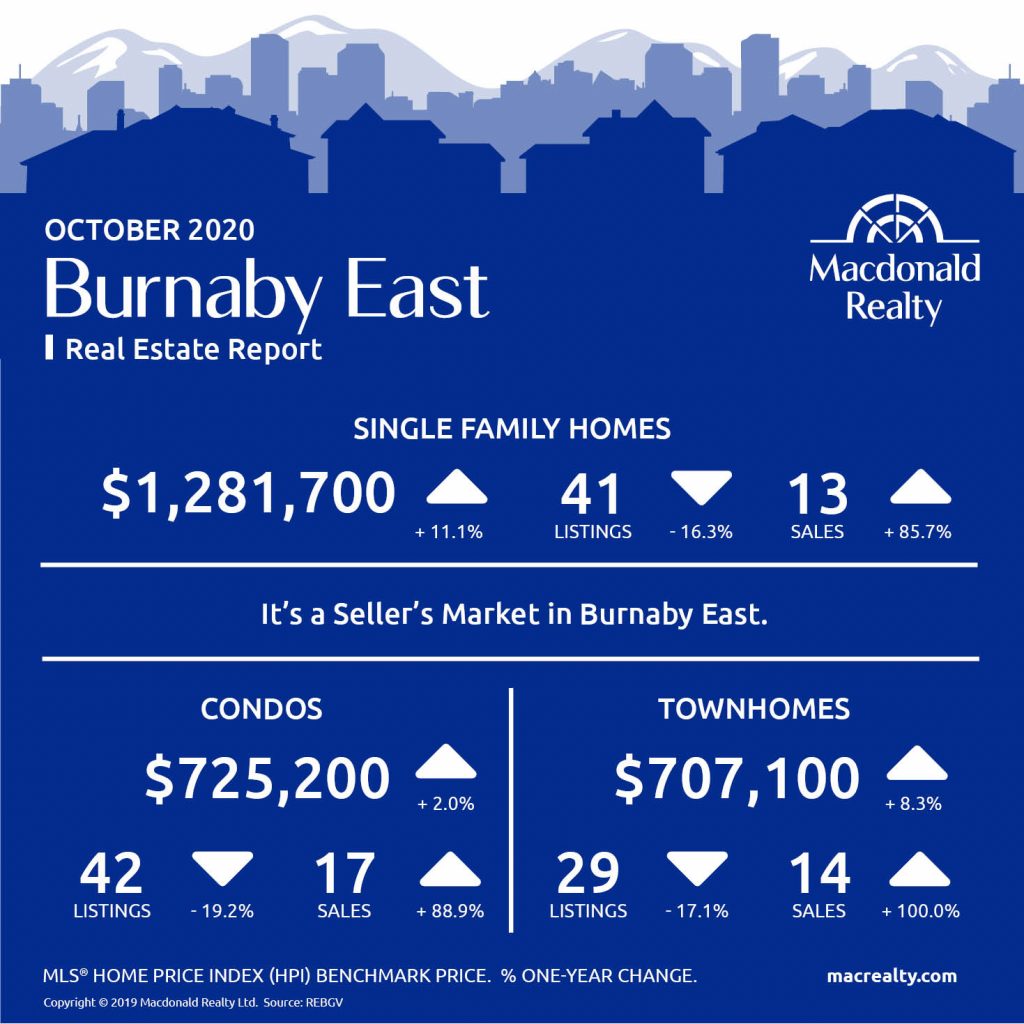
Burnaby East
In October 2020, there were 13 sales of detached homes and 41 active listings in Burnaby East. The benchmark sale price was $1,281,700.
The condo market had 17 sales and 42 active listings at the end of the month. The benchmark sale price was $725,200.
The townhome market had 14 sales and, the active listings were 29. The benchmark sale price was $707,100.
It’s a seller’s market in Burnaby East.
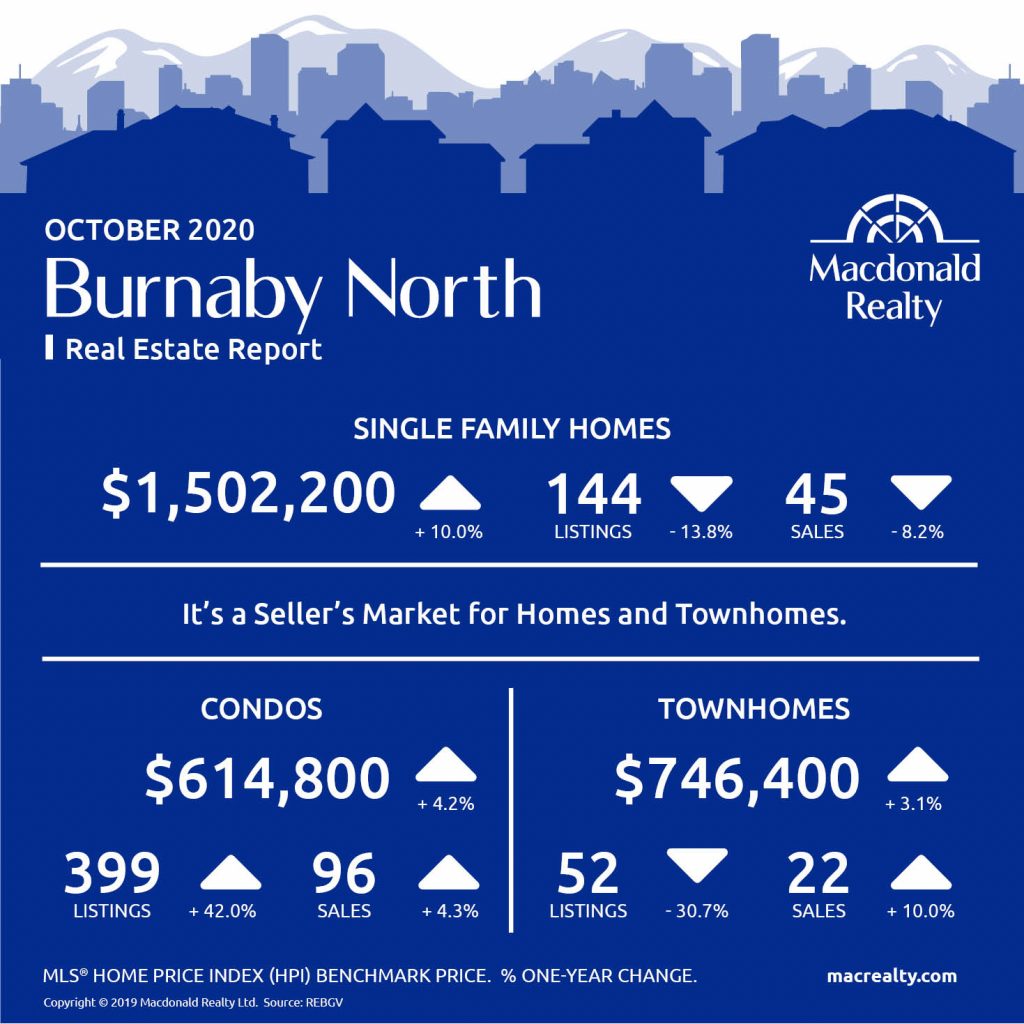
Burnaby North
In October 2020, there were 45 sales of detached homes and 144 active listings in Burnaby North. The benchmark sale price was $1,502,200.
The condo market had 96 sales and 399 active listings at the end of the month. The benchmark sale price was $614,800.
The townhome market had 22 sales and, the active listings were 52. The benchmark sale price was $746,400.
It’s a seller’s market for homes and townhomes.
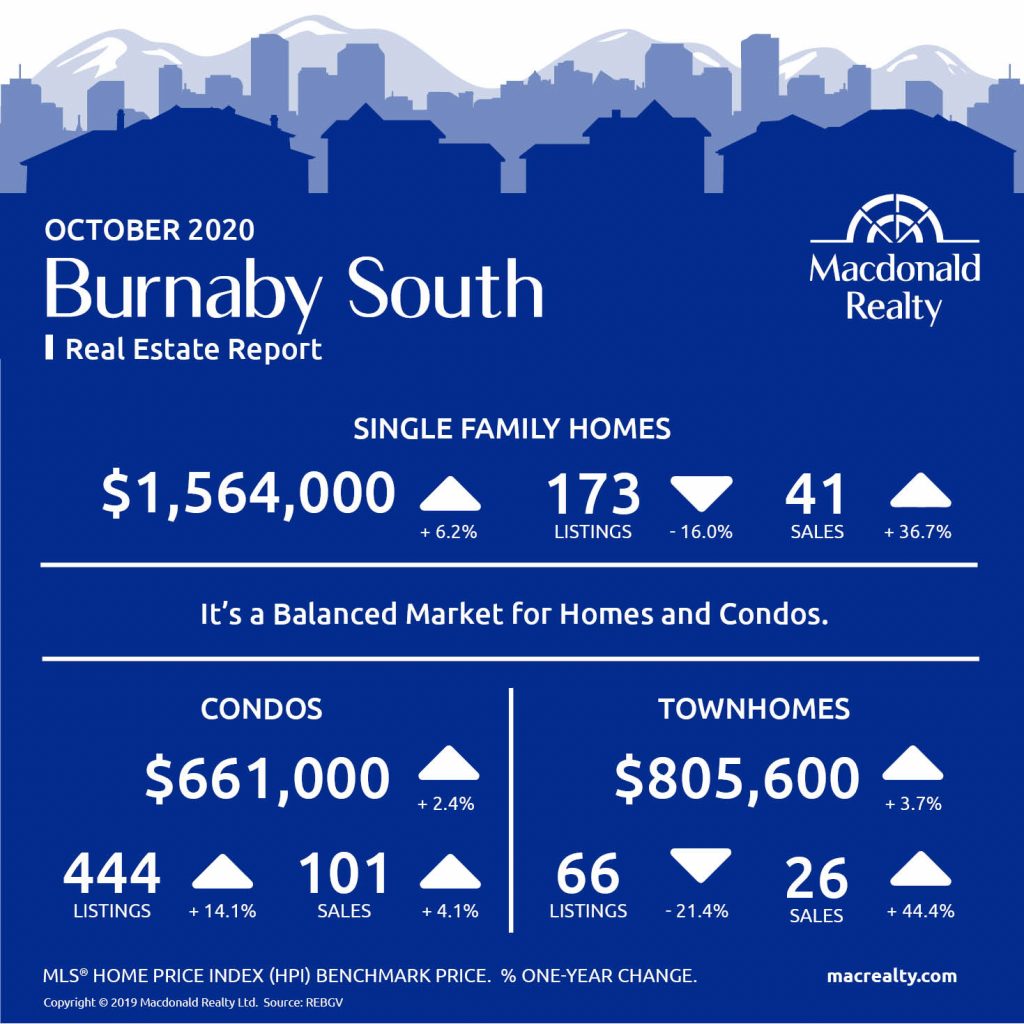
Burnaby South
In October 2020, there were 41 sales of detached homes and 173 active listings in Burnaby South. The benchmark sale price was $1,564,000.
The condo market had 101 sales and 444 active listings at the end of the month. The benchmark sale price was $661,000.
The townhome market had 26 sales and 66 active listings. The benchmark sale price was $805,600.
It’s a balanced market for homes and condos.
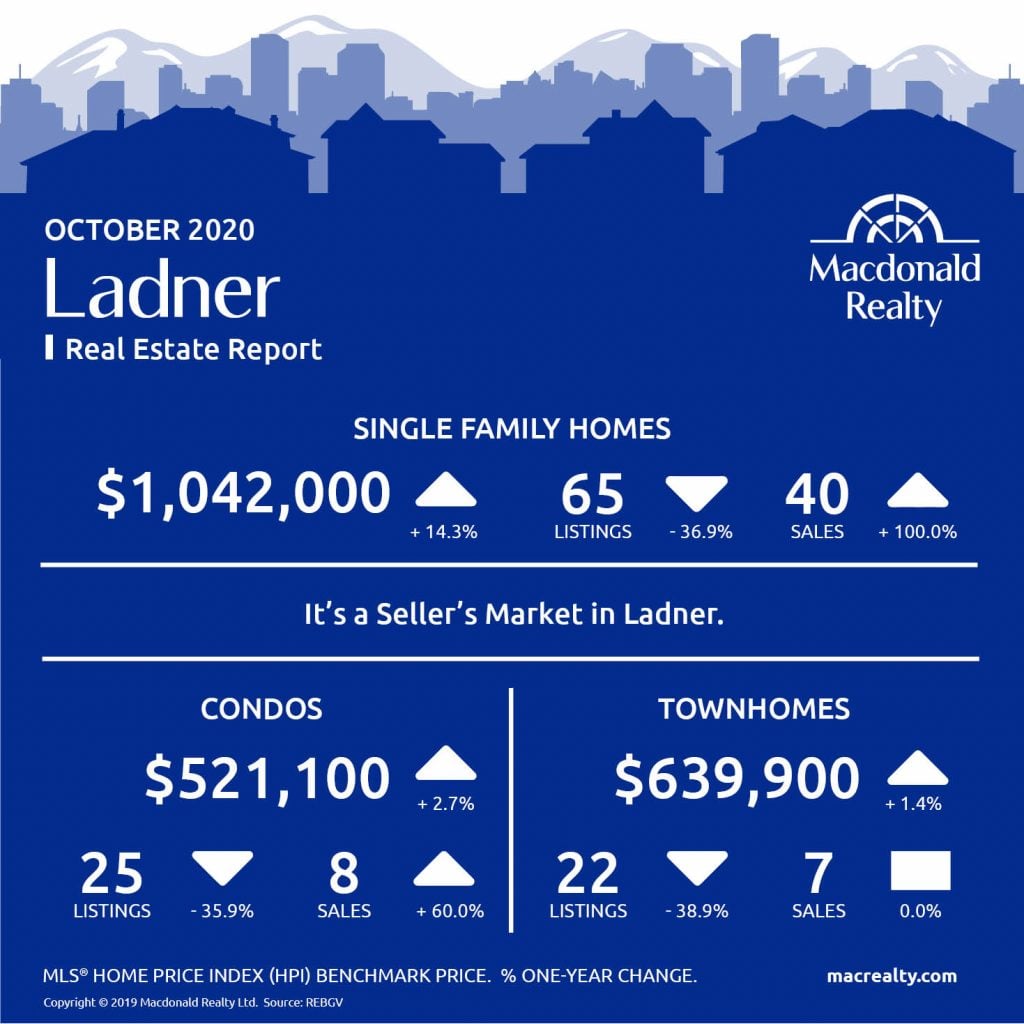
Ladner
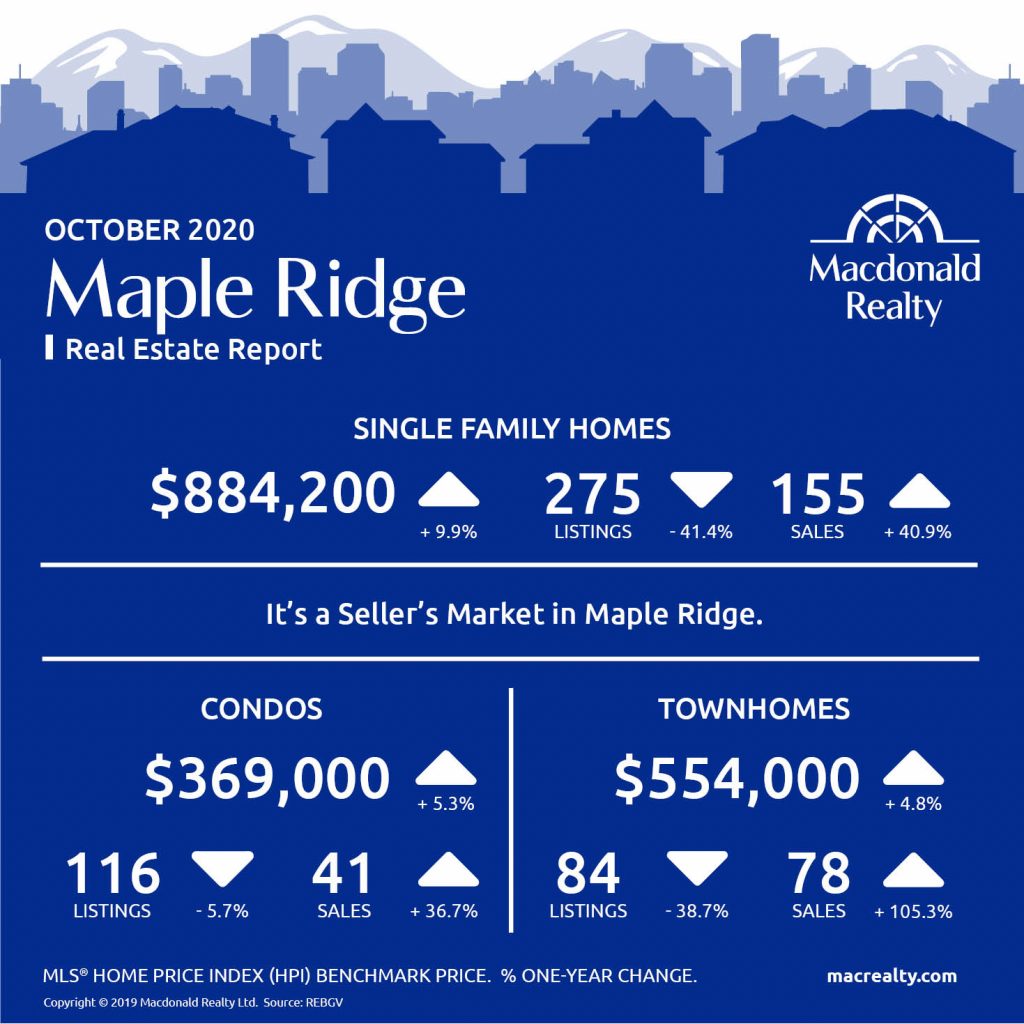
Maple Ridge
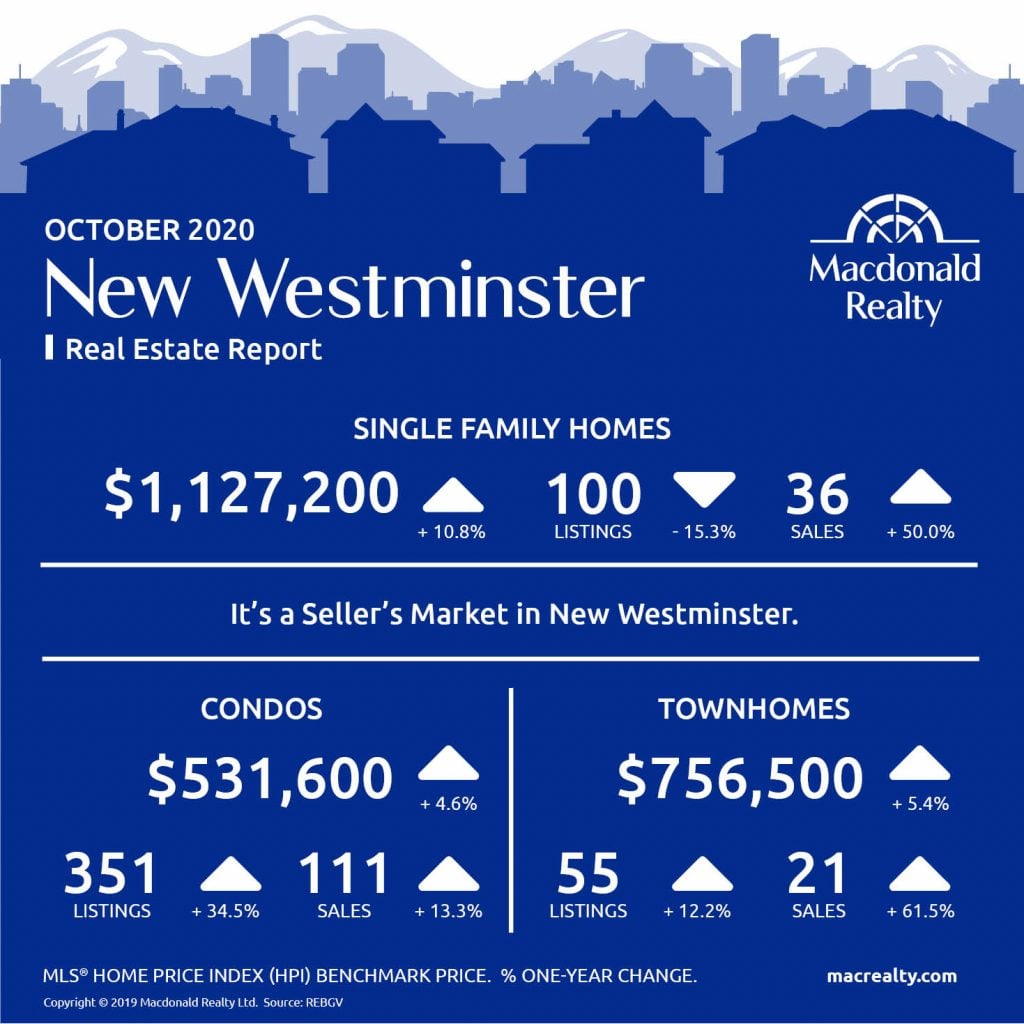
New Westminster
North Vancouver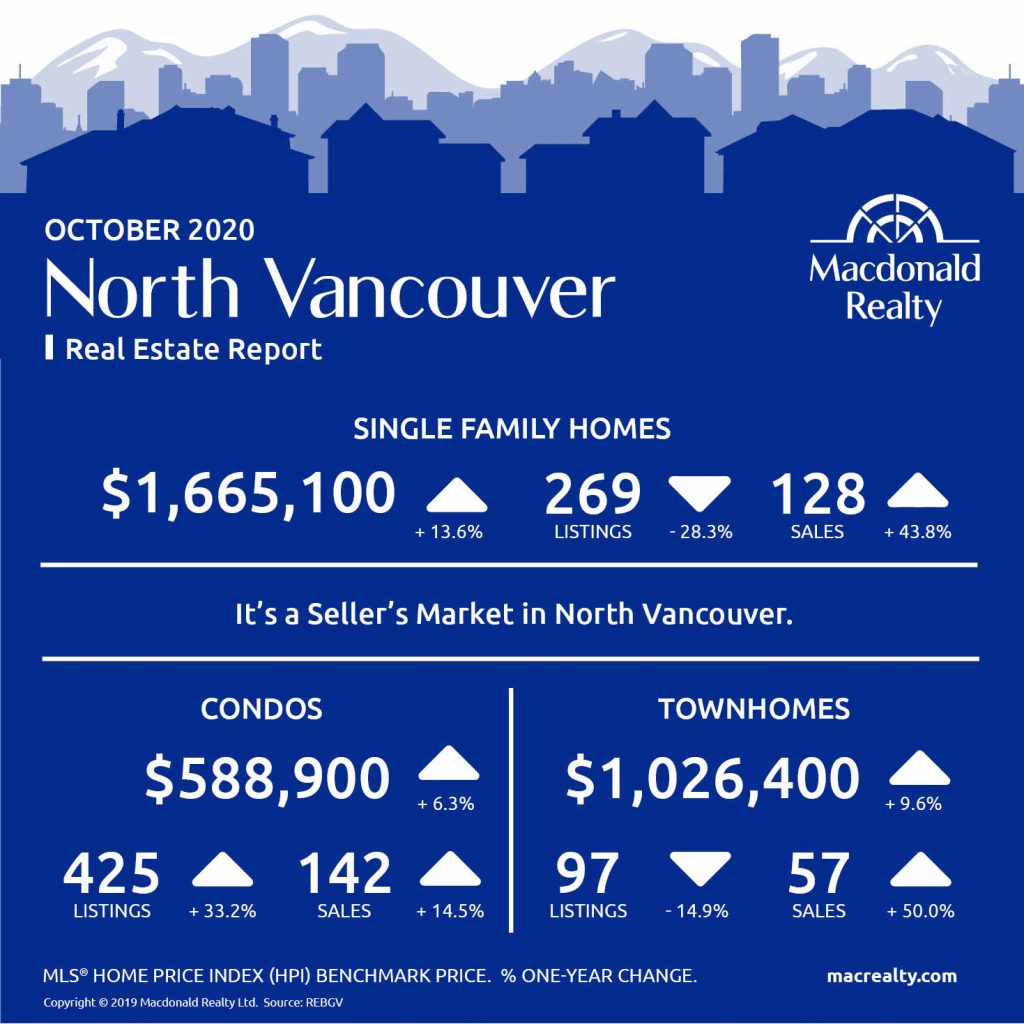
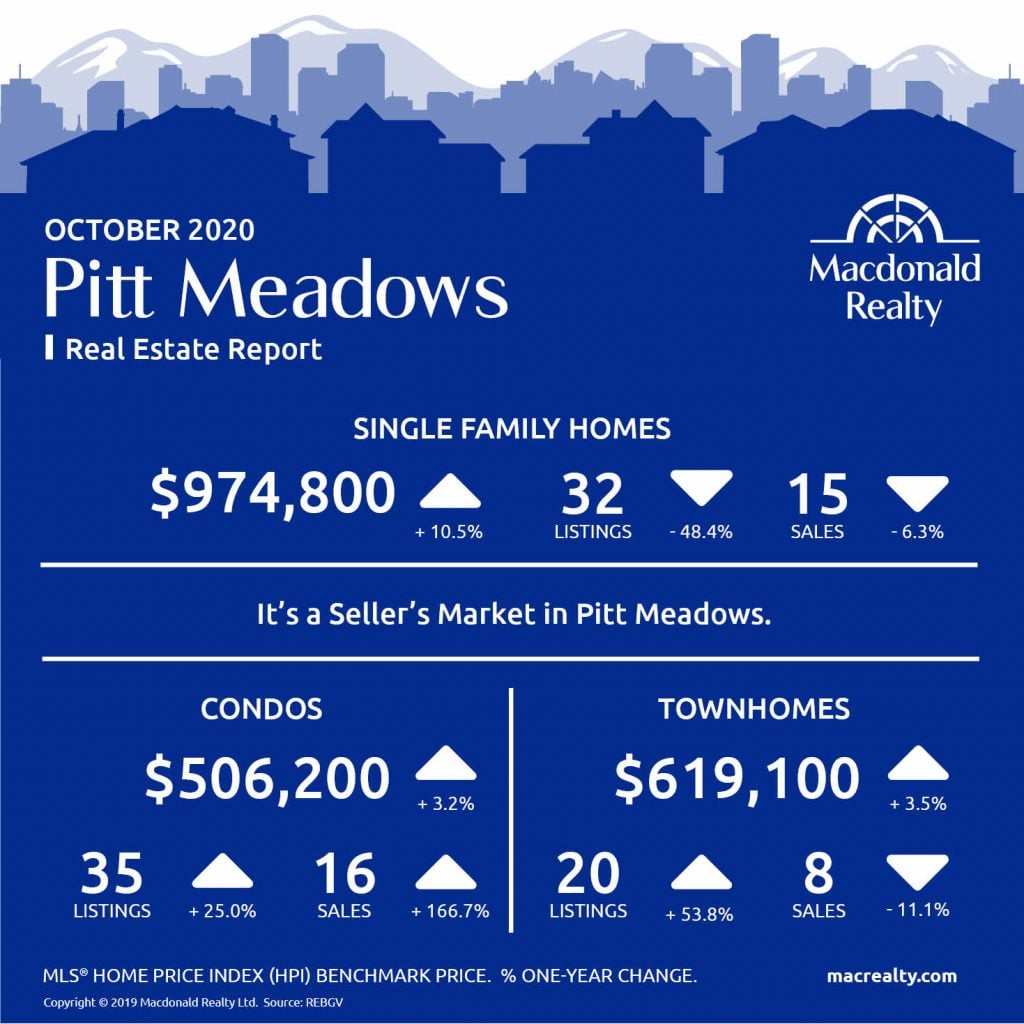
Pitt Meadows
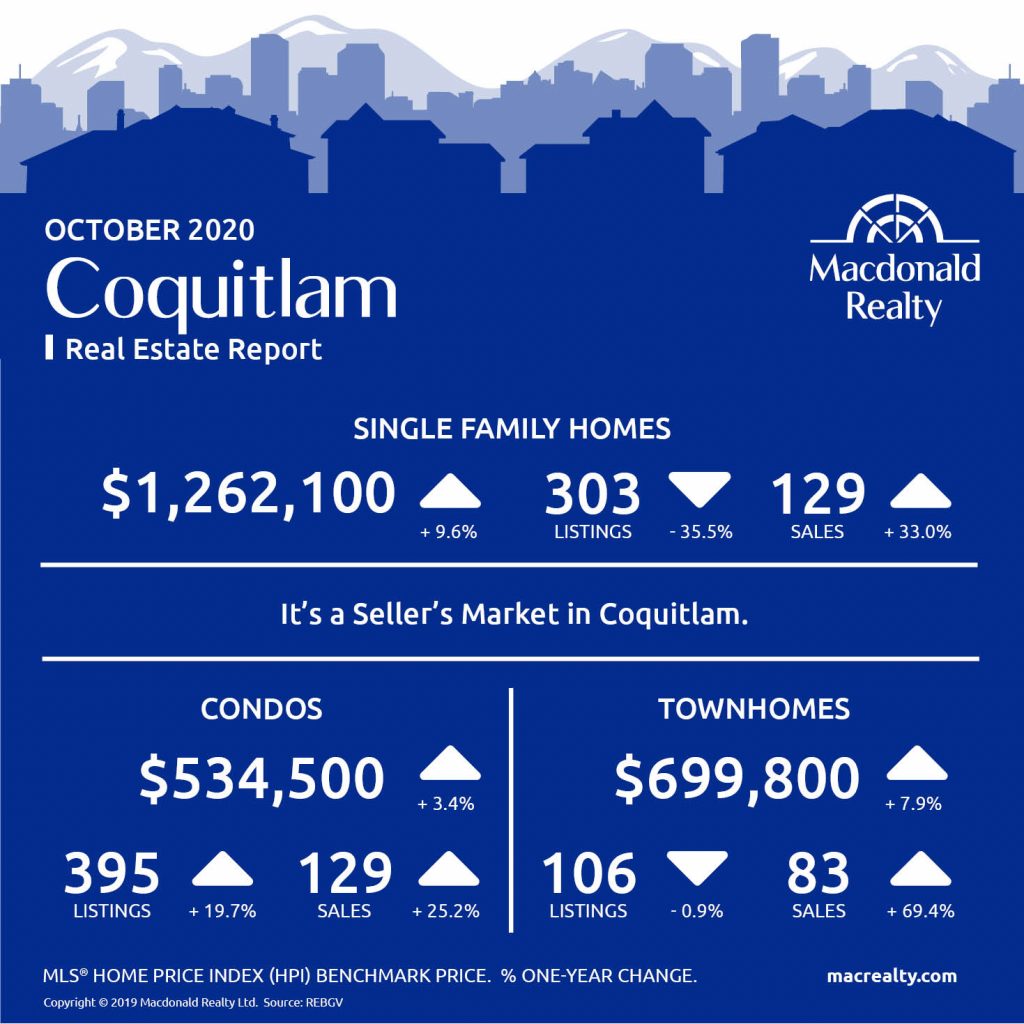
Coquitlam
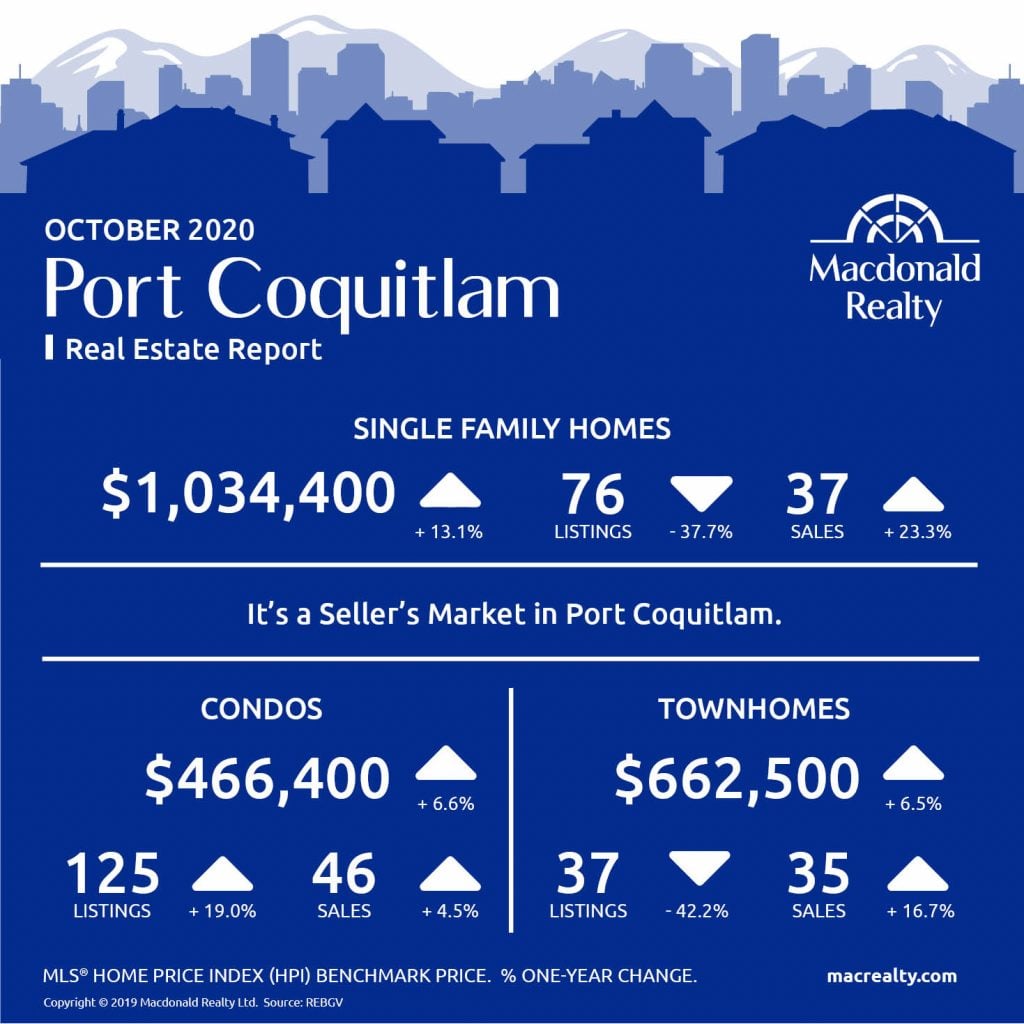
Port Coquitlam
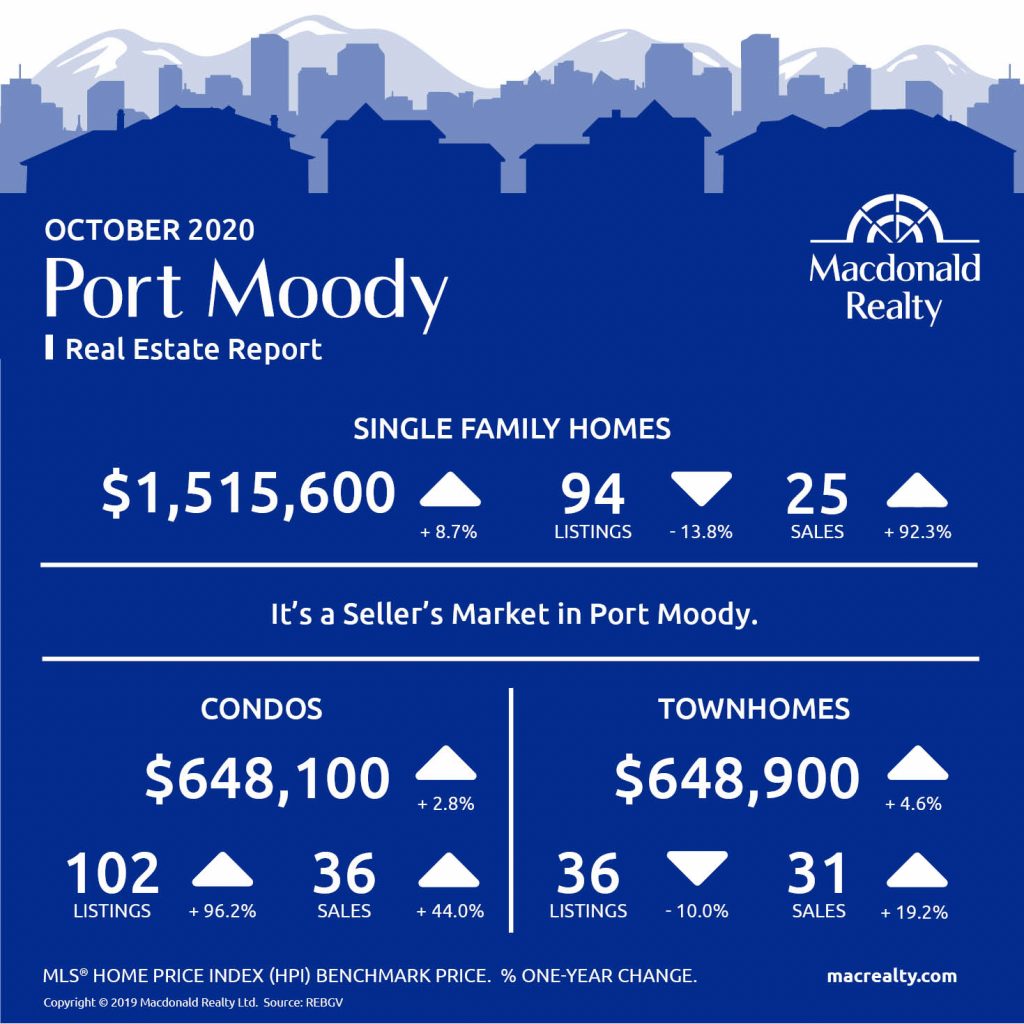
Port Moody
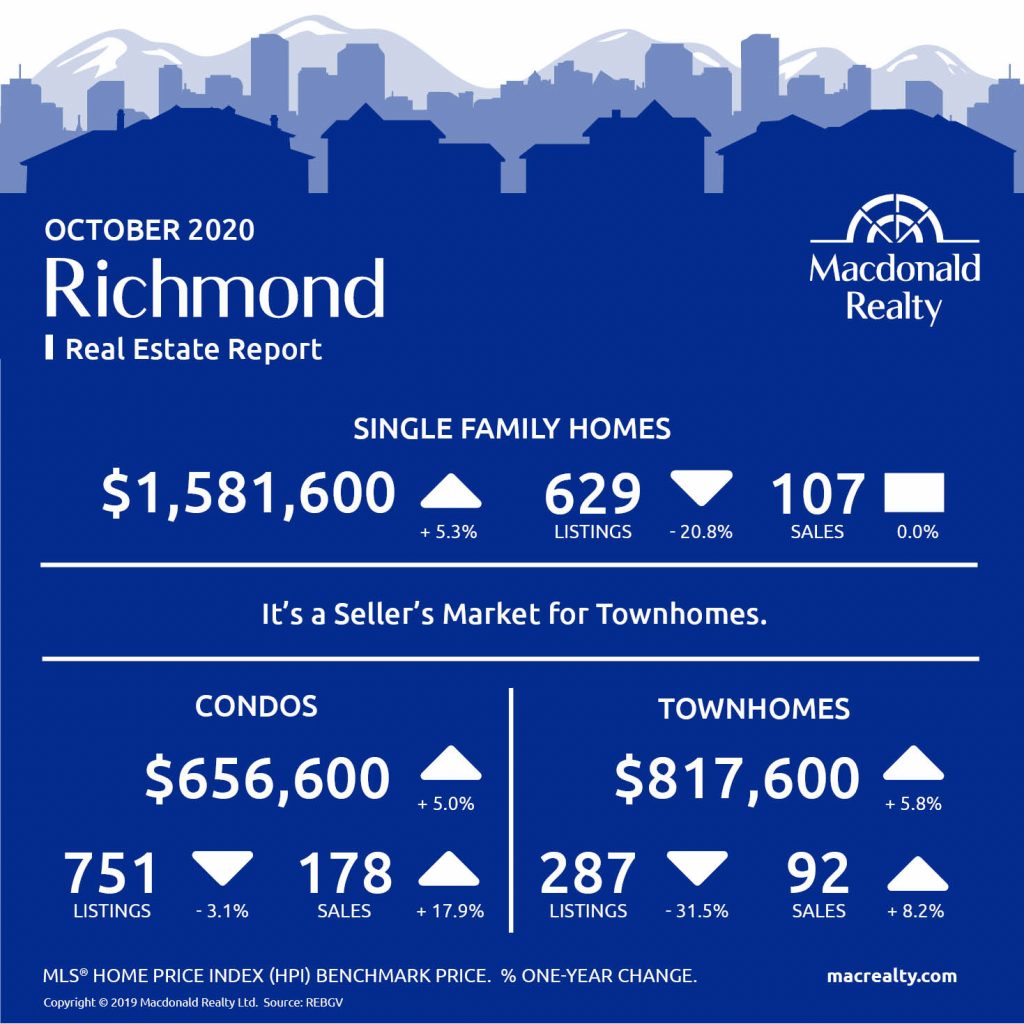
Richmond
Tsawwassen

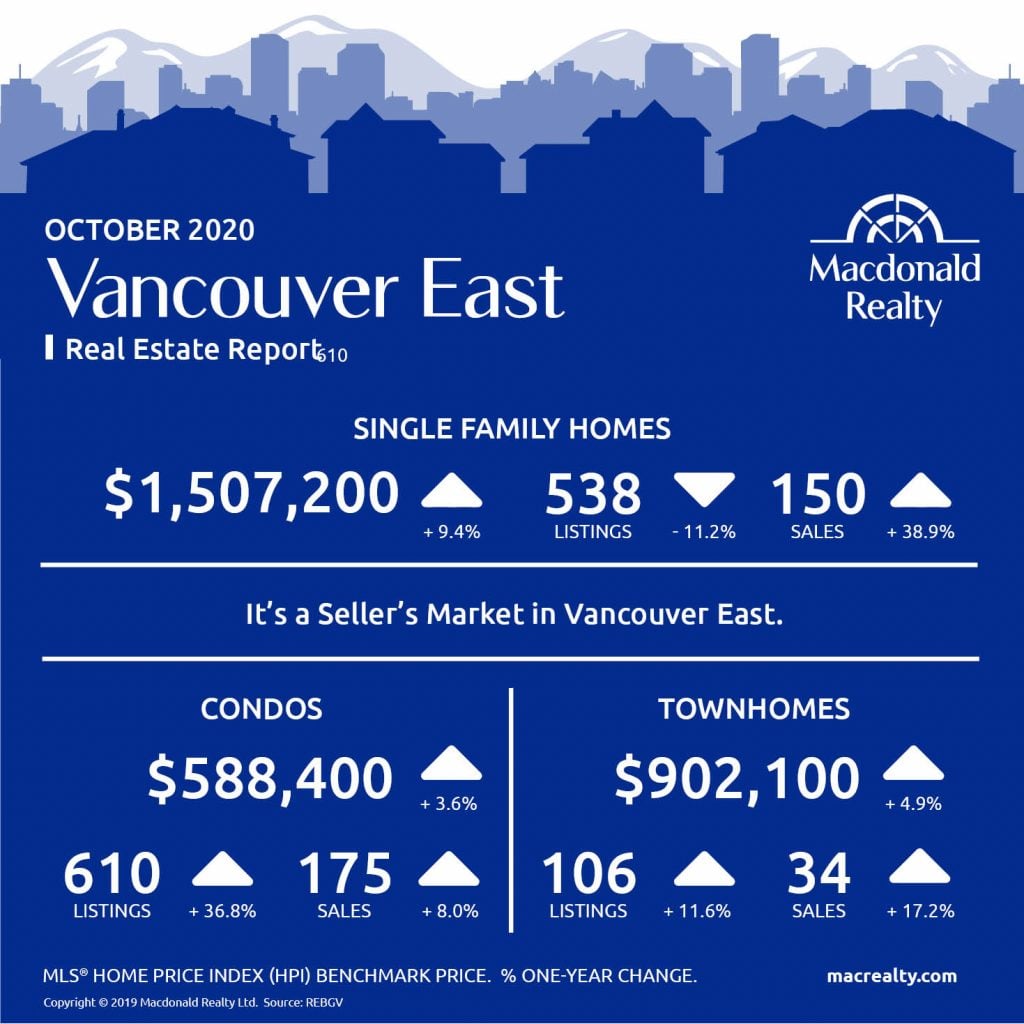
Vancouver East
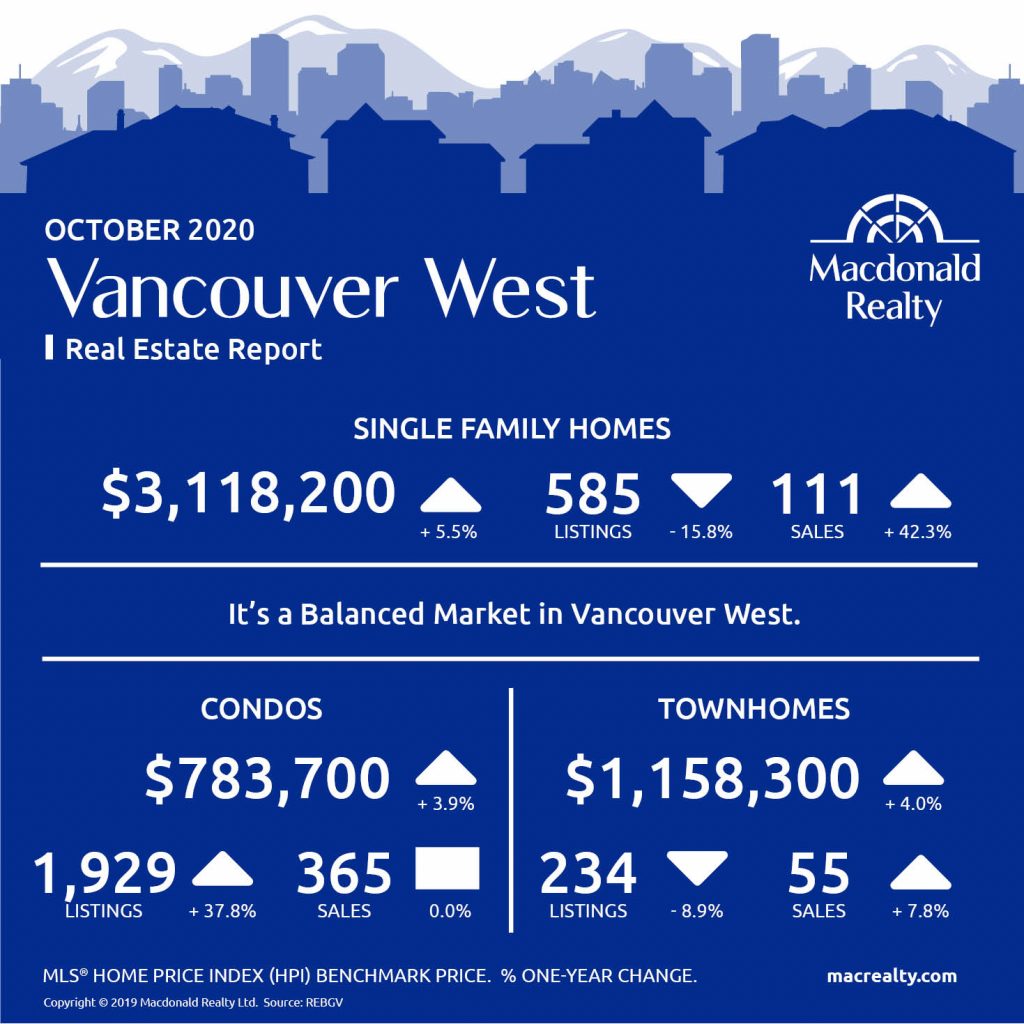
Vancouver West
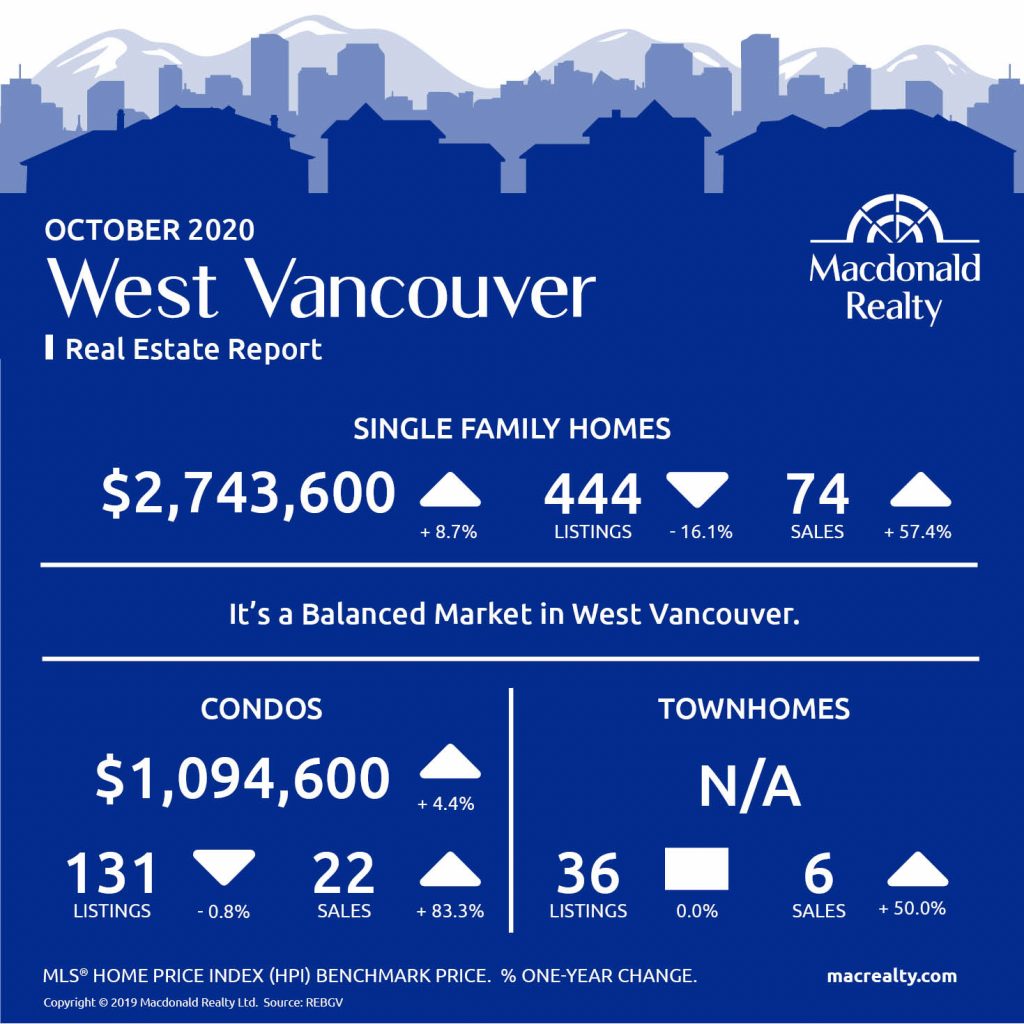
West Vancouver
Looking for more information about the real estate market in specific neighbourhoods in the Greater Vancouver?
Macdonald Realty has offices across the Greater Vancouver. Please email [email protected] or call 1-877-278-3888 to be matched with a REALTOR® working in your area.
MLS® Home Price Index (HPI) Benchmark Price
Average and median home prices are often misinterpreted, are affected by change in the mix of homes sold, and can swing dramatically from month to month (based on the types and prices of properties that sold in a given month). The MLS® HPI overcomes these shortcomings and uses the concept of a benchmark home, a notional home with common attributes of typical homes in a defined area. Visit www.housepriceindex.ca for more information.
This blog post is based on market data provided by the Real Estate Board of Greater Vancouver (REBGV) www.rebgv.org
by Macrealty Marketing Team | Nov 10, 2020 | Market Updates
Here are the latest real estate market statistics from Macdonald Realty on Squamish, Whistler, and Sunshine Coast listings and sales in October 2020.
Find all the infographics related to the May Market Statistics by visiting the Facebook Album.
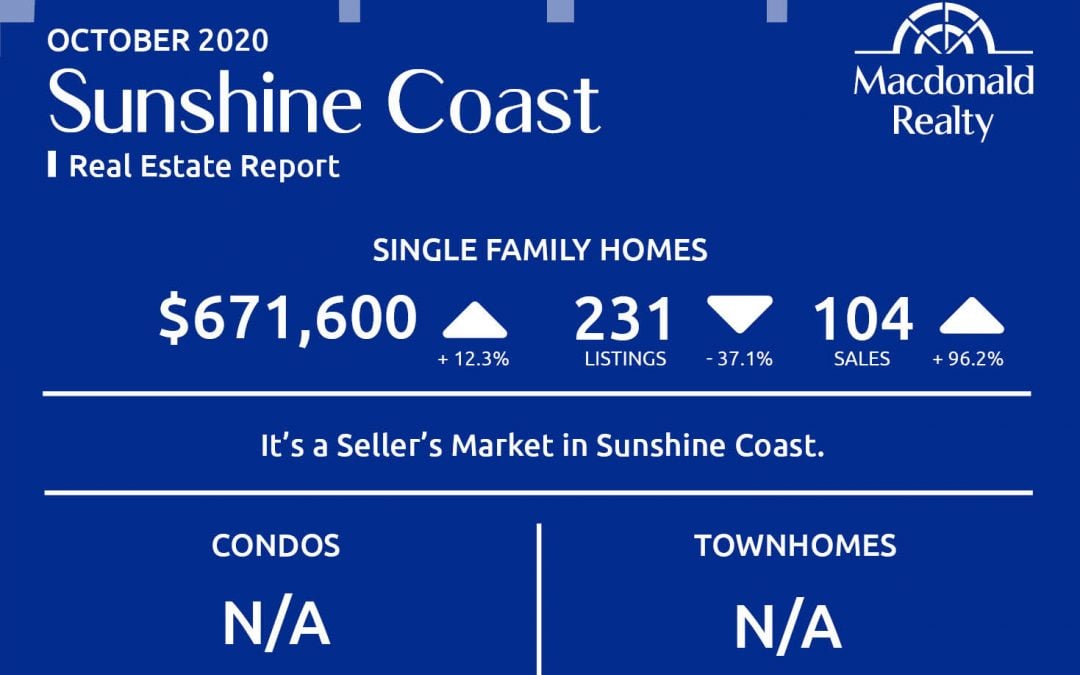
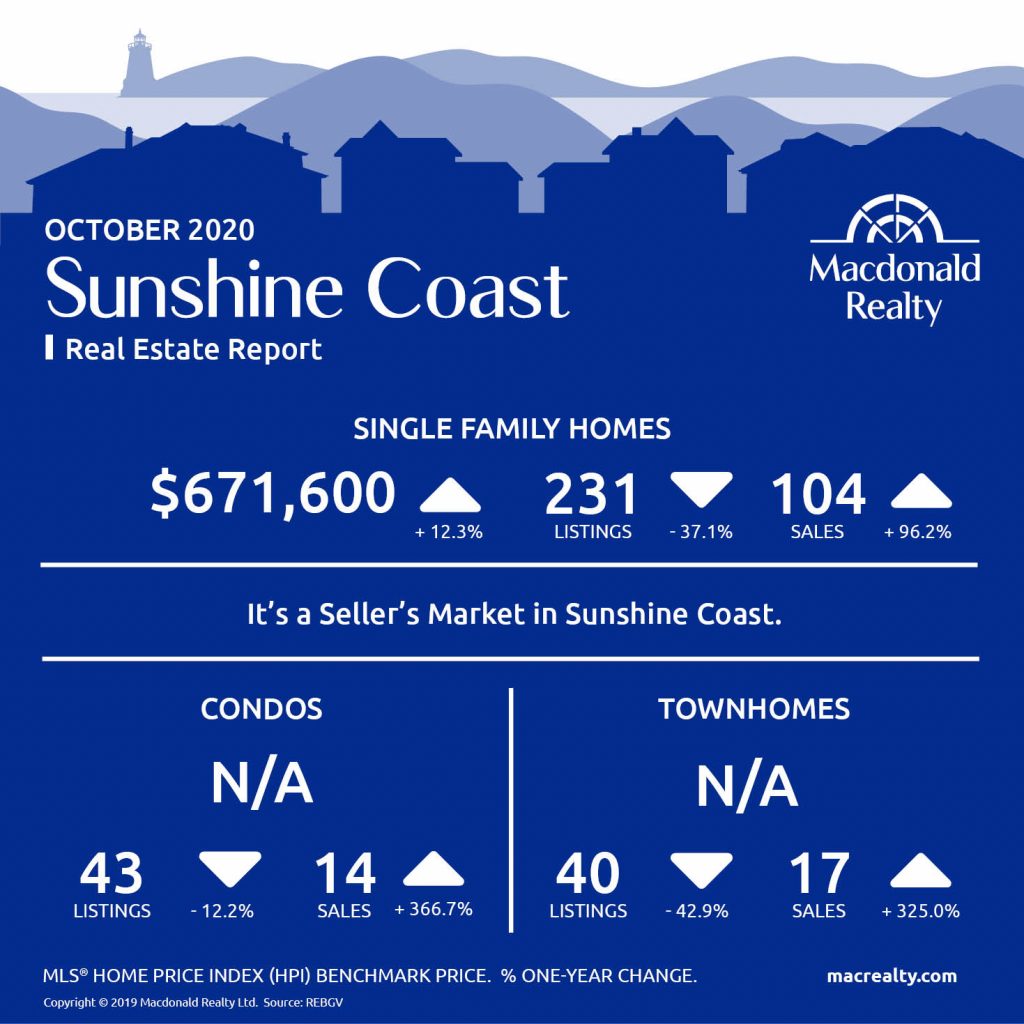
Sunshine Coast
In October 2020, there were 104 sales of detached homes and 231 active listings in Whistler. The benchmark sale price was $671,600.
The condo market had 14 sales and 43 active listings at the end of the month.
The townhome market had 17 sales and, the active listings were 40.
It’s a Seller’s market in Sunshine Coast.
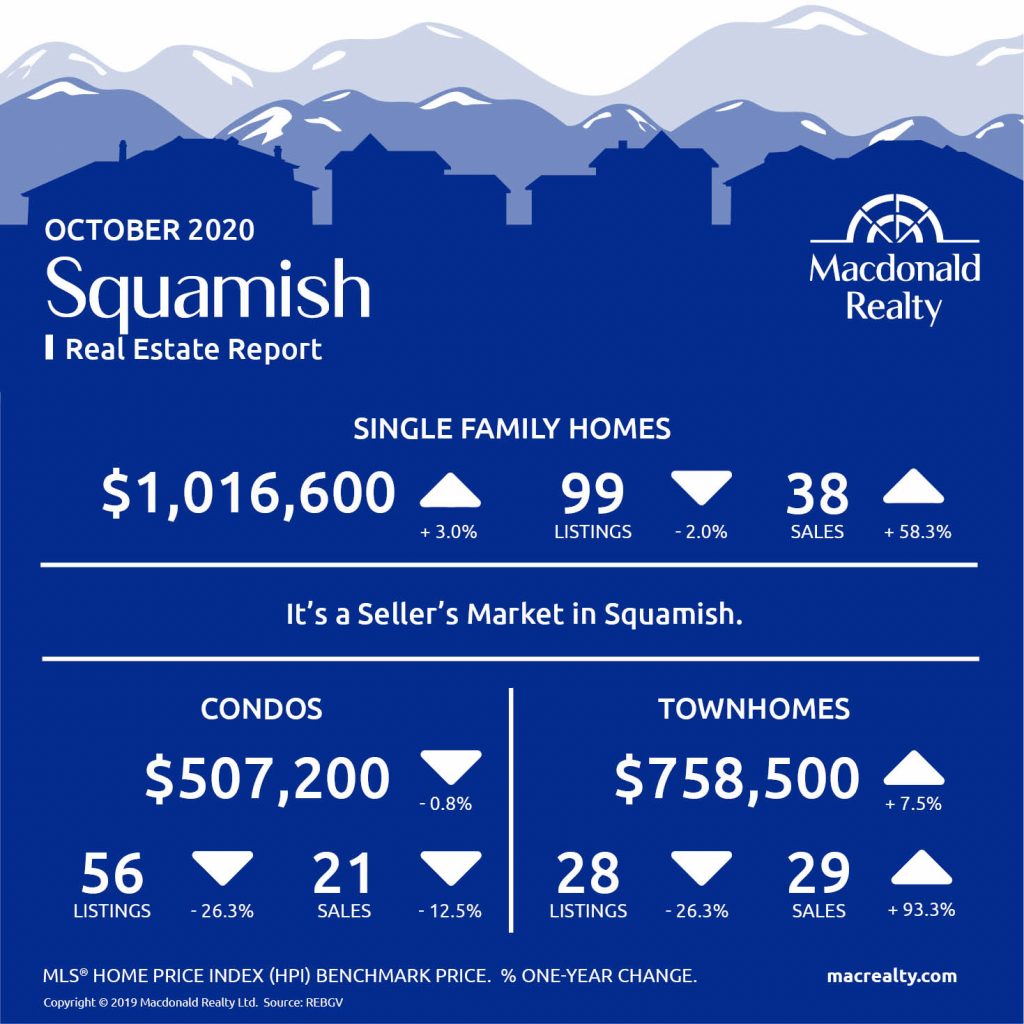
Squamish
In October 2020, there were 38 sales of detached homes and 99 active listings in Whistler. The benchmark sale price was $1,016,600.
The condo market had 21 sales and 56 active listings at the end of the month.
The townhome market had 29 sales and, the active listings were 28.
It’s a Seller’s market in Squamish.
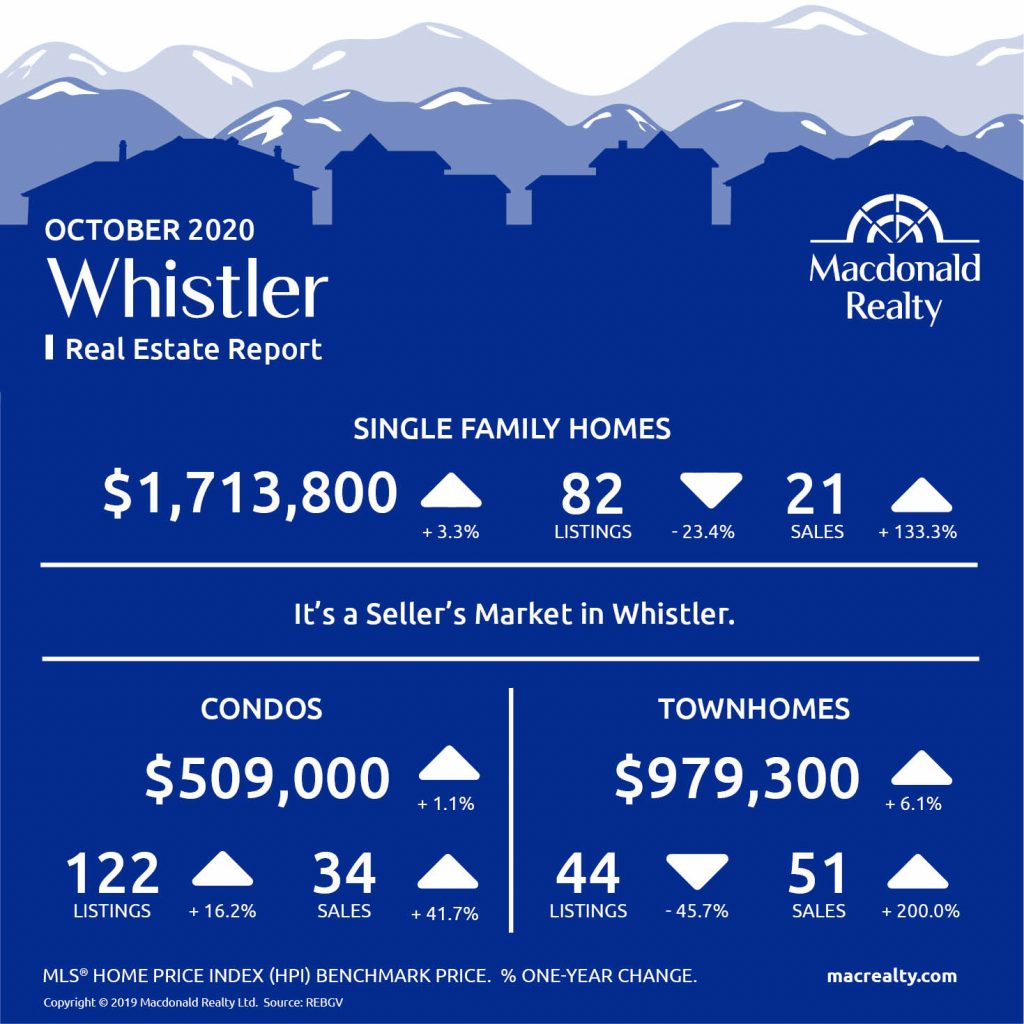
Whistler
In October 2020, there were 21 sales of detached homes and 82 active listings in Whistler. The benchmark sale price was $1,713,800.
The condo market had 34 sales and 122 active listings at the end of the month.
The townhome market had 51 sales and, the active listings were 44.
It’s a Seller’s market in Whistler.
Looking for more information about the real estate market in specific neighbourhoods in Squamish, Whistler, and Sunshine Coast? Macdonald Realty has offices in Squamish, Whistler, and Sunshine Coast. Please email [email protected] or call 1-877-278-3888 to be matched with a REALTOR® working in your area.
MLS® Home Price Index (HPI) Benchmark Price
Average and median home prices are often misinterpreted, are affected by change in the mix of homes sold, and can swing dramatically from month to month (based on the types and prices of properties that sold in a given month). The MLS® HPI overcomes these shortcomings and uses the concept of a benchmark home, a notional home with common attributes of typical homes in a defined area. Visit www.housepriceindex.ca for more information.
This blog post is based on market data provided by the Real Estate Board of Greater Vancouver (REBGV) www.rebgv.org
by Macrealty Marketing Team | Nov 4, 2020 | Market Updates
Here are the latest real estate market statistics from Macdonald Realty on Okanagan listings and sales in October 2020.
Find the infographics by visiting the Facebook Album.
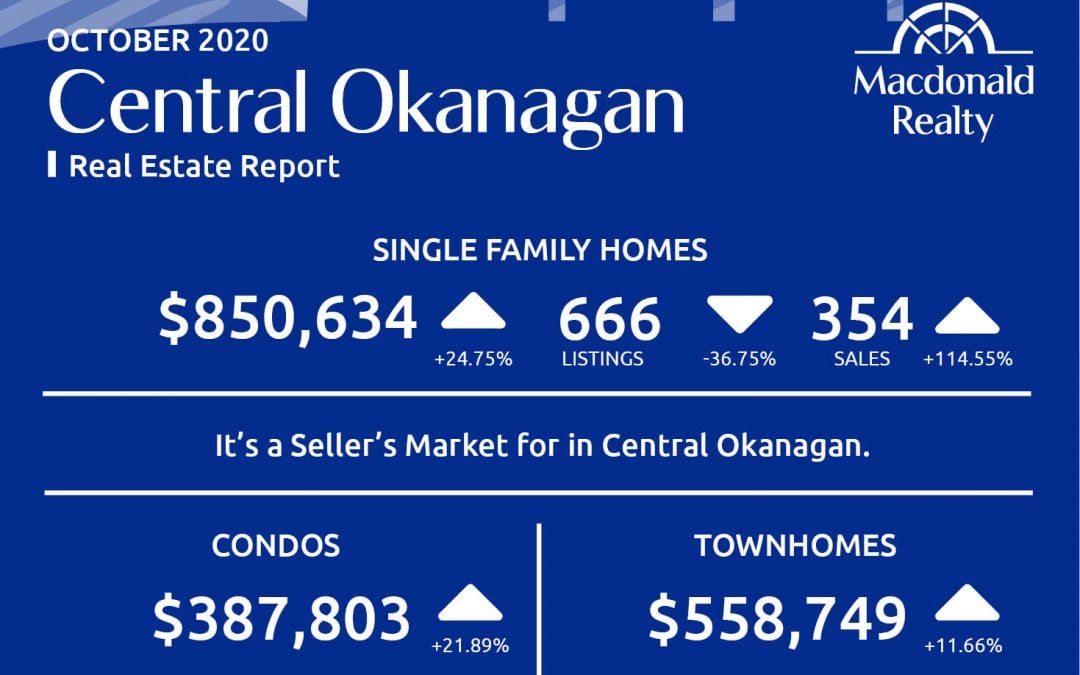
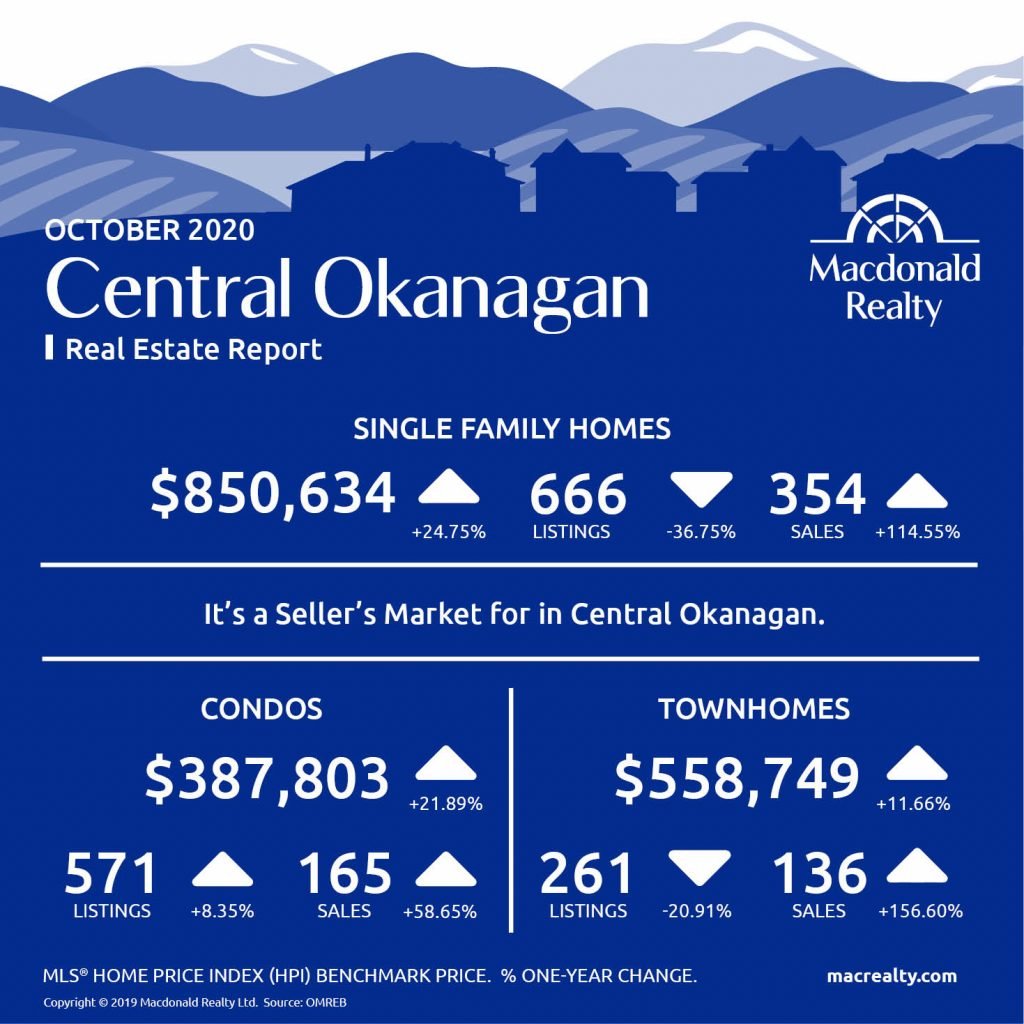
Central Okanagan: Kelowna and Lake Country
There were 354 sales, 666 active listings, and an $850,634 average sale price for detached homes in the Central Okanagan market, including Kelowna and Lake Country.
The condo market featured 165 sales and 571 active listings at the end of the month. The average sale price was $387,803.
Townhome sales were 136, active listings were 261and the average sale price was $558,749.
It’s a seller’s market in Central Okanagan.
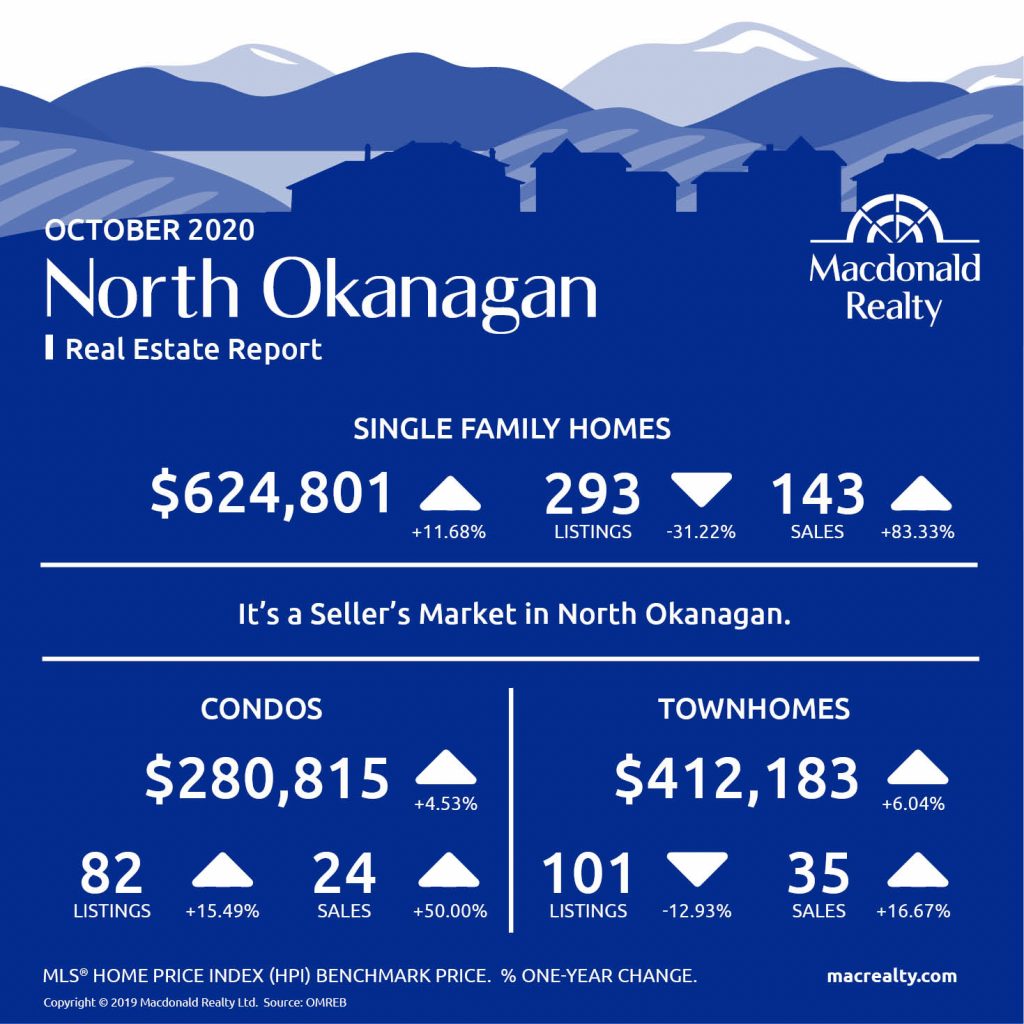
North Okanagan: Vernon and surrounding area
In North Okanagan, including Vernon and the surrounding area and the average sale price was $624,801. At the end of the month, there were 143 sales and 293 active listings.
There were 24 sales and 82 active listings for condos. The average sale price was $280,815.
In comparison, townhomes featured 35 sales, 101 active listings and a $412,183 average sale price.
It’s a seller’s market in North Okanagan.
Looking for more information about the real estate market in specific neighbourhoods in Okanagan?
Macdonald Realty has offices in Kelowna and across BC. Please email [email protected] or call 1-877-278-3888 to be matched with a REALTOR® working in your area.
This blog post is based on market data provided by Okanagan Mainline Real Estate Board (OMREB) www.omreb.com.
by Macrealty Marketing Team | Nov 3, 2020 | Market Updates
According to the Fraser Valley Real Estate Board the housing market activity reaches historic levels in October.
The Fraser Valley Real Estate Board processed 2,370 sales of all property types on its Multiple Listing Service® (MLS®) in October, an increase of 48.9% compared to the 1,592 sales in October of last year, and a 6.2% increase month-over-month compared to the 2,231 sales in September.
Fraser Valley Real Estate Board reported that in October the board finished with 6,872 active listings, a decrease of 6.8% compared to September and a decrease of 7.1% year-over-year. Last month’s active listings were 11.9% below the ten-year average for October.
Chris Shields, President of the Board, observes, “The situation is unprecedented. We are in the middle of a pandemic and in many of our communities we are seeing a strong seller’s market for townhomes and single-family homes priced correctly. For example, in Langley, our current supply of detached homes would sell in 1.4 months if no new listings became available. And for Mission townhomes, we have zero months of inventory.
Find all the infographics related to the May Market Statistics by visiting the Facebook Album.
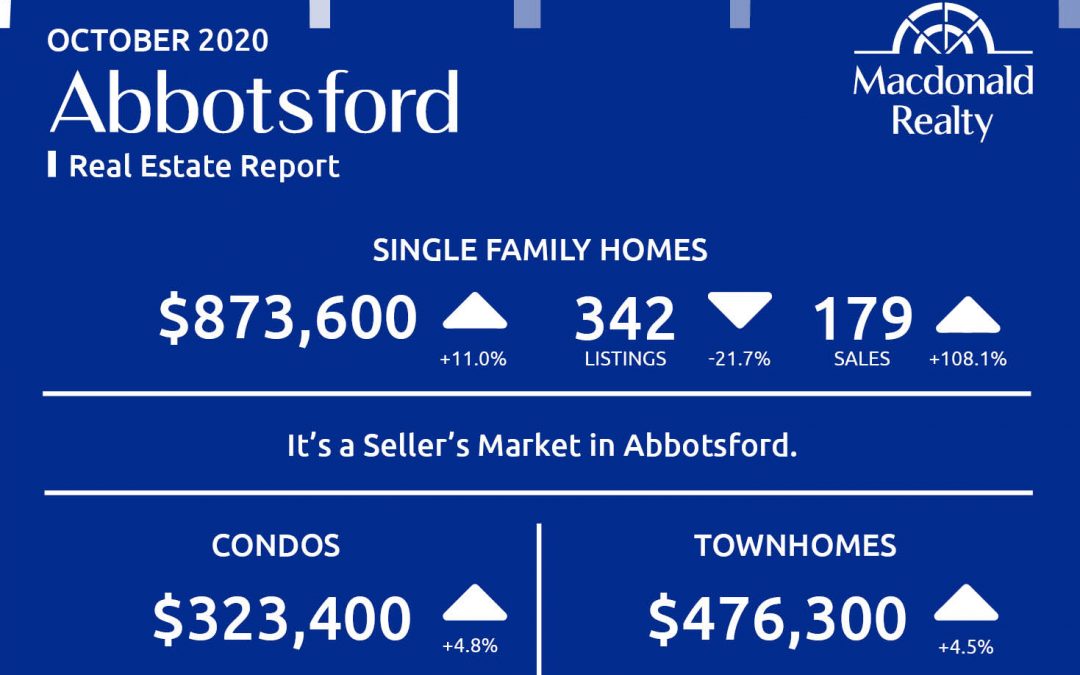
Abbotsford

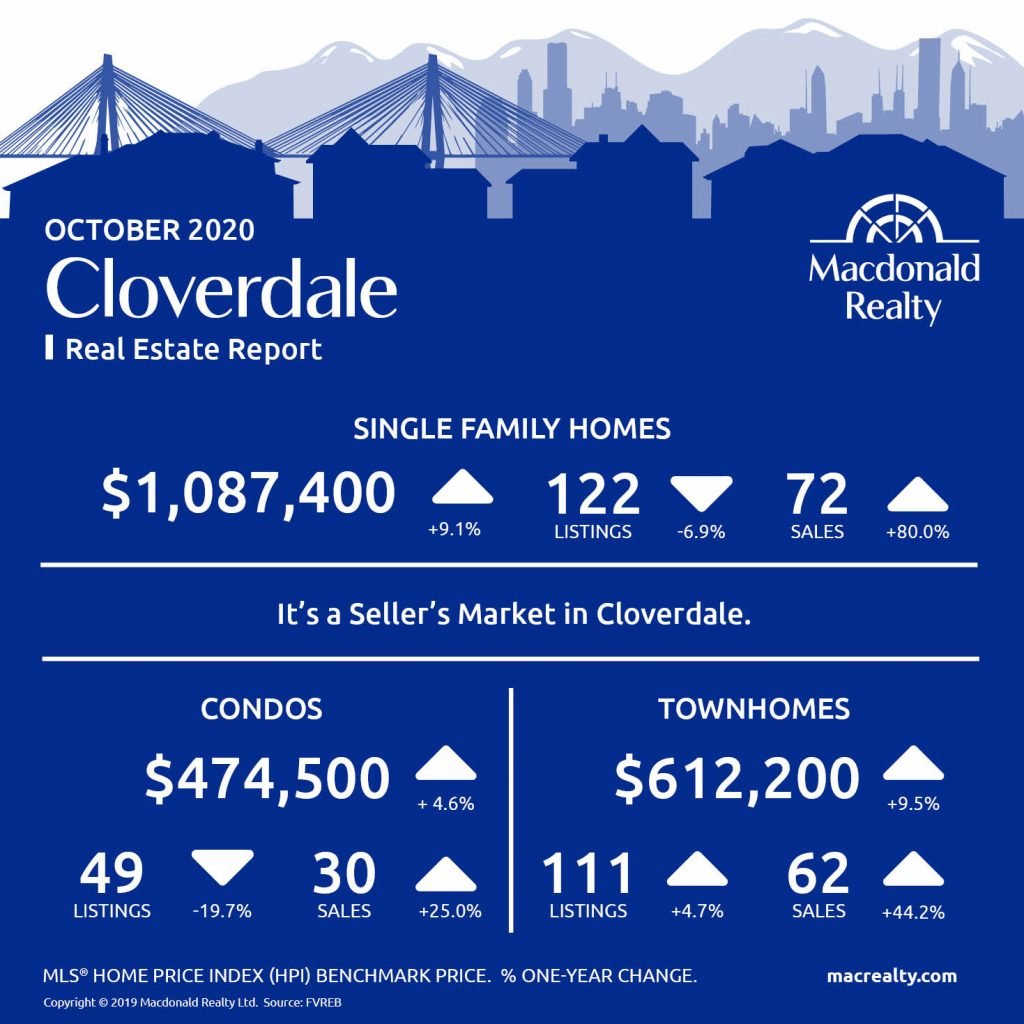
Cloverdale
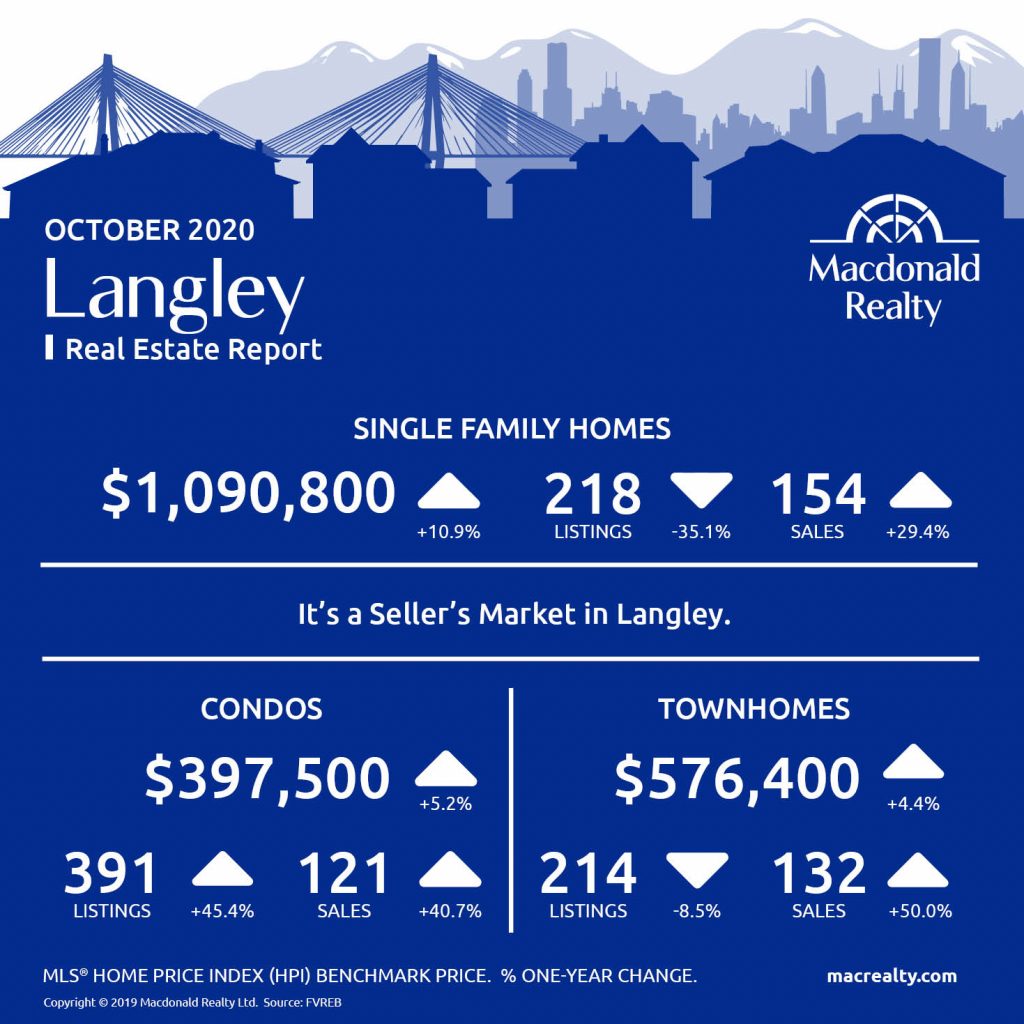
Langley
Mission

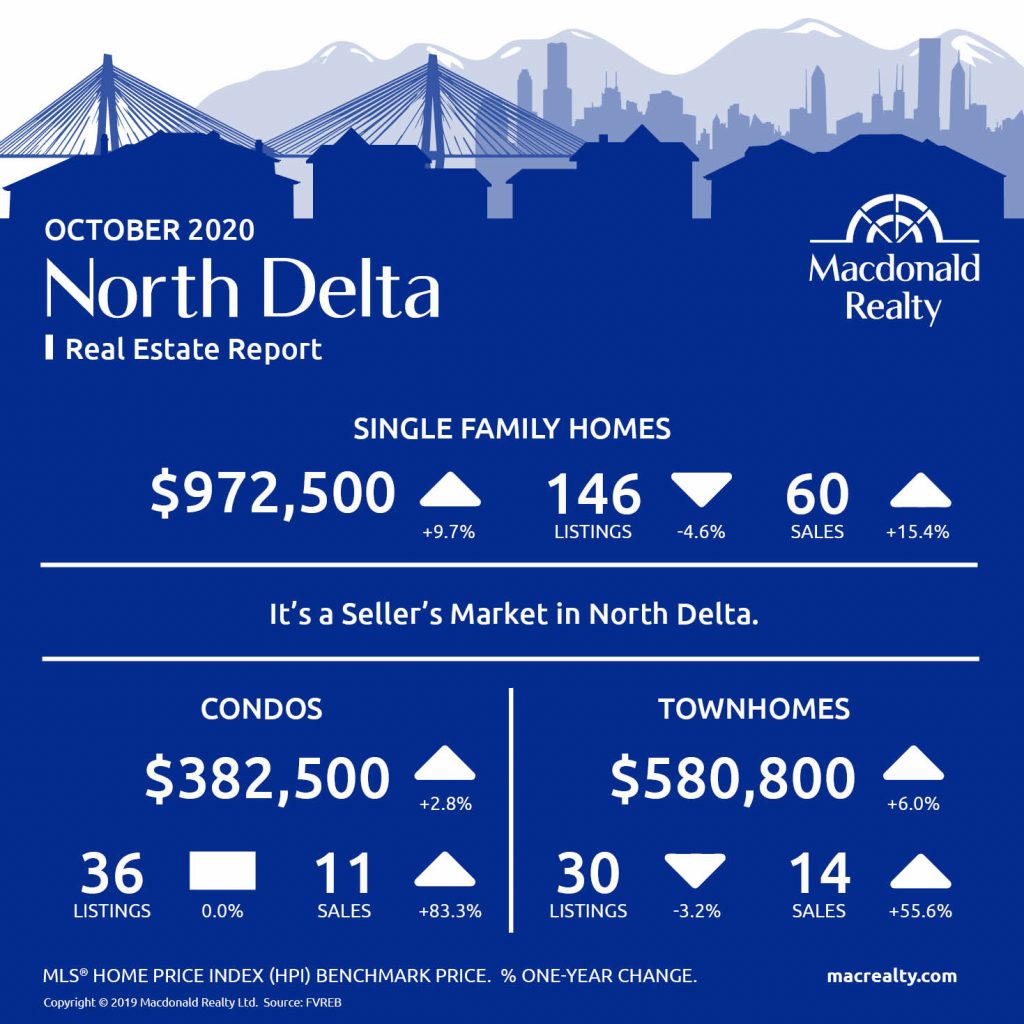
North Delta
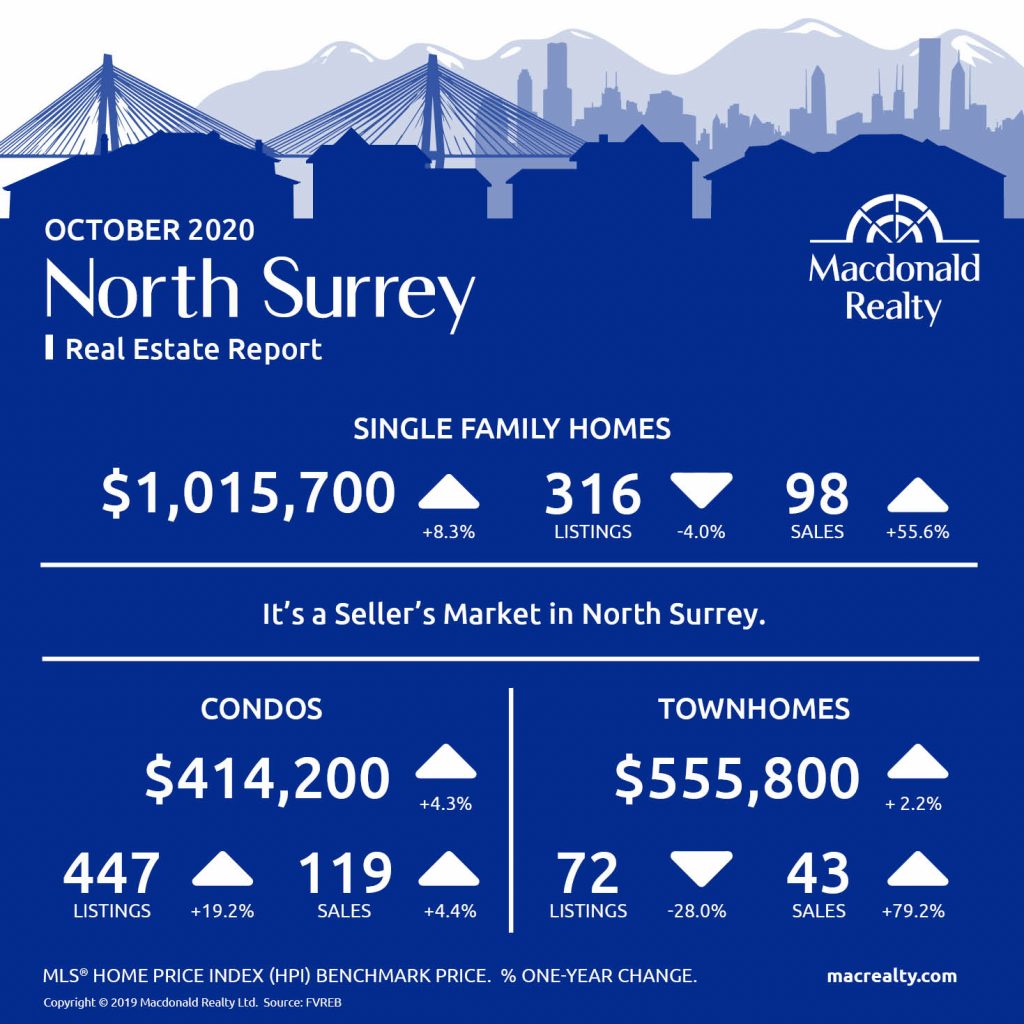
North Surrey
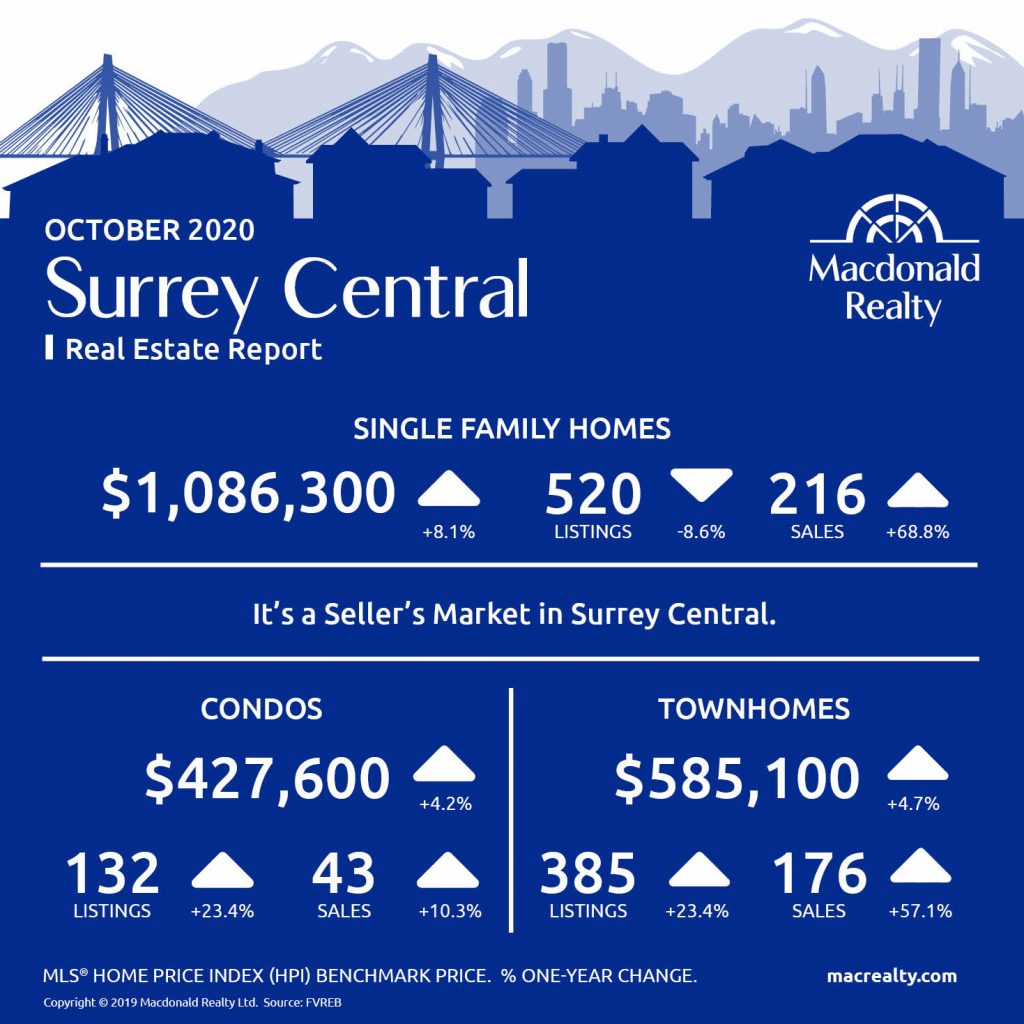
Surrey Central
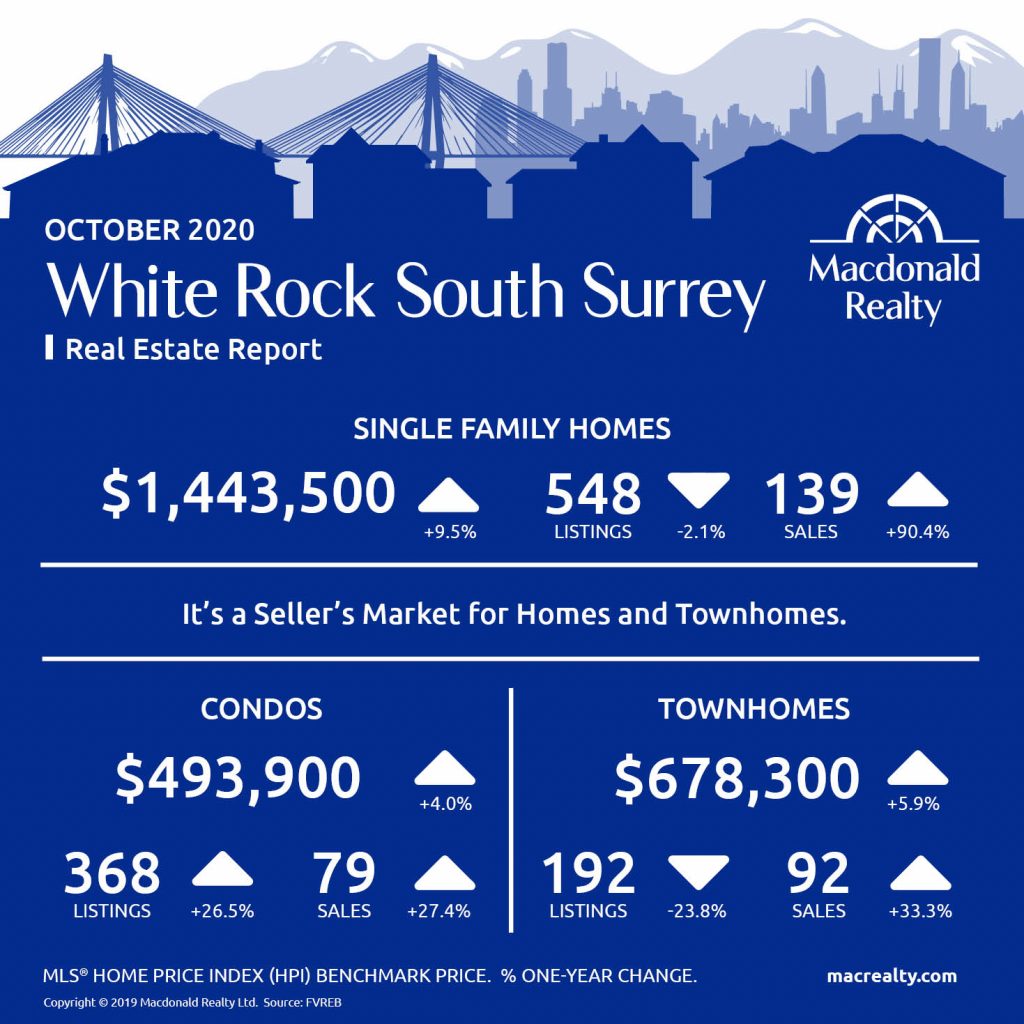
White Rock / South Surrey
Looking for more information about the real estate market in specific neighbourhoods in Surrey, Langley and Fraser Valley?
Macdonald Realty has offices in North Delta, White Rock/South Surrey, and Langley. Please email [email protected] or call 1-877-278-3888 to be matched with a REALTOR® working in your area.
MLS® Home Price Index (HPI) Benchmark Price
Average and median home prices are often misinterpreted, are affected by change in the mix of homes sold, and can swing dramatically from month to month (based on the types and prices of properties that sold in a given month). The MLS® HPI overcomes these shortcomings and uses the concept of a benchmark home, a notional home with common attributes of typical homes in a defined area. Visit www.housepriceindex.ca for more information.
This blog post is based on market data provided by the Fraser Valley Real Estate Board (FVREB) www.fvreb.bc.ca

