by Macrealty Marketing Team | Jul 7, 2020 | Market Updates
Here are the latest real estate market statistics from Macdonald Realty on Squamish, Whistler, and Sunshine Coast listings and sales in June 2020.
Find all the infographics related to the May Market Statistics by visiting the Facebook Album.
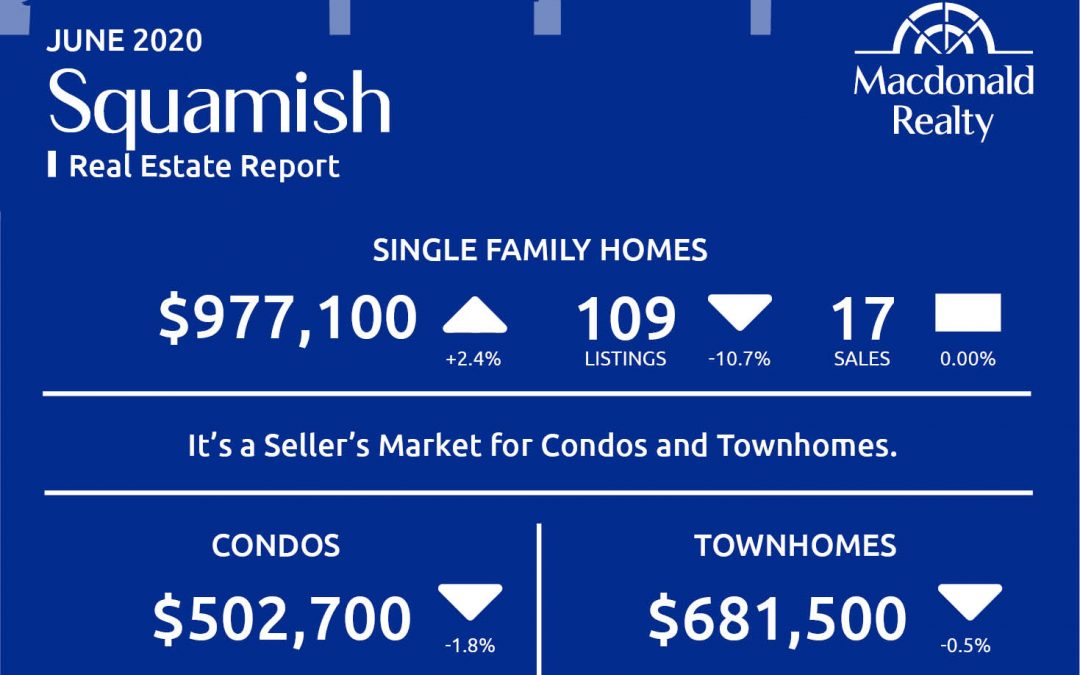
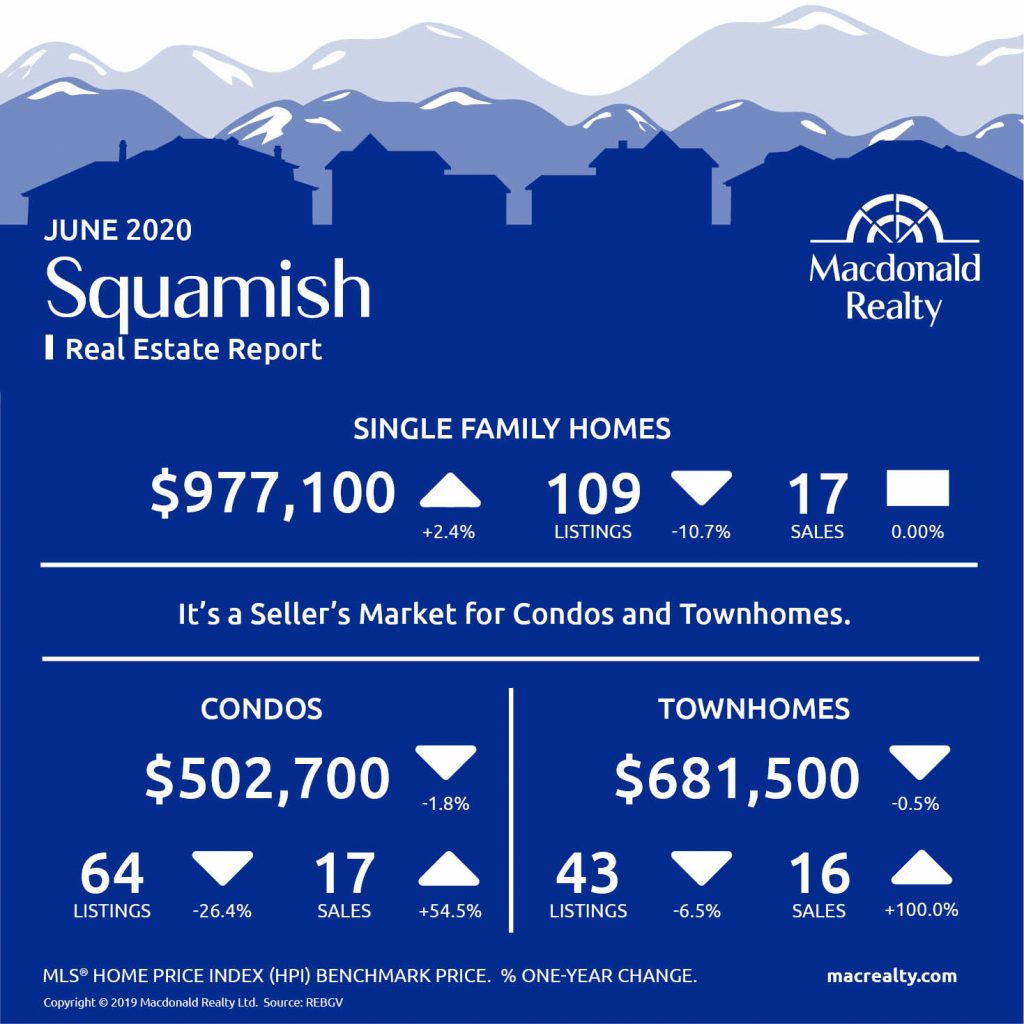
Squamish
In June 2020, there were 17 sales of detached homes and 109 active listings in Squamish. The benchmark sale price was $977,100.
The condo market had 17 sales and 64 active listings at the end of the month. The benchmark sale price was $502,700.
The townhome market had 16 sales and, the active listings were 43. The benchmark sale price was $681,500.
It’s a seller’s market for condos and townhomes in Squamish.
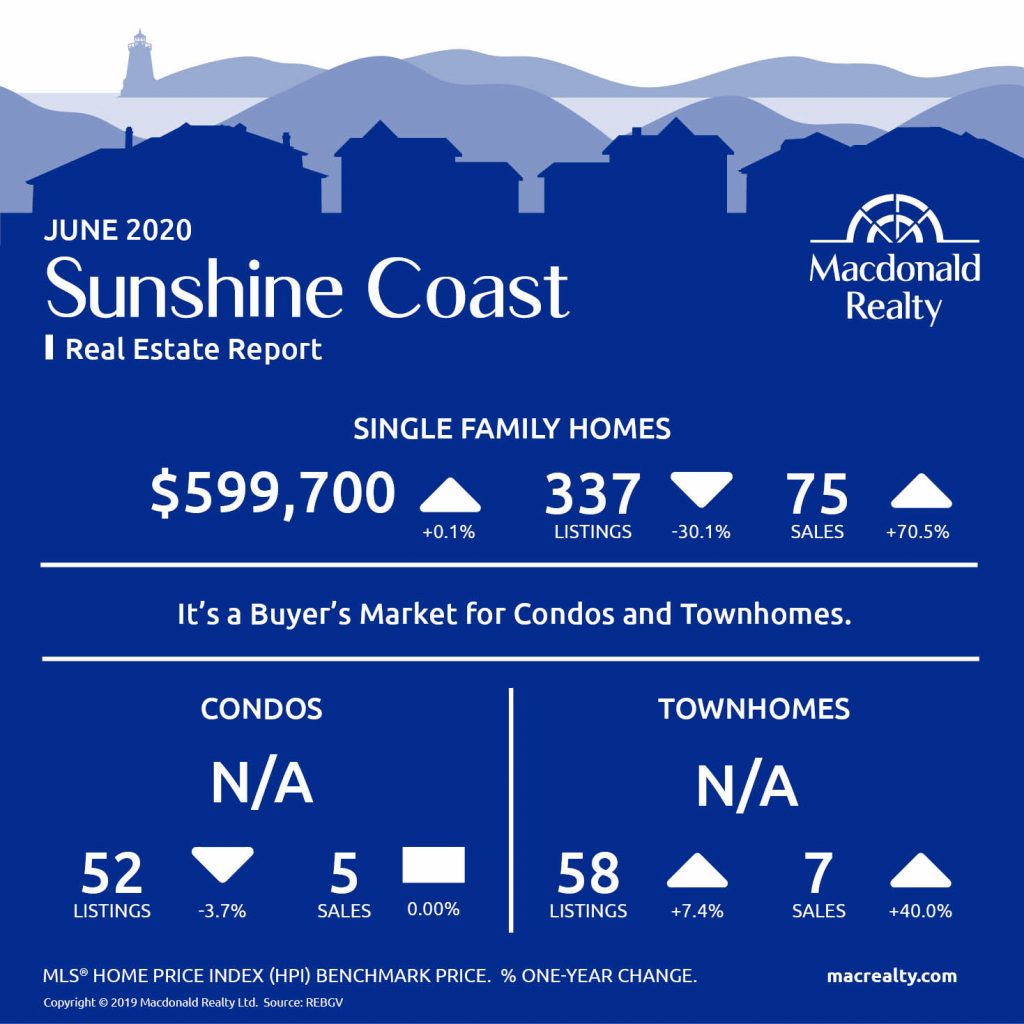
Sunshine Coast
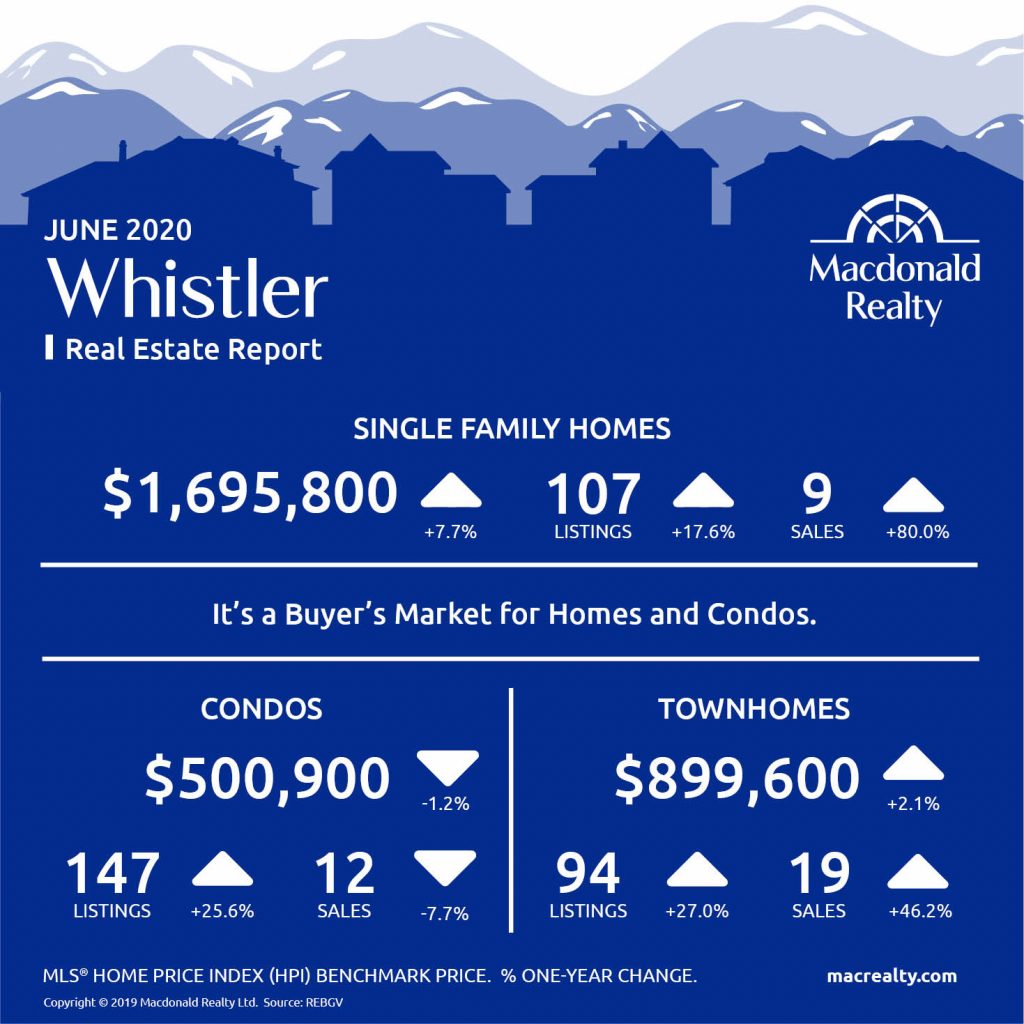
Whistler
Looking for more information about the real estate market in specific neighbourhoods in Squamish, Whistler, and Sunshine Coast? Macdonald Realty has offices in Squamish, Whistler, and Sunshine Coast. Please email [email protected] or call 1-877-278-3888 to be matched with a REALTOR® working in your area.
MLS® Home Price Index (HPI) Benchmark Price
Average and median home prices are often misinterpreted, are affected by change in the mix of homes sold, and can swing dramatically from month to month (based on the types and prices of properties that sold in a given month). The MLS® HPI overcomes these shortcomings and uses the concept of a benchmark home, a notional home with common attributes of typical homes in a defined area. Visit www.housepriceindex.ca for more information.
This blog post is based on market data provided by the Real Estate Board of Greater Vancouver (REBGV) www.rebgv.org
by Macrealty Marketing Team | Jul 7, 2020 | Market Updates
Here are the latest real estate market statistics from Macdonald Realty on Okanagan listings and sales in June 2020.
Find the infographics by visiting the Facebook Album.
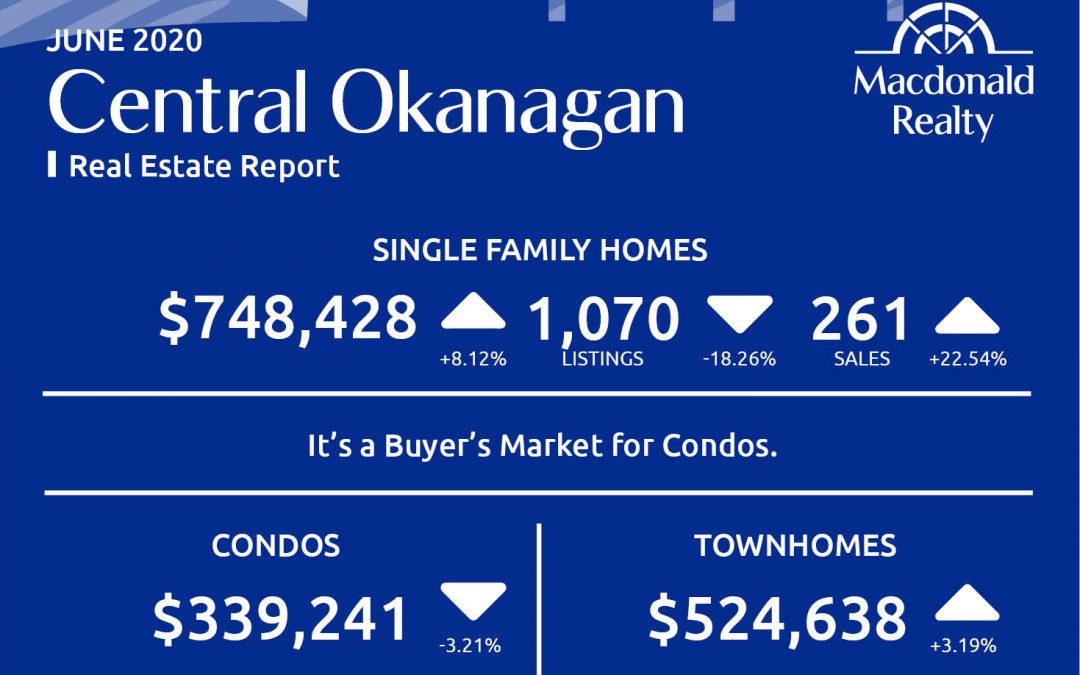
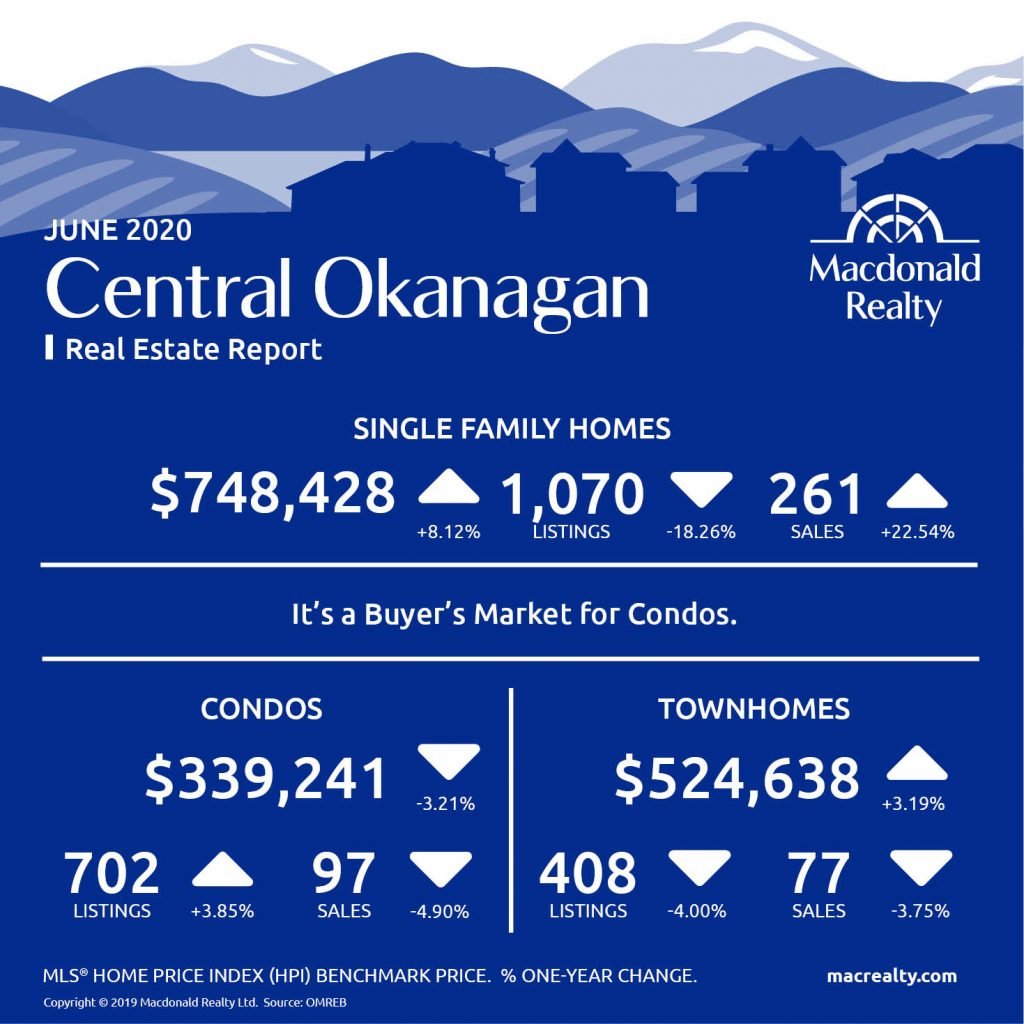
Central Okanagan: Kelowna and Lake Country
There were 261 sales, 1,070 active listings, and a $748,428 average sale price for detached homes in the Central Okanagan market, including Kelowna and Lake Country.
The condo market featured 97 sales and 702 active listings at the end of the month. The average sale price was $339,241.
Townhome sales were 77, active listings were 408 and the average sale price was $524,638.
It’s a buyer’s market for Condos in Central Okanagan.
North Okanagan: Vernon and surrounding area
In North Okanagan, including Vernon and the surrounding area and the average sale price was $563,028. At the end of the month, there were 106 sales and 463 active listings.
There were 17 sales and 67 active listings for condos. The average sale price was $221,215.
In comparison, townhomes featured 34 sales, 144 active listings and a $385,894 average sale price.
It’s a seller’s market for condos in North Okanagan. 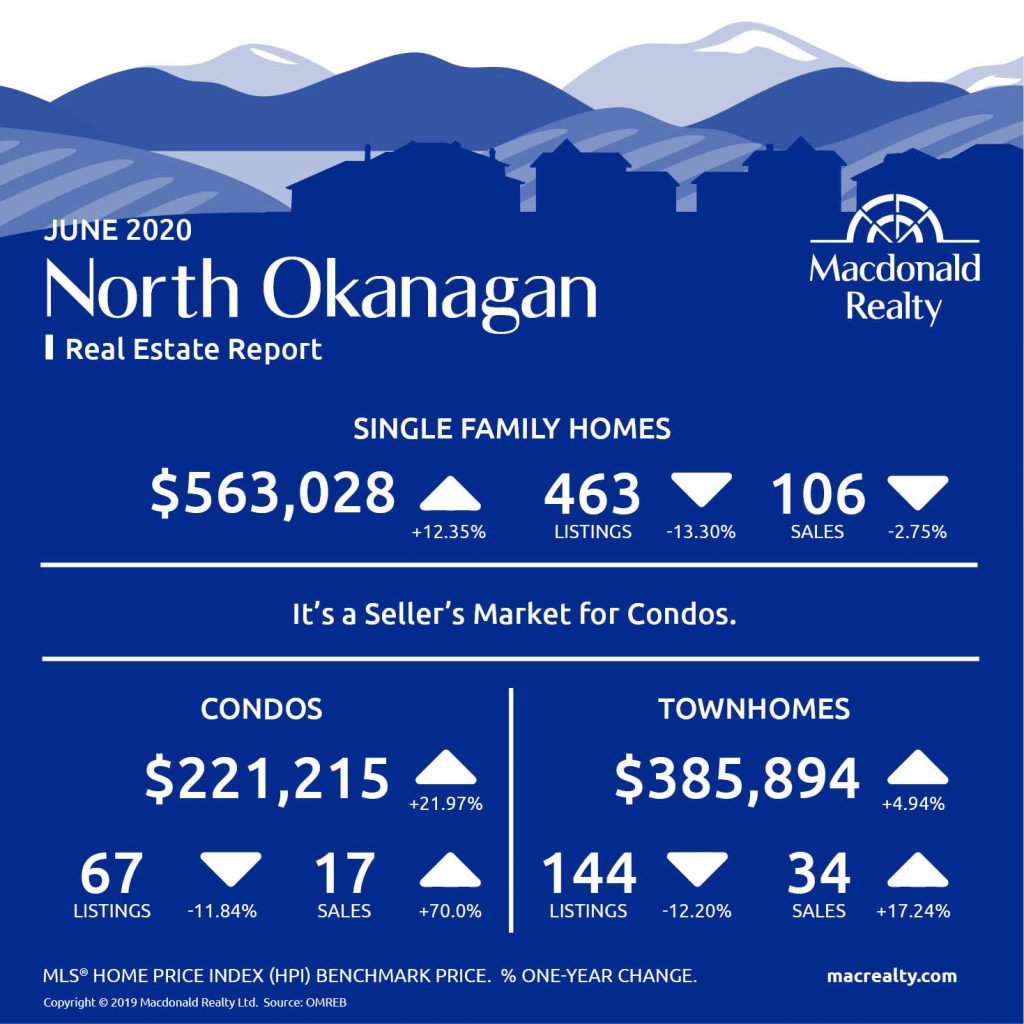
Looking for more information about the real estate market in specific neighbourhoods in Okanagan?
Macdonald Realty has offices in Kelowna and across BC. Please email [email protected] or call 1-877-278-3888 to be matched with a REALTOR® working in your area.
This blog post is based on market data provided by Okanagan Mainline Real Estate Board (OMREB) www.omreb.com.
by Macrealty Marketing Team | Jul 7, 2020 | Market Updates
Here are the latest real estate market statistics from Macdonald Realty on Greater Victoria, Parksville/Qualicum, and Nanaimo listings and sales in June 2020.
Find all the infographics related to the February Market Statistics by visiting the Facebook Album.
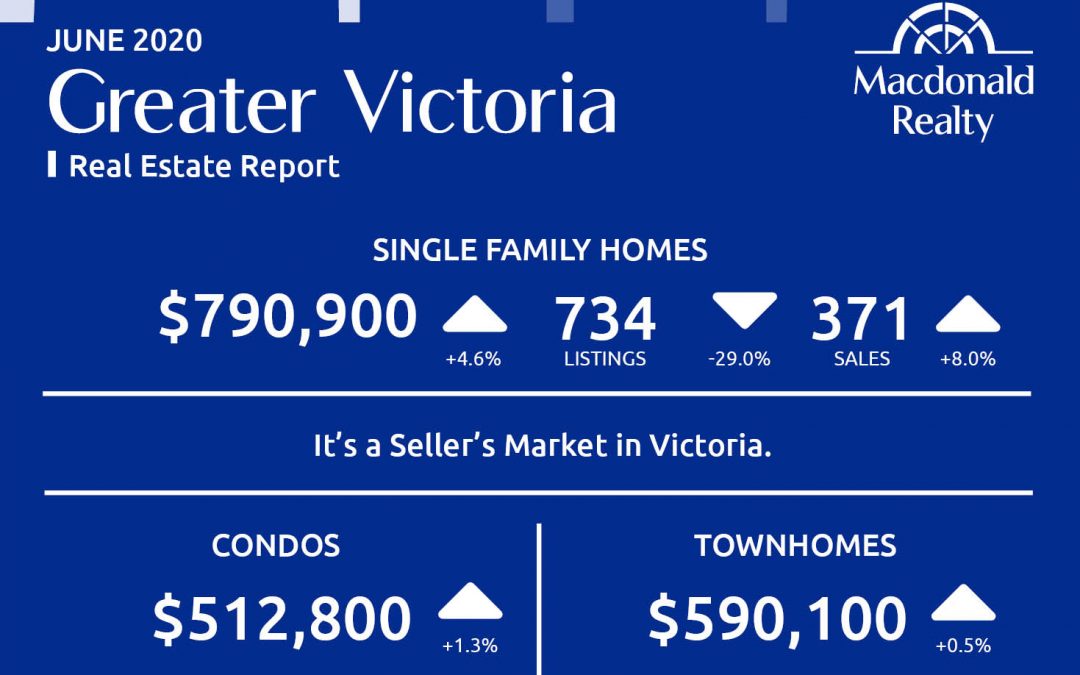
Greater Victoria
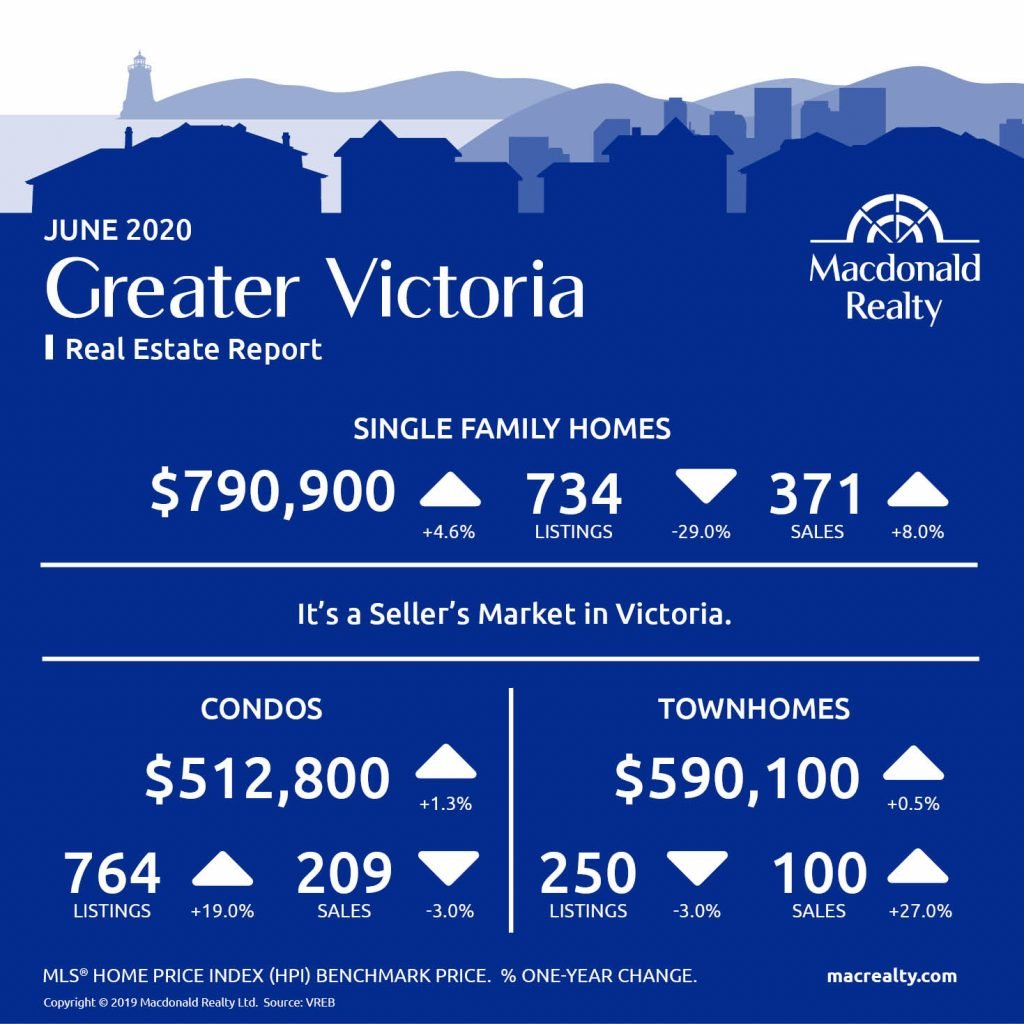
Greater Victoria had 371 sales and 734 active listings for detached homes at the end of the month. The benchmark sales price was $790,900.
The condo market featured 209 sales, 764 active listings, and a benchmark sales price was $512,800.
The townhome market had 100 sales and 250 active listings. The benchmark sale price was $590,100.
It’s a seller’s market in Greater Victoria.
“This June we saw competing factors from all different sides of the real estate equation,” says Victoria Real Estate Board President Sandi-Jo Ayers. “If all we do is look at numbers, we see a fairly normal June, in the midst of a very not normal world. The impact of COVID-19 on our entire economy continues. And while some buyers and sellers are slow to emerge from isolation, others have been highly active since the start of Phase 2 of BC’s Restart Plan. Because of the pandemic, an eviction order that prohibited a landlord from ending a tenancy was introduced. The order may have kept some homes from going to market. The portion of this order that prevented a seller from providing vacant possession of a tenanted home was lifted late this month, which may bring some listings to market that had been stalled. Due to the pandemic alone, we have multiple factors influencing the inventory and sales in our market.”
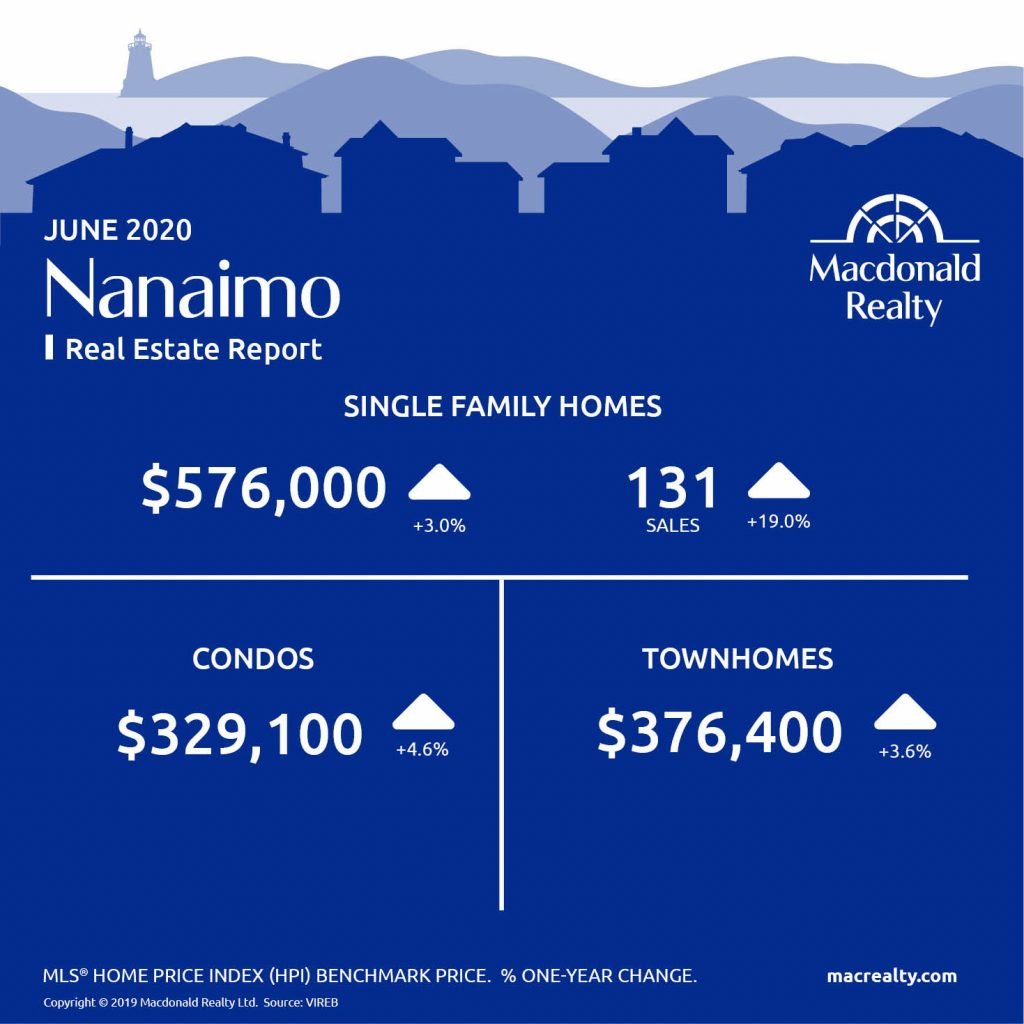
Nanaimo
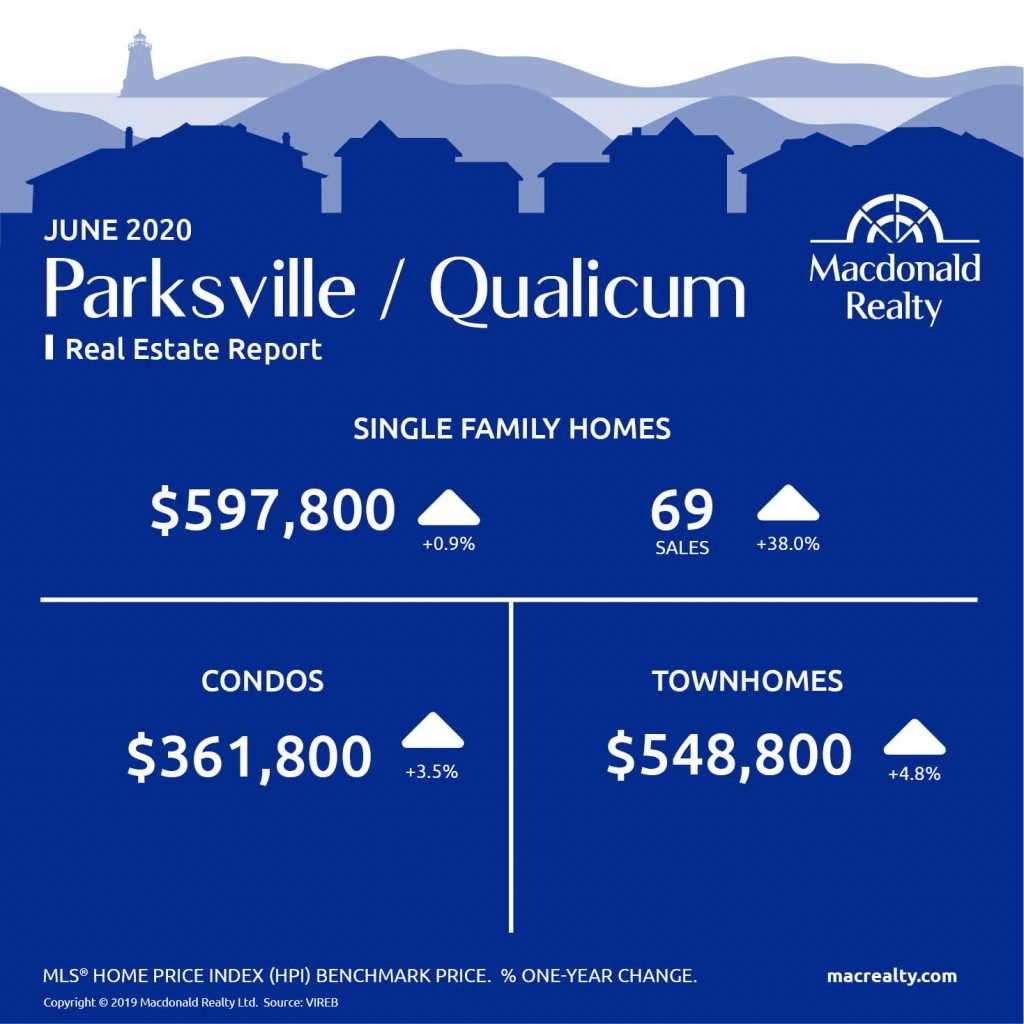
Parksville / Qualicum
Looking for more information about the real estate market in specific neighbourhoods in Victoria, Parksville, Nanaimo, Vancouver Island and the Gulf Islands?
Macdonald Realty has offices in downtown Victoria, Sidney, Parksville and on Salt Spring Island. Please email [email protected] or call 1-877-278-3888 to be matched with a REALTOR® working in your area.
MLS® Home Price Index (HPI) Benchmark Price
Average and median home prices are often misinterpreted, are affected by change in the mix of homes sold, and can swing dramatically from month to month (based on the types and prices of properties that sold in a given month). The MLS® HPI overcomes these shortcomings and uses the concept of a benchmark home, a notional home with common attributes of typical homes in a defined area. Visit www.housepriceindex.ca for more information.
This blog post is based on market data provided by the Victoria Real Estate Board (VREB) www.vreb.org and the Vancouver Island Real Estate Board (VIREB) www.vireb.com. Market data from the VIREB includes listings and sales in Campbell River, Comox Valley, Cowichan Valley Nanaimo, Parksville/Qualicum, Port Alberni/West, North Island, and the Islands.
by Macrealty Marketing Team | Jun 5, 2020 | Market Updates
Here are the latest real estate market statistics from Macdonald Realty on Squamish, Whistler, and Sunshine Coast listings and sales in May 2020.
Find all the infographics related to the May Market Statistics by visiting the Facebook Album.
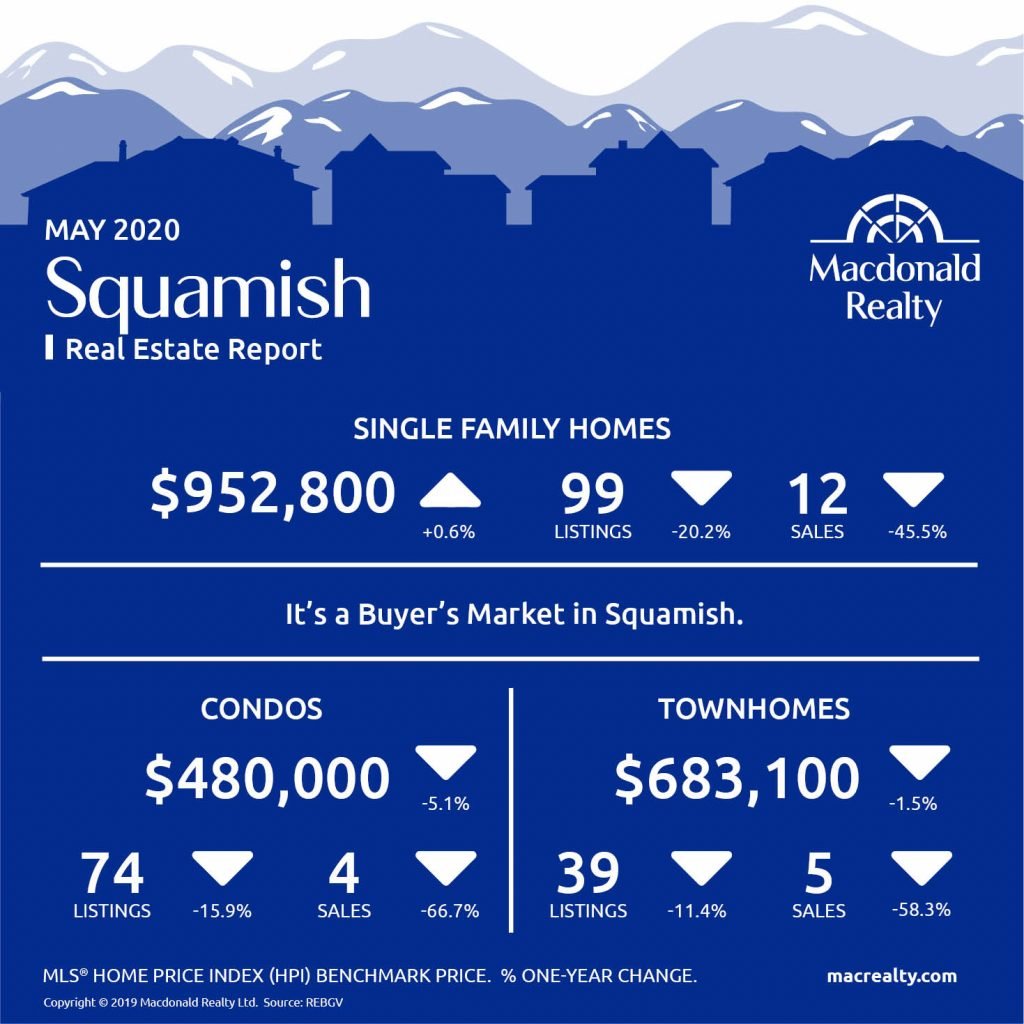
Squamish
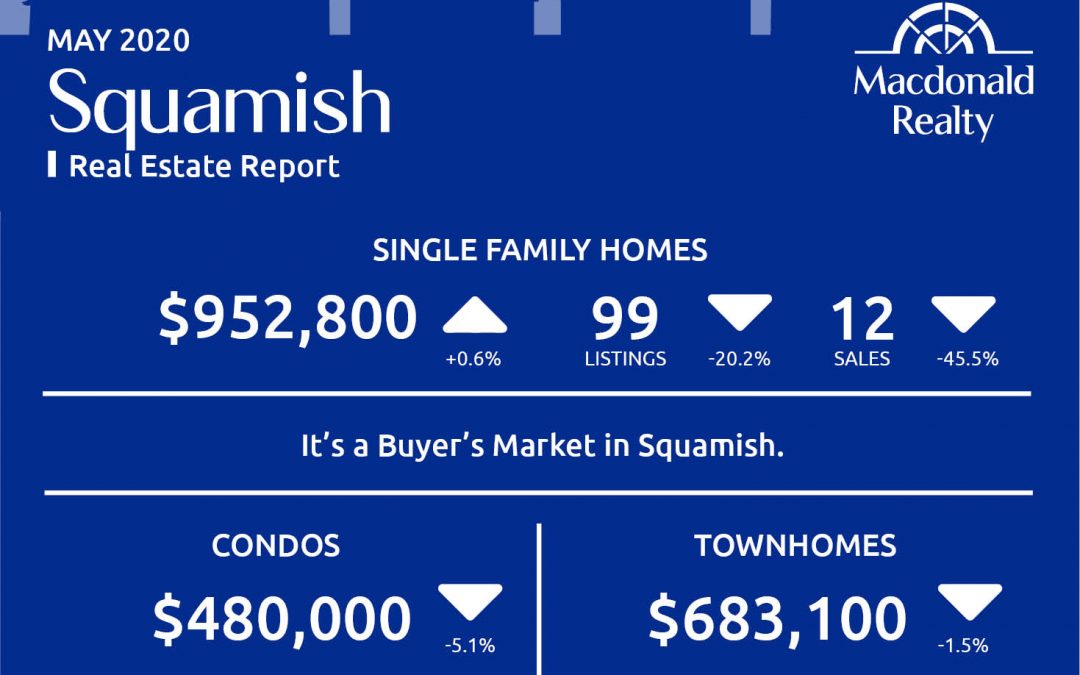
In May 2020, there were 12 sales of detached homes and 99 active listings in Squamish. The benchmark sale price was $952,780.
The condo market had 4 sales and 74 active listings at the end of the month. The benchmark sale price was $480,000.
The townhome market had 5 sales and, the active listings were 39. The benchmark sale price was $683,100.
It’s a buyer’s market in Squamish.
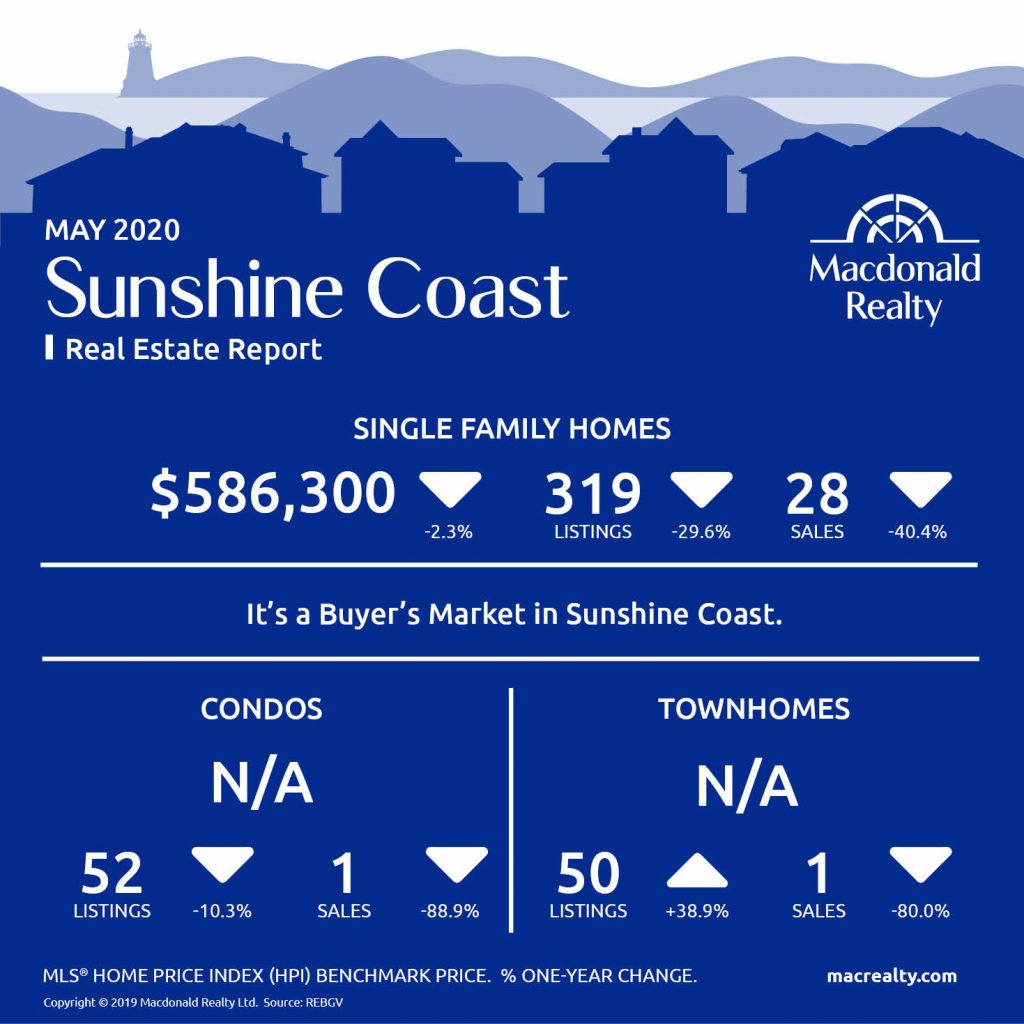
Sunshine Coast
In May 2020, Sunshine Coast had 28 sales of detached homes and 319 active listings. The benchmark sale price was $586,300.
The condo market had 1 sale and 52 active listings at the end of the month.
Townhome sales were 1 sale while active listings were 50.
It’s a buyer’s market in Sunshine Coast.
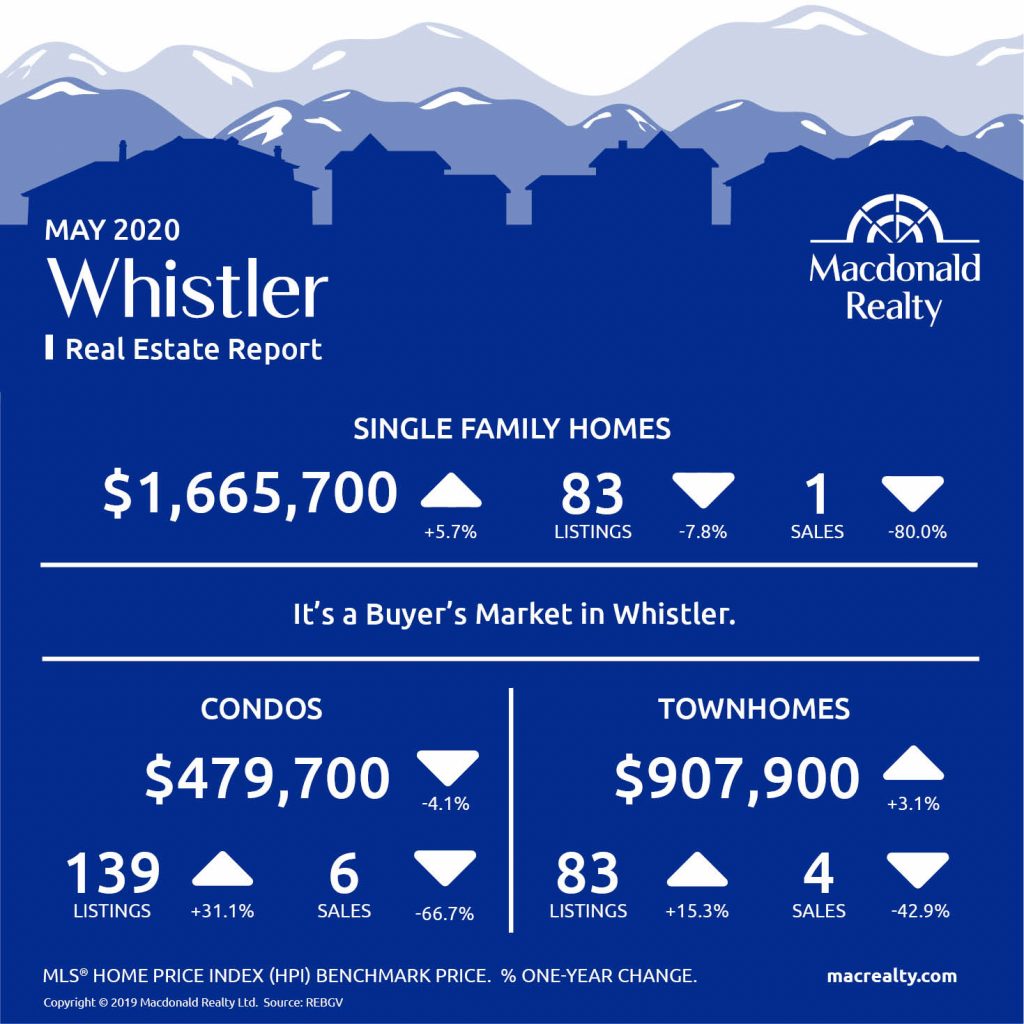
Whistler
In May 2020, Whistler had 1 sale of detached homes and 83 active listings. The benchmark sale price was $1,665,700.
The condo market had 6 sales and 139 active listings at the end of the month. The benchmark sale price was $479,700.
Townhome sales were 4 sales, active listings were 83.
The benchmark sale price was $907,900.
It’s a buyer’s market in Whistler.
Looking for more information about the real estate market in specific neighbourhoods in Squamish, Whistler, and Sunshine Coast? Macdonald Realty has offices in Squamish, Whistler, and Sunshine Coast. Please email [email protected] or call 1-877-278-3888 to be matched with a REALTOR® working in your area.
MLS® Home Price Index (HPI) Benchmark Price
Average and median home prices are often misinterpreted, are affected by change in the mix of homes sold, and can swing dramatically from month to month (based on the types and prices of properties that sold in a given month). The MLS® HPI overcomes these shortcomings and uses the concept of a benchmark home, a notional home with common attributes of typical homes in a defined area. Visit www.housepriceindex.ca for more information.
This blog post is based on market data provided by the Real Estate Board of Greater Vancouver (REBGV) www.rebgv.org
by Macrealty Marketing Team | Jun 5, 2020 | Market Updates
Here are the latest real estate market statistics from Macdonald Realty on the Greater Vancouver listings and sales in May 2020.
“Home prices have been stable during the COVID-19 period,” Colette Gerber, REBGV Chair said. “While we’re seeing a variety of long-term projections for the market, it’s critical to understand the facts and trends as they emerge.”
Find all the infographics by visiting the Facebook Album.
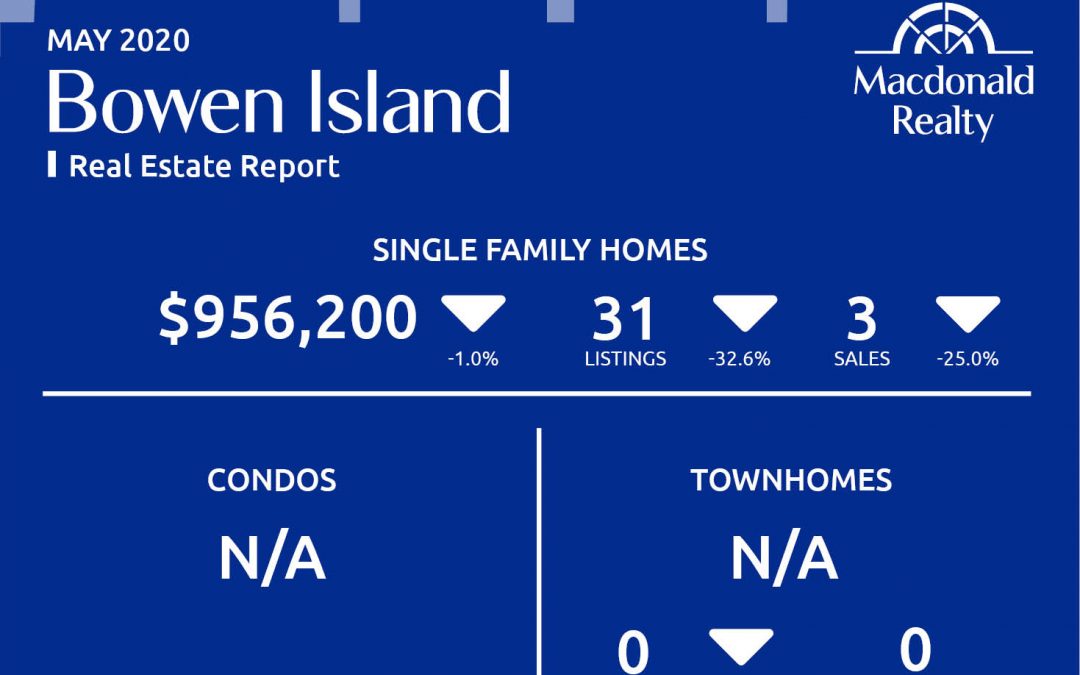
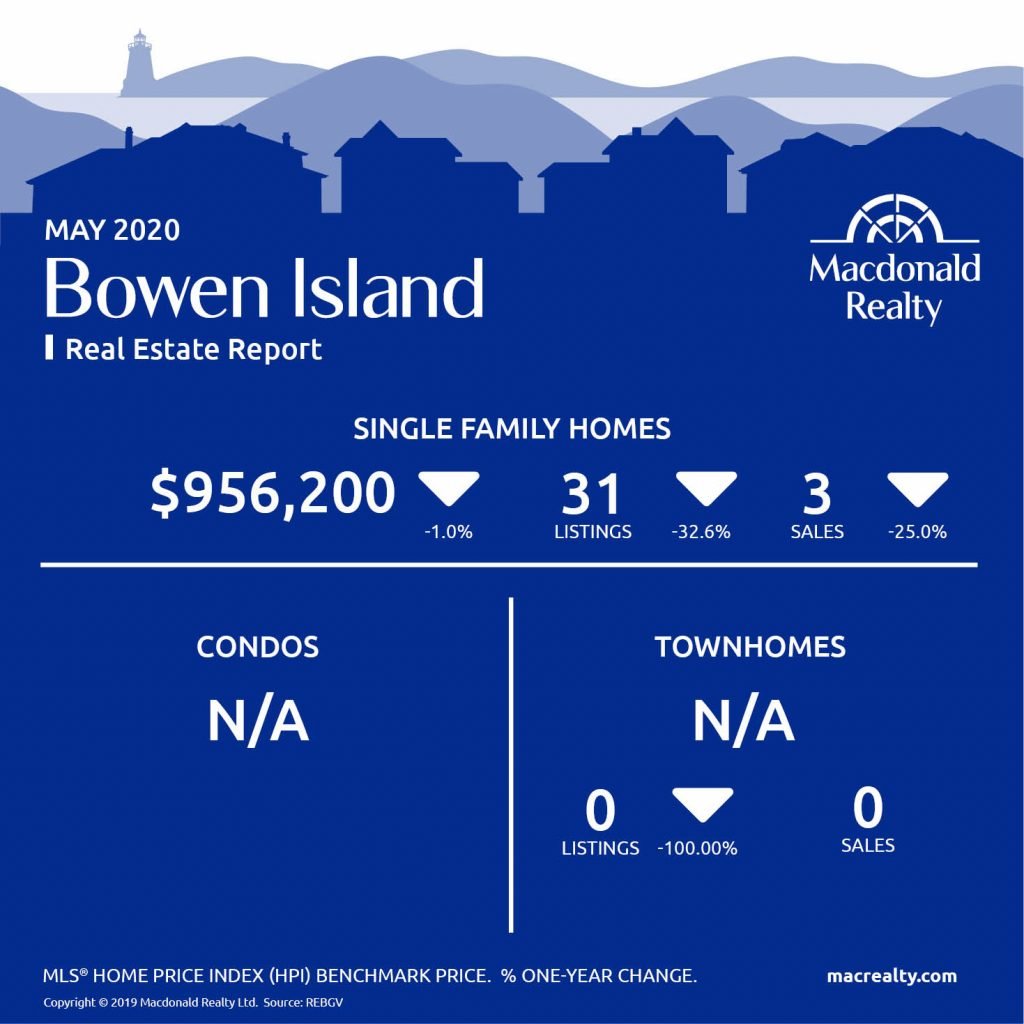
Bowen Island
Bowen Island had 3 sales and 31 active listings for detached homes at the end of the month. The benchmark sales price was $956,200.
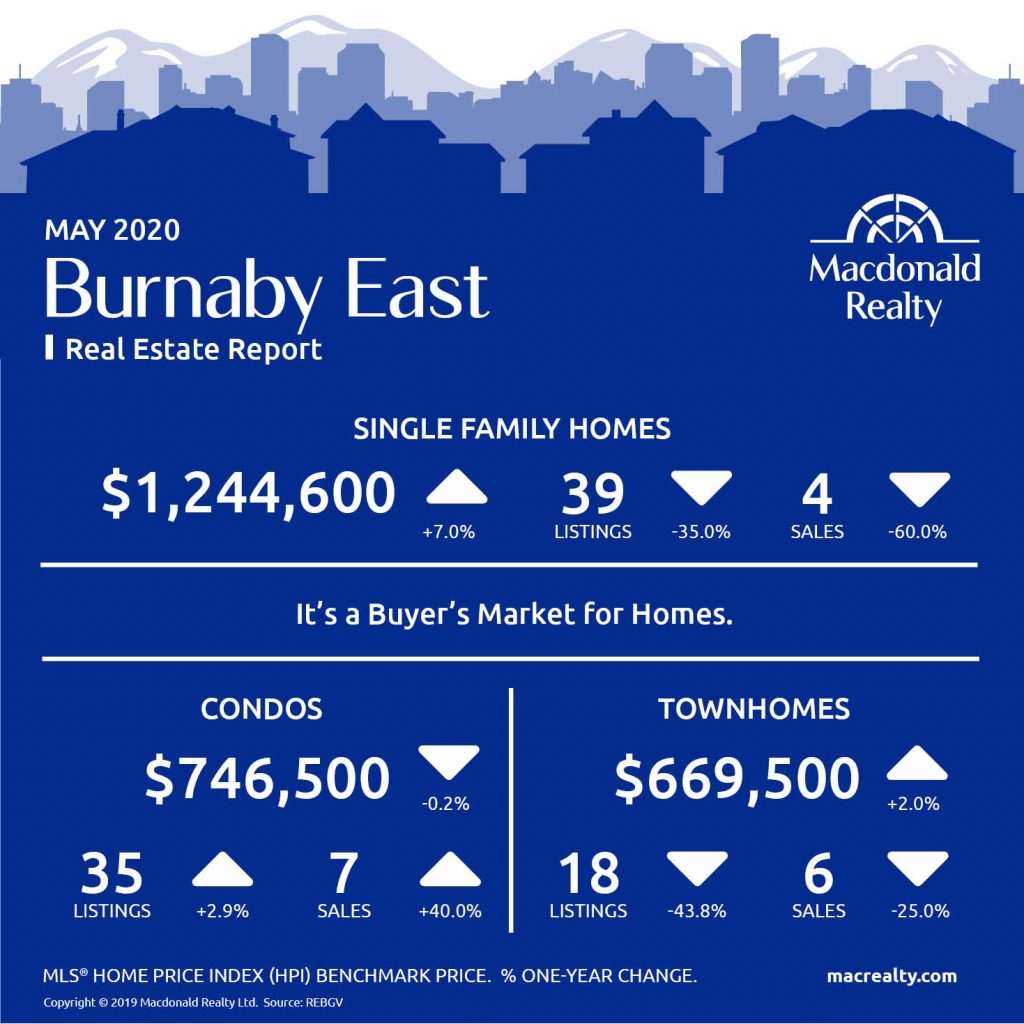
Burnaby East
Burnaby East had 4 sales and 39 active listings for detached homes at the end of the month. The benchmark sales price was $1,244,600.
The condo market featured 7 sales, 35 active listings, and a benchmark sales price was $746,500.
The townhome market had 6 sales and 18 active listings. The benchmark sale price was $669,500.
It’s a buyer’s market for homes in Burnaby East.
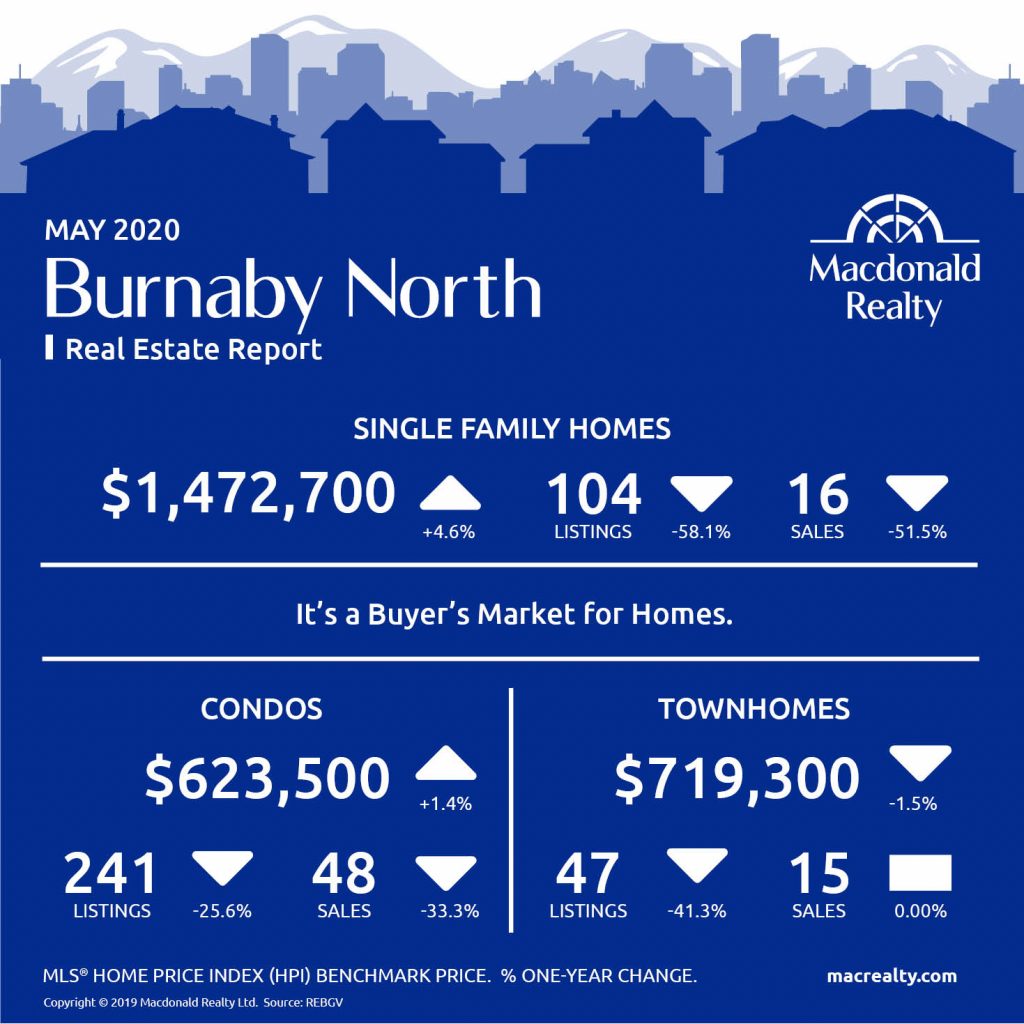
Burnaby North
Burnaby North had 16 sales and 104 active listings for detached homes at the end of the month. The benchmark sales price was $1,472,700.
The condo market featured 48 sales, 241 active listings, and a benchmark sales price was $623,500.
The townhome market had 15 sales and 47 active listings. The benchmark sale price was $719,300.
It’s a buyer’s market for homes in Burnaby North.
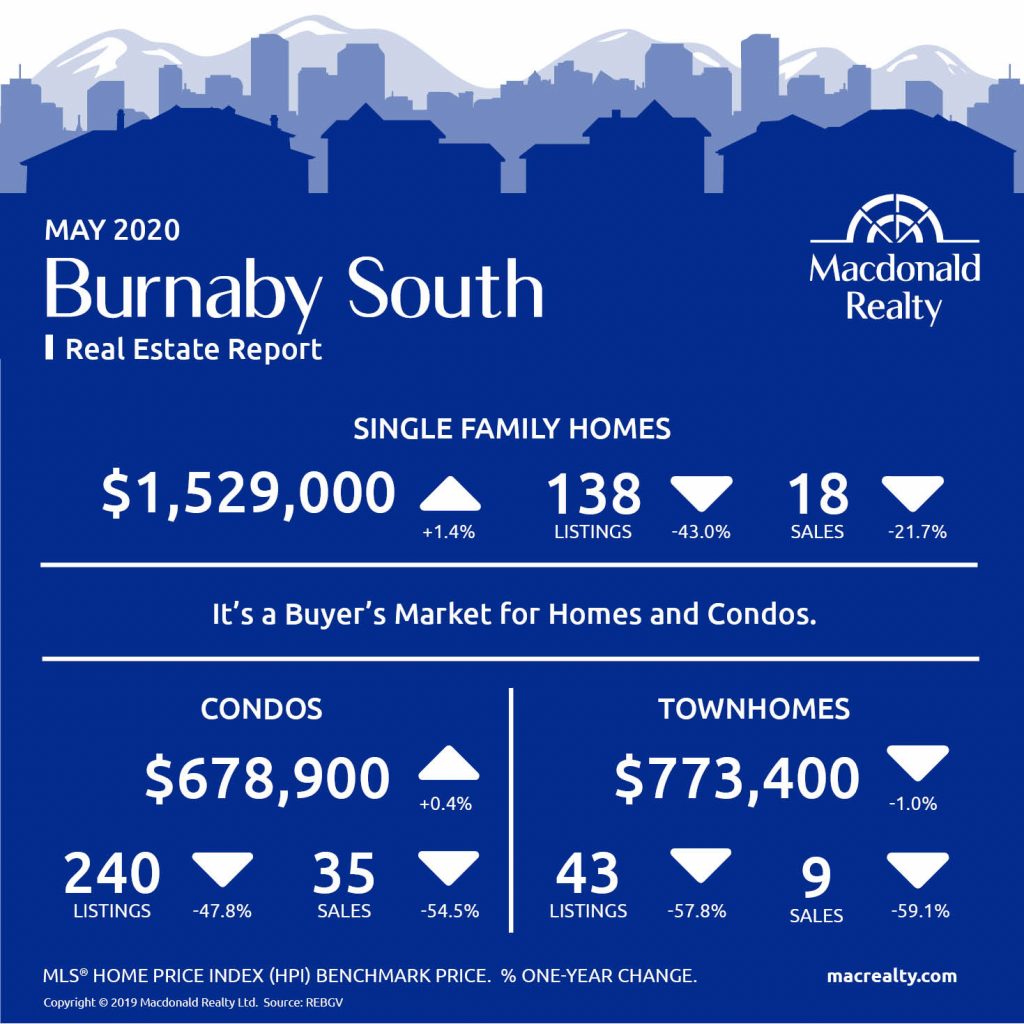
Burnaby South
Burnaby South had 18 sales and 138 active listings for detached homes at the end of the month. The benchmark sales price was $1,529,000.
The condo market featured 35 sales, 240 active listings, and a benchmark sales price was $678,900.
The townhome market had 9 sales and 43 active listings. The benchmark sale price was $773,400.
It’s a buyer’s market for homes and condos in Burnaby South.
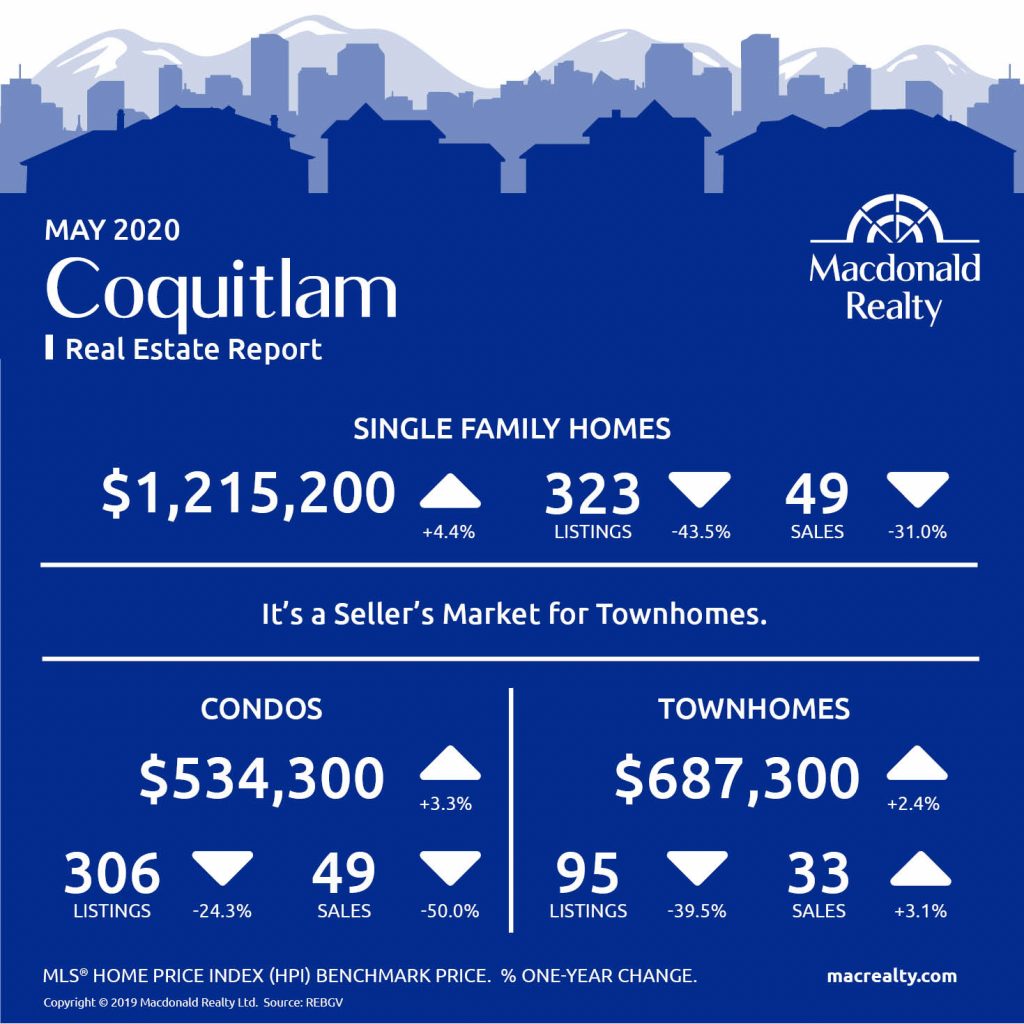
Coquitlam
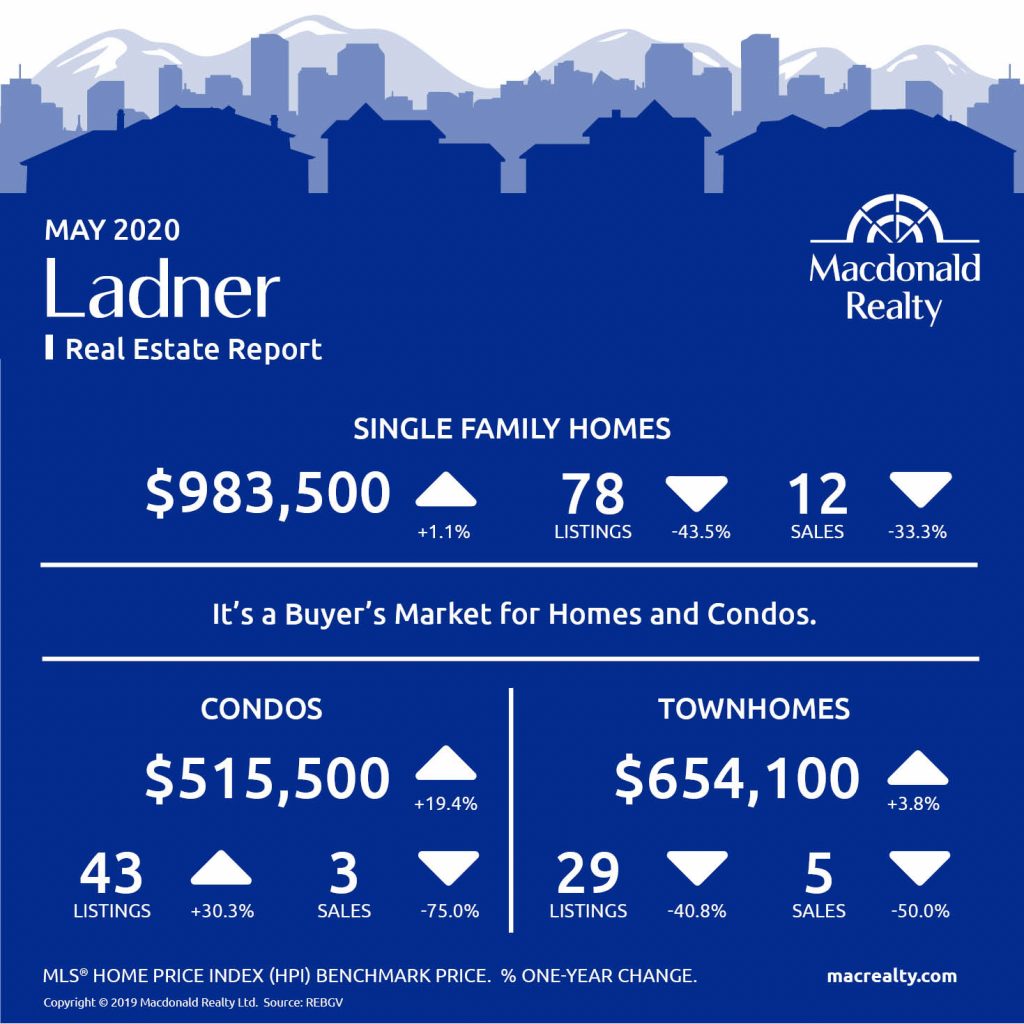
Ladner
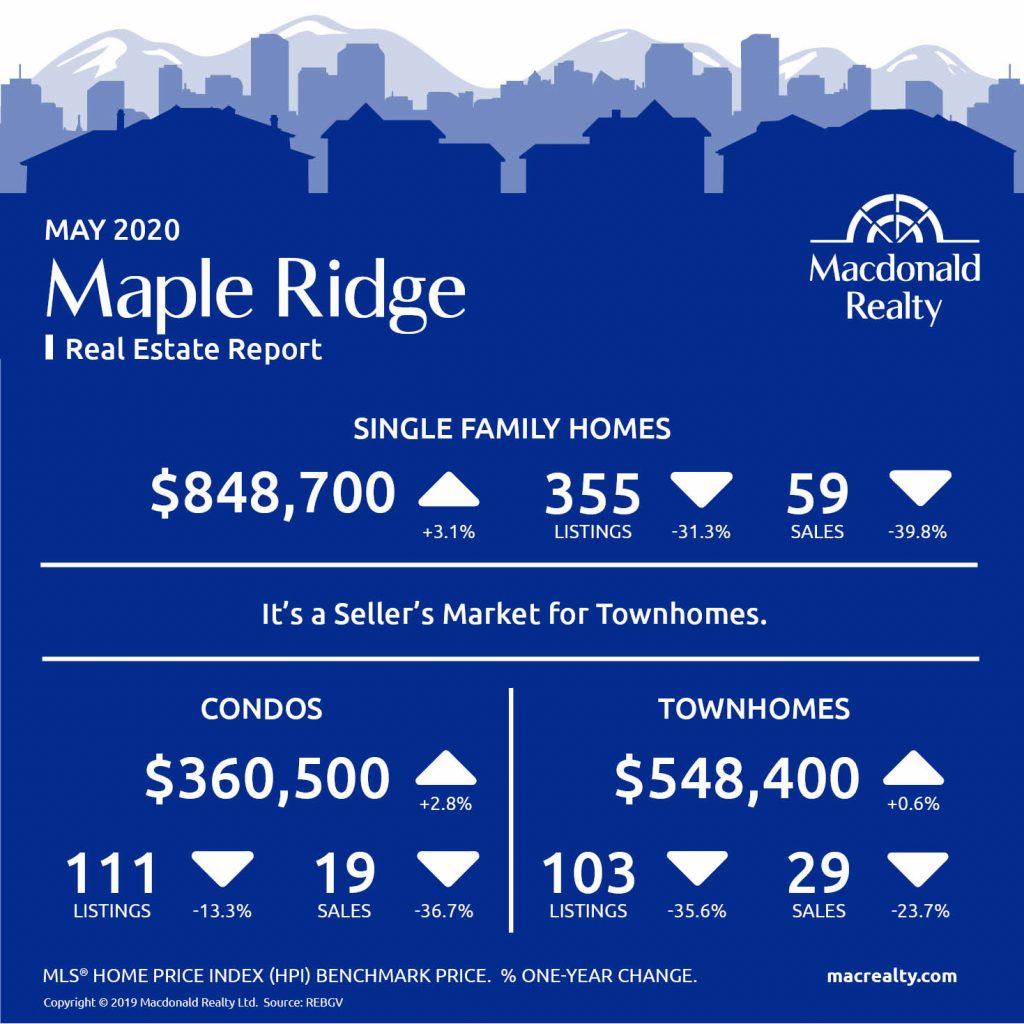
Maple Ridge
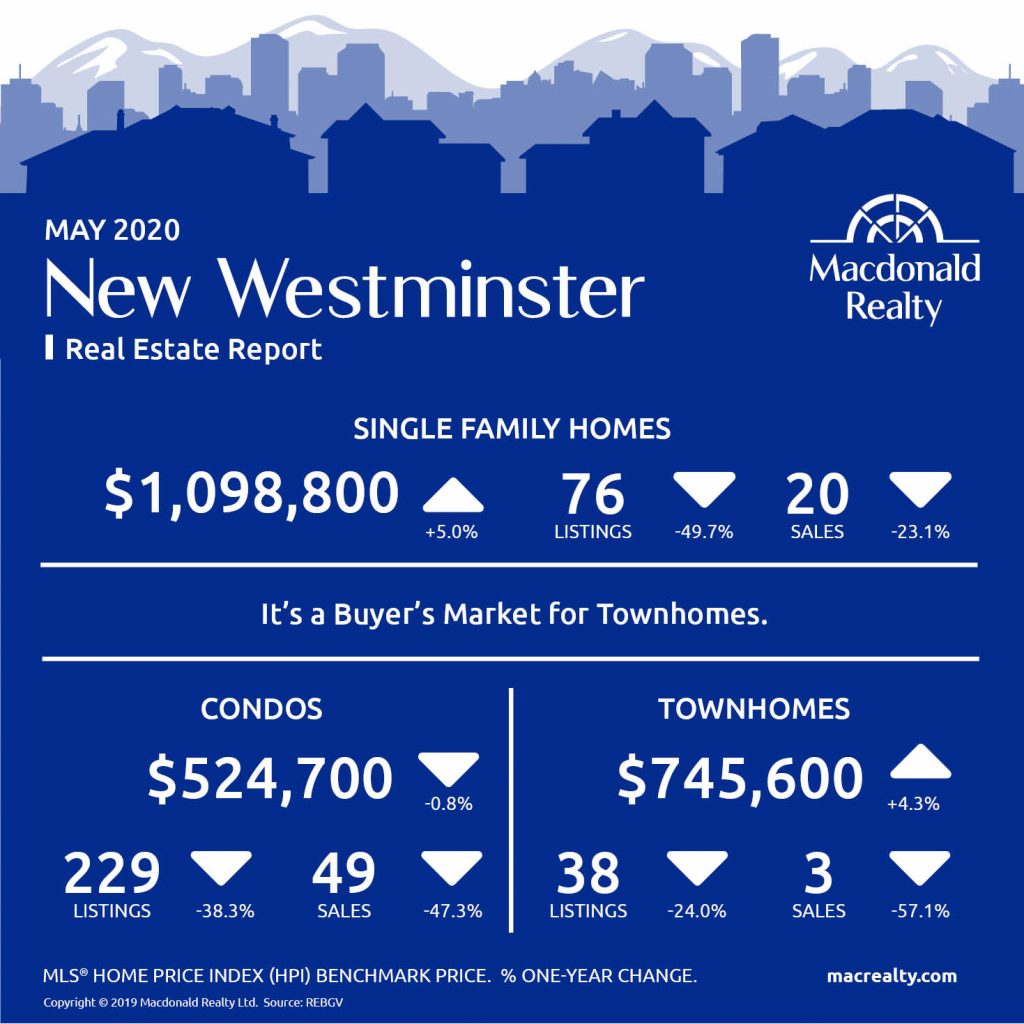
New Westminster
North Vancouver

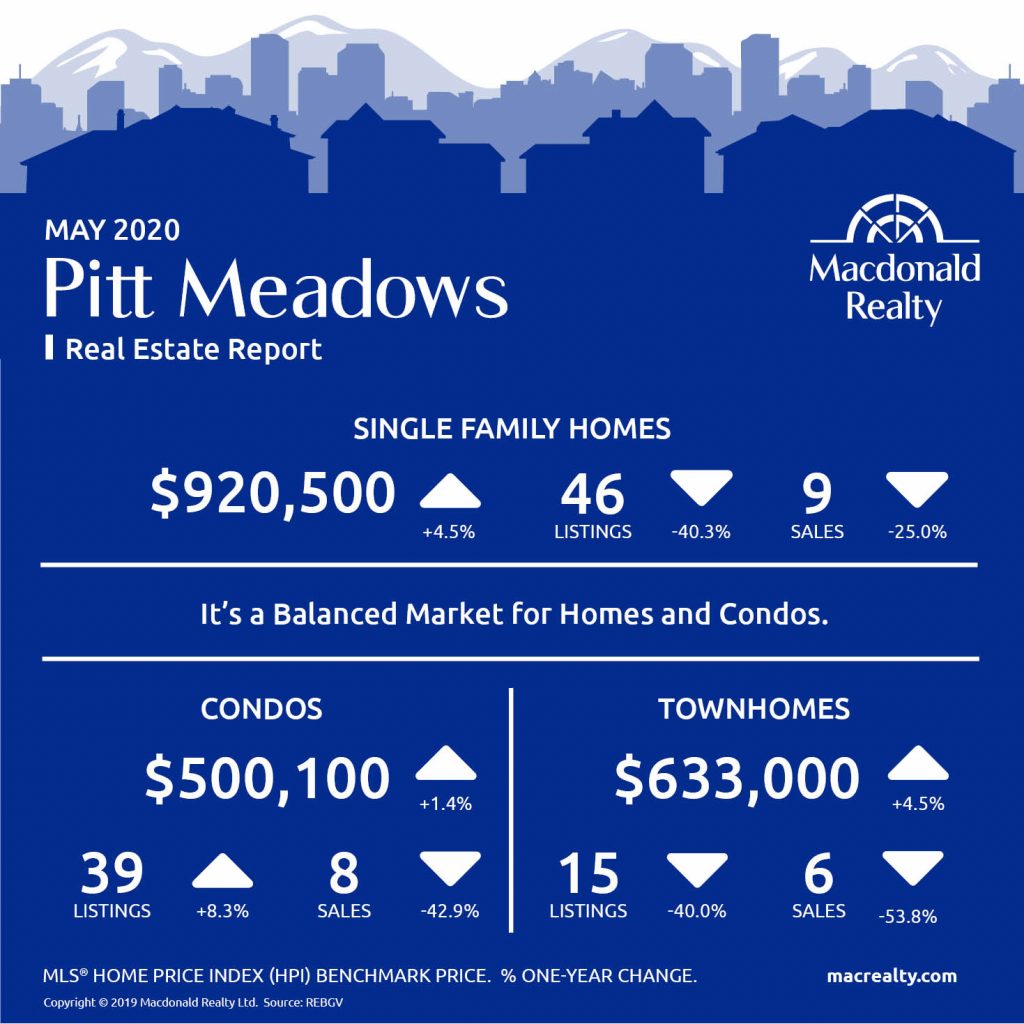
Pitt Meadows
Port Coquitlam

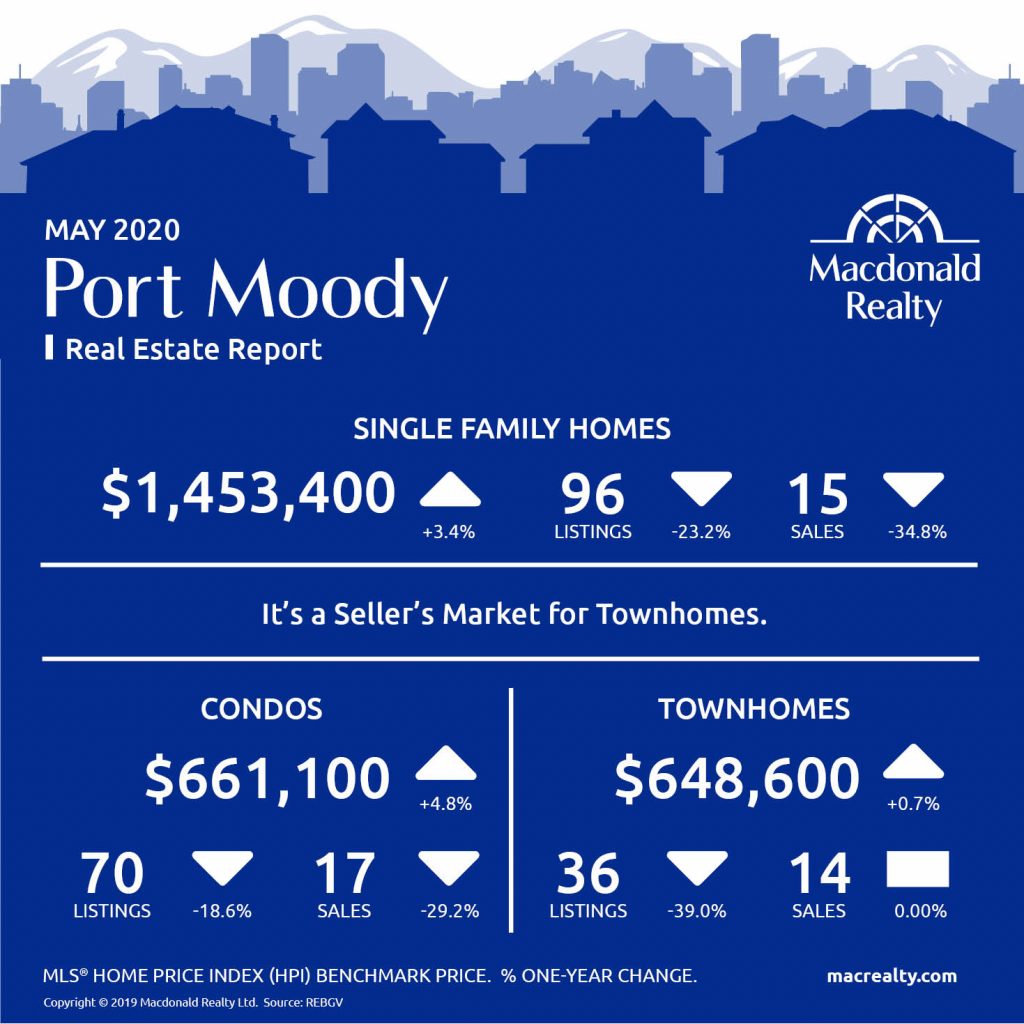
Port Moody
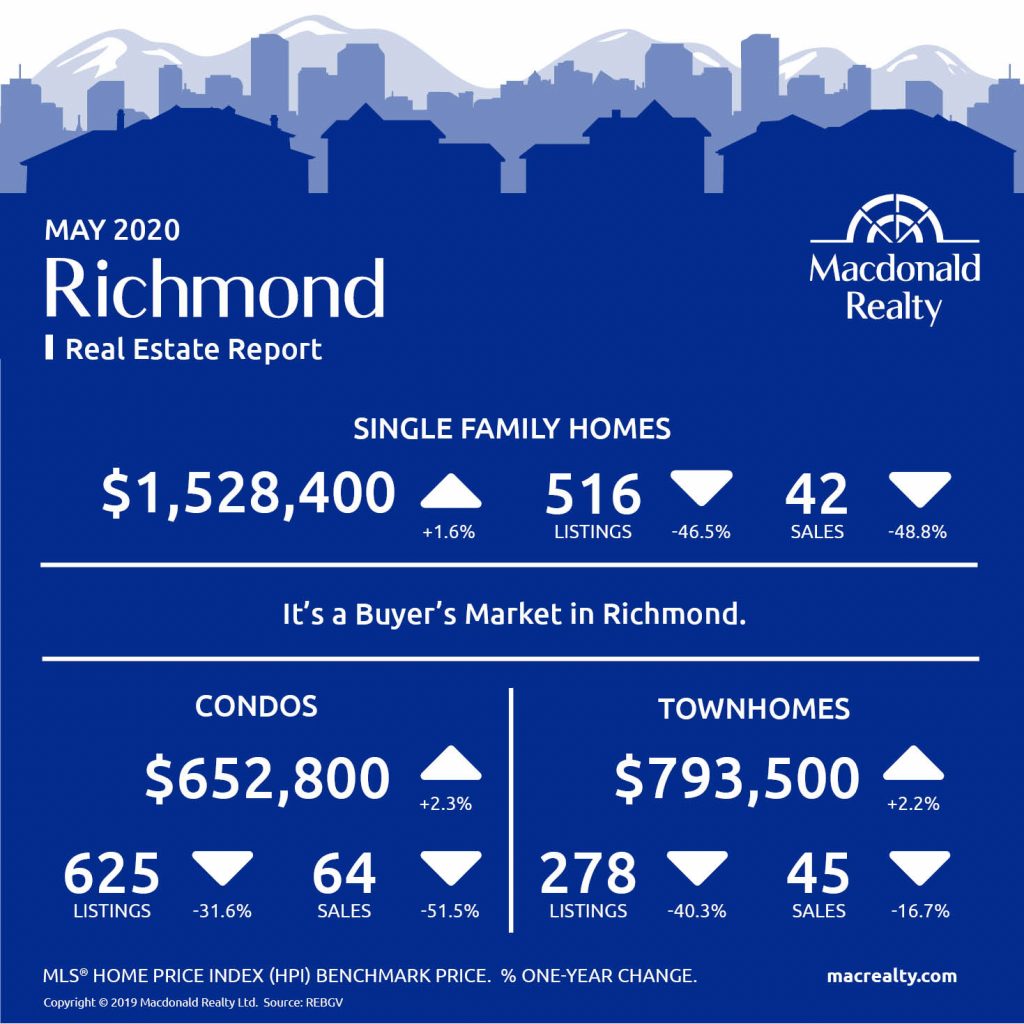
Richmond
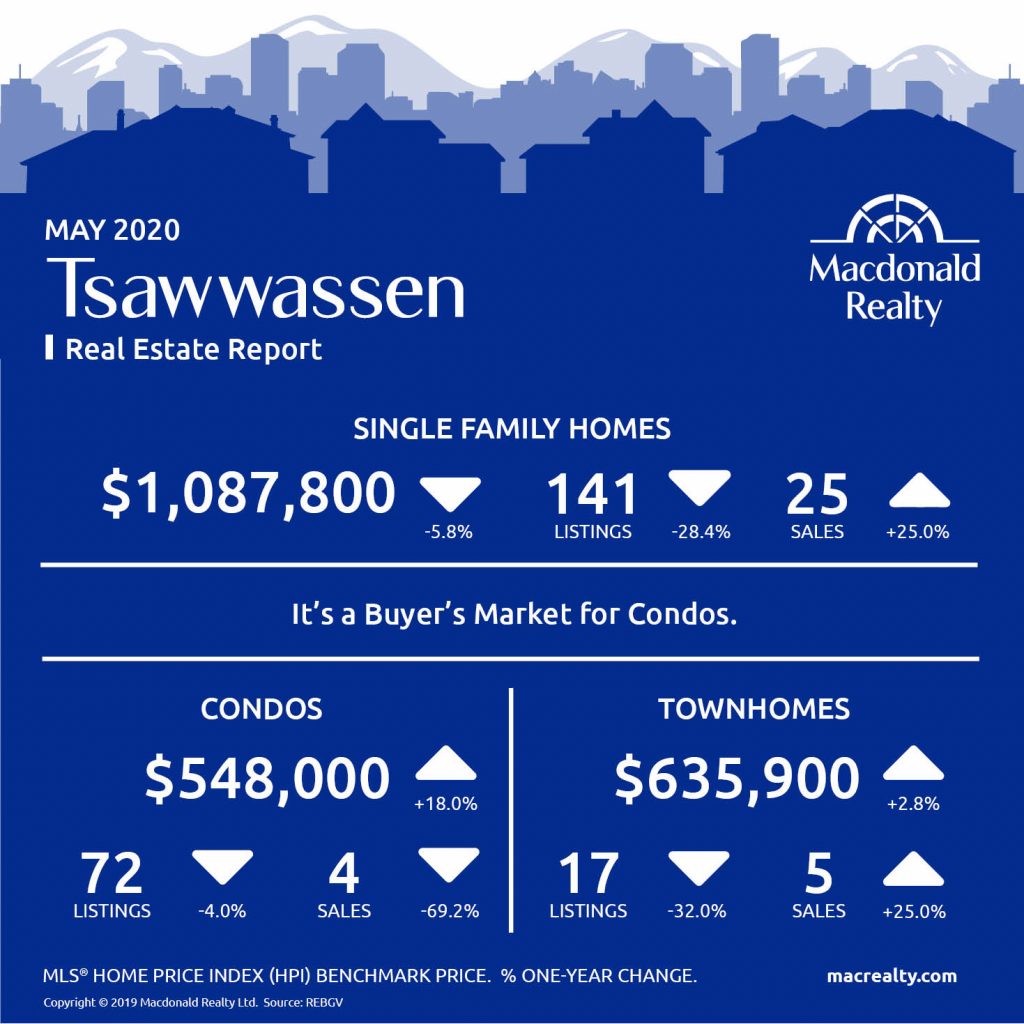
Tsawwassen
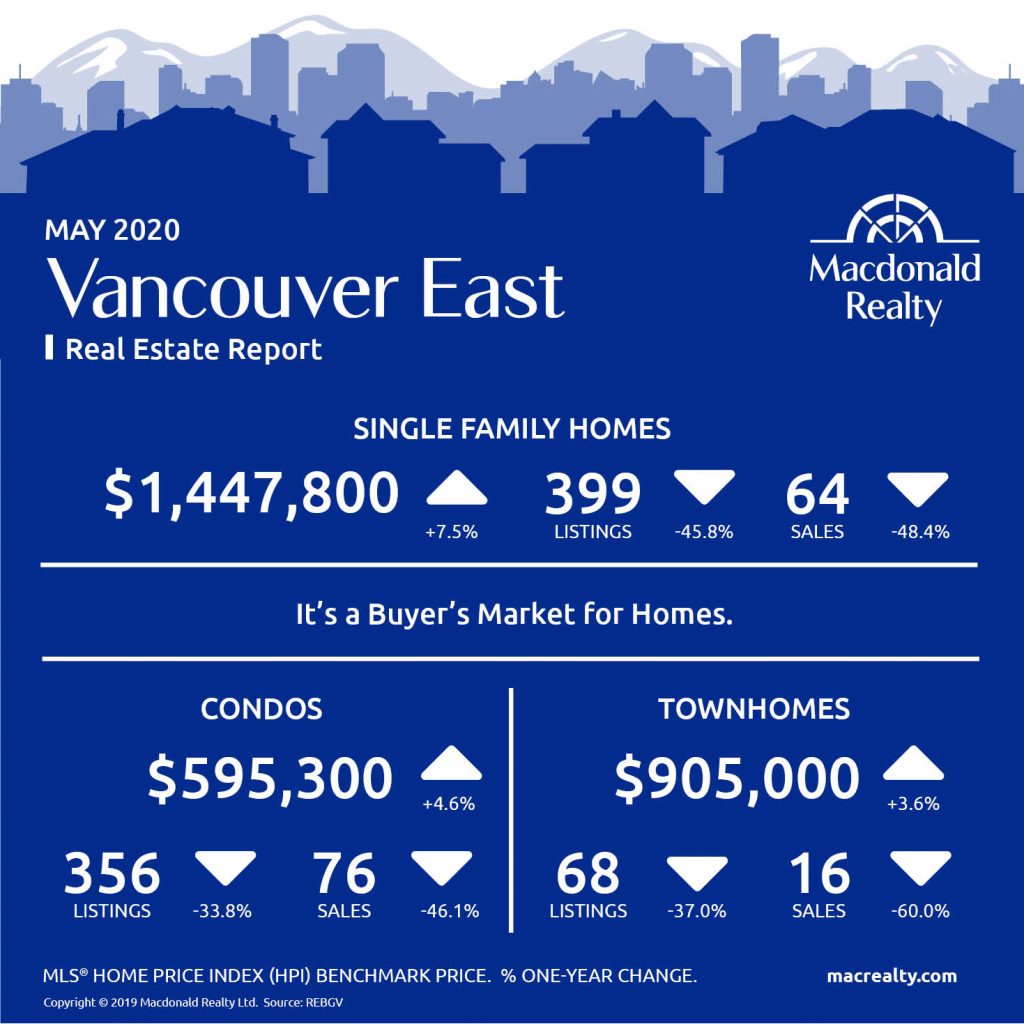
Vancouver East
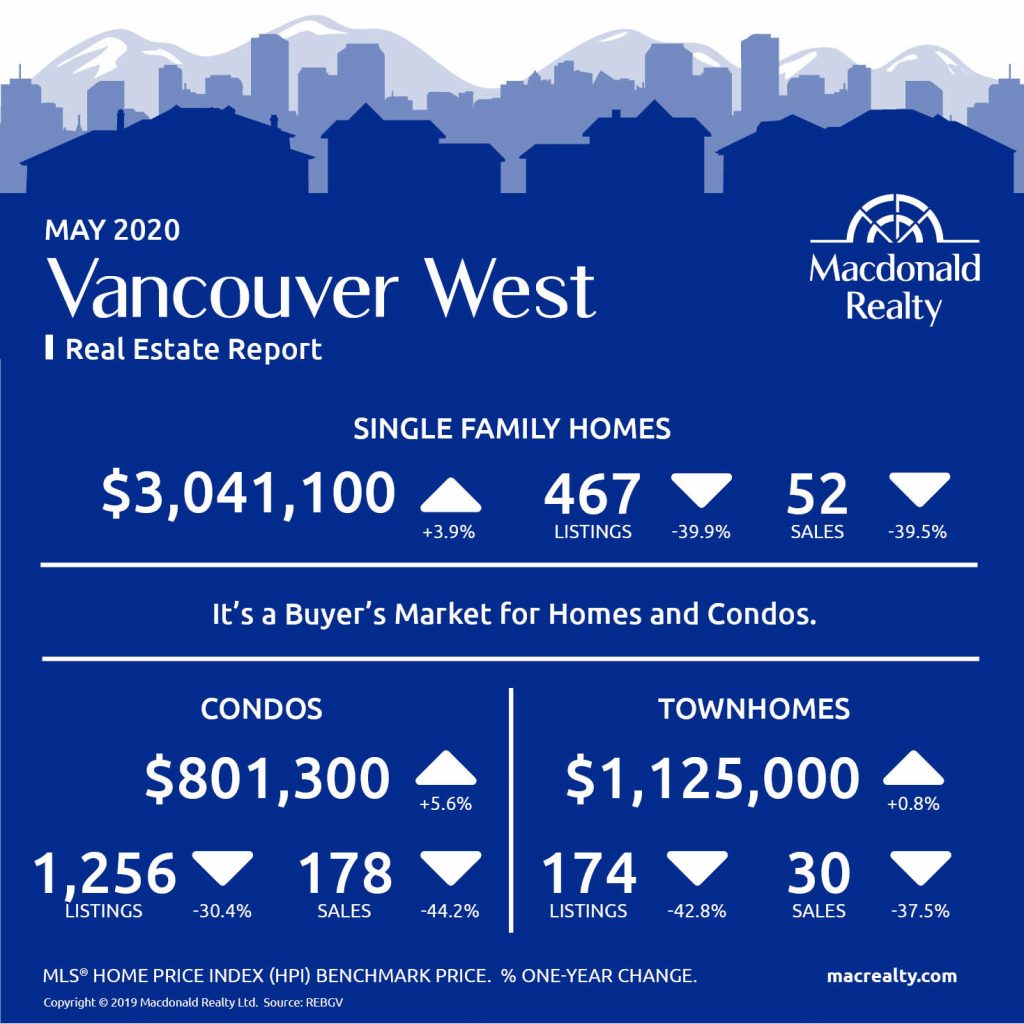
Vancouver West
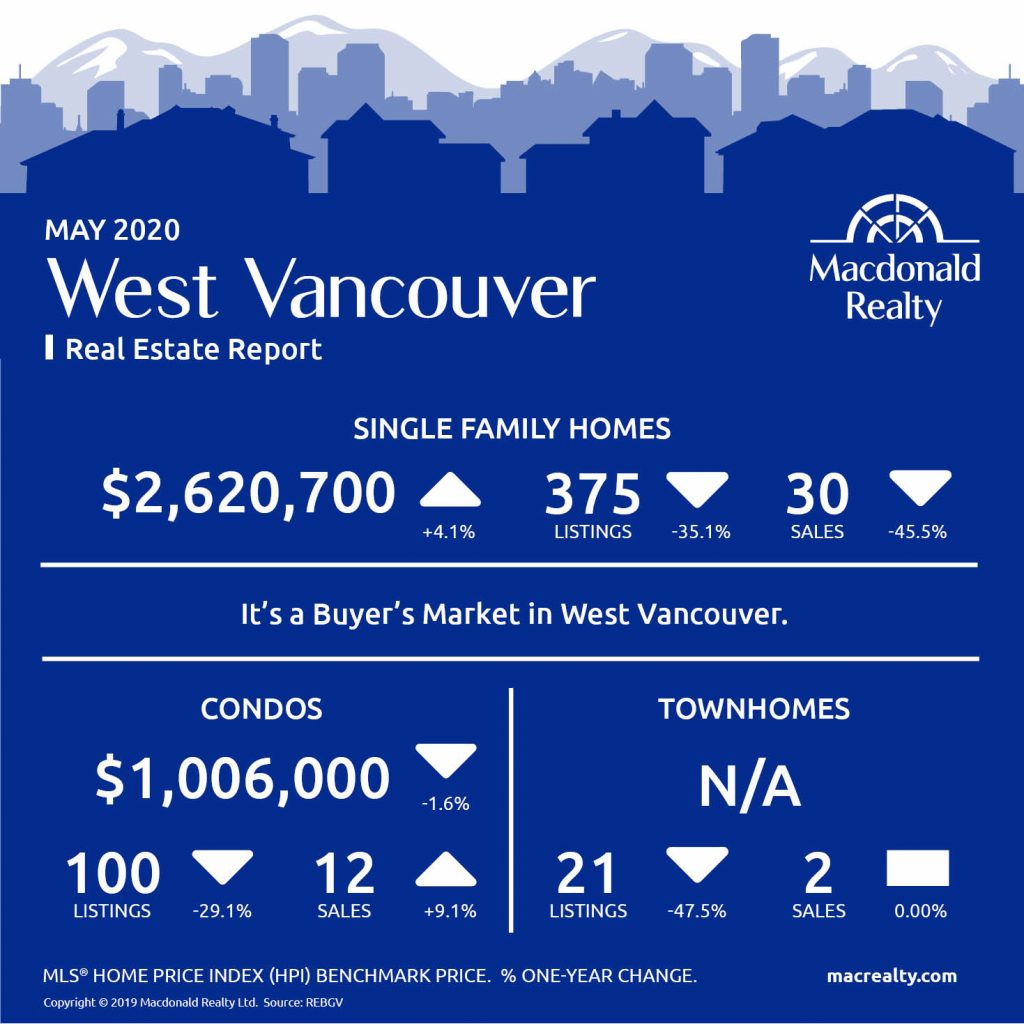
West Vancouver
Looking for more information about the real estate market in specific neighbourhoods in the Greater Vancouver?
Macdonald Realty has offices across the Greater Vancouver. Please email [email protected] or call 1-877-278-3888 to be matched with a REALTOR® working in your area.
MLS® Home Price Index (HPI) Benchmark Price
Average and median home prices are often misinterpreted, are affected by change in the mix of homes sold, and can swing dramatically from month to month (based on the types and prices of properties that sold in a given month). The MLS® HPI overcomes these shortcomings and uses the concept of a benchmark home, a notional home with common attributes of typical homes in a defined area. Visit www.housepriceindex.ca for more information.
This blog post is based on market data provided by the Real Estate Board of Greater Vancouver (REBGV) www.rebgv.org
by Macrealty Marketing Team | Jun 3, 2020 | Market Updates
Here are the latest real estate market statistics from Macdonald Realty on Okanagan listings and sales in May 2020.
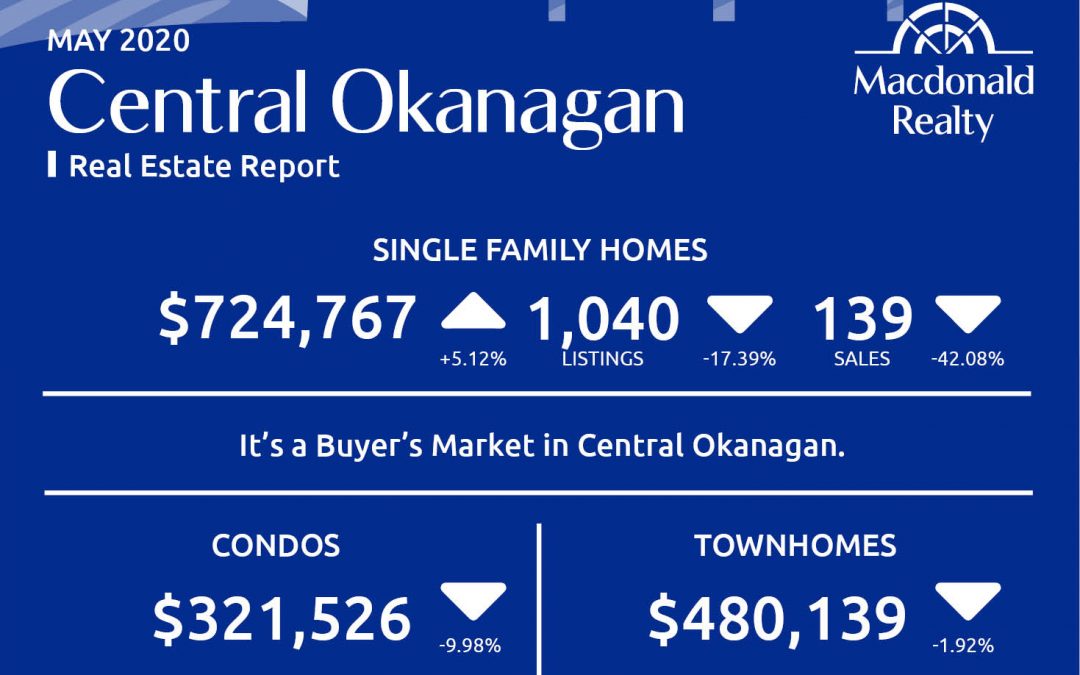
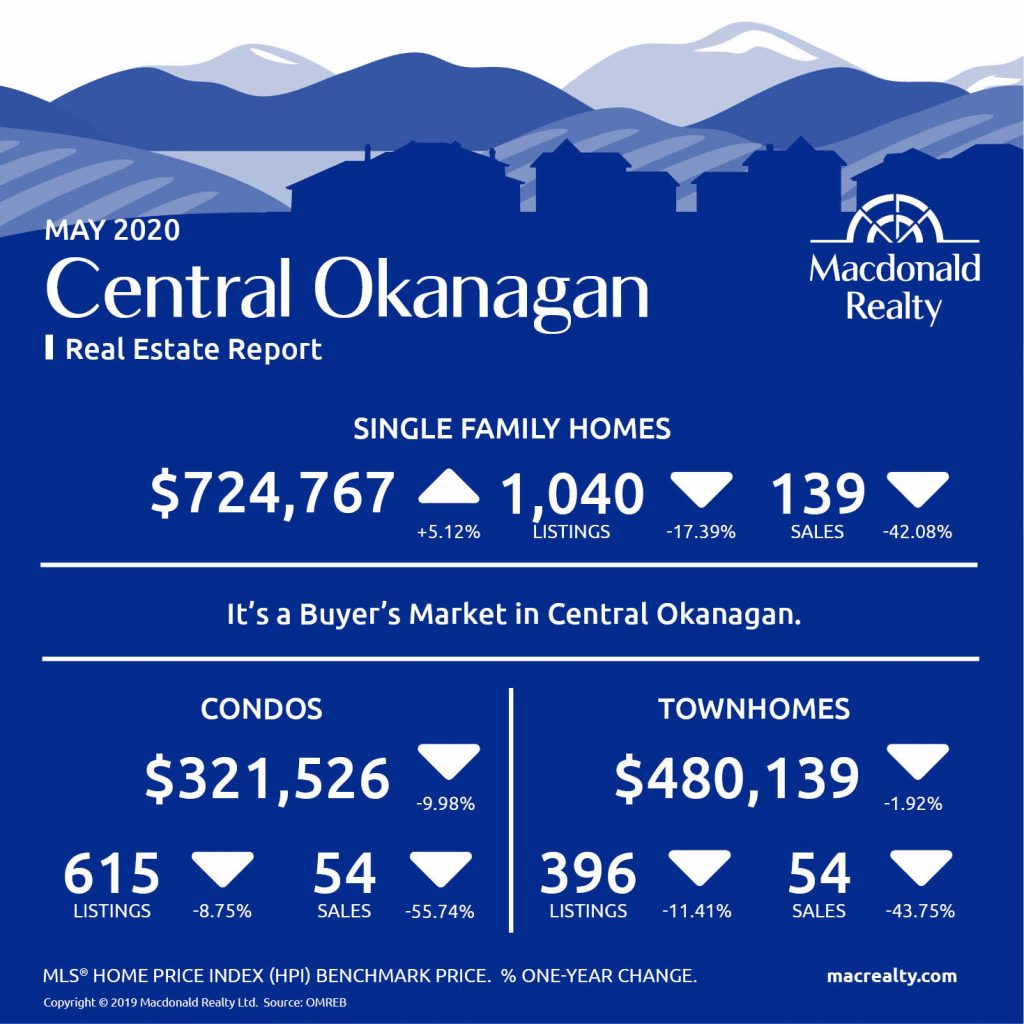
Central Okanagan: Kelowna and Lake Country
There were 139 sales, 1,040 active listings, and a $724,767 average sale price for detached homes in the Central Okanagan market, including Kelowna and Lake Country.
The condo market featured 54 sales and 615 active listings at the end of the month. The average sale price was $321,526.
Townhome sales were 54, active listings were 396 and the average sale price was $480,139.
It’s a buyer’s market in Central Okanagan.
North Okanagan: Vernon and surrounding area
In North Okanagan, including Vernon and the surrounding area and the average sale price was $505,044. At the end of the month, there were 70 sales and 459 active listings.
There were 11 sales and 68 active listings for condos. The average sale price was $156,309.
In comparison, townhomes featured 18 sales, 141 active listings and a $347,075 average sale price.
It’s a buyer’s market in North Okanagan.

Looking for more information about the real estate market in specific neighbourhoods in Okanagan?
Macdonald Realty has offices in Kelowna and across BC. Please email [email protected] or call 1-877-278-3888 to be matched with a REALTOR® working in your area.
This blog post is based on market data provided by Okanagan Mainline Real Estate Board (OMREB) www.omreb.com.

