by Macrealty Marketing Team | Jun 3, 2020 | Market Updates
Here are the latest real estate market statistics from Macdonald Realty on Greater Victoria, Parksville/Qualicum, and Nanaimo listings and sales in May 2020.
Find all the infographics related to the February Market Statistics by visiting the Facebook Album.
Greater Victoria
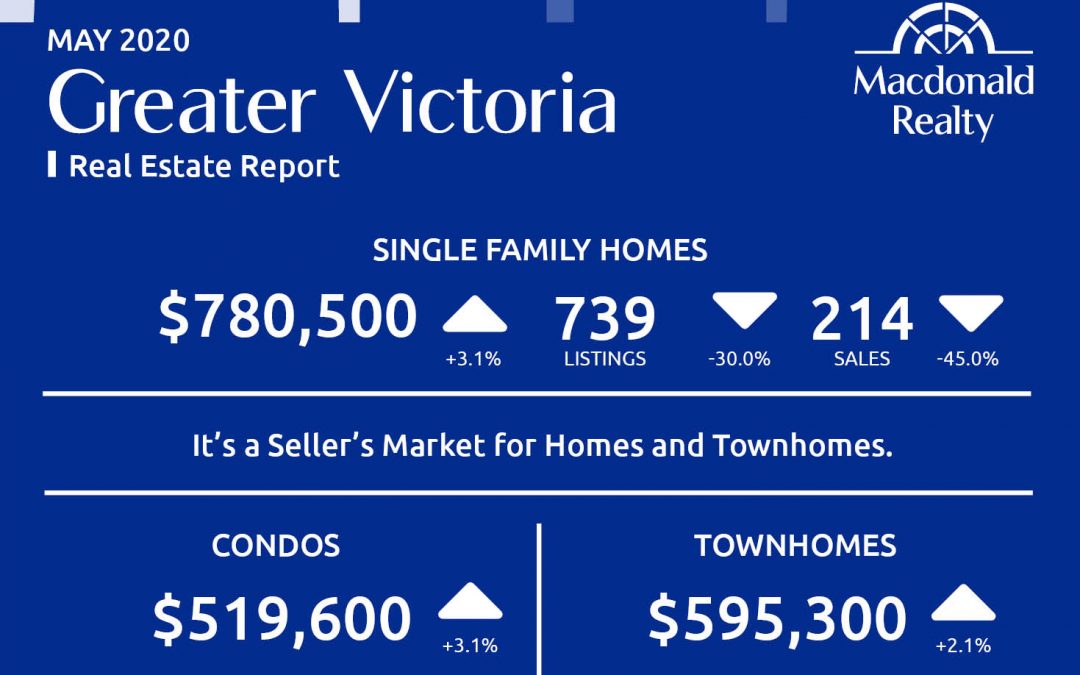
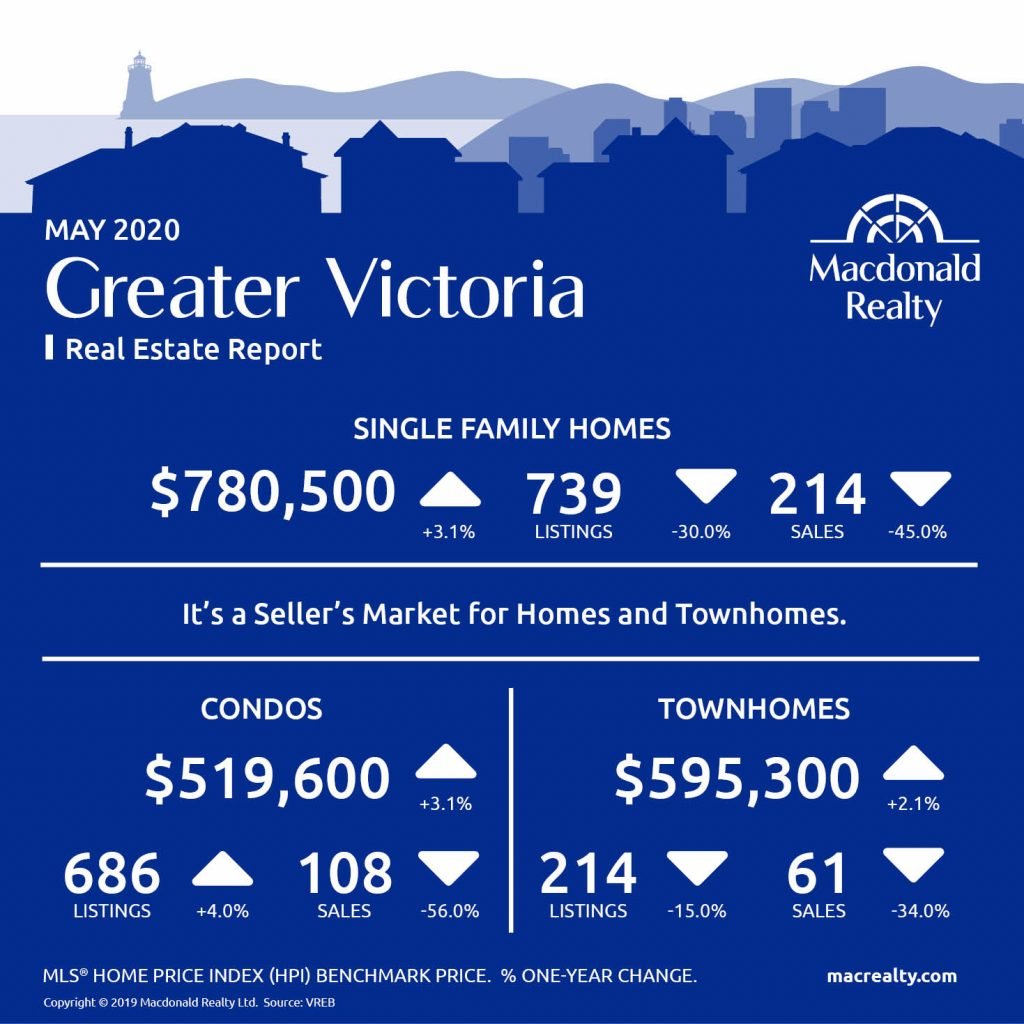
Greater Victoria had 214 sales and 739 active listings for detached homes at the end of the month. The benchmark sales price was $780,500.
The condo market featured 108 sales, 686 active listings, and a benchmark sales price was $519,600.
The townhome market had 61 sales and 214 active listings. The benchmark sale price was $595,300.
It’s a seller’s market for homes and Townhomes in Greater Victoria.
“Our market continues to respond to the current health crisis,” says Victoria Real Estate Board President Sandi-Jo Ayers. “Activity in real estate right now echoes the activity in our broader community – as restrictions gradually begin to lift – so too have our sales and listings numbers. Of course, like any industry, we do not expect a sudden shift back to any kind of normal. That said, one theme that persists in our market is that well-priced properties in high demand areas continue to see multiple offers. Demand exists and we continue to have motivated buyers searching for their perfect home.”
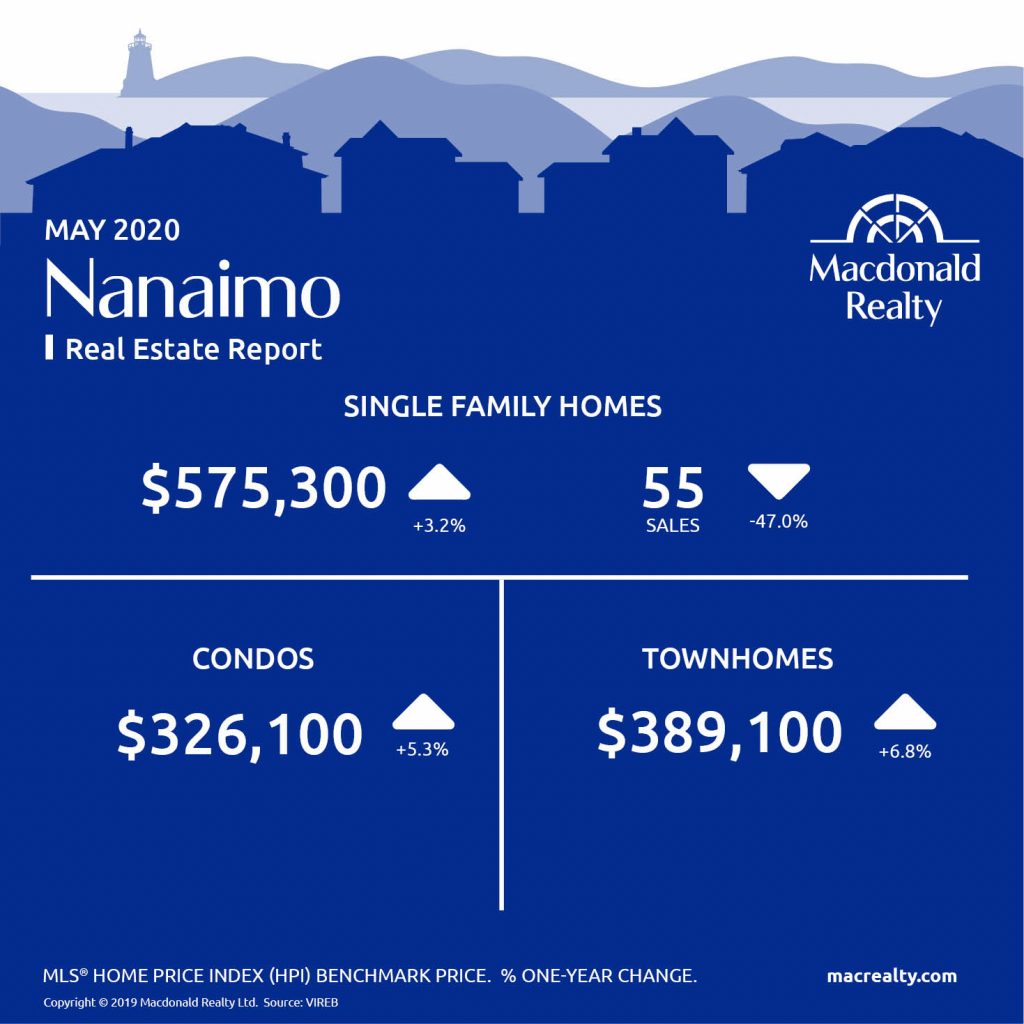
Nanaimo
Parksville / Qualicum

Looking for more information about the real estate market in specific neighbourhoods in Victoria, Parksville, Nanaimo, Vancouver Island and the Gulf Islands?
Macdonald Realty has offices in downtown Victoria, Sidney, Parksville and on Salt Spring Island. Please email [email protected] or call 1-877-278-3888 to be matched with a REALTOR® working in your area.
MLS® Home Price Index (HPI) Benchmark Price
Average and median home prices are often misinterpreted, are affected by change in the mix of homes sold, and can swing dramatically from month to month (based on the types and prices of properties that sold in a given month). The MLS® HPI overcomes these shortcomings and uses the concept of a benchmark home, a notional home with common attributes of typical homes in a defined area. Visit www.housepriceindex.ca for more information.
This blog post is based on market data provided by the Victoria Real Estate Board (VREB) www.vreb.org and the Vancouver Island Real Estate Board (VIREB) www.vireb.com. Market data from the VIREB includes listings and sales in Campbell River, Comox Valley, Cowichan Valley Nanaimo, Parksville/Qualicum, Port Alberni/West, North Island, and the Islands.
by Macrealty Marketing Team | Jun 3, 2020 | Market Updates
According to the Board, by the end of May, the Fraser Valley Real Estate Board (FVREB) processed a total of 805 sales on its Multiple Listing Service® (MLS®) in May, an increase of 17% compared to sales in April and a decrease of 47% compared to the 1,517 sales during May of last year.
Chris Shields, President of the Board, observes, “This is an encouraging sign. Real estate is an essential service and it’s one of the most important economic drivers in BC’s economy.
“Realtors and consumers deserve to be congratulated. It’s not easy to adapt quickly to physical distancing, virtual tools and strict personal safety protocols and yet we’re seeing more and more transactions happening daily as we all get more comfortable and confident with the new normal.”
Based on the board report “The Fraser Valley Board received 2,207 new listings in May, a 56% increase compared to April’s intake of 1,416 new listings and a 38% decrease compared to May of last year. May finished with 6,454 active listings, an increase of 8% compared to April’s inventory and a decrease of 24% year-over-year.”
In May, the average number of days to sell an apartment was 38; 36 for townhomes and 31 for single family detached.
Find all the infographics related to the May Market Statistics by visiting the Facebook Album.
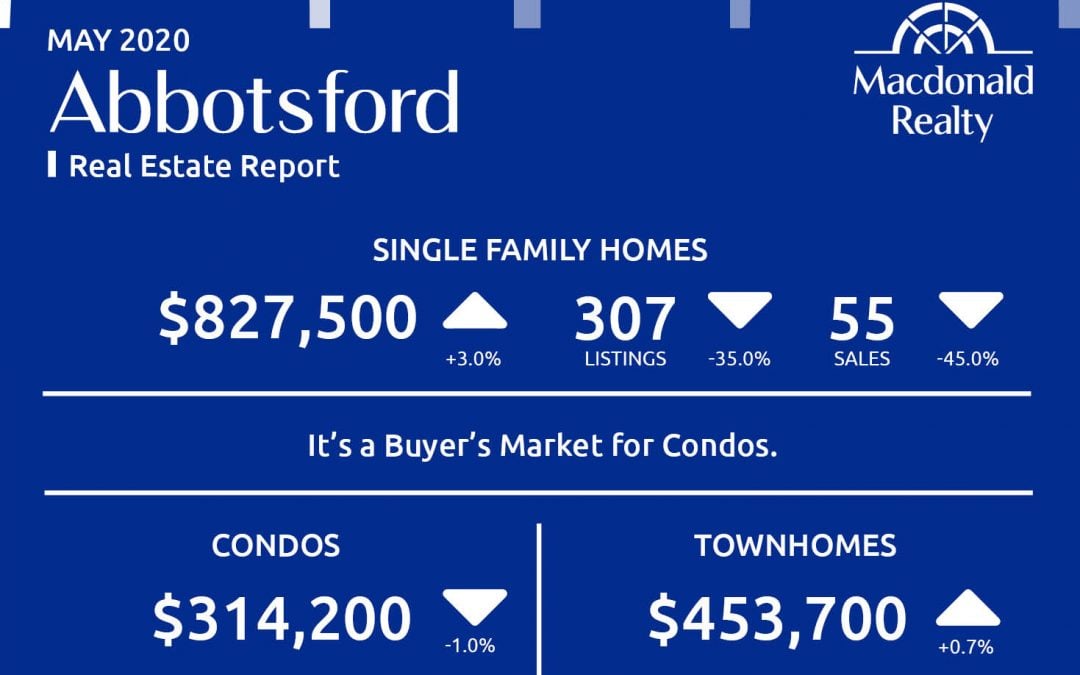
Abbotsford

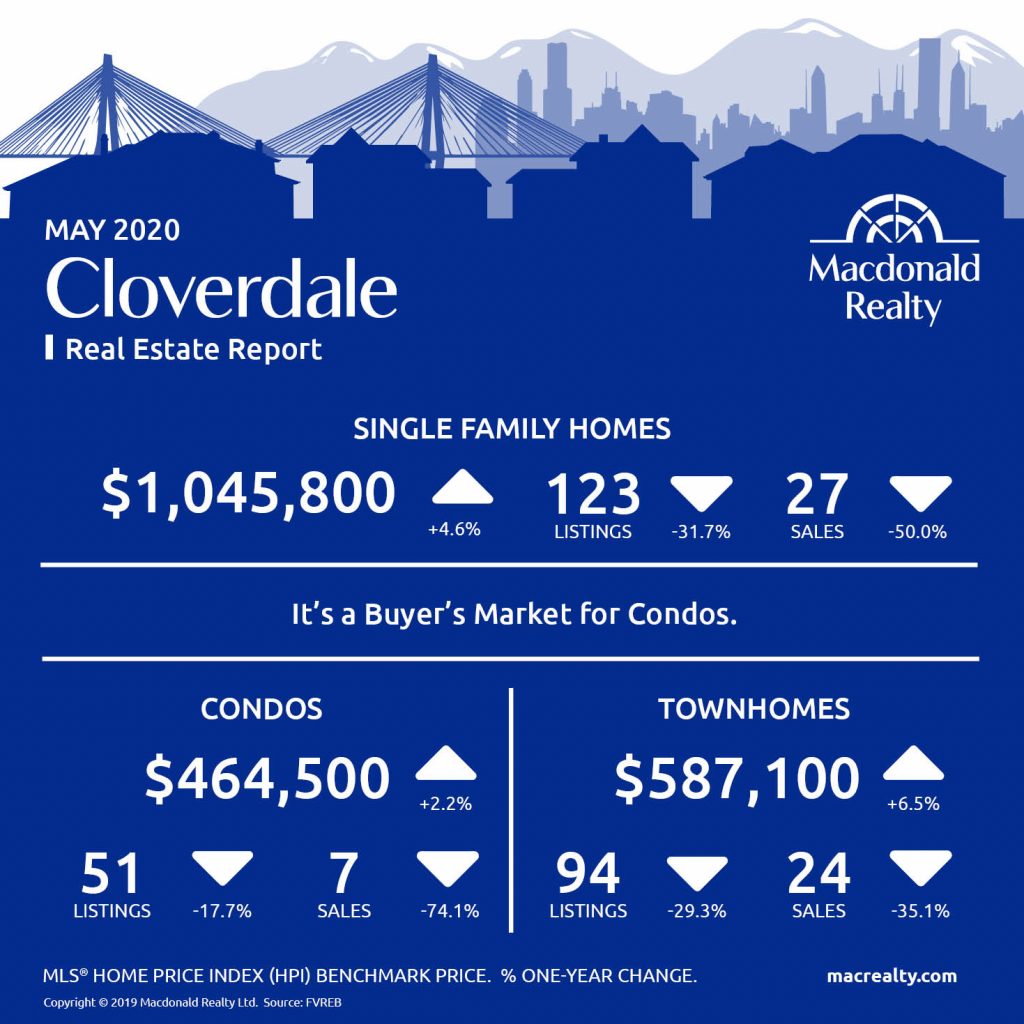
Cloverdale
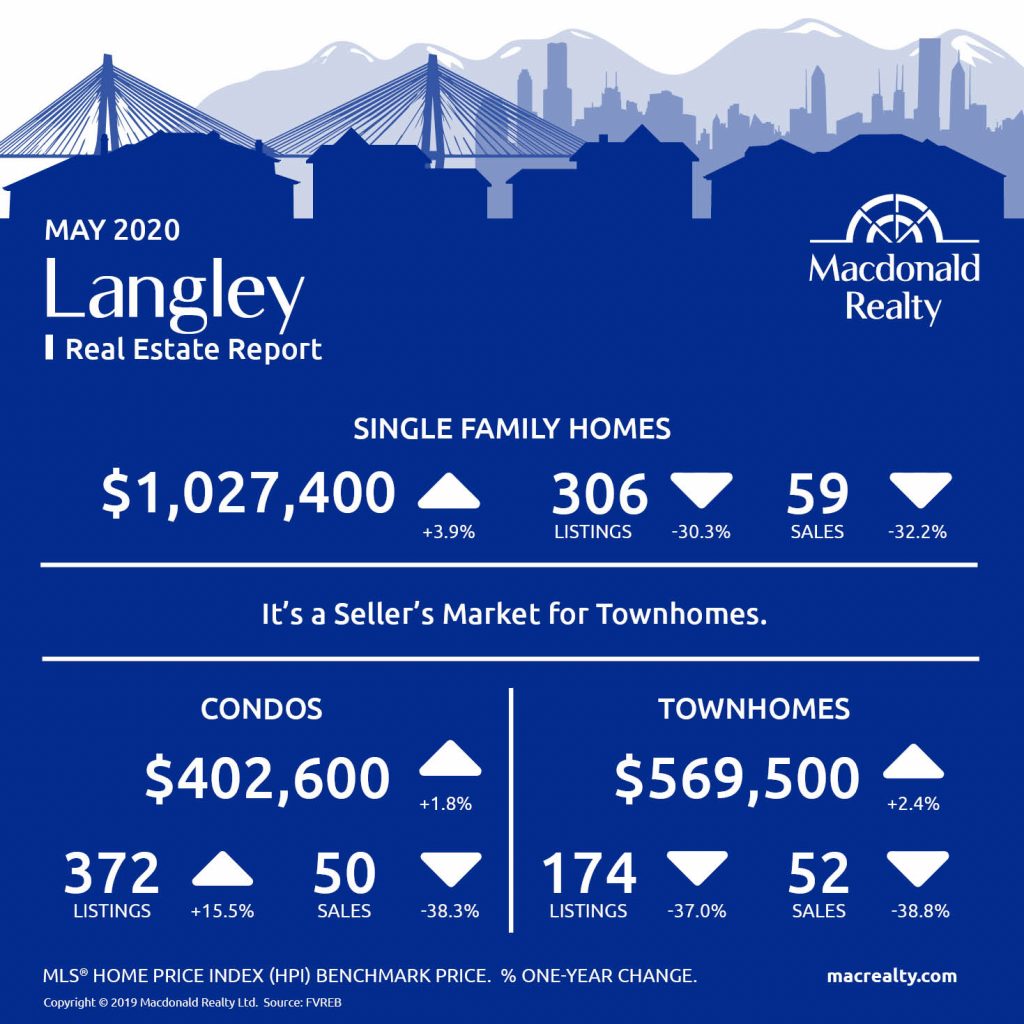
Langley
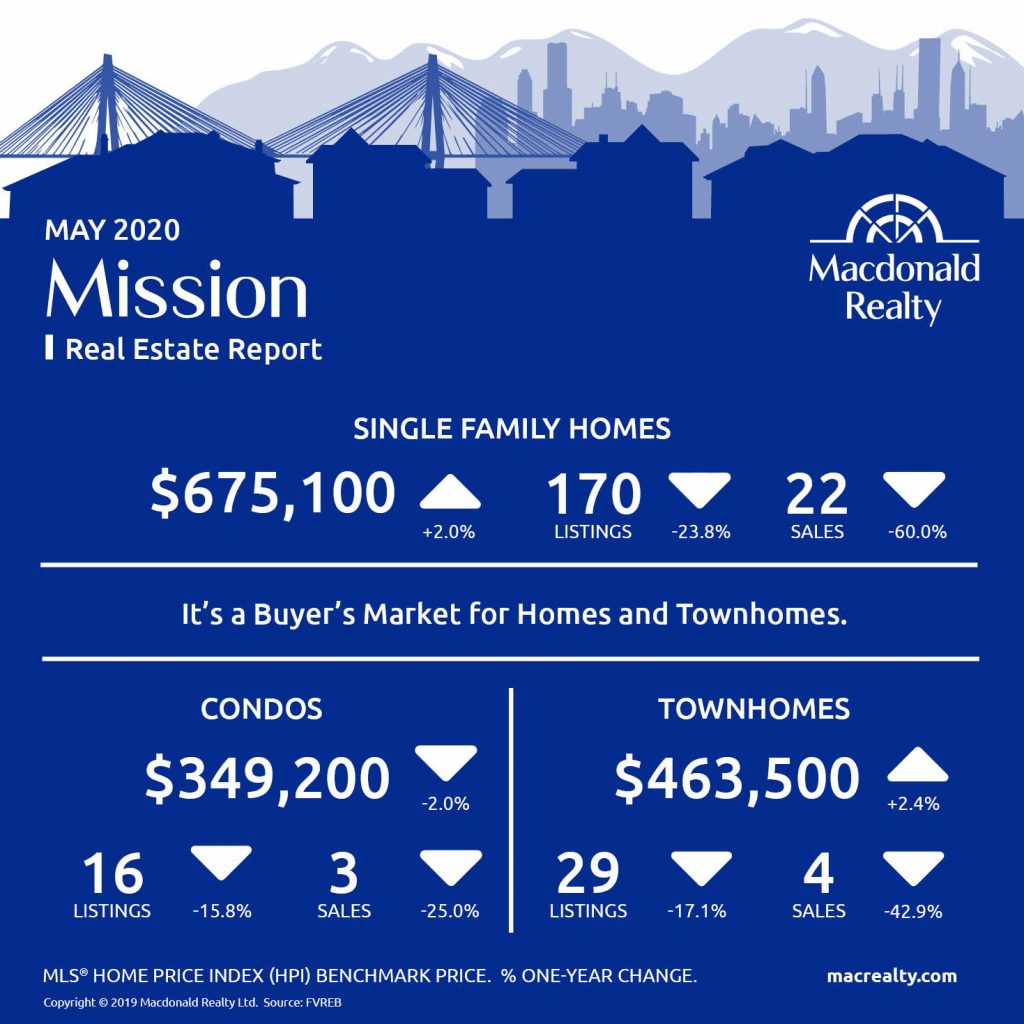
Mission
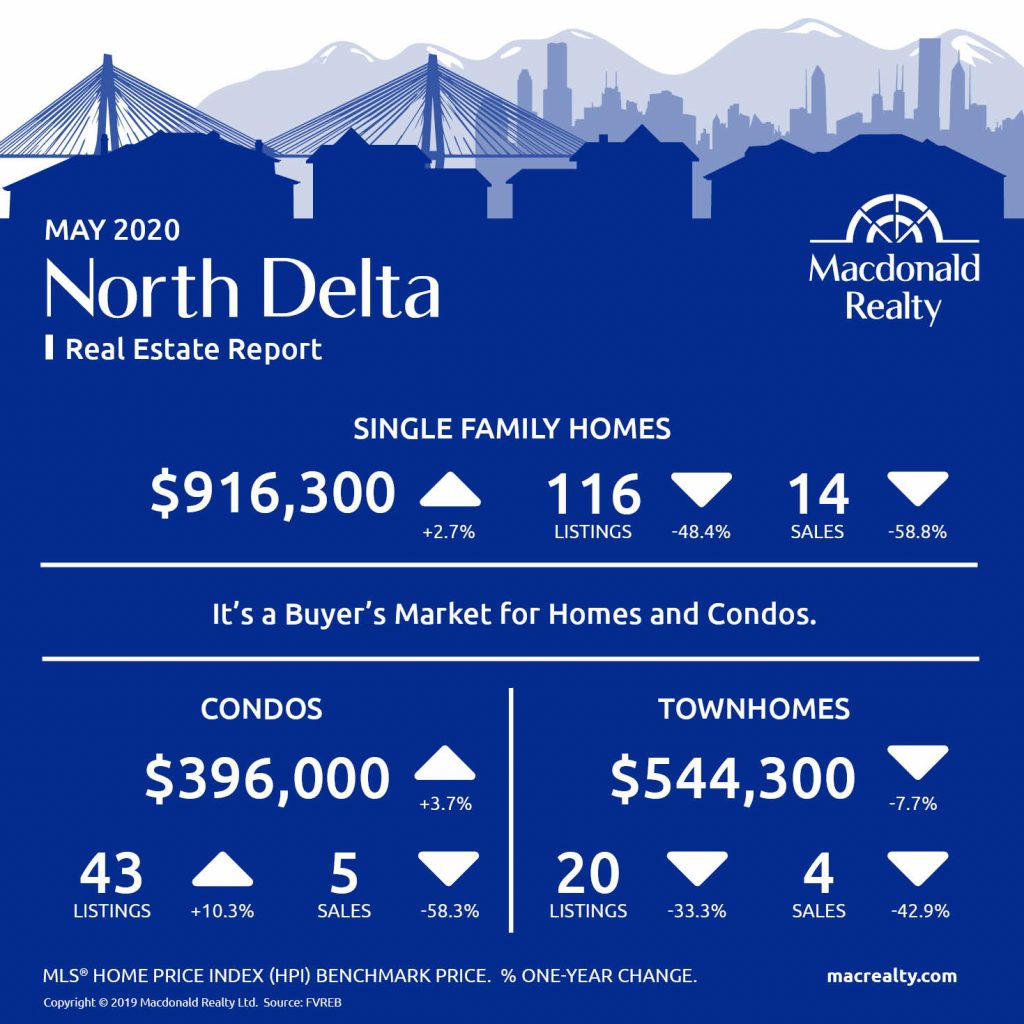
North Delta
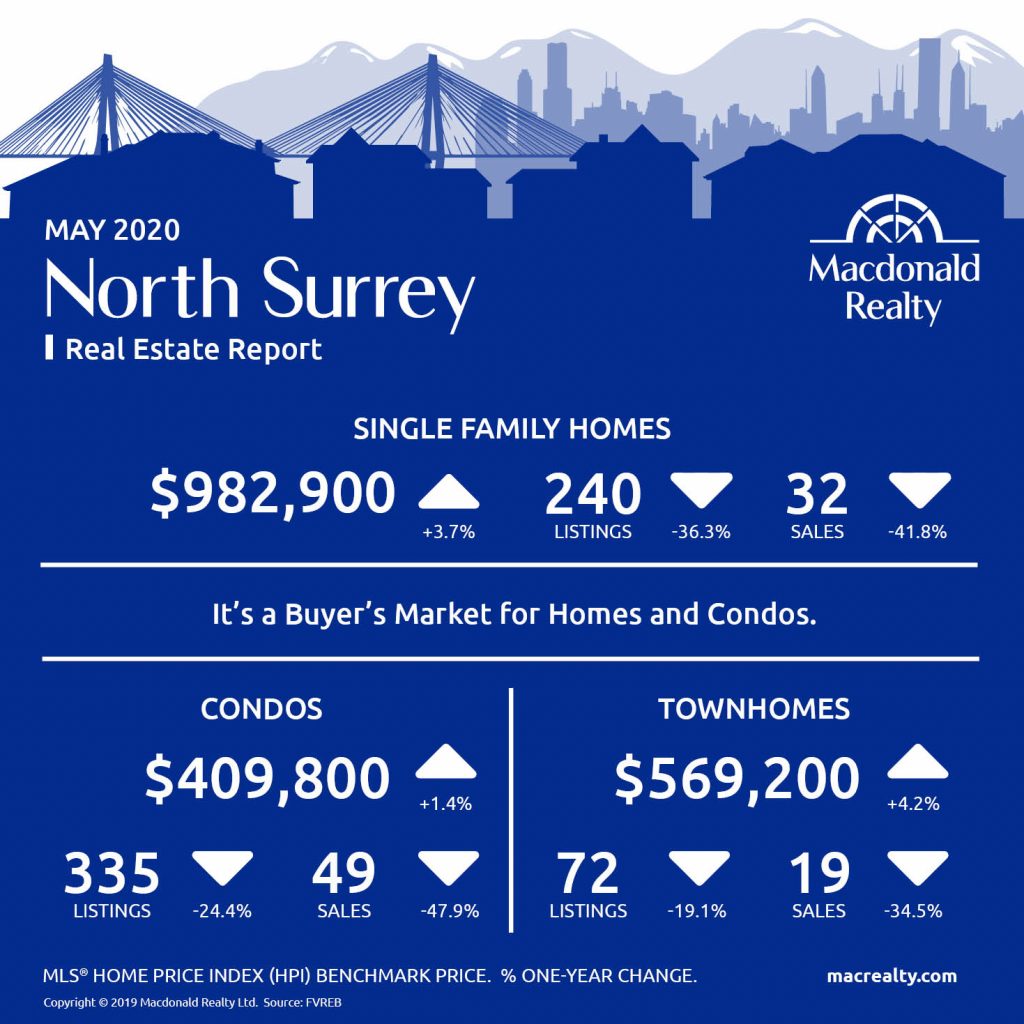
North Surrey
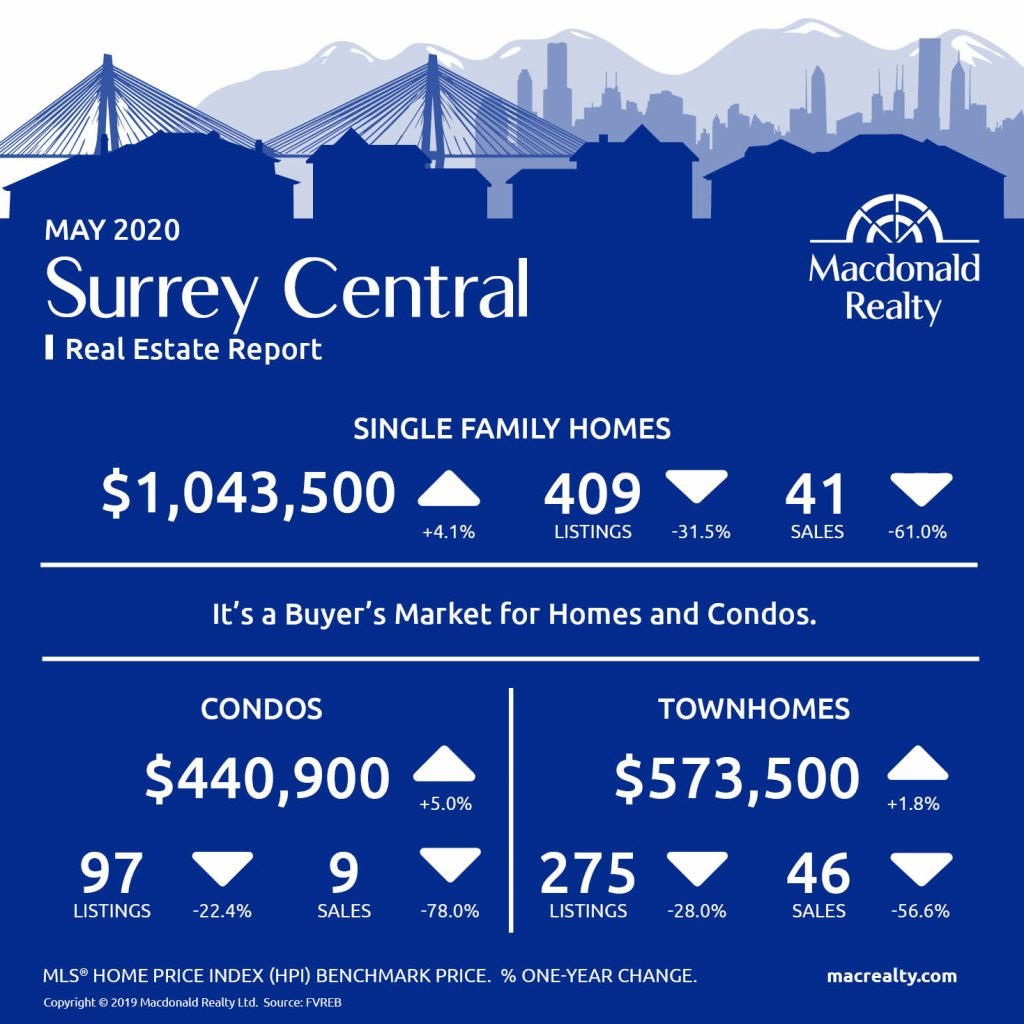
Surrey Central
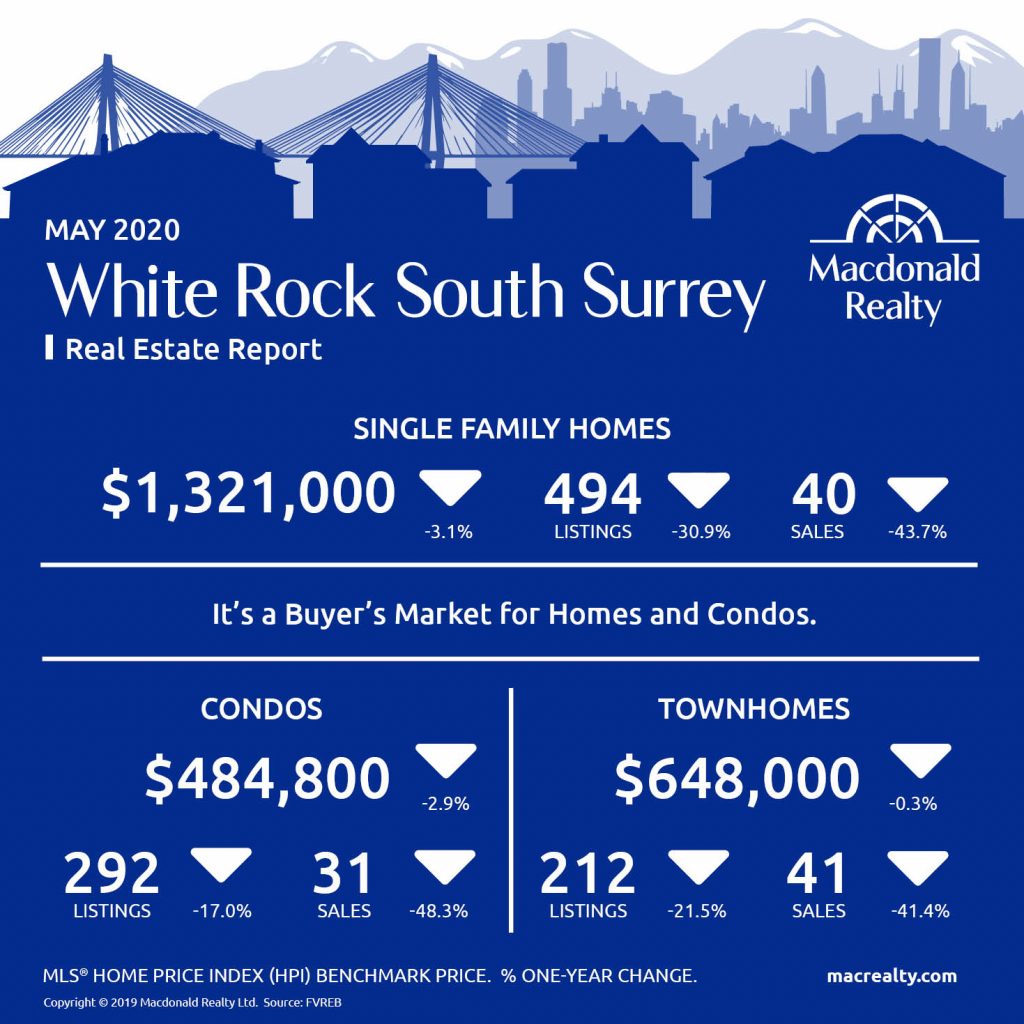
White Rock / South Surrey
Looking for more information about the real estate market in specific neighbourhoods in Surrey, Langley and Fraser Valley?
Macdonald Realty has offices in North Delta, White Rock/South Surrey, and Langley. Please email [email protected] or call 1-877-278-3888 to be matched with a REALTOR® working in your area.
MLS® Home Price Index (HPI) Benchmark Price
Average and median home prices are often misinterpreted, are affected by change in the mix of homes sold, and can swing dramatically from month to month (based on the types and prices of properties that sold in a given month). The MLS® HPI overcomes these shortcomings and uses the concept of a benchmark home, a notional home with common attributes of typical homes in a defined area. Visit www.housepriceindex.ca for more information.
This blog post is based on market data provided by the Fraser Valley Real Estate Board (FVREB) www.fvreb.bc.ca
by Macrealty Marketing Team | May 7, 2020 | Market Updates
Here are the latest real estate market statistics from Macdonald Realty on Greater Victoria, Parksville/Qualicum, and Nanaimo listings and sales in April 2020.
Find all the infographics related to the February Market Statistics by visiting the Facebook Album.
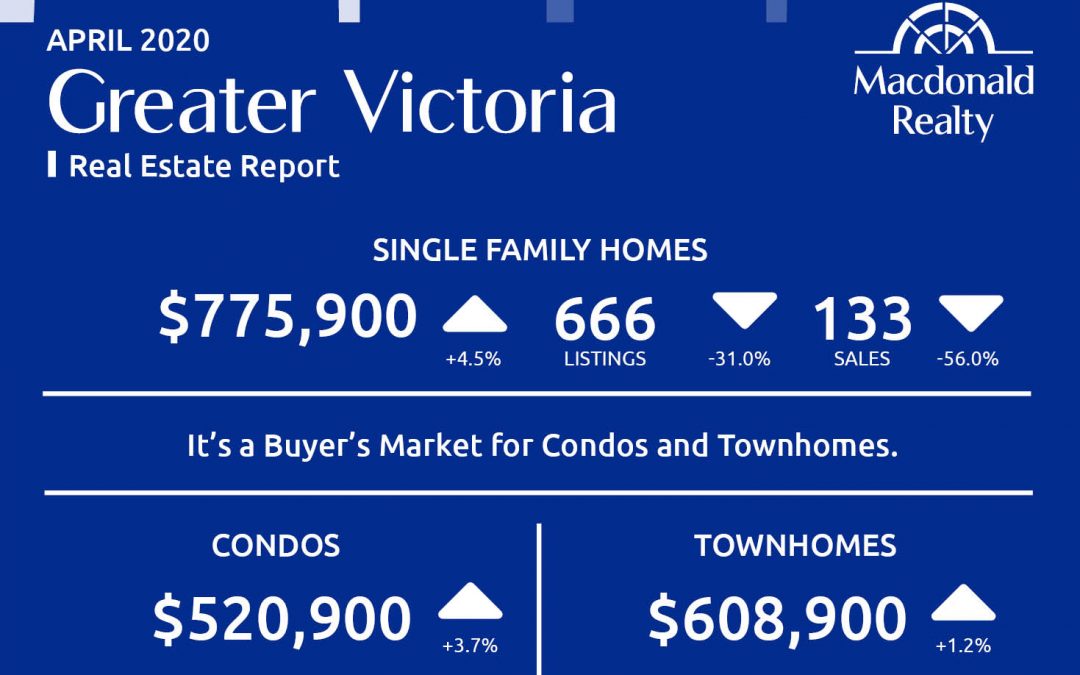
Greater Victoria
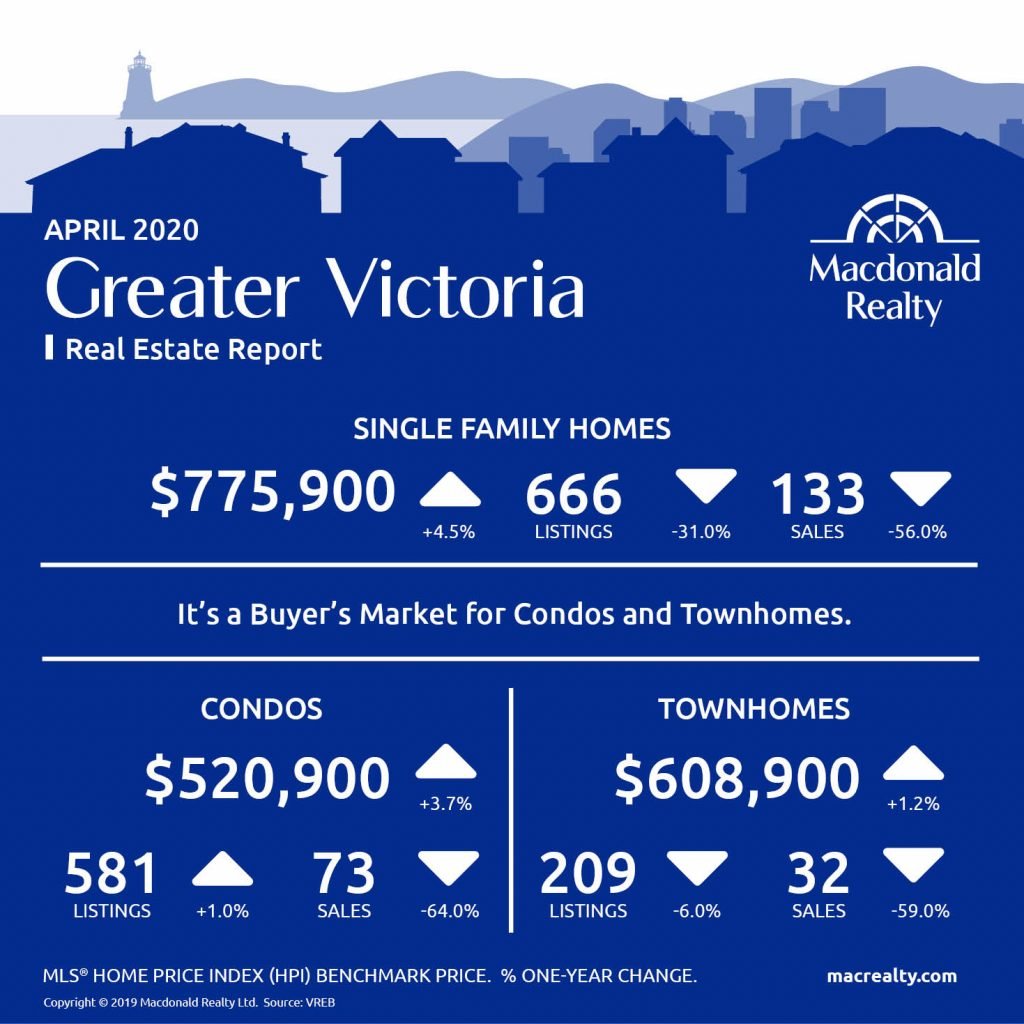
A total of 287 properties sold in the Victoria Real Estate Board region this April, 58.8 per cent fewer than the 696 properties sold in April 2019 and 52.8 per cent fewer than the previous month of March 2020. Sales of condominiums were down 64 per cent from April 2019 with 73 units sold. Sales of single family homes were down 55.8 per cent from April 2019 with 163 sold.
“We continue to see the impact of the COVID-19 pandemic on the local real estate market,” says Victoria Real Estate Board President Sandi-Jo Ayers. “Sales numbers are much lower than what we expected to see this spring and new listings are slow to come to market as owners wait to see what our community’s trajectory is over the course of this pandemic. As a result, the available inventory of properties for sale remains lower than in April last year. Like so many other industries, much of the real estate market is watching, waiting and adapting.”
Greater Victoria had 133 sales and 666 active listings for detached homes at the end of the month. The benchmark sales price was $775,900.
The condo market featured 32 sales, 209 active listings, and a benchmark sales price was $608,900.
The townhome market had 73 sales and 581 active listings. The benchmark sale price was $520,900.
It’s a buyer’s market for Condos and Townhomes in Greater Victoria.
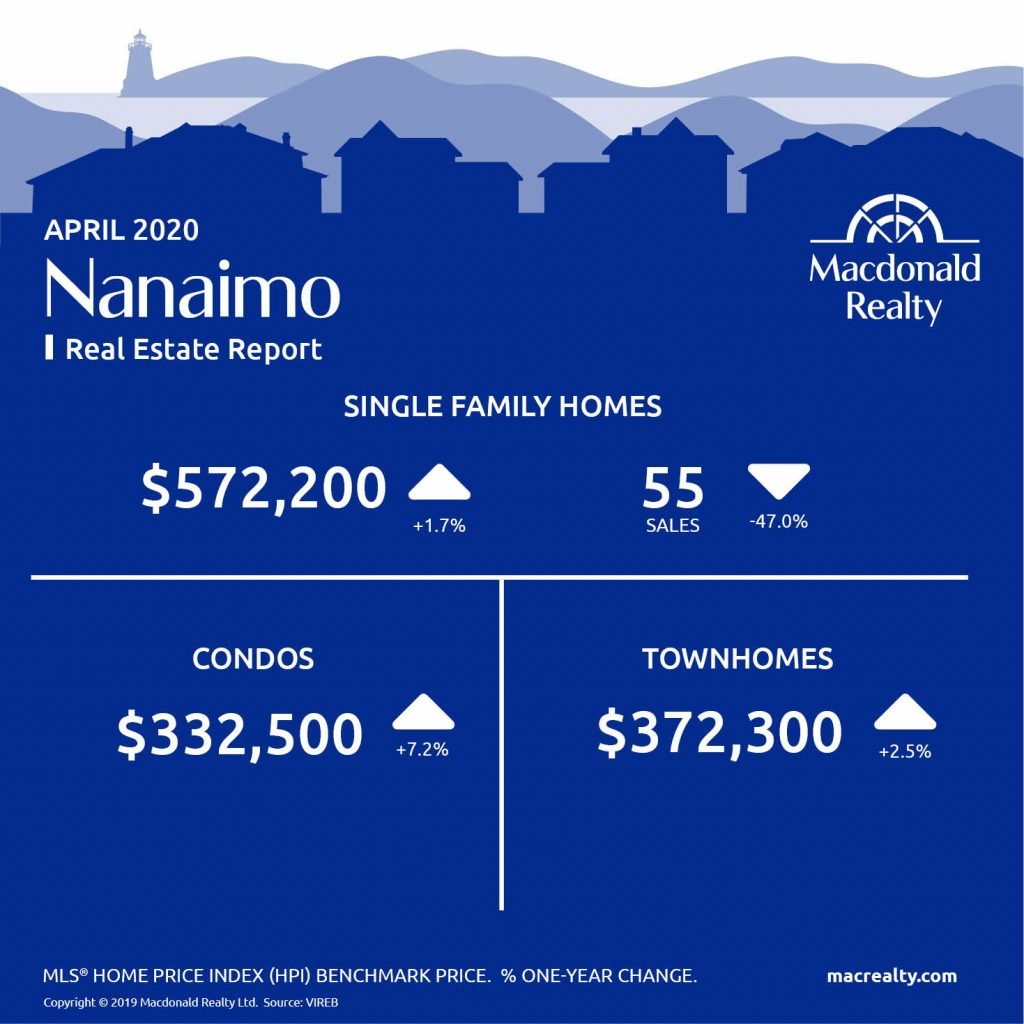
Nanaimo
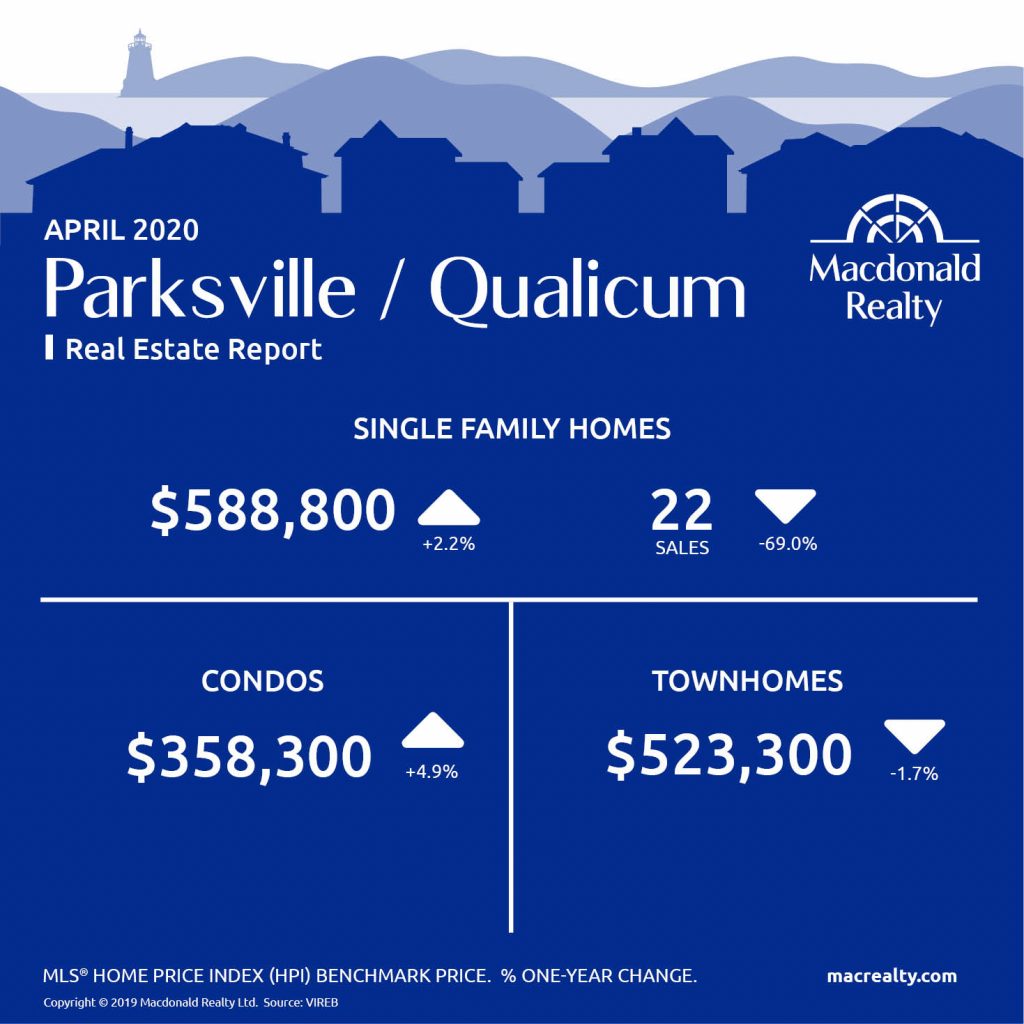
Parksville / Qualicum
Looking for more information about the real estate market in specific neighbourhoods in Victoria, Parksville, Nanaimo, Vancouver Island and the Gulf Islands?
Macdonald Realty has offices in downtown Victoria, Sidney, Parksville and on Salt Spring Island. Please email [email protected] or call 1-877-278-3888 to be matched with a REALTOR® working in your area.
MLS® Home Price Index (HPI) Benchmark Price
Average and median home prices are often misinterpreted, are affected by change in the mix of homes sold, and can swing dramatically from month to month (based on the types and prices of properties that sold in a given month). The MLS® HPI overcomes these shortcomings and uses the concept of a benchmark home, a notional home with common attributes of typical homes in a defined area. Visit www.housepriceindex.ca for more information.
This blog post is based on market data provided by the Victoria Real Estate Board (VREB) www.vreb.org and the Vancouver Island Real Estate Board (VIREB) www.vireb.com. Market data from the VIREB includes listings and sales in Campbell River, Comox Valley, Cowichan Valley Nanaimo, Parksville/Qualicum, Port Alberni/West, North Island, and the Islands.
by Macrealty Marketing Team | May 7, 2020 | Market Updates
Here are the latest real estate market statistics from Macdonald Realty on Squamish, Whistler, and Sunshine Coast listings and sales in April 2020.
Find all the infographics related to the March Market Statistics by visiting the Facebook Album.
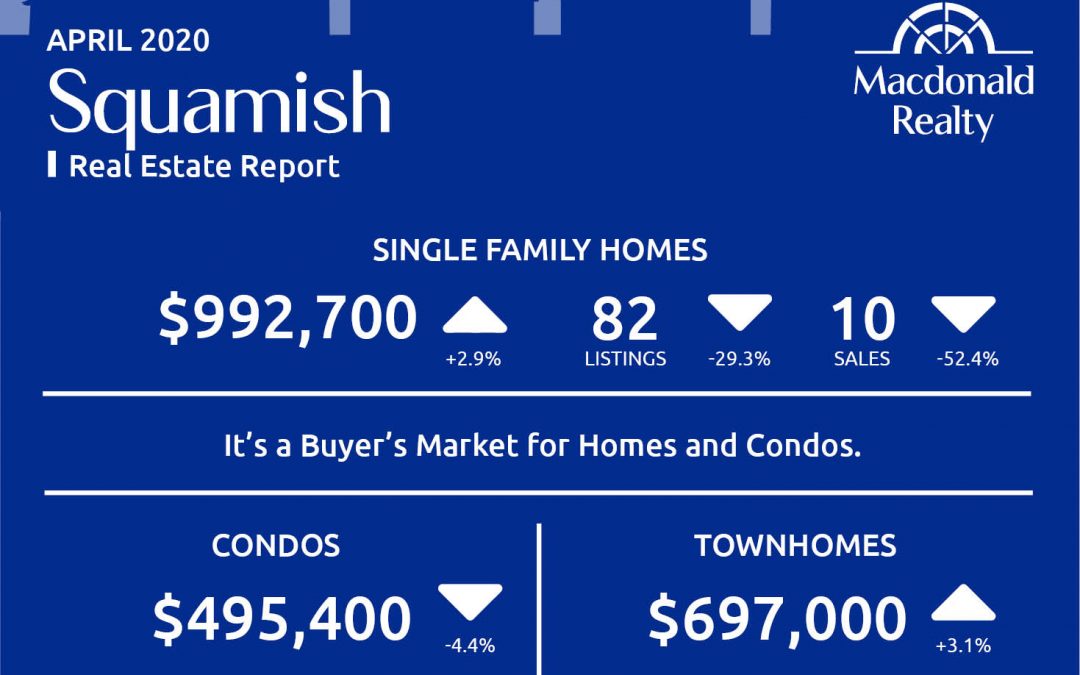
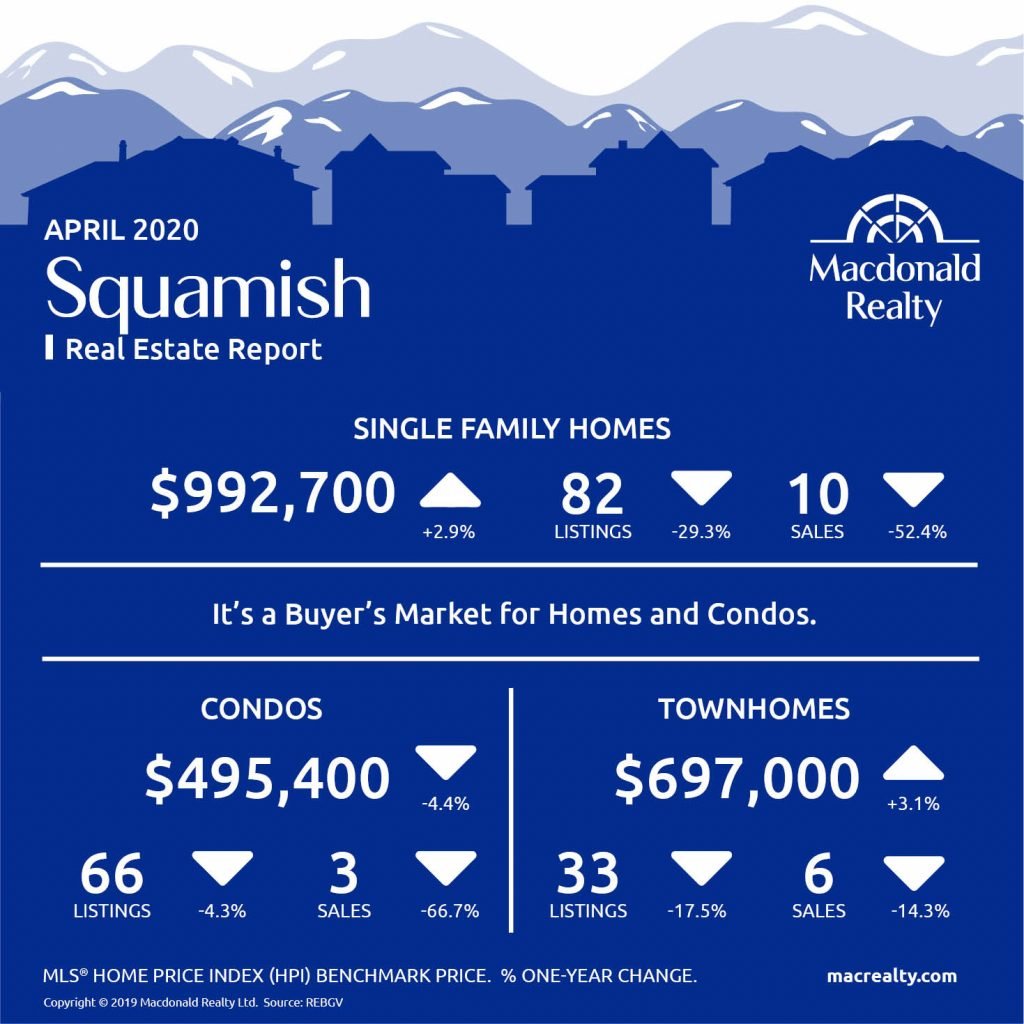
Squamish
In April 2020, there were 10 sales of detached homes and 82 active listings in Squamish. The benchmark sale price was $992,700.
The condo market had 3 sales and 66 active listings at the end of the month. The benchmark sale price was $495,400.
The townhome market had 6 sales and, the active listings were 33. The benchmark sale price was $697,000.
It’s a buyer’s market for homes and condos in Squamish.
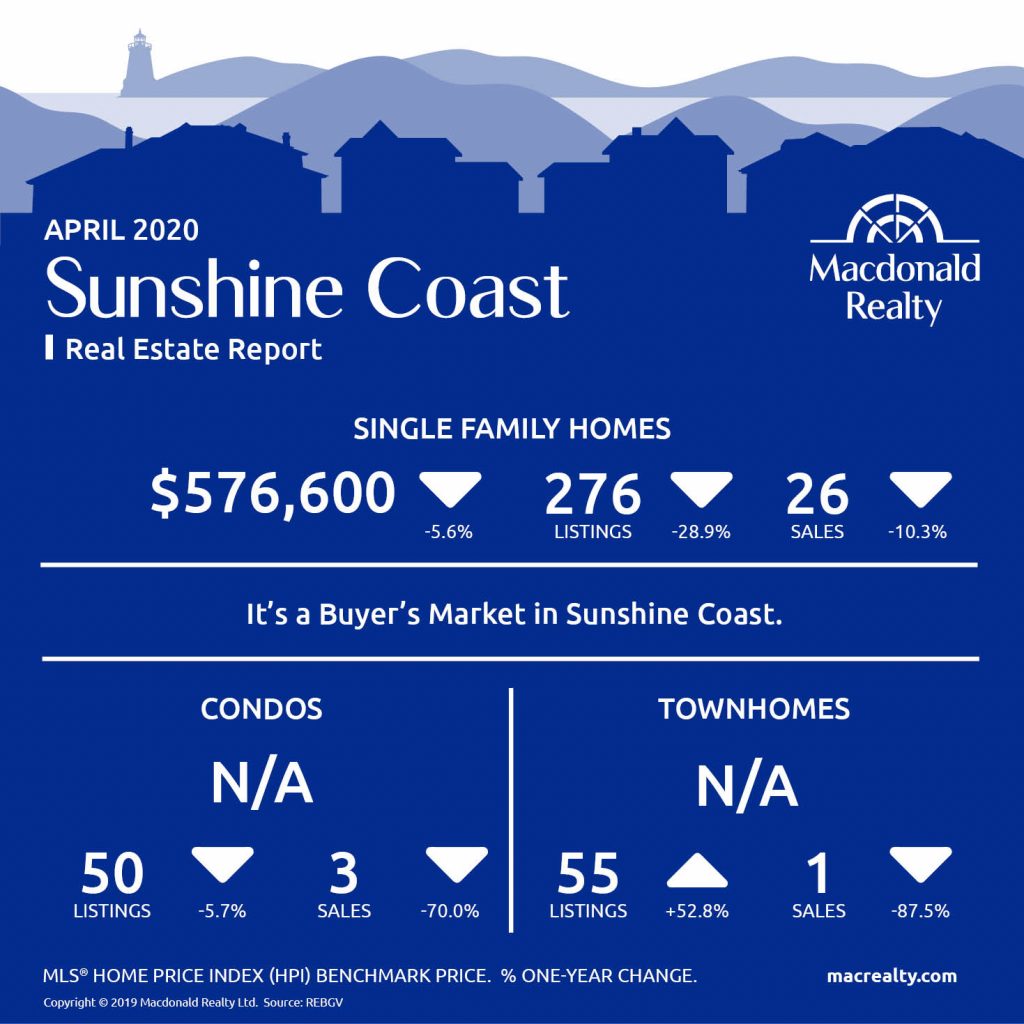
Sunshine Coast
In April 2020, Sunshine Coast had 26 sales of detached homes and 276 active listings. The benchmark sale price was $576,600.
The condo market had 3 sales and 50 active listings at the end of the month.
Townhome sales were 1 sale while active listings were 55.
It’s a buyer’s market in Sunshine Coast.
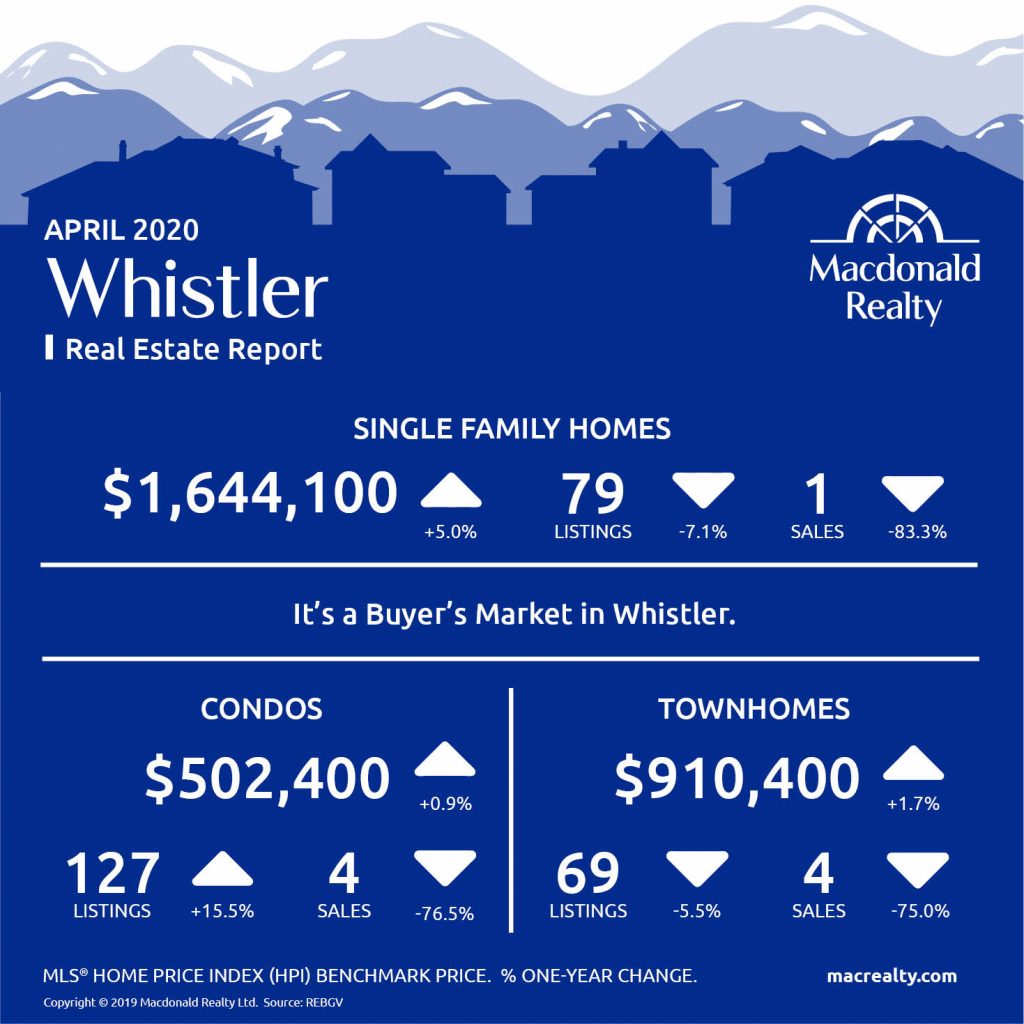
Whistler
In April 2020, Whistler had 1 sale of detached homes and 79 active listings. The benchmark sale price was $1,644,100.
The condo market had 4 sales and 127 active listings at the end of the month. The benchmark sale price was $502,400.
Townhome sales were 4 sales, active listings were 69.
The benchmark sale price was $904,400.
It’s a buyer’s market in Whistler.
Looking for more information about the real estate market in specific neighbourhoods in Squamish, Whistler, and Sunshine Coast? Macdonald Realty has offices in Squamish, Whistler, and Sunshine Coast. Please email [email protected] or call 1-877-278-3888 to be matched with a REALTOR® working in your area.
MLS® Home Price Index (HPI) Benchmark Price
Average and median home prices are often misinterpreted, are affected by change in the mix of homes sold, and can swing dramatically from month to month (based on the types and prices of properties that sold in a given month). The MLS® HPI overcomes these shortcomings and uses the concept of a benchmark home, a notional home with common attributes of typical homes in a defined area. Visit www.housepriceindex.ca for more information.
This blog post is based on market data provided by the Real Estate Board of Greater Vancouver (REBGV) www.rebgv.org
by Macrealty Marketing Team | May 6, 2020 | Market Updates
Here are the latest real estate market statistics from Macdonald Realty on the Greater Vancouver listings and sales in April 2020.
“Predictably, the number of home sales and listings declined in April given the physical distancing measures in place,” Colette Gerber, REBGV’s president-elect said. “People are, however, adapting. They’re working with their Realtors to get information, advice and to explore their options so that they’re best positioned in the market during and after this pandemic.”
Find all the infographics by visiting the Facebook Album.
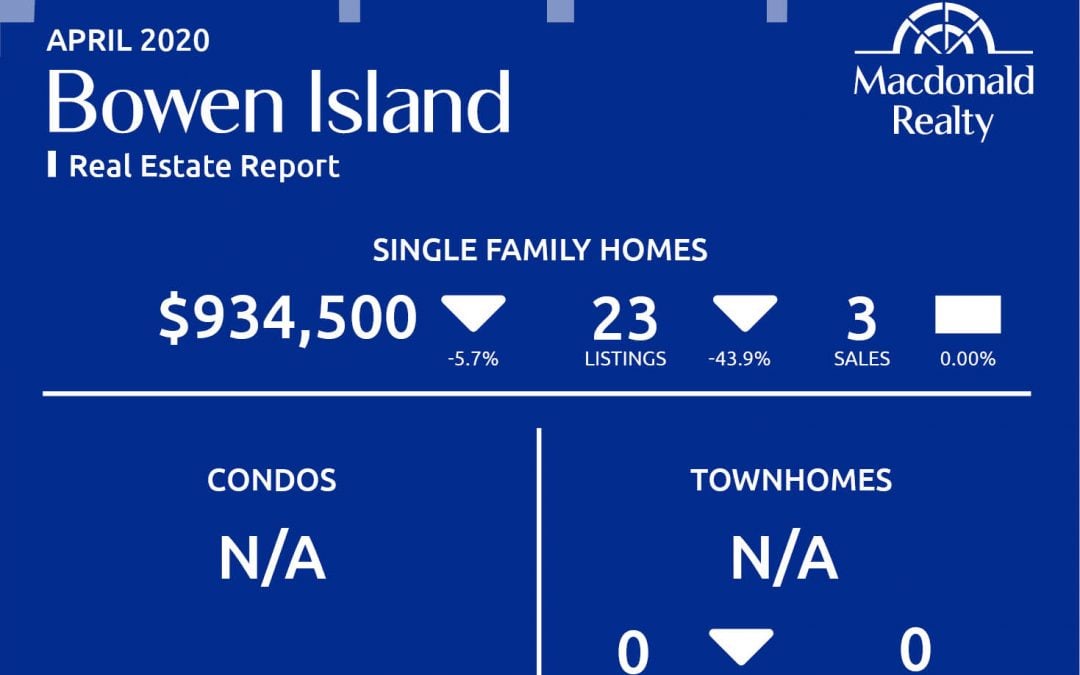
Bowen Island
Bowen Island had 3 sales and 23 active listings for detached homes at the end of the month. The benchmark sales price was $934,500.

Burnaby East
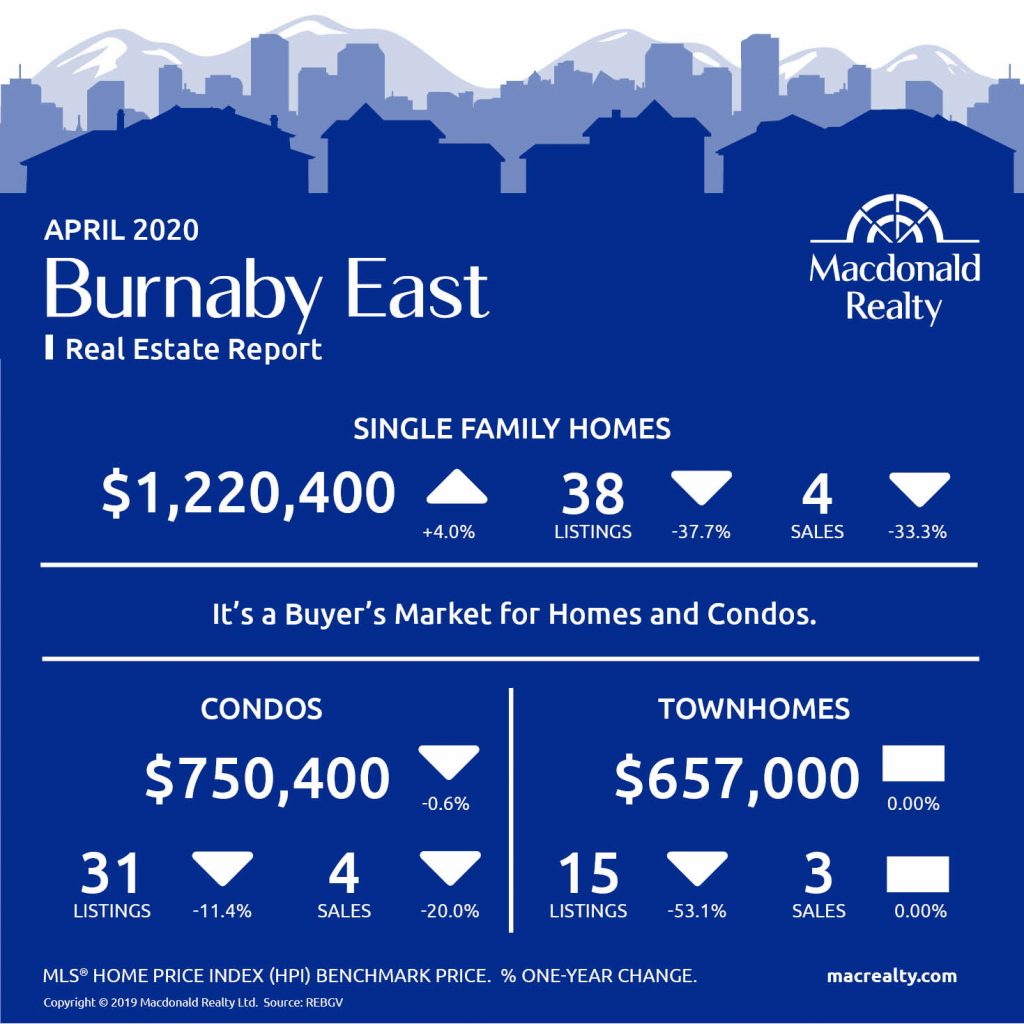
Burnaby East had 4 sales and 38 active listings for detached homes at the end of the month. The benchmark sales price was $1,220,400.
The condo market featured 4 sales, 31 active listings, and a benchmark sales price was $750,400.
The townhome market had 3 sales and 15 active listings. The benchmark sale price was $657,000.
It’s a buyer’s market for Homes and Condos in Burnaby East.
Burnaby North
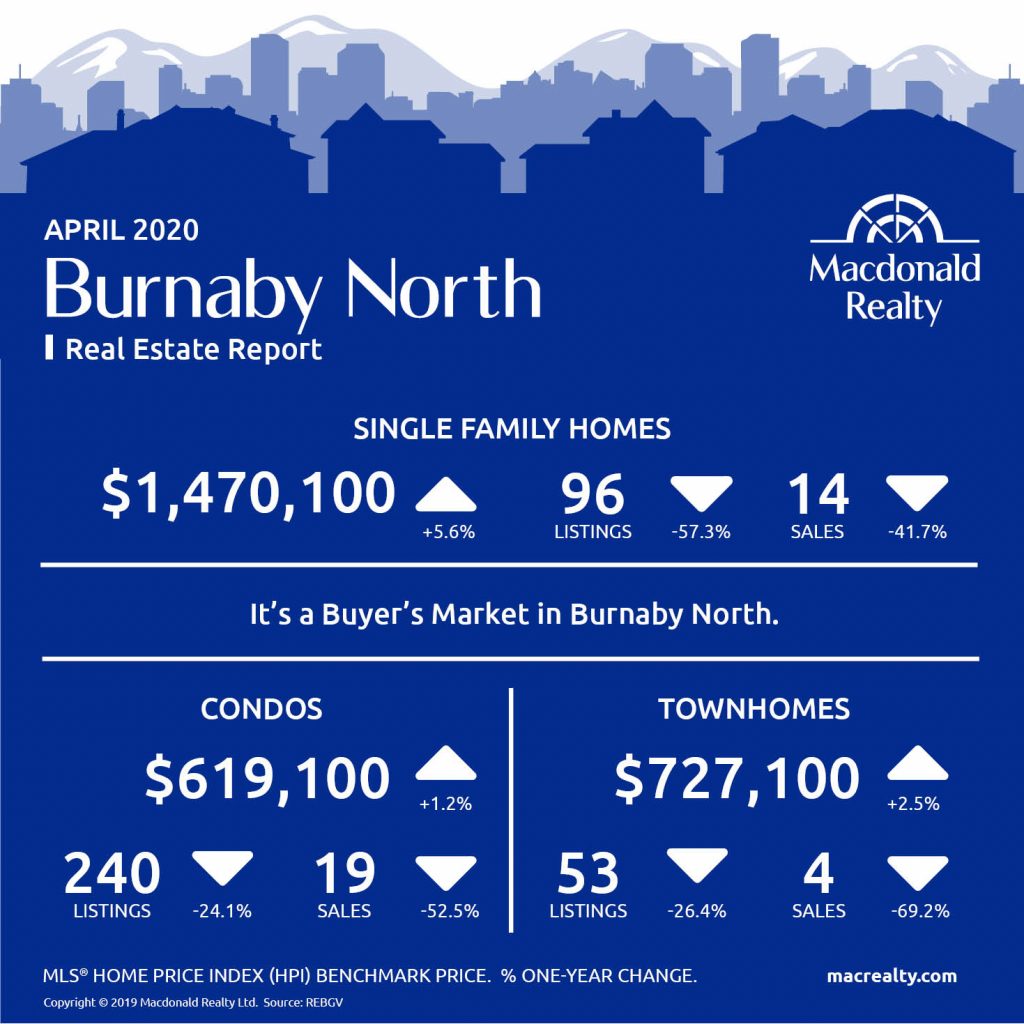
Burnaby North had 14 sales and 96 active listings for detached homes at the end of the month. The benchmark sales price was $1,470,100.
The condo market featured 19 sales, 240 active listings, and a benchmark sales price was $619,100.
The townhome market had 4 sales and 53 active listings. The benchmark sale price was $727,100.
It’s a buyer’s market for in Burnaby North.
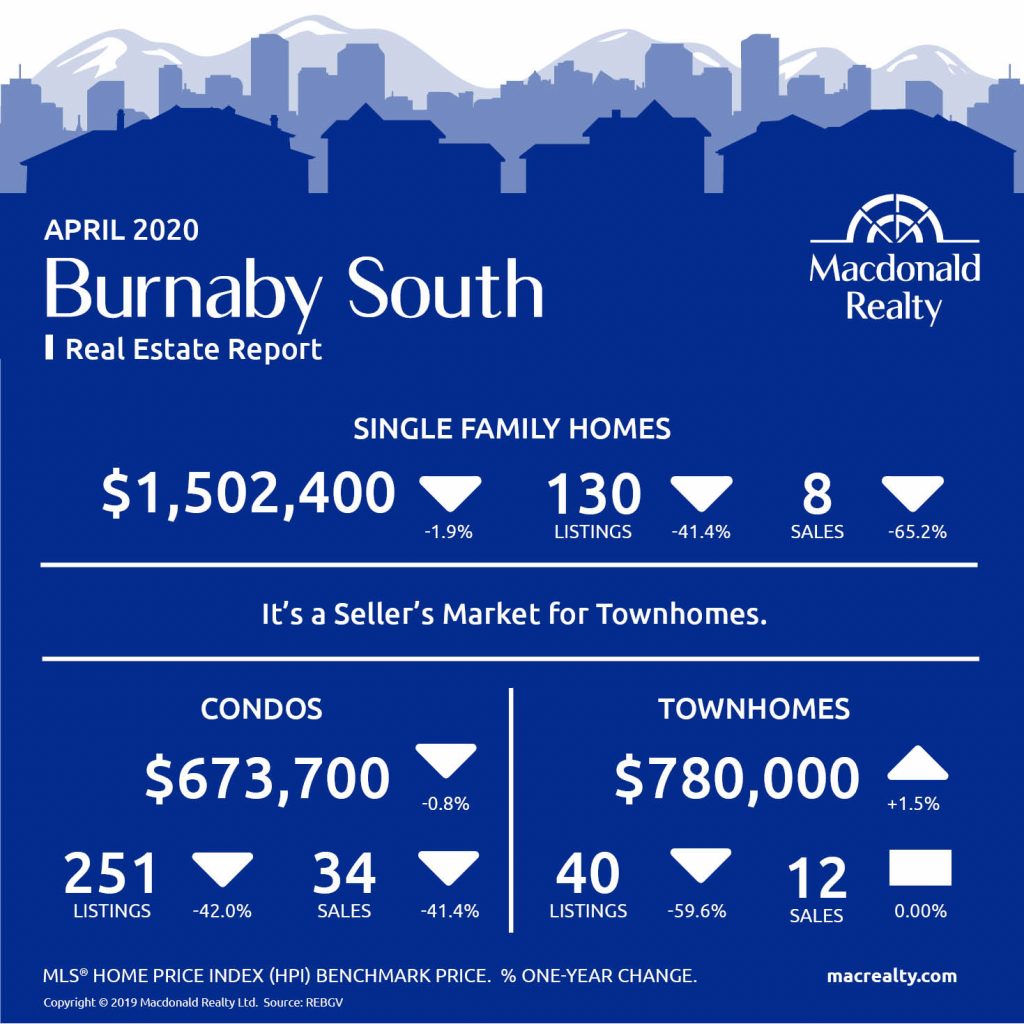
Burnaby South
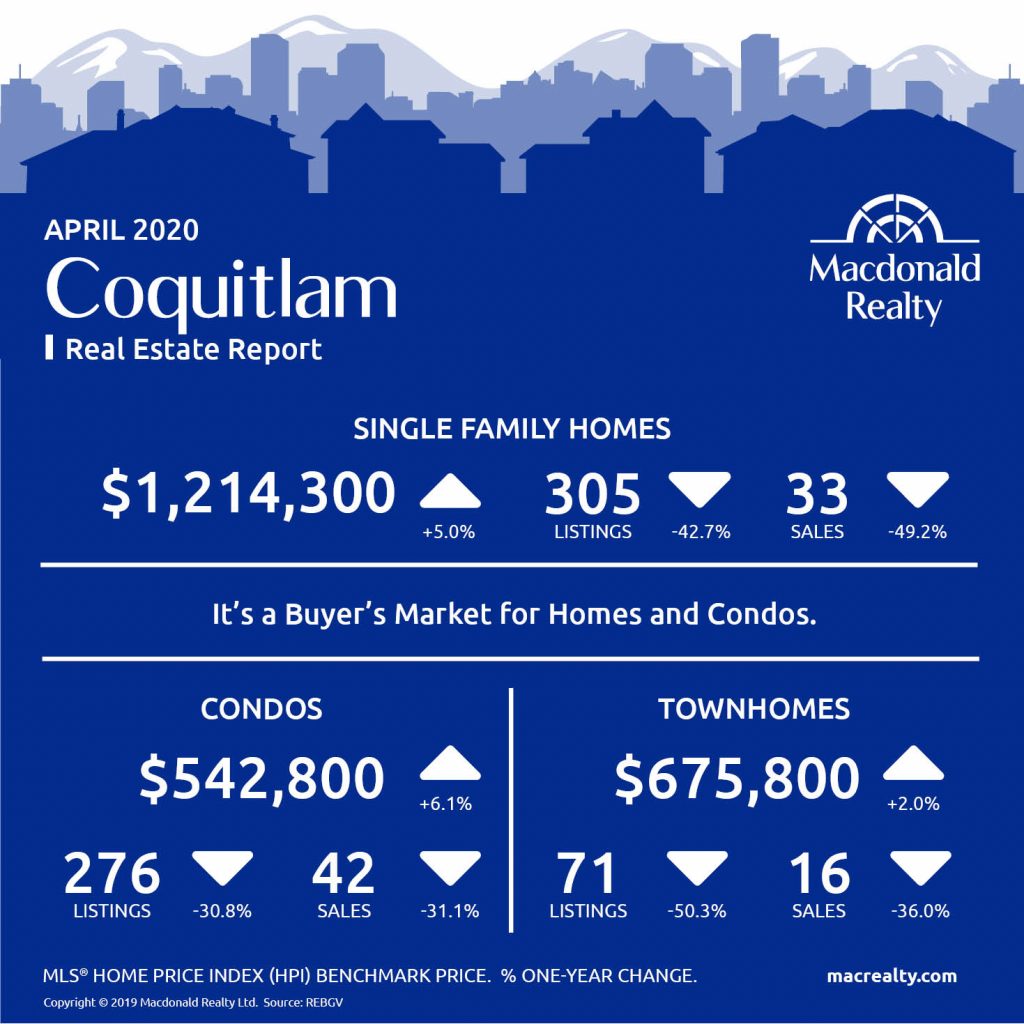
Coquitlam
Ladner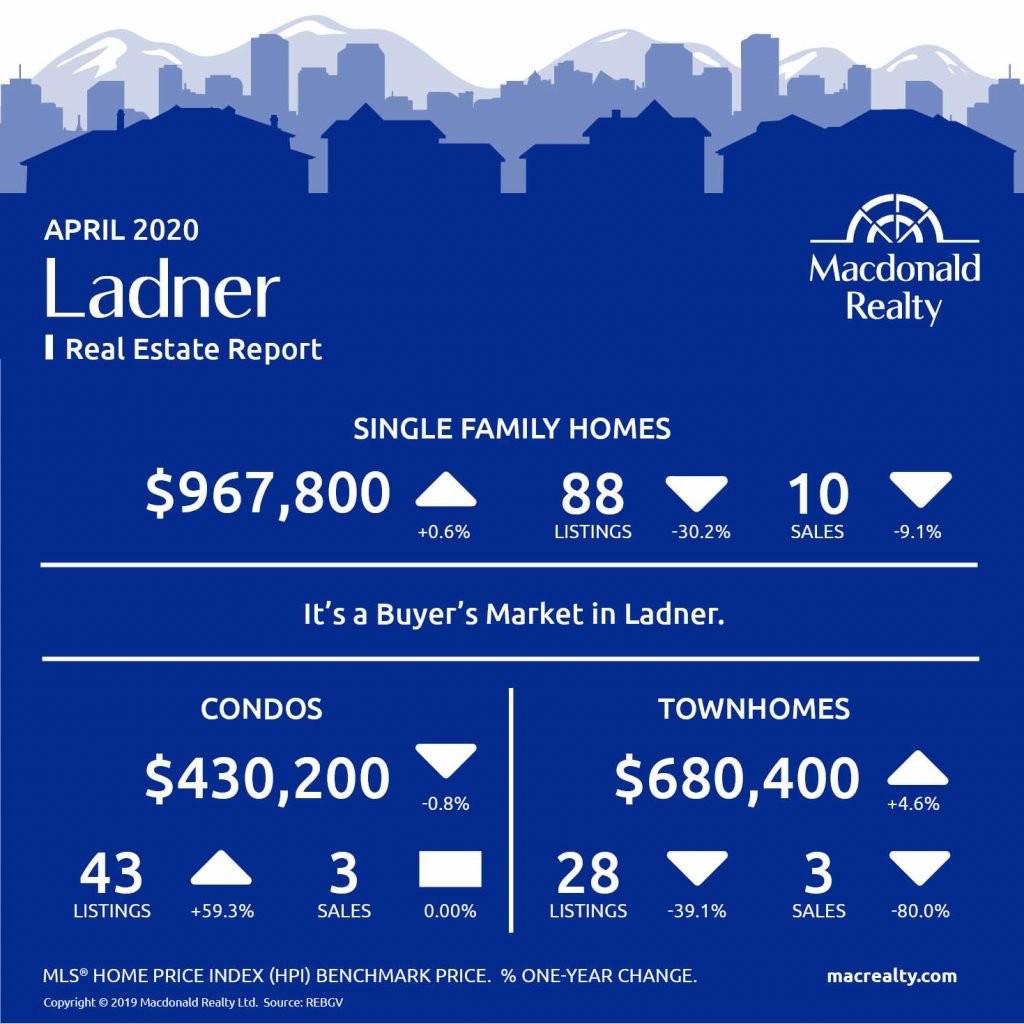
Maple Ridge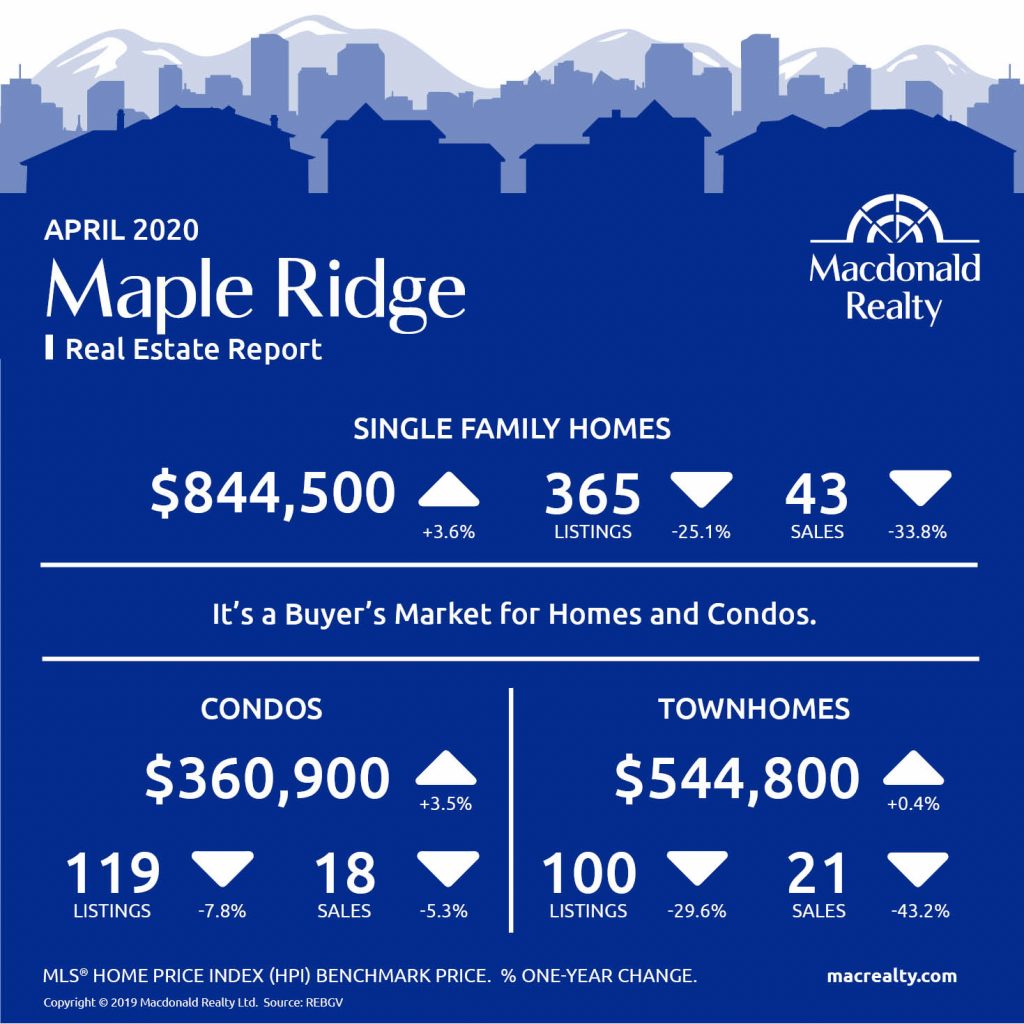
New Westminster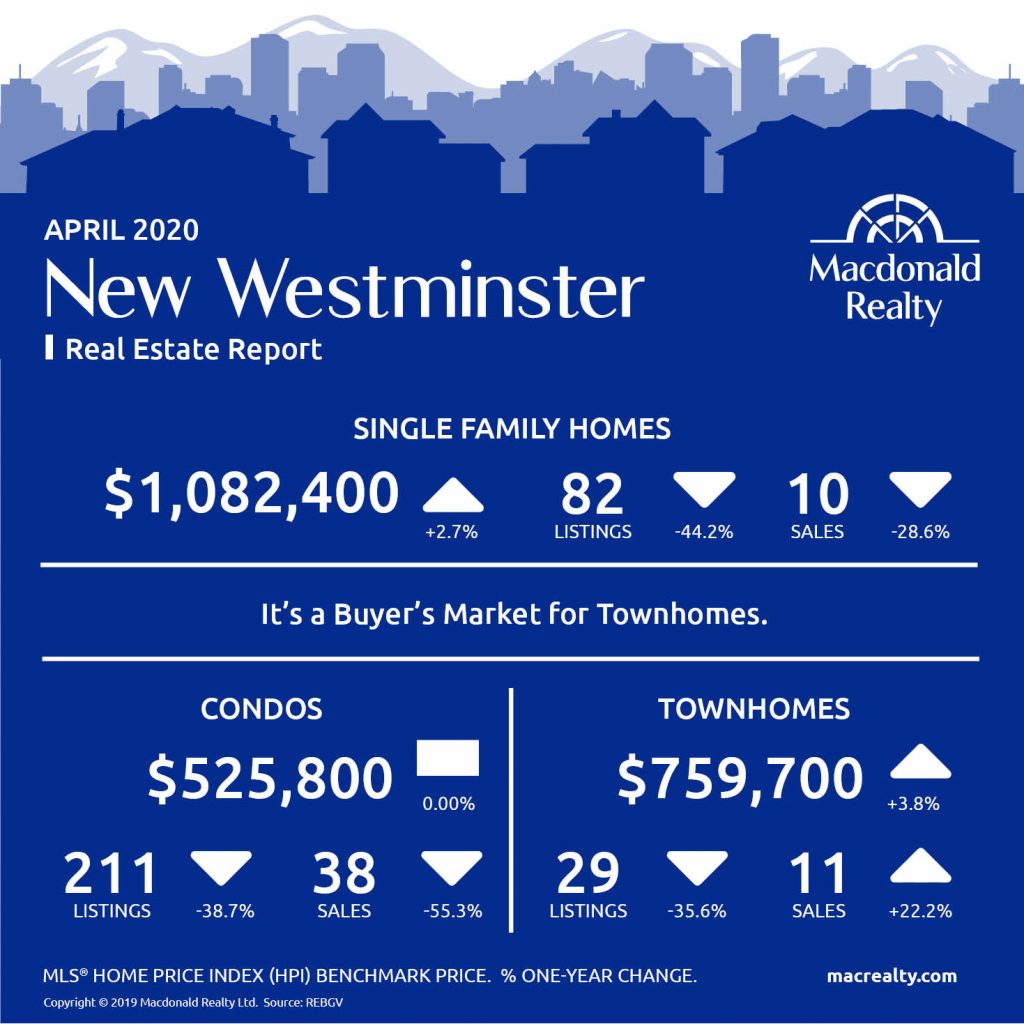
North Vancouver
Pitt Meadows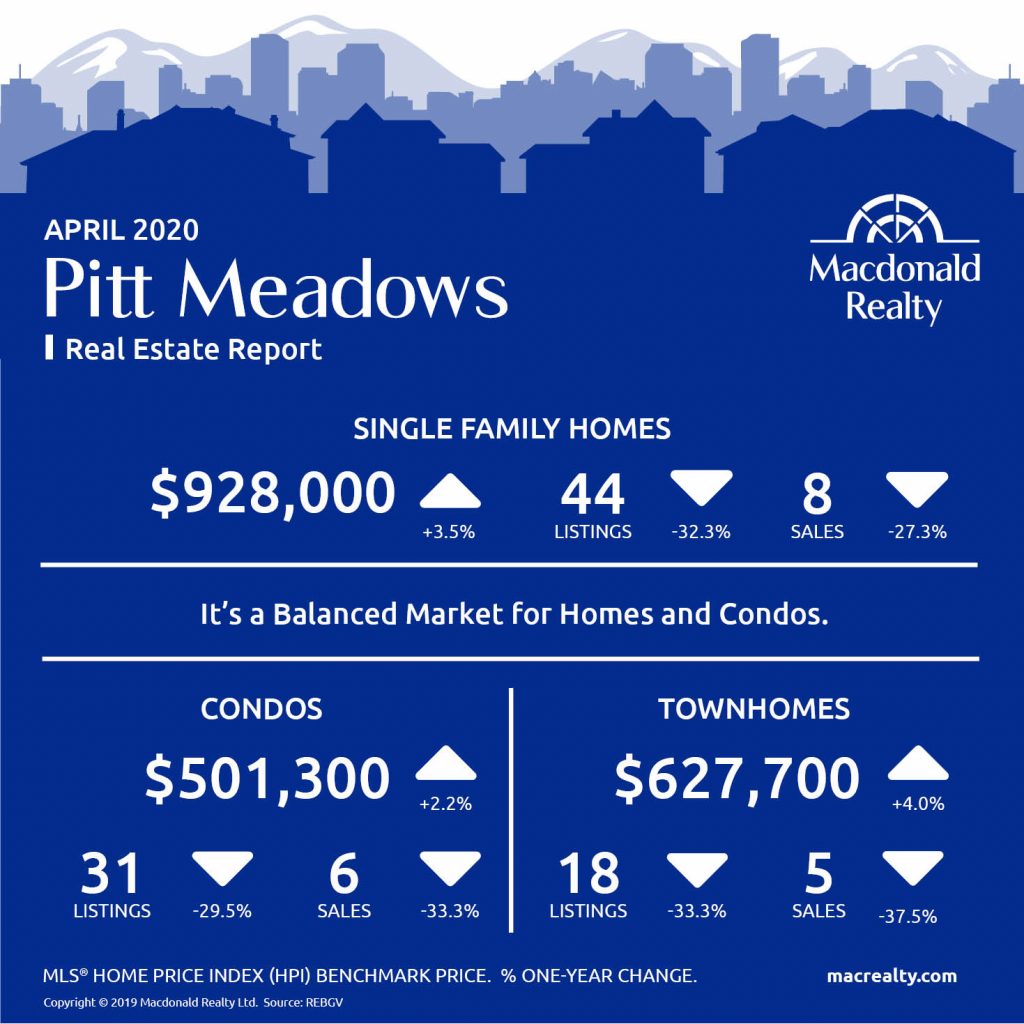
Port Coquitlam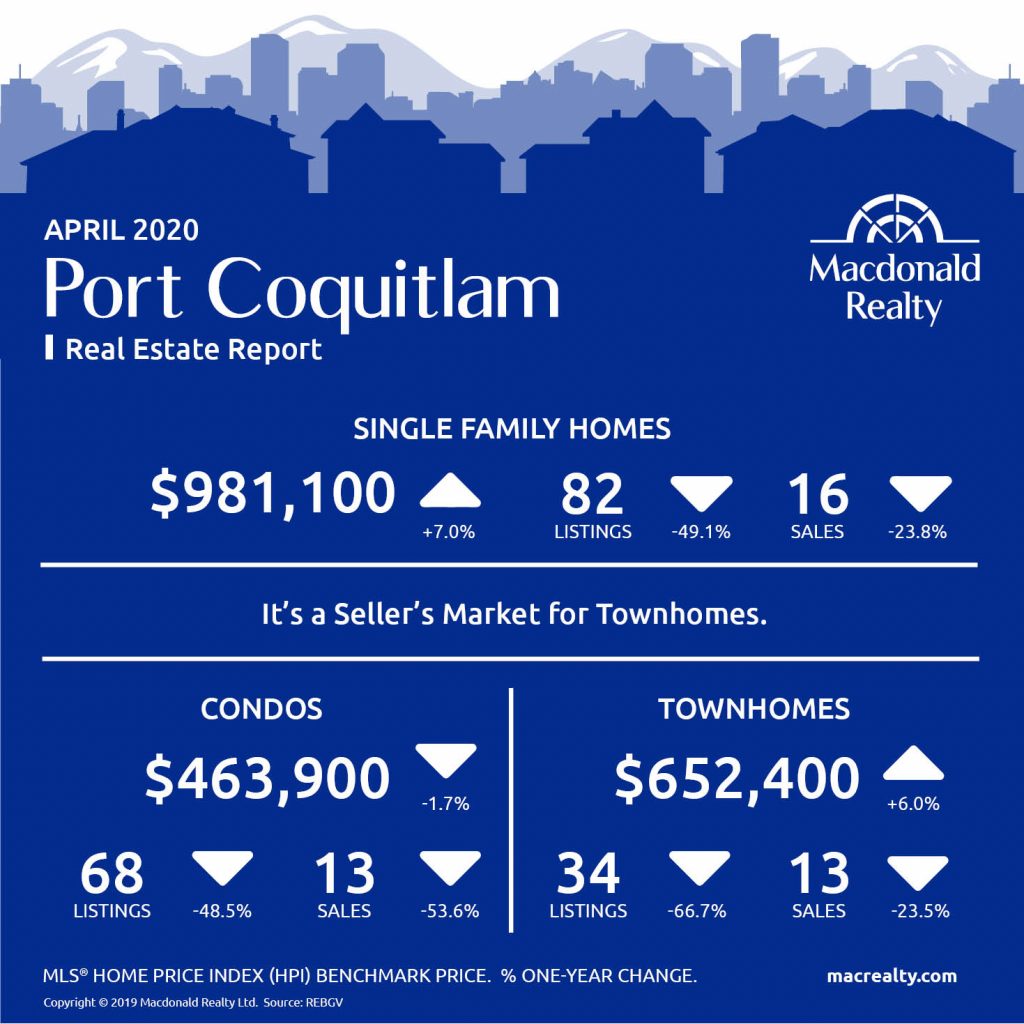
Port Moody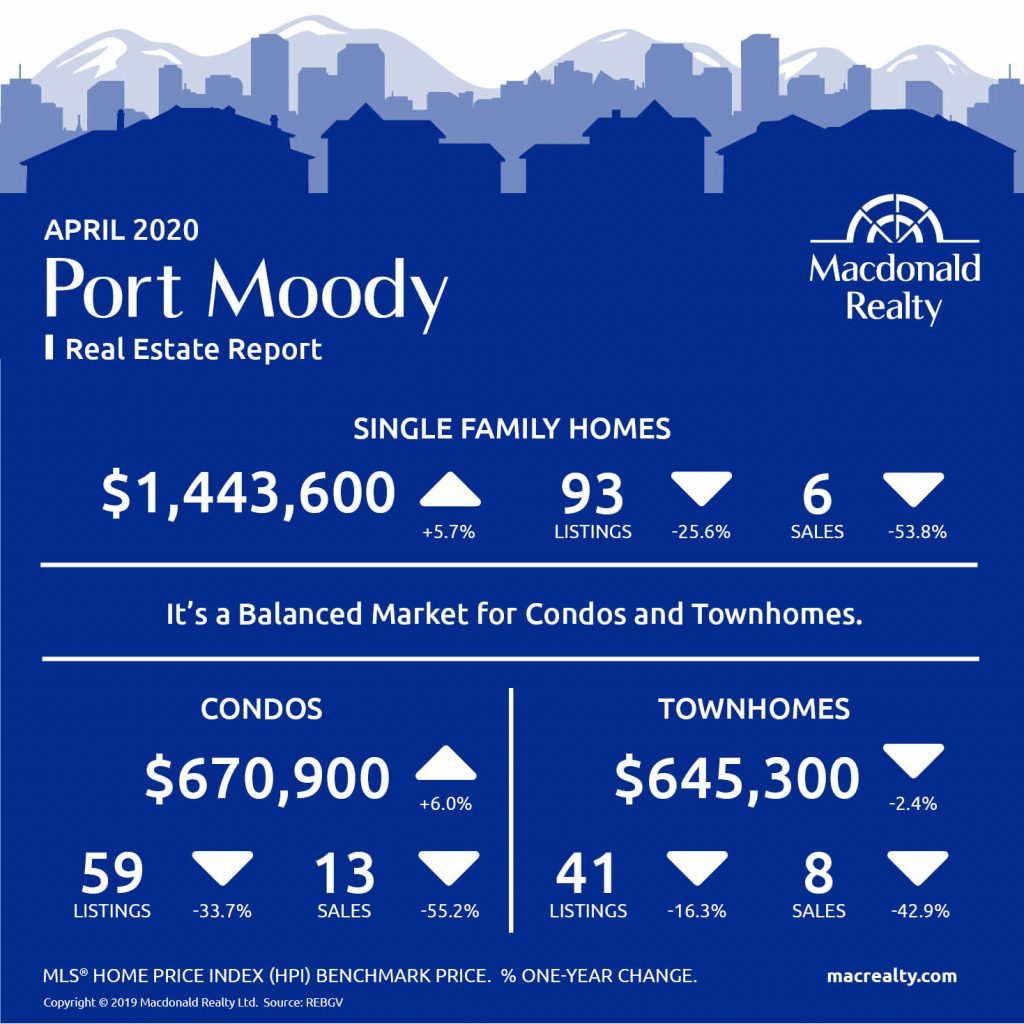
Richmond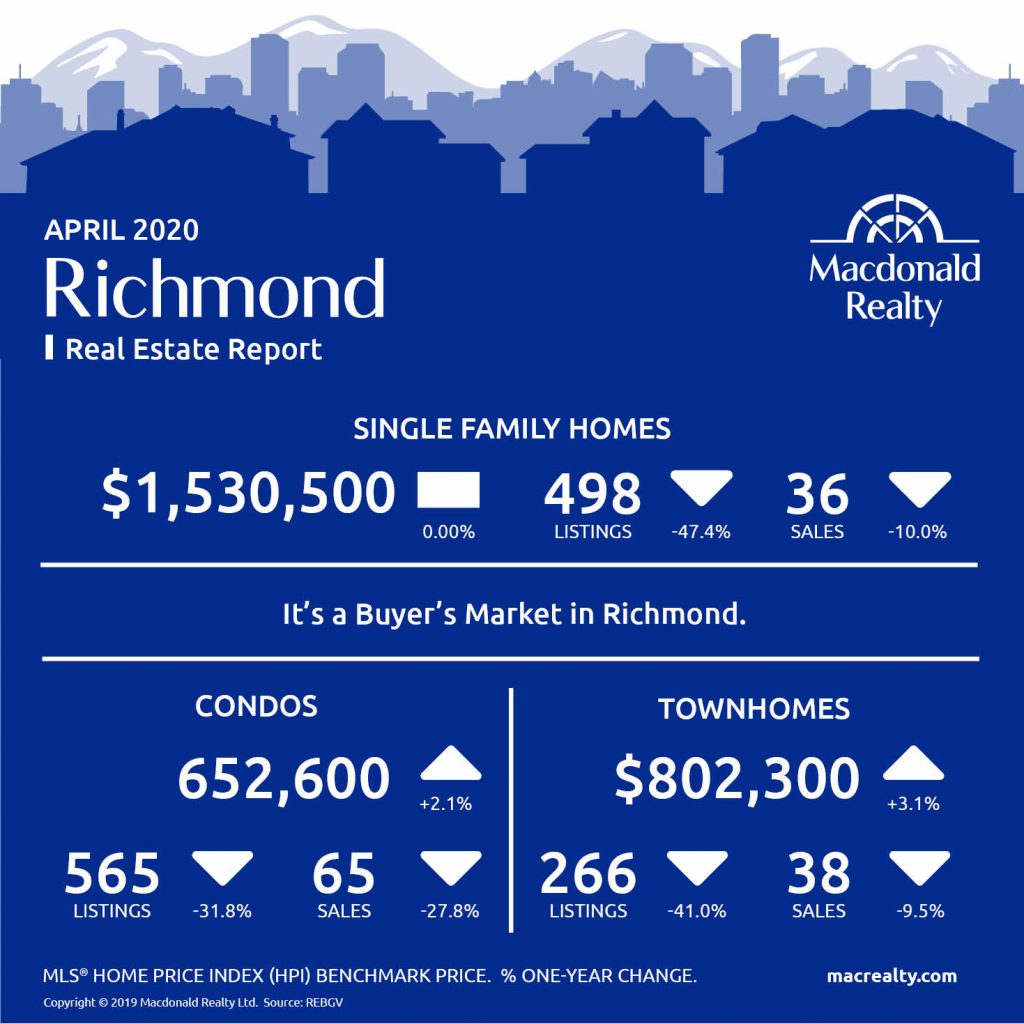
Tsawwassen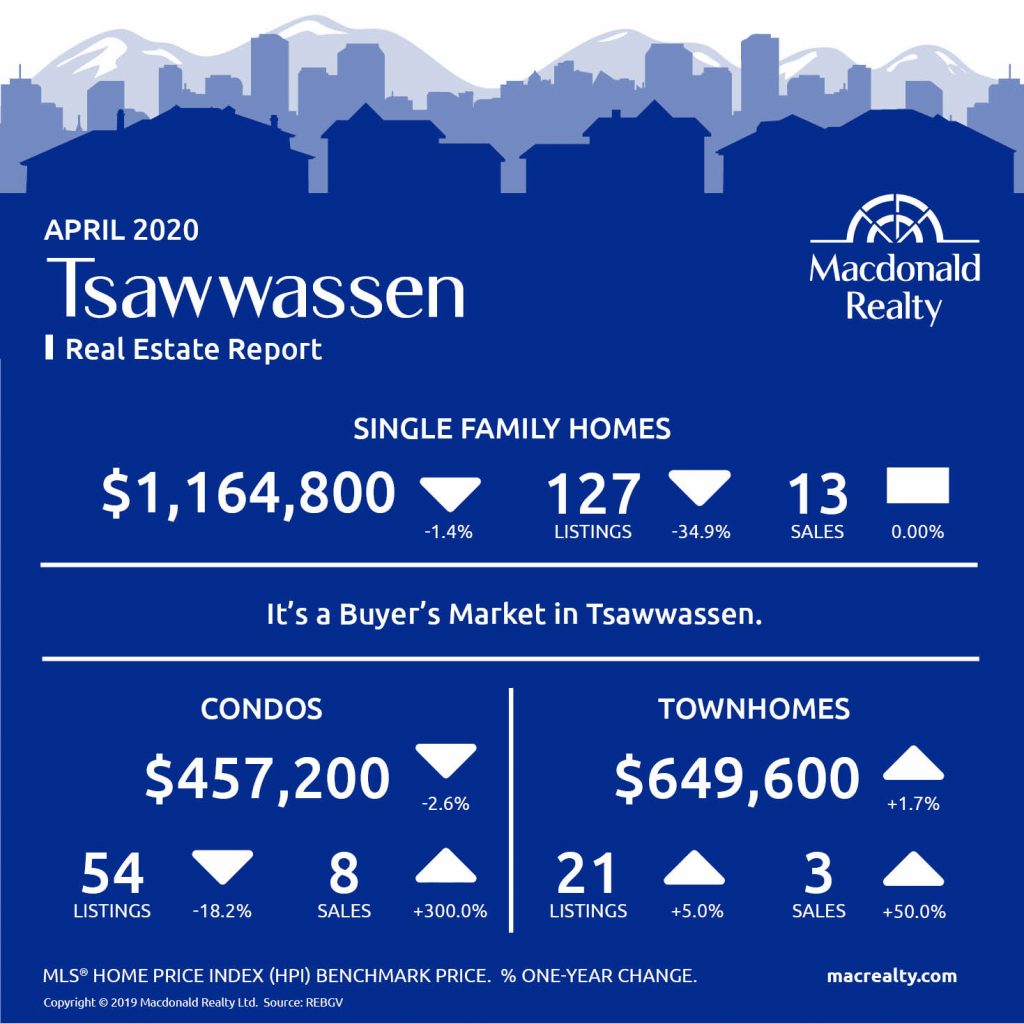
Vancouver East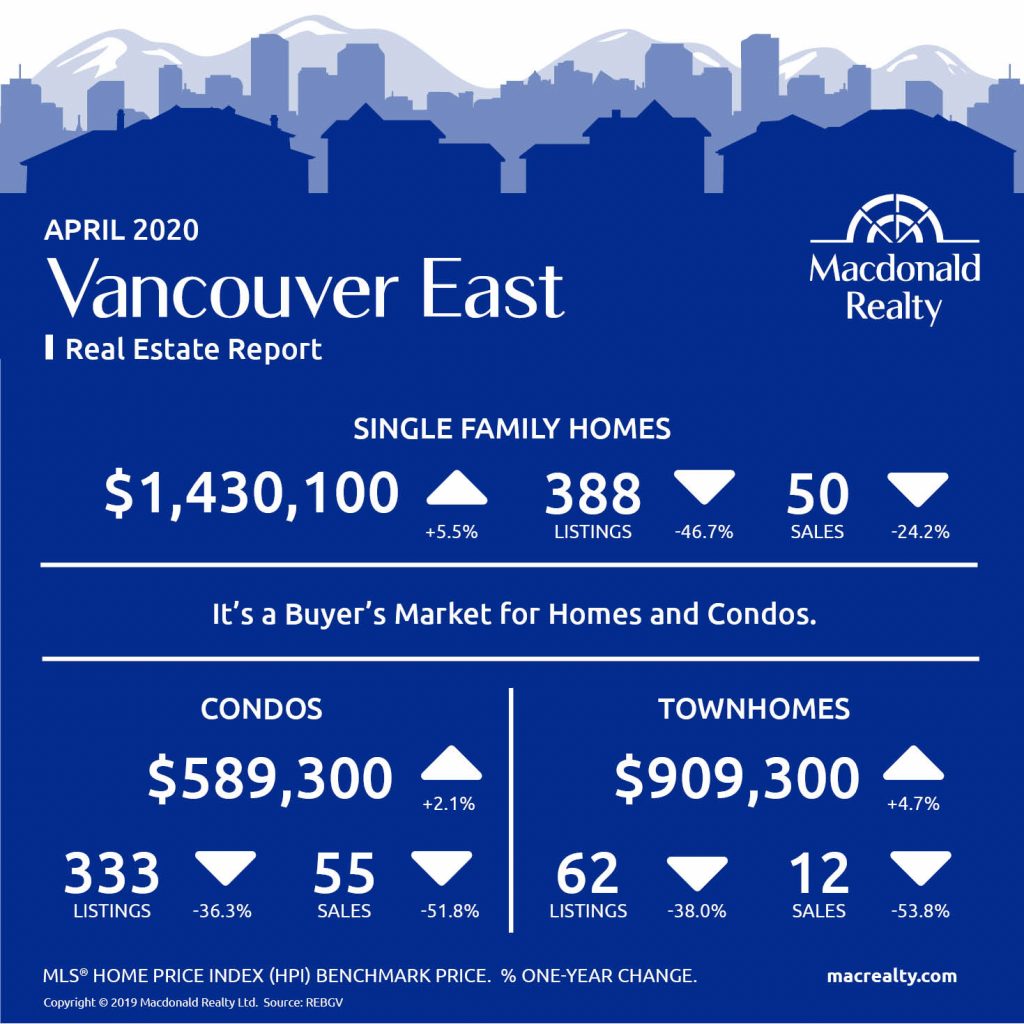
Vancouver West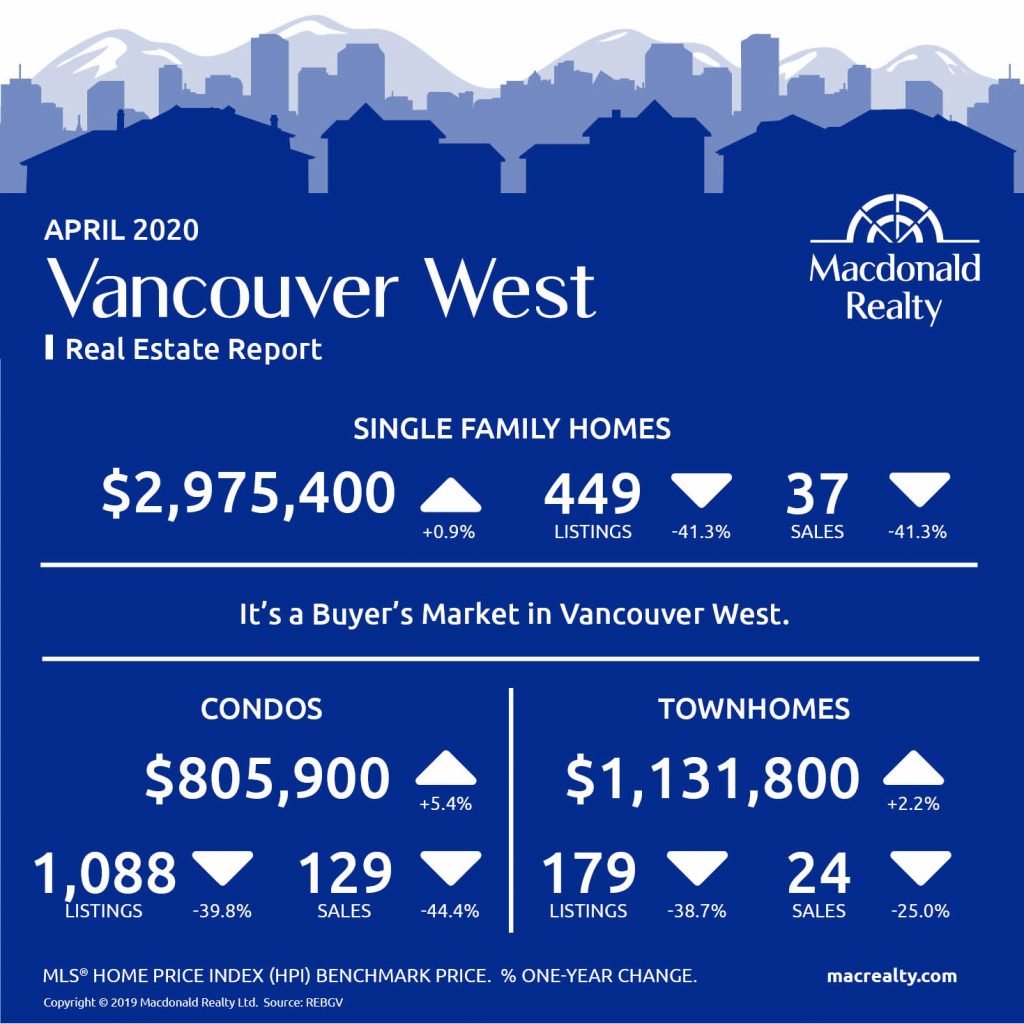
West Vancouver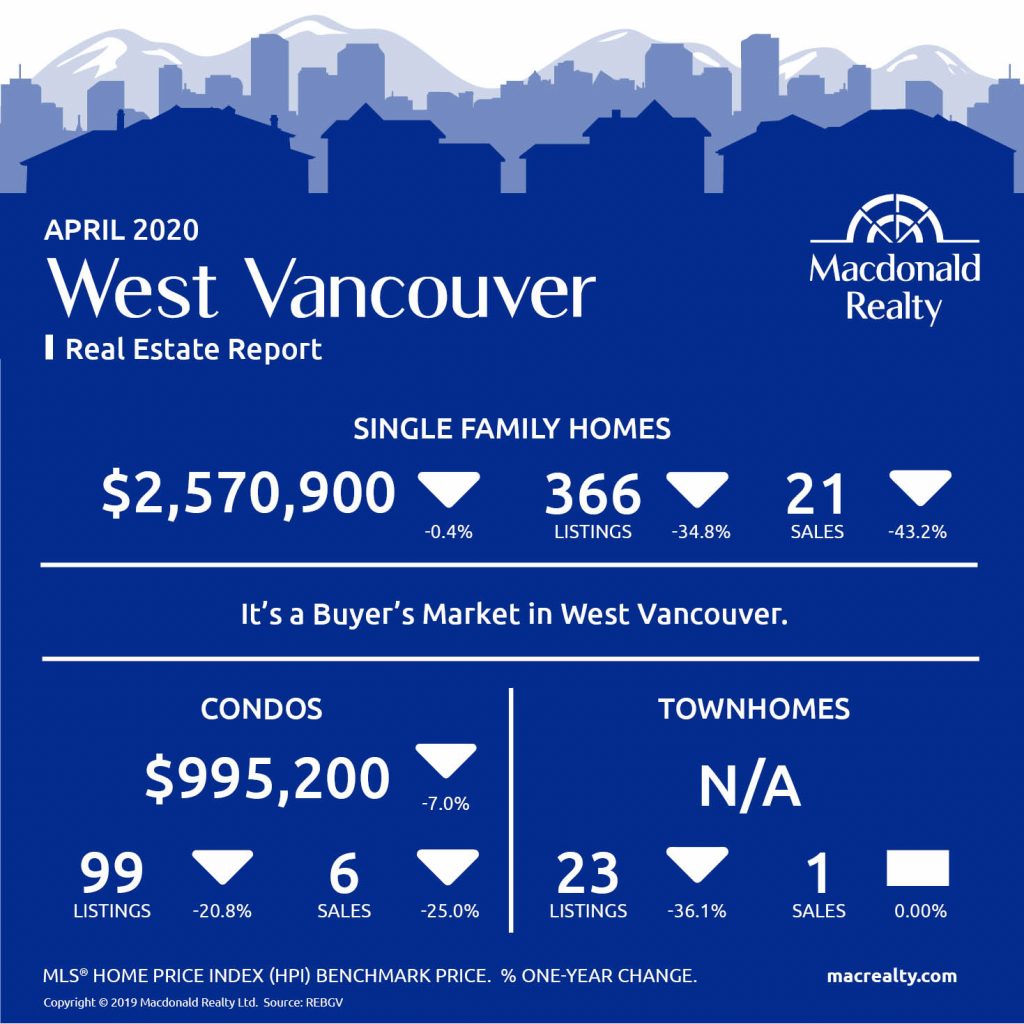
Looking for more information about the real estate market in specific neighbourhoods in the Greater Vancouver?
Macdonald Realty has offices across the Greater Vancouver. Please email [email protected] or call 1-877-278-3888 to be matched with a REALTOR® working in your area.
MLS® Home Price Index (HPI) Benchmark Price
Average and median home prices are often misinterpreted, are affected by change in the mix of homes sold, and can swing dramatically from month to month (based on the types and prices of properties that sold in a given month). The MLS® HPI overcomes these shortcomings and uses the concept of a benchmark home, a notional home with common attributes of typical homes in a defined area. Visit www.housepriceindex.ca for more information.
This blog post is based on market data provided by the Real Estate Board of Greater Vancouver (REBGV) www.rebgv.org
by Macrealty Marketing Team | May 6, 2020 | Market Updates
Here are the latest real estate market statistics from Macdonald Realty on Okanagan listings and sales in April 2020.
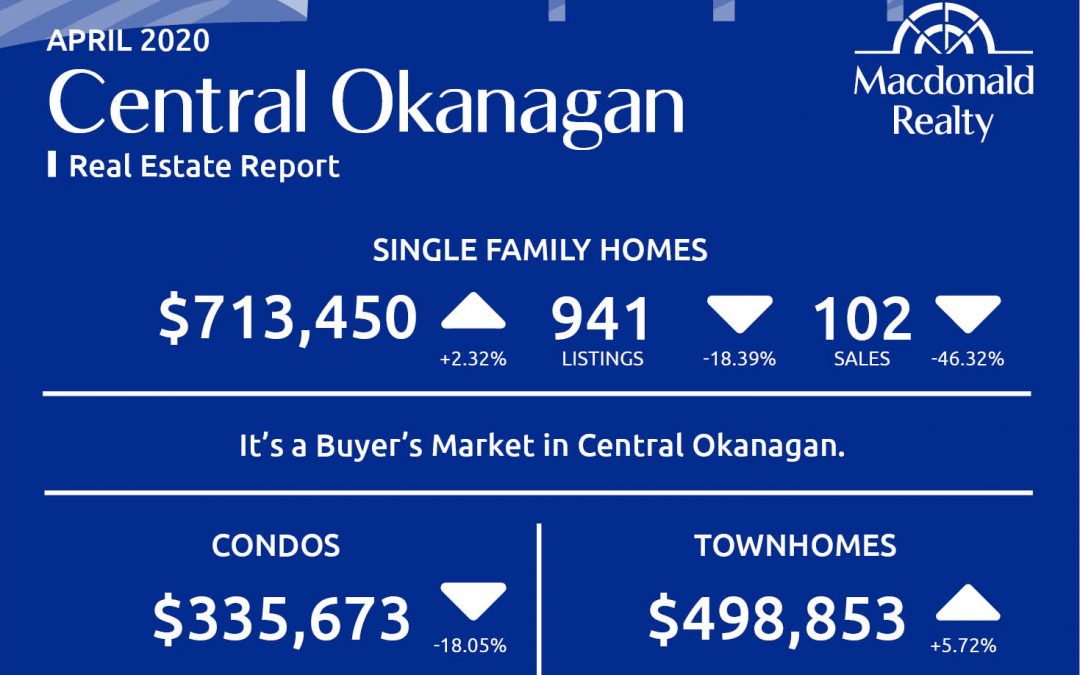
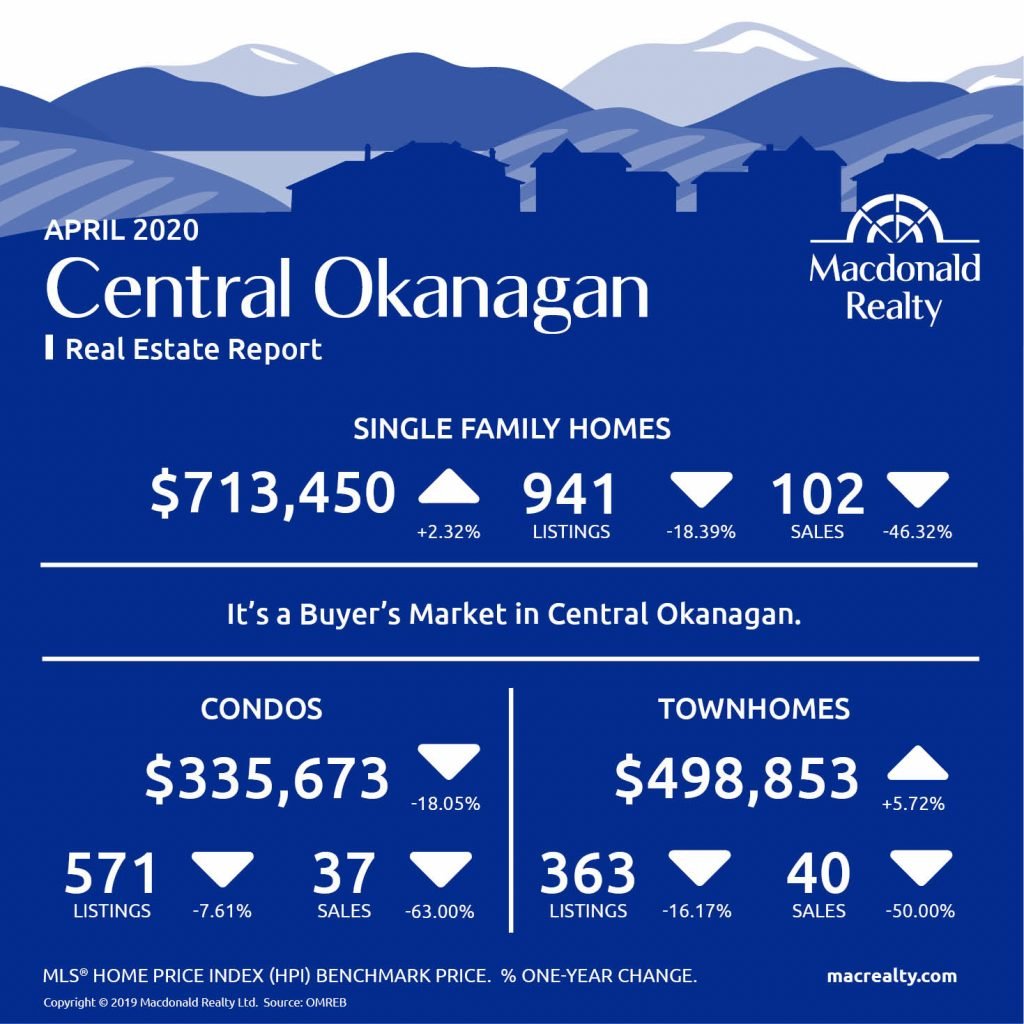
Central Okanagan: Kelowna and Lake Country
There were 102 sales, 941 active listings, and a $713,450 average sale price for detached homes in the Central Okanagan market, including Kelowna and Lake Country.
The condo market featured 37 sales and 571 active listings at the end of the month. The average sale price was $335,673.
Townhome sales were 40, active listings were 363 and the average sale price was $498,853.
It’s a buyer’s market in Central Okanagan.
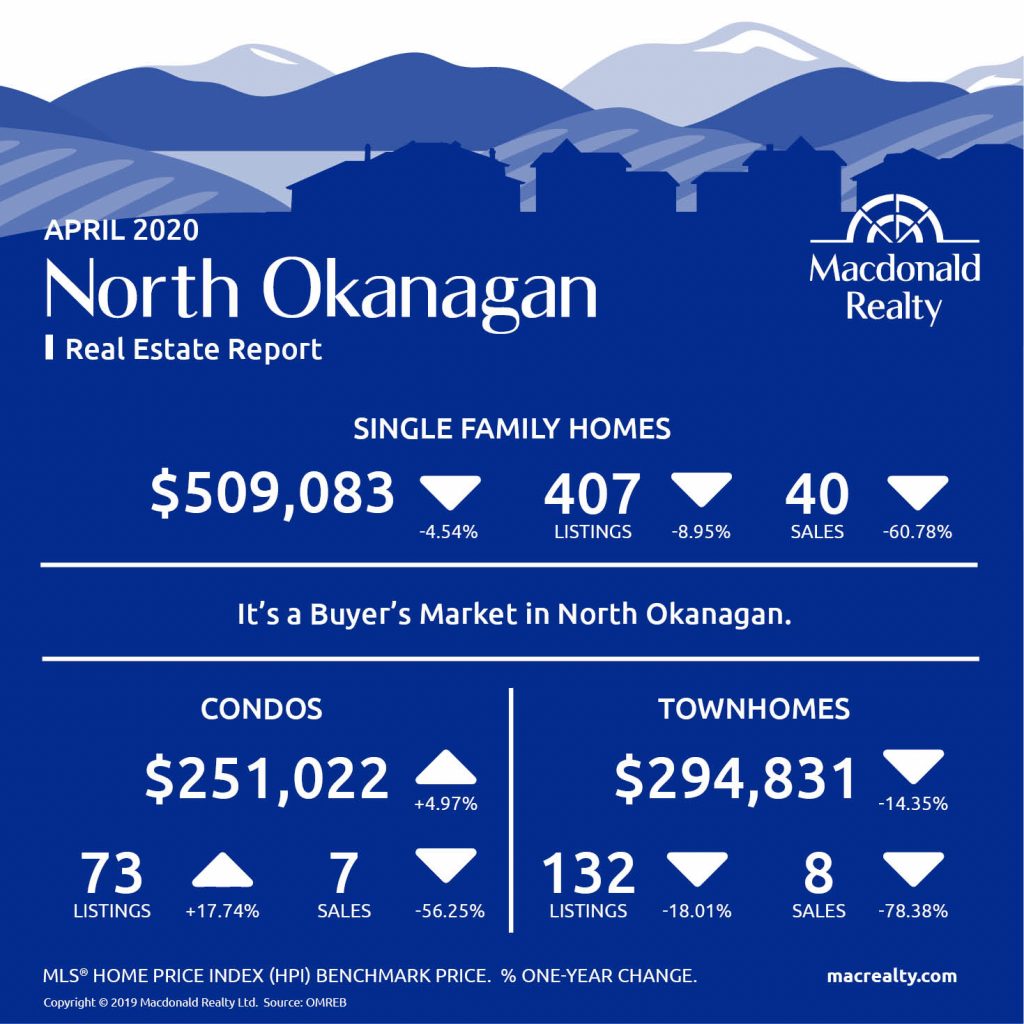
North Okanagan: Vernon and surrounding area
In North Okanagan, including Vernon and the surrounding area and the average sale price was $509,083. At the end of the month, there were 40 sales and 407 active listings.
There were 7 sales and 73 active listings for condos. The average sale price was $251,022.
In comparison, townhomes featured 8 sales, 132 active listings and a $294,831 average sale price.
It’s a Buyer’s market in North Okanagan.
Looking for more information about the real estate market in specific neighbourhoods in Okanagan?
Macdonald Realty has offices in Kelowna and across BC. Please email [email protected] or call 1-877-278-3888 to be matched with a REALTOR® working in your area.
This blog post is based on market data provided by Okanagan Mainline Real Estate Board (OMREB) www.omreb.com.

