by Macrealty Marketing Team | Dec 5, 2023 | Market Updates
November 2023 – Lower Mainland Monthly Update
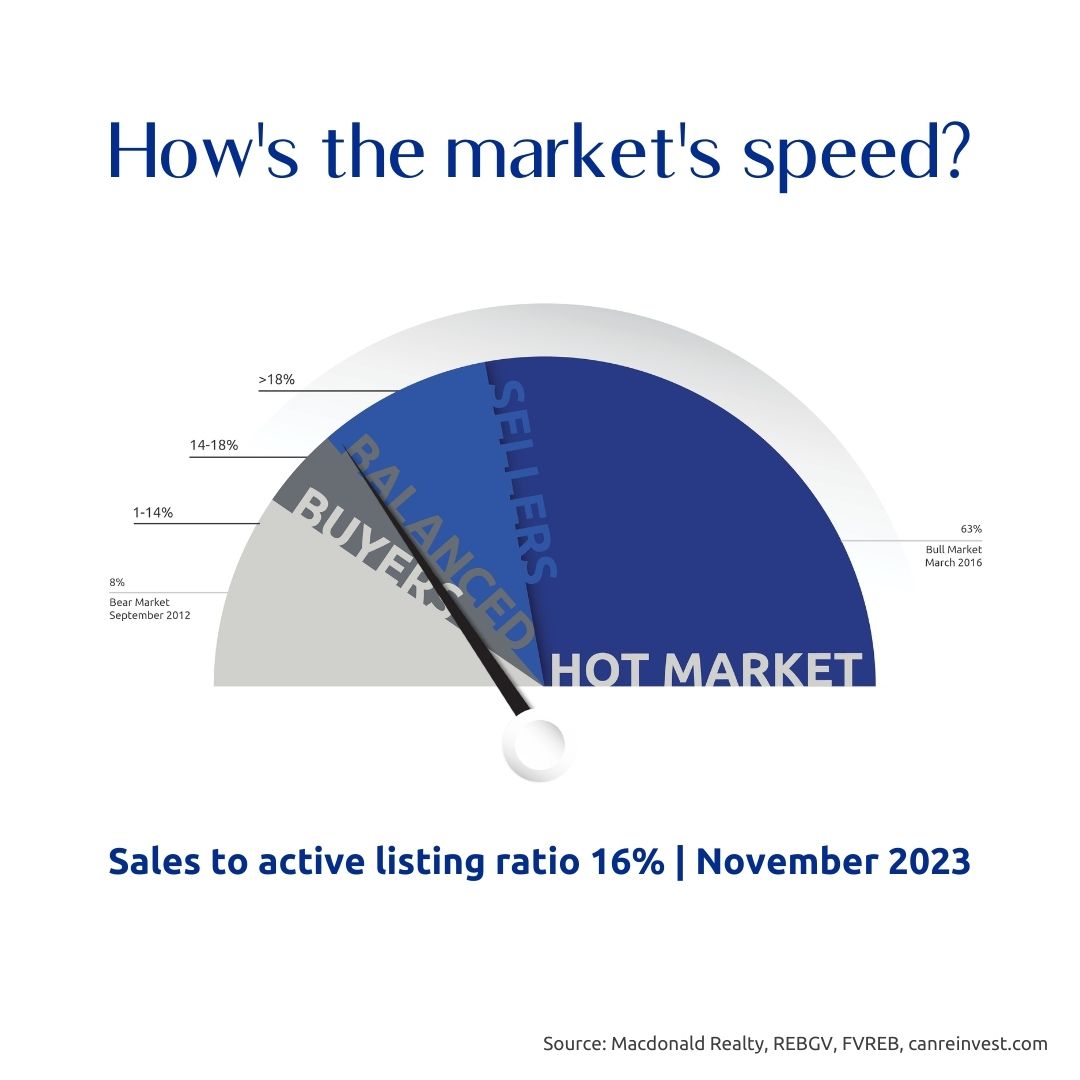
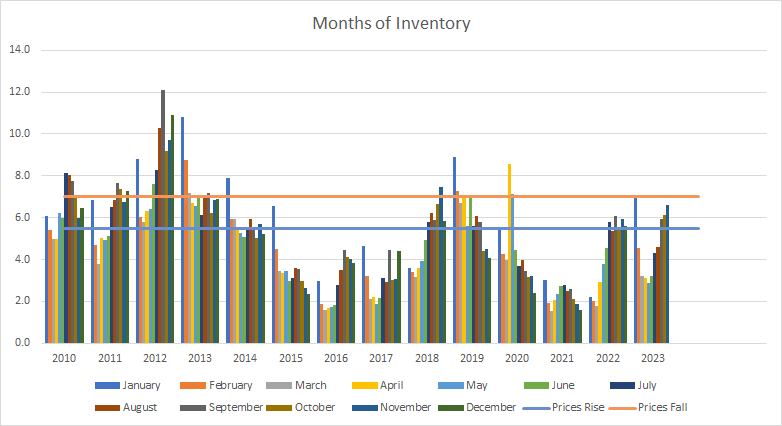
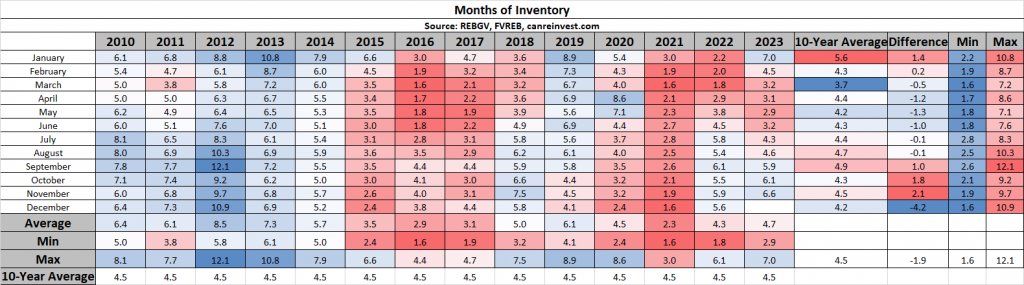
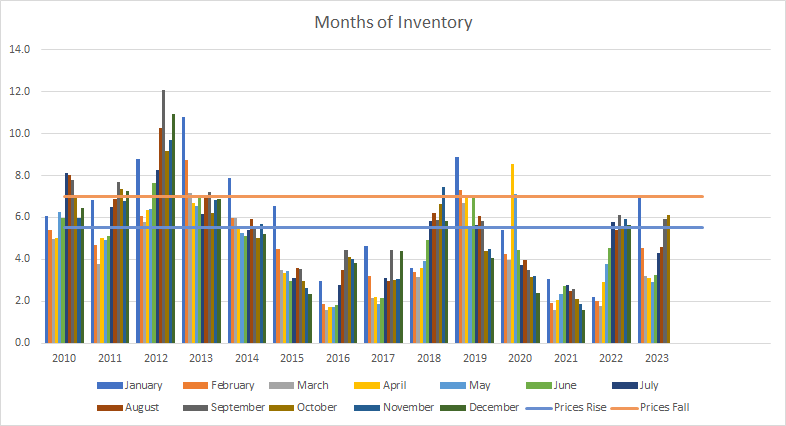
At 6.6 Months of Inventory, Prices have traditionally softened.
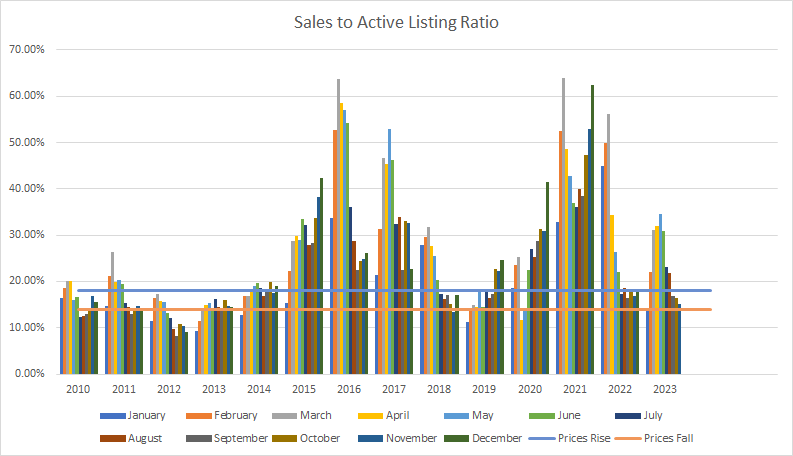
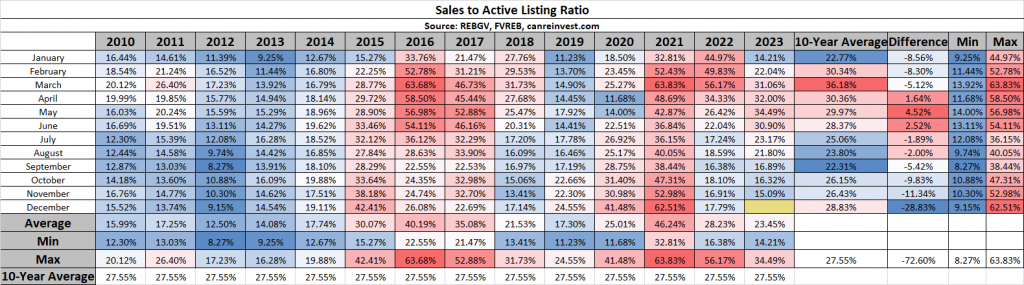
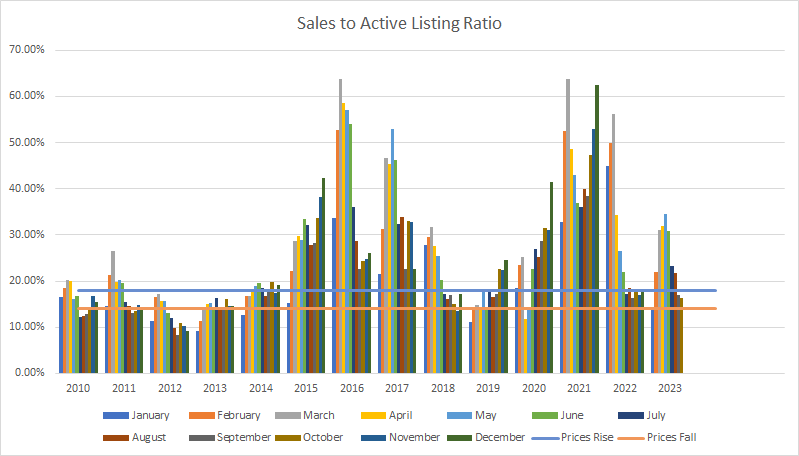
The most reliable indicator of market prices is the Sales to Active Listings Ratio (SAL). This is the ratio between the number of sales in a given month and the number of active listings at month-end.
In hotter markets in BC, a long-term analysis has shown that prices will usually act in the following ways:
- 7+ Months of Inventory (Under 14% SAL): Prices will likely DECLINE
- 5 – 7 Months of Inventory (14% – 18% SAL): Prices will likely be STABLE
- Less than 5.5 Months of Inventory (Over 18% SAL): Prices will likely RISE
Visit this link to learn more about house prices and inventory.
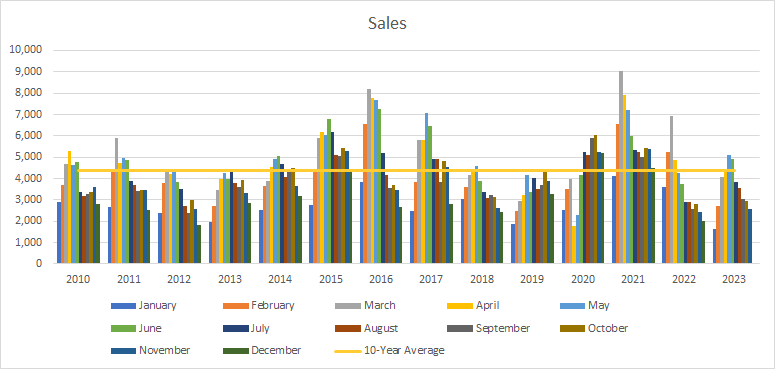
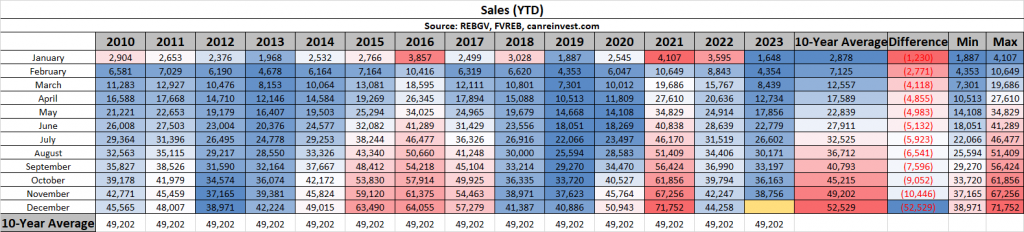
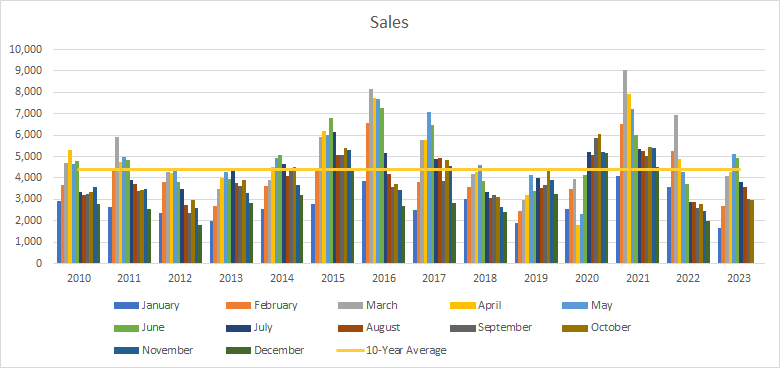
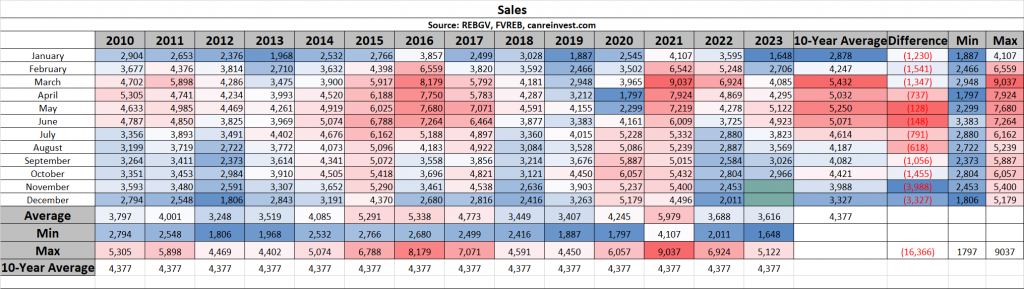
Sales
Sales (2,593) were about the same as a year ago (2,453), and were 25% below the 10-year average (3,988).
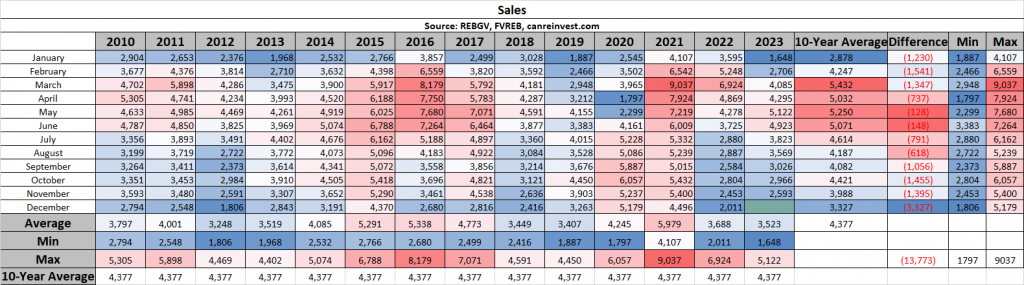
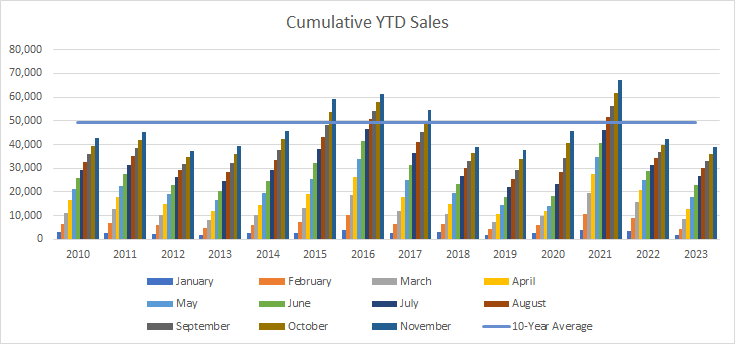
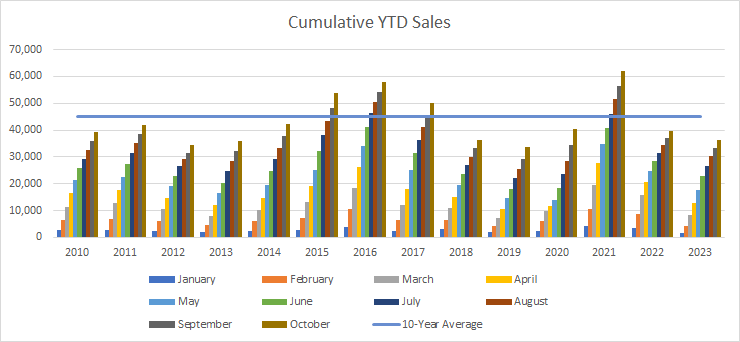
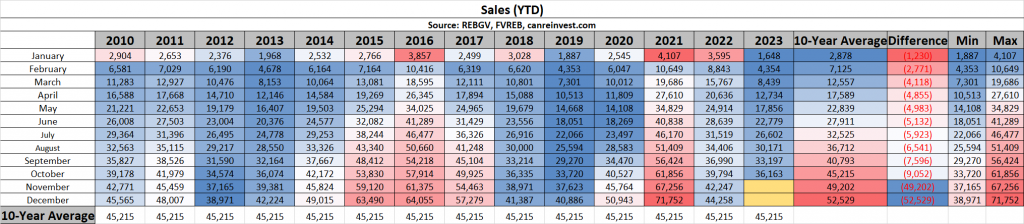
Cumulative Year-to-date Sales
2023 will likely end up as one of the slowest years in recent memory as sales (38,756) remain far below the 10-year average (49,202).
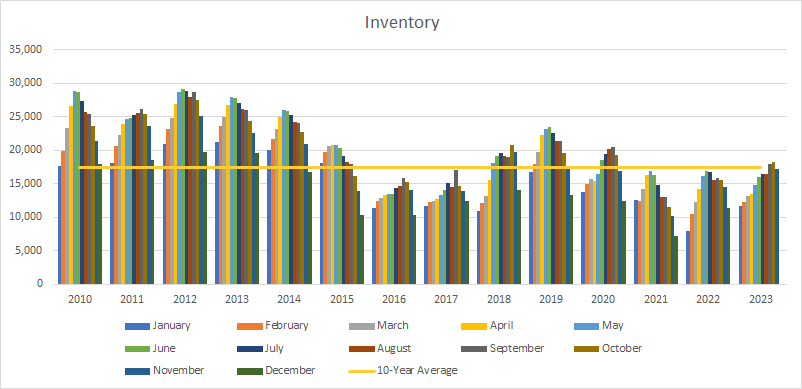
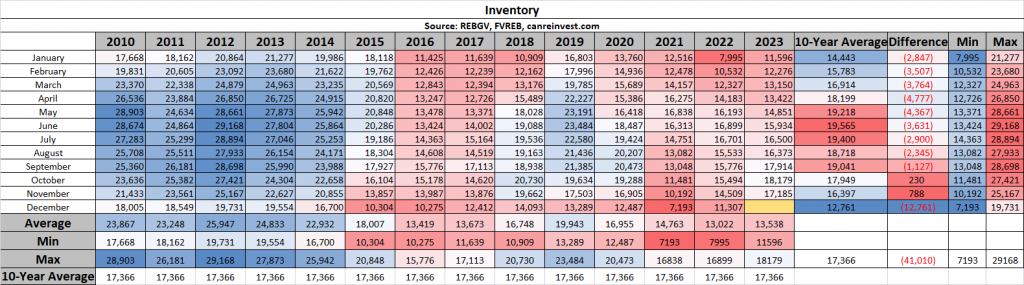
Inventory
Inventory (17,185 active listings) fell slightly from the previous month, but remain above the 10-year average for the first time since Nov 2020 (16,397 average).e).
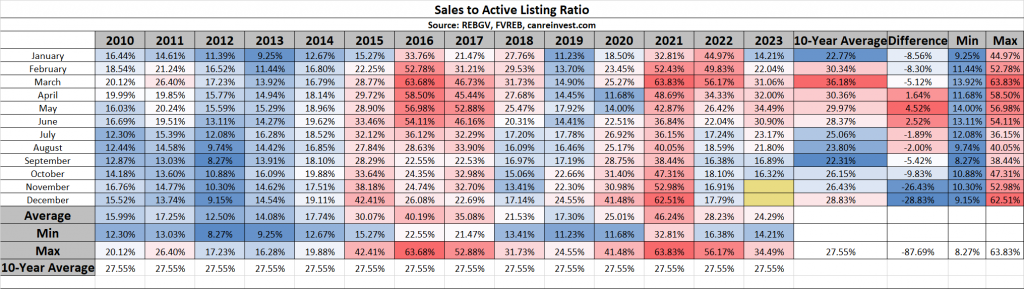
Sales to Active Listings
Low sales and rising inventory have the Sales to Active Listing Ratio at 15%, indicating softening prices.
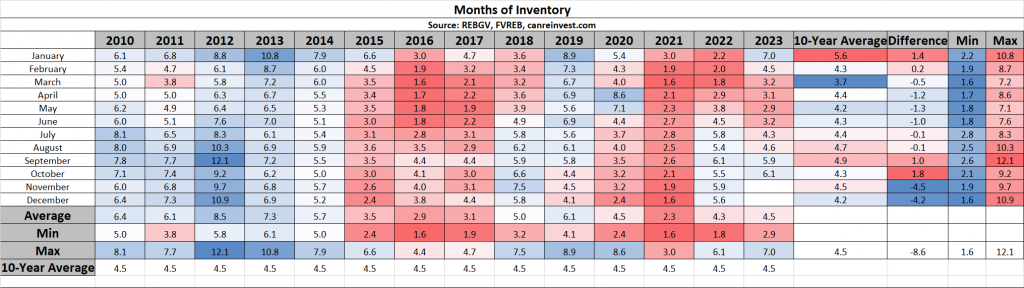
Months of Inventory
Similarly, Months of Inventory rose to 6.6 MOI, indicating a slow market and softening prices.
Want to learn more about these stats or discuss your move to Macdonald Realty?
Check out careersinbcrealestate.com to connect today!
by Macrealty Marketing Team | Dec 4, 2023 | Market Updates
Here are the latest real estate market statistics from Macdonald Realty on the Greater Vancouver listings and sales in November 2023. Find all the infographics by visiting the Facebook Album.
With one month left in 2023, a steady increase in housing inventory is offering home buyers across Metro Vancouver1 among the largest selection to choose from since 2021.
The Real Estate Board of Greater Vancouver (REBGV) reports that residential sales2 in the region totalled 1,702 in November 2023, a 4.7 per cent increase from the 1,625 sales recorded in November 2022. This was 33 per cent below the 10-year seasonal average (2,538).
“We’ve been watching the number of active listings in our market increase over the past few months, which is giving buyers more to choose from than they’ve been used to seeing over the past few years,” Andrew Lis, REBGV’s director of economics and data analytics said. “When paired with the seasonal slowdown in sales we typically see this time of year, this increase in supply is creating balanced conditions across Metro Vancouver’s housing market.”
There were 3,369 detached, attached and apartment properties newly listed for sale on the Multiple Listing Service® (MLS®) in Metro Vancouver in November 2023. This represents a 9.8 per cent increase compared to the 3,069 properties listed in November 2022. This was 2.8 per cent below the 10-year seasonal average (3,464).
The total number of properties currently listed for sale on the MLS® system in Metro Vancouver is 10,931, a 13.5 per cent increase compared to November 2022 (9,633). This is 3.7 per cent above the 10-year seasonal average (10,543).
Across all detached, attached and apartment property types, the sales-to-active listings ratio for November 2023 is 16.3 per cent. By property type, the ratio is 12.7 per cent for detached homes, 19.8 per cent for attached, and 18.2 per cent for apartments.
Analysis of the historical data suggests downward pressure on home prices occurs when the ratio dips below 12 per cent for a sustained period, while home prices often experience upward pressure when it surpasses 20 per cent over several months
“Balanced market conditions typically come with flatter price trends, and that’s what we’ve seen in the market since the summer months. These trends follow a period where prices rose over seven per cent earlier in the year,” Lis said. “You probably won’t find Cyber Monday discounts, but prices have edged lower by a few per cent since the summer. And with most economists expecting mortgage rates to fall modestly in 2024, market conditions for buyers are arguably the most favorable we’ve seen in some time in our market.”
The MLS® Home Price Index composite benchmark price for all residential properties in Metro Vancouver is currently $1,185,100. This represents a 4.9 per cent increase over November 2022 and a one per cent decrease compared to October 2023.
*Areas covered by the Real Estate Board of Greater Vancouver include Burnaby, Coquitlam, Maple Ridge, New Westminster, North Vancouver, Pitt Meadows, Port Coquitlam, Port Moody, Richmond, South Delta, Squamish, Sunshine Coast, Vancouver, West Vancouver, and Whistler. Check out the infographics of Squamish, Sunshine Coast and Whistler, HERE.
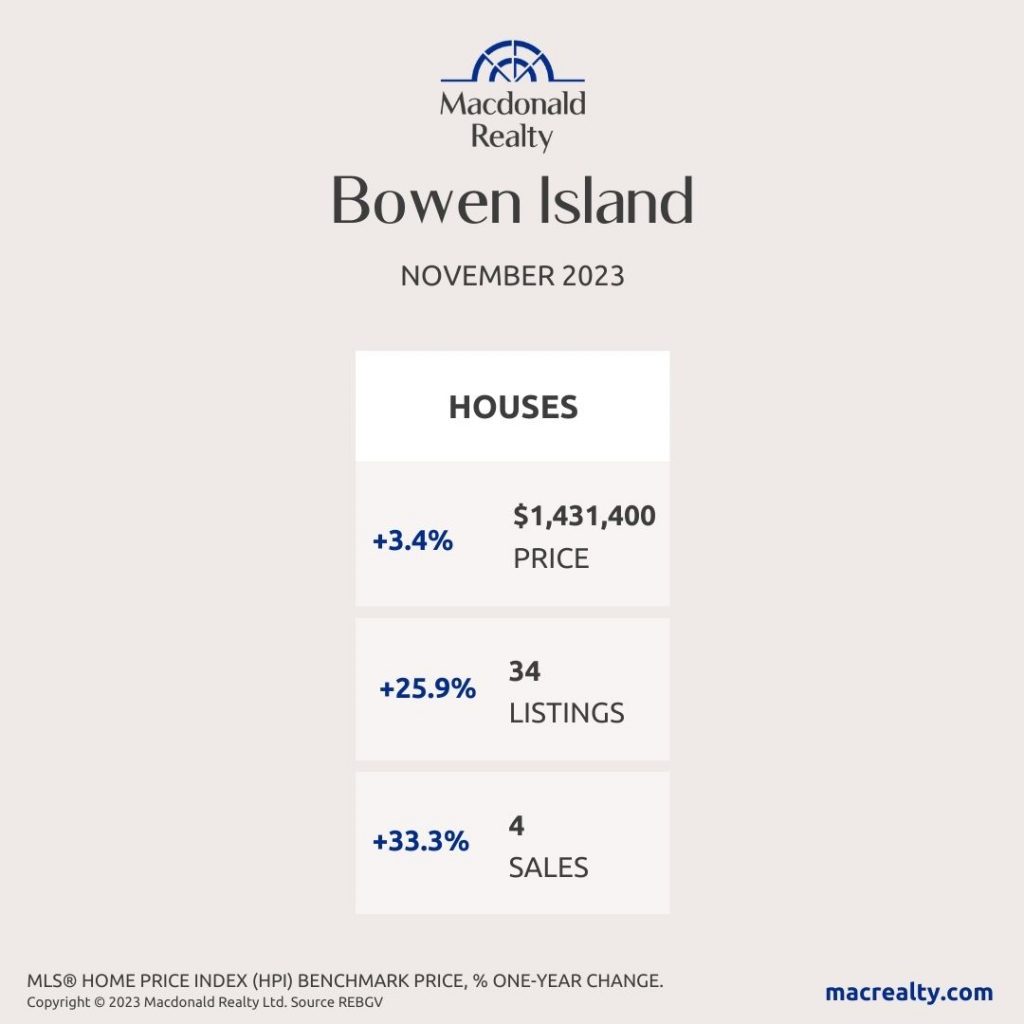
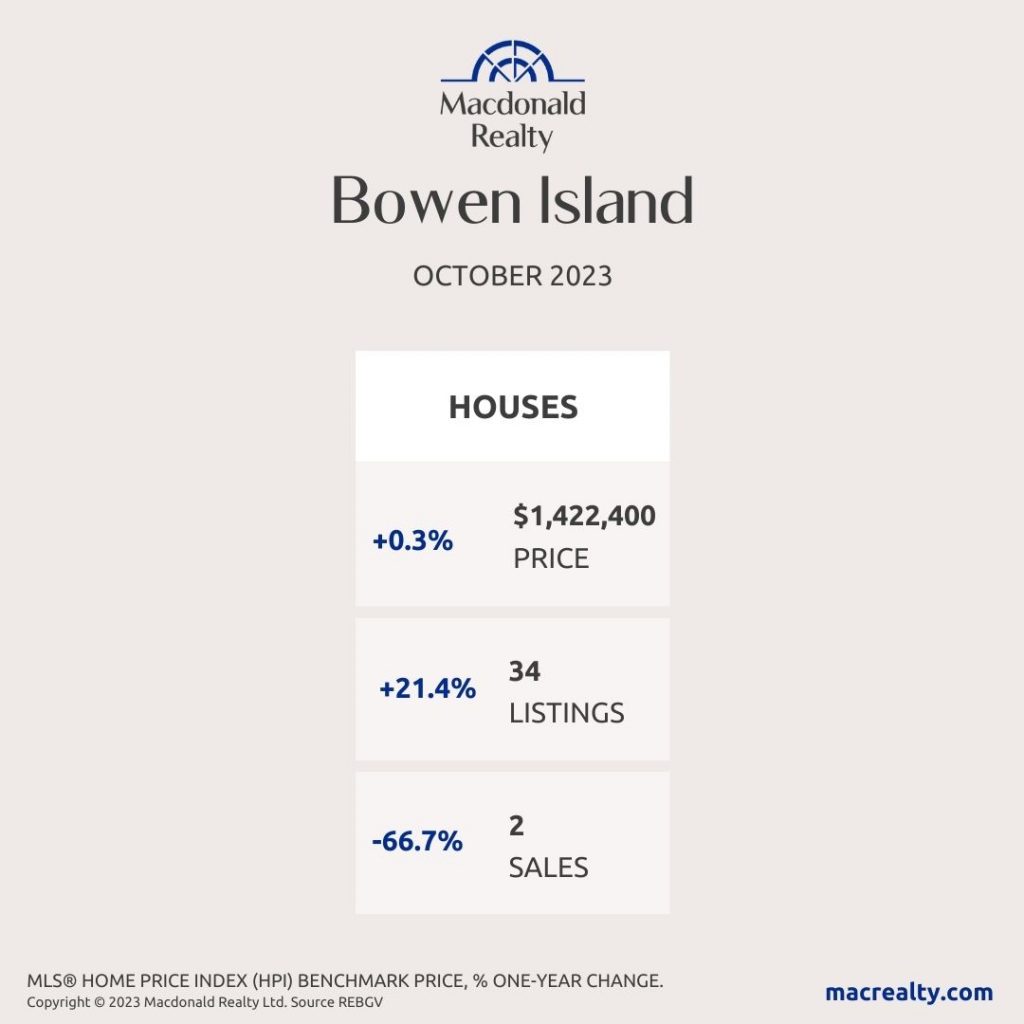
Bowen Island
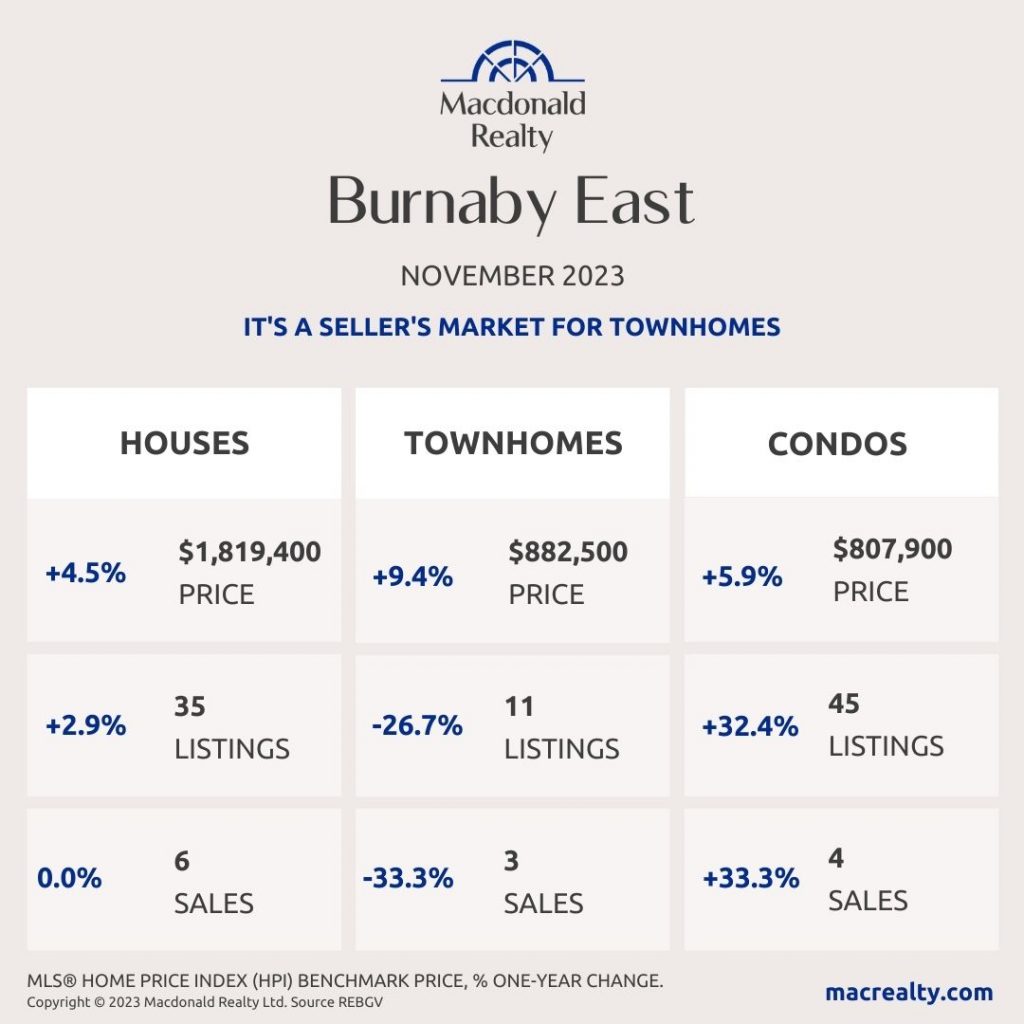
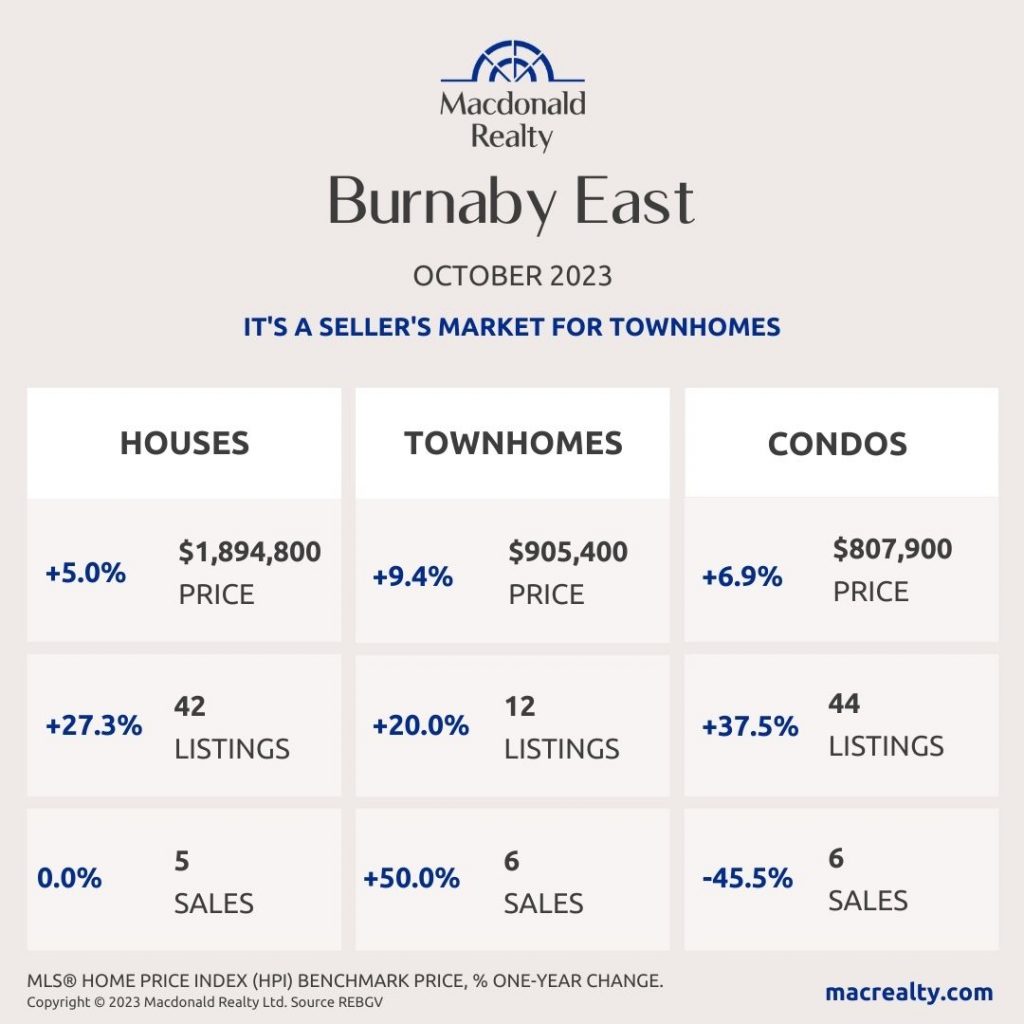
Burnaby East
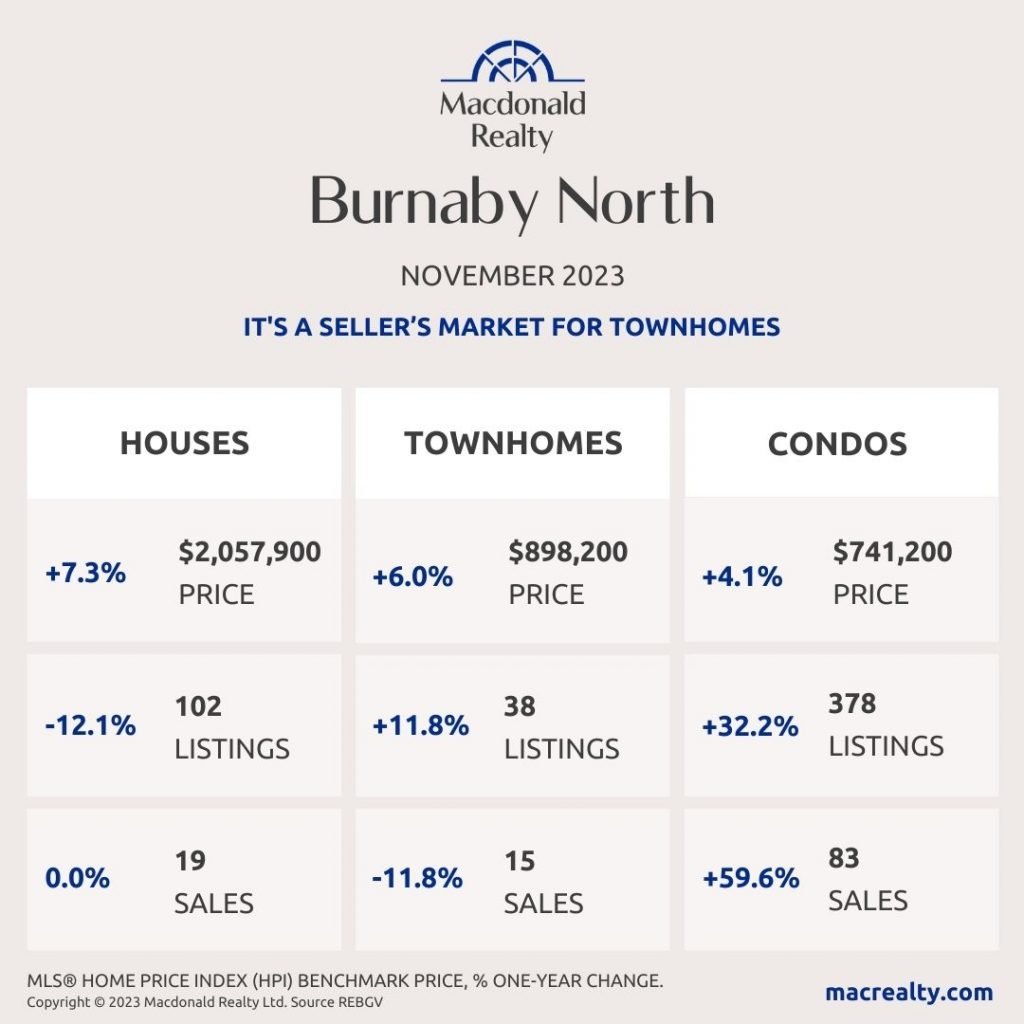
Burnaby North
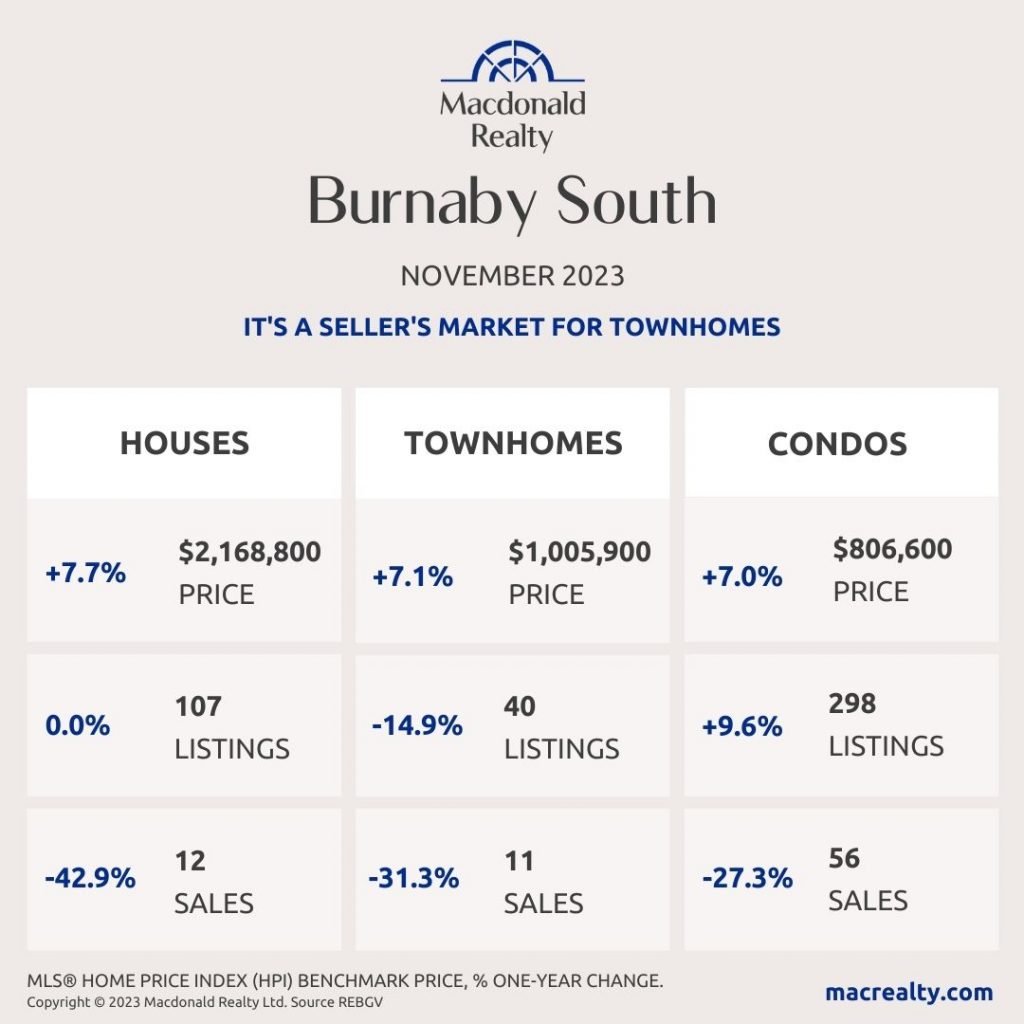
Burnaby South
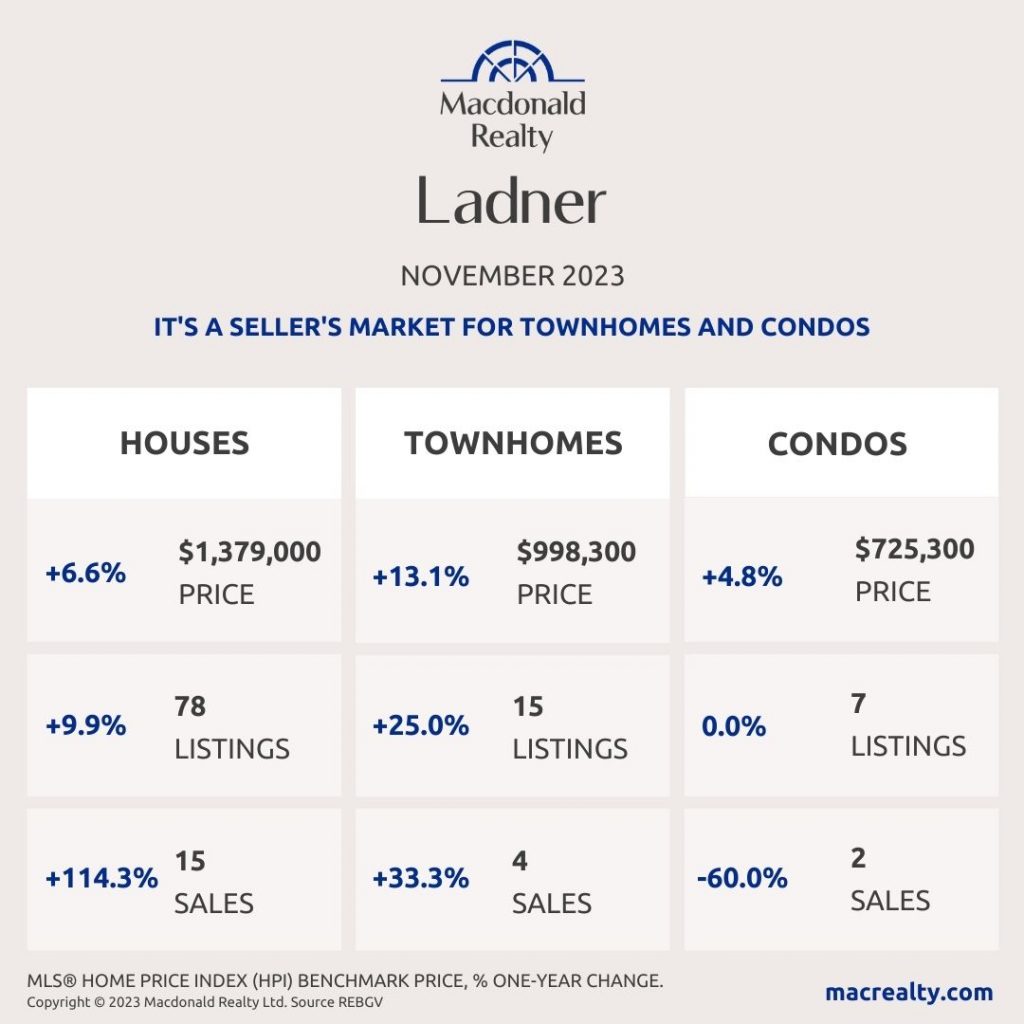
Ladner
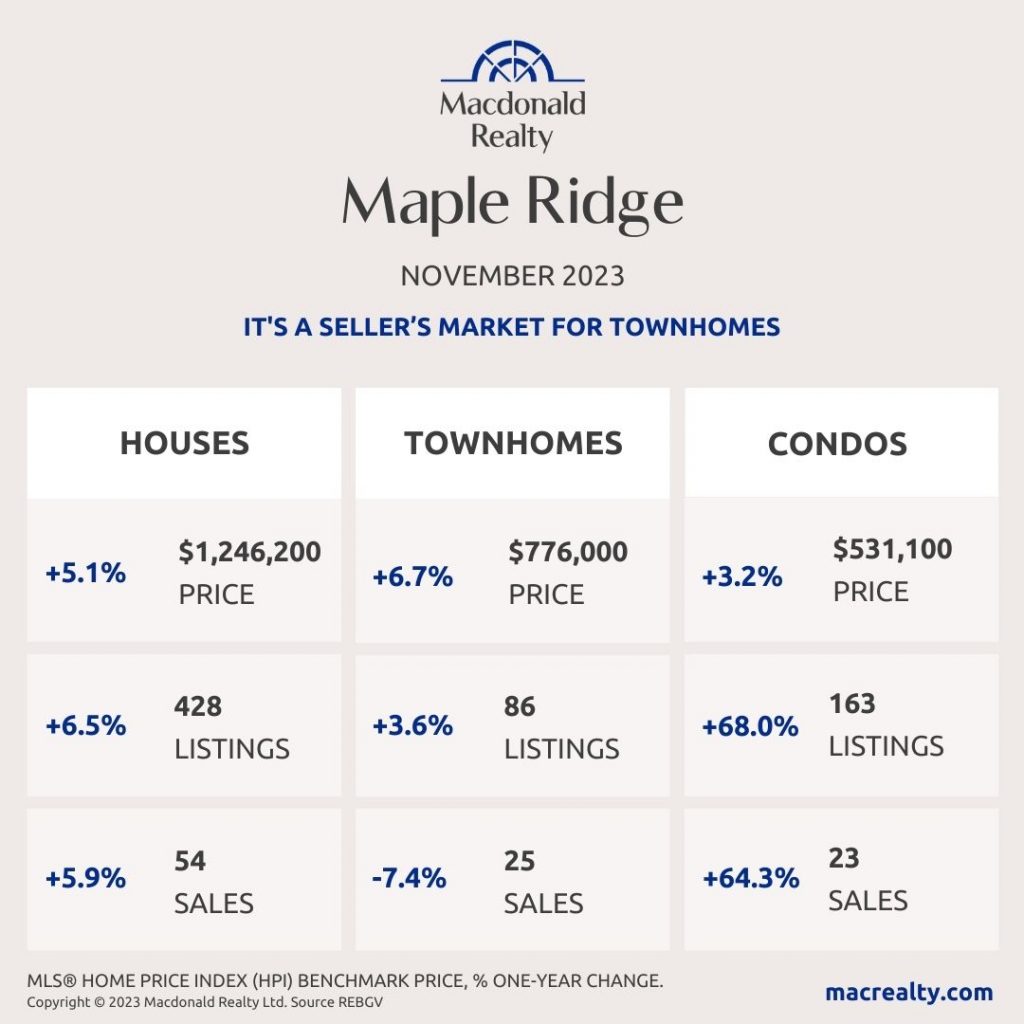
Maple Ridge
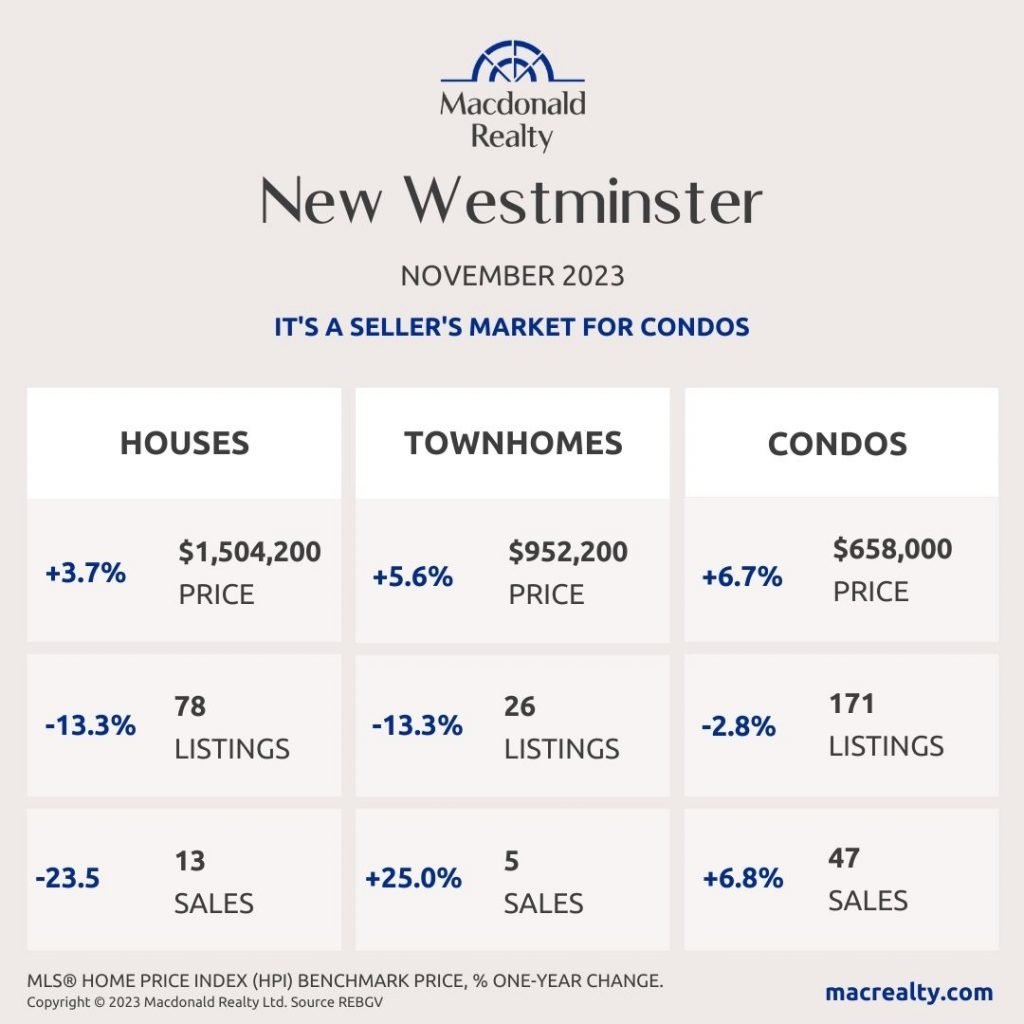
New Westminster
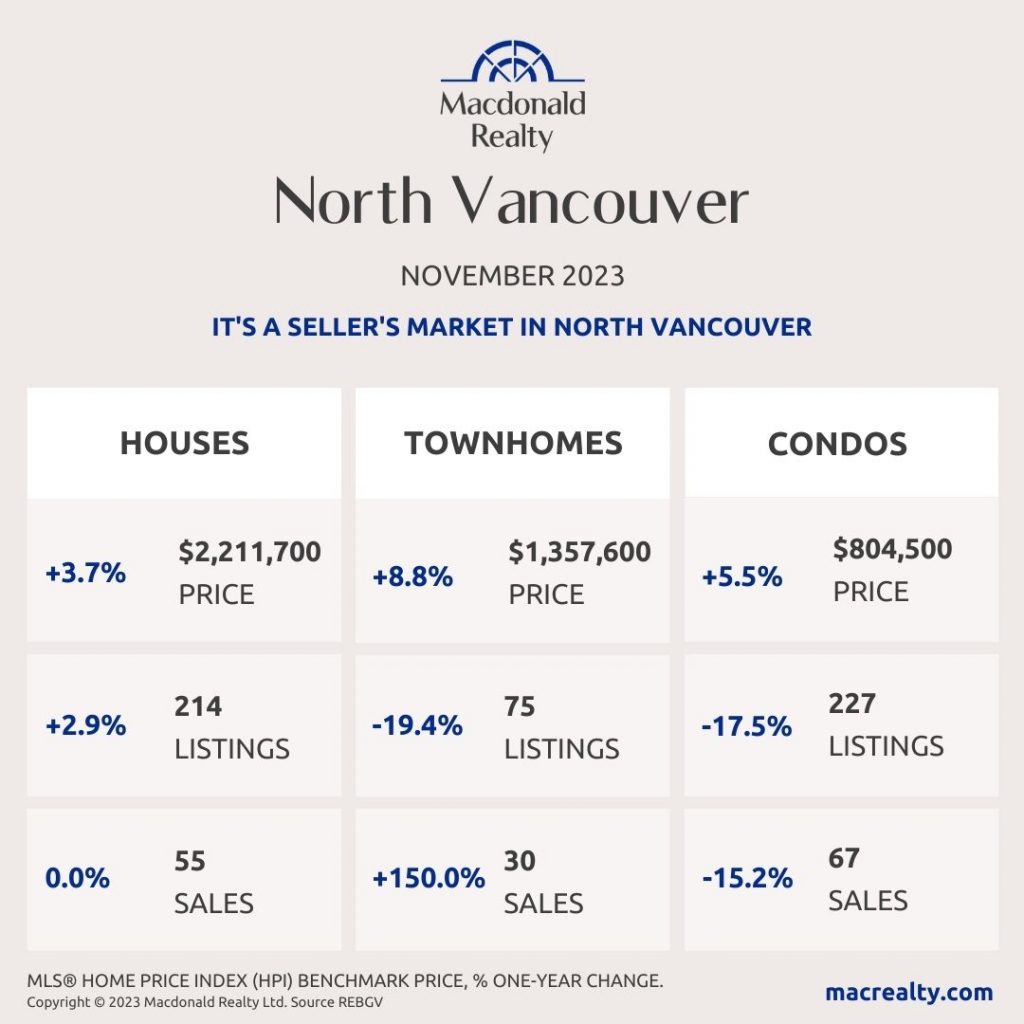
North Vancouver
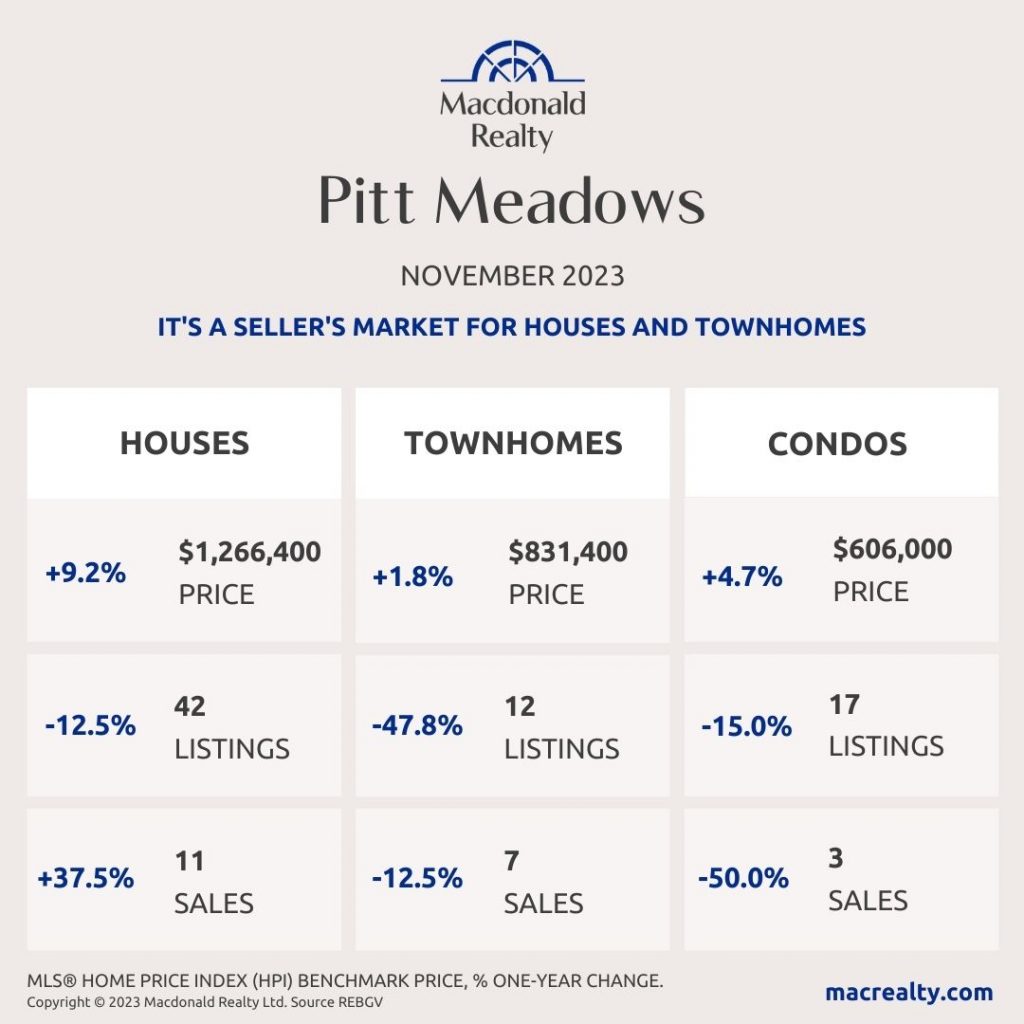
Pitt Meadows
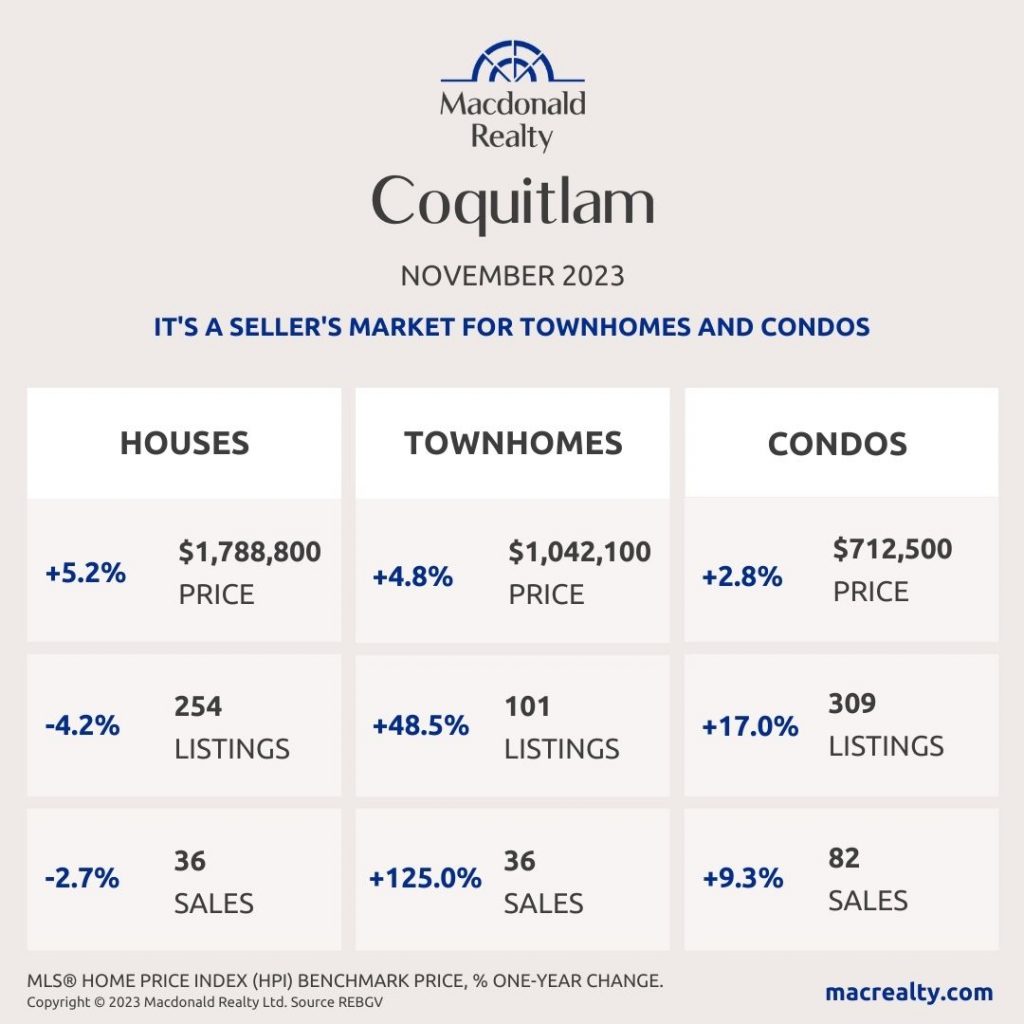
Coquitlam
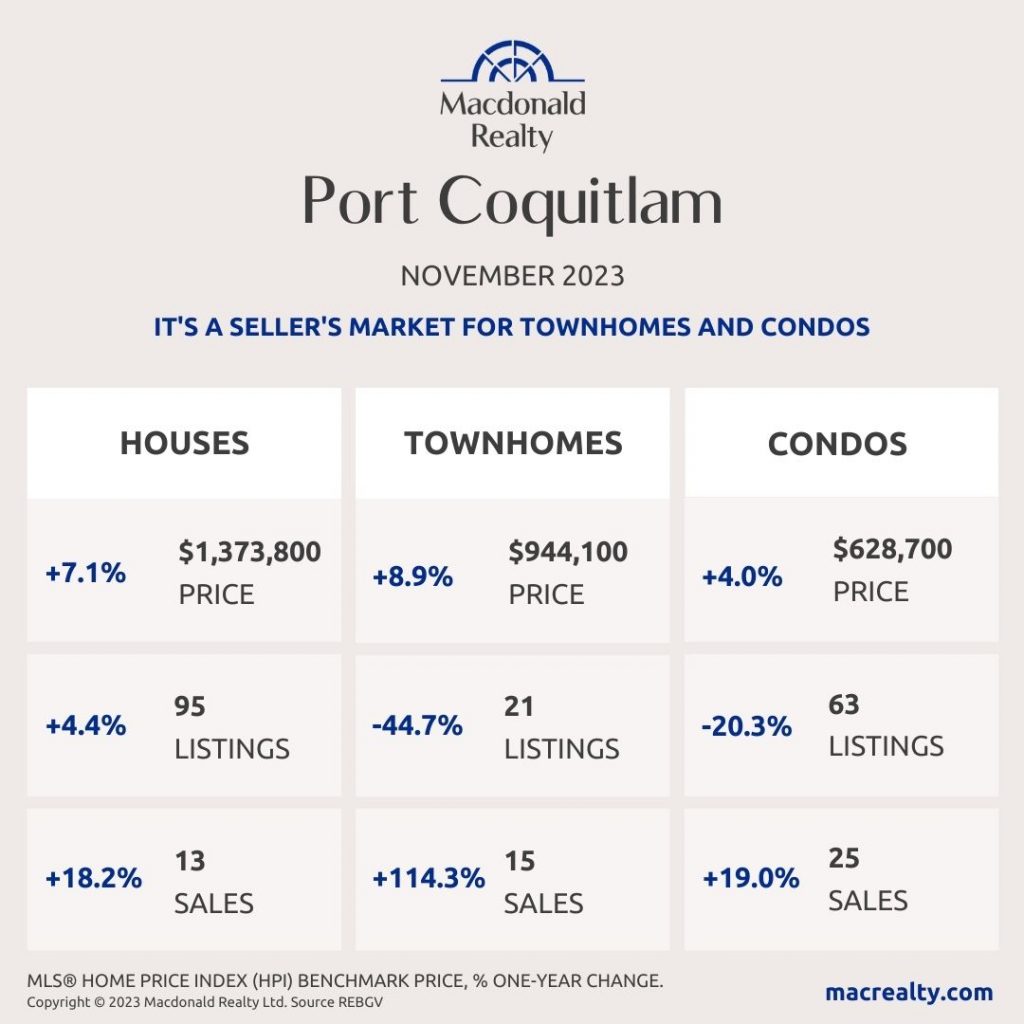
Port Coquitlam
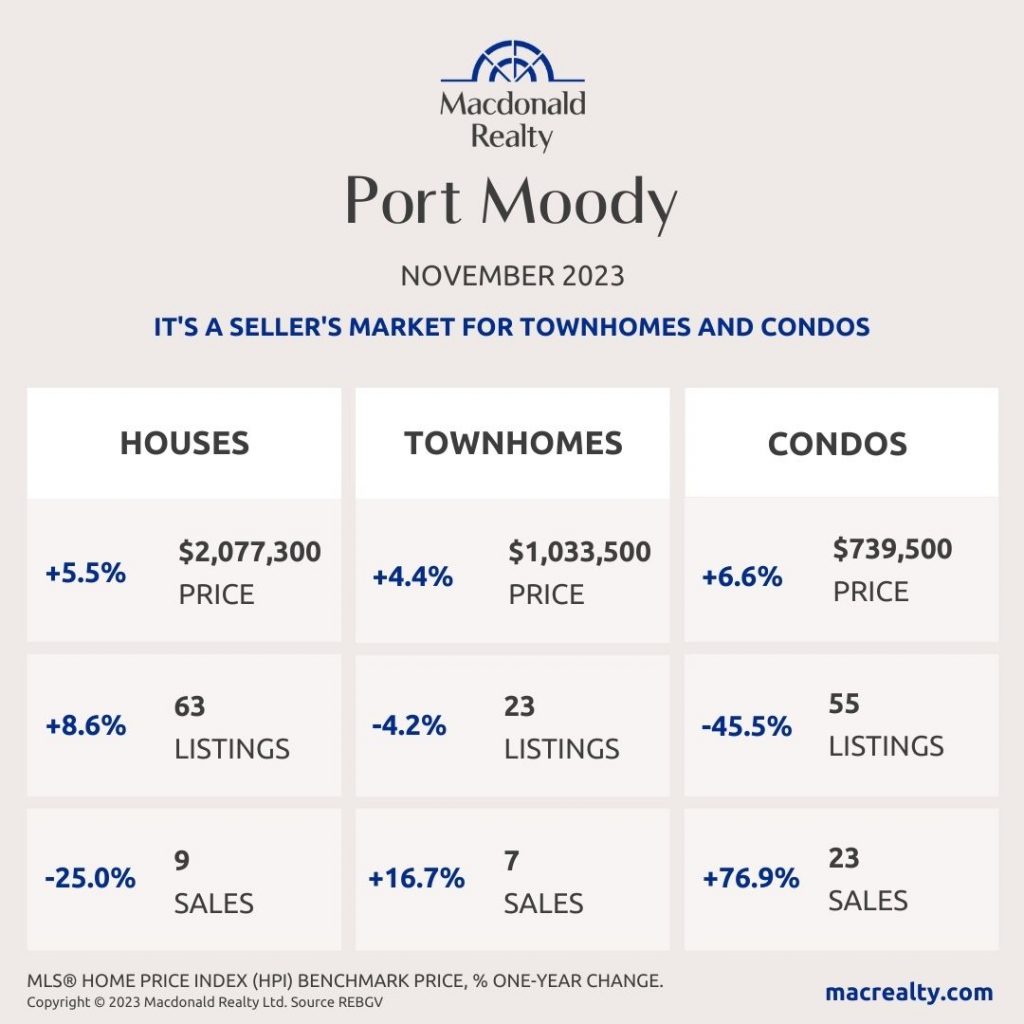
Port Moody
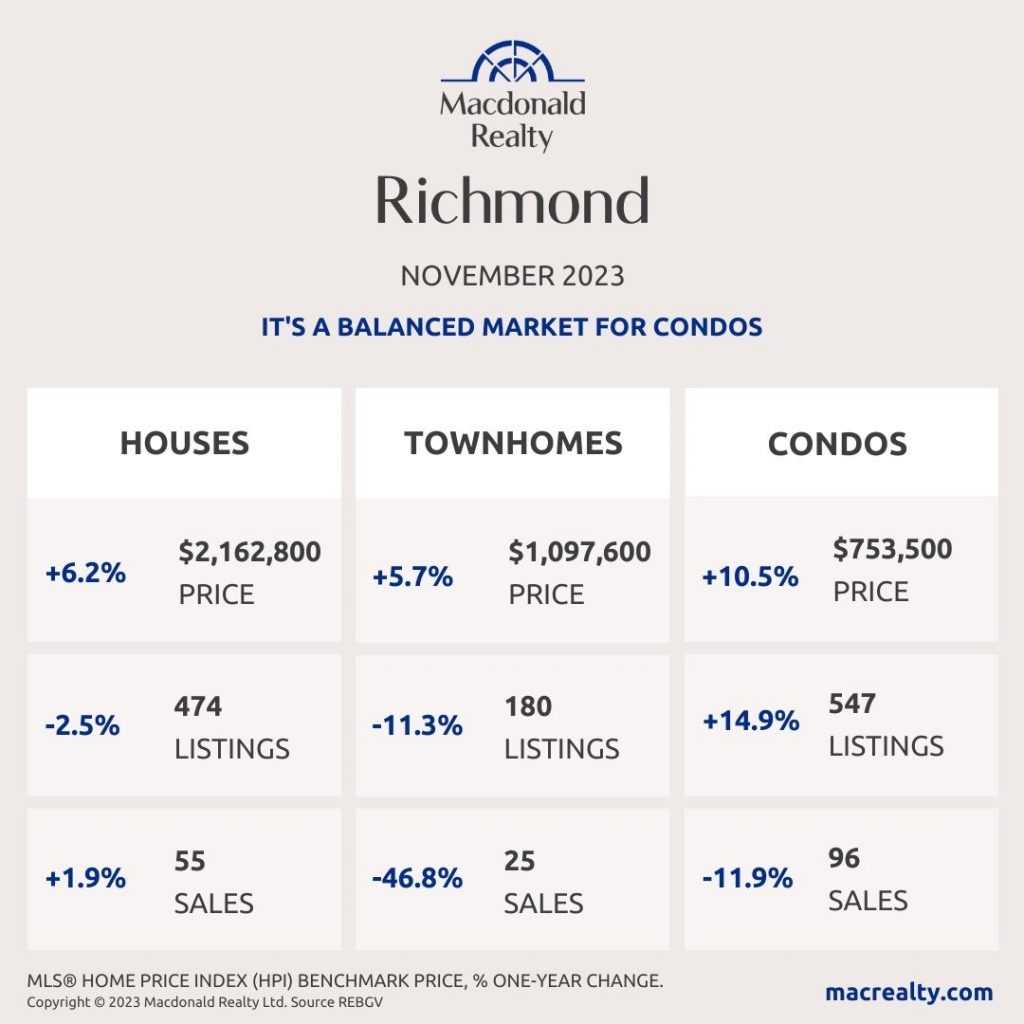
Richmond
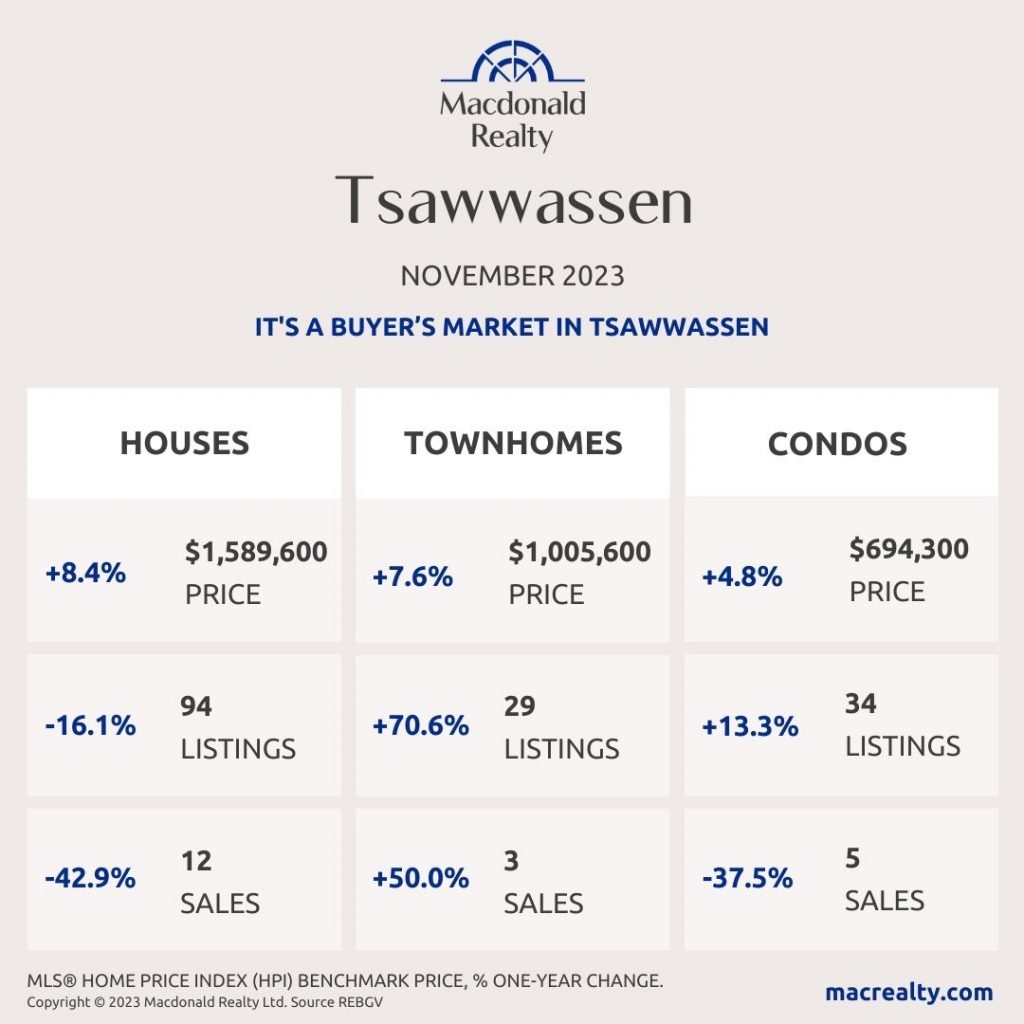
Tsawwassen
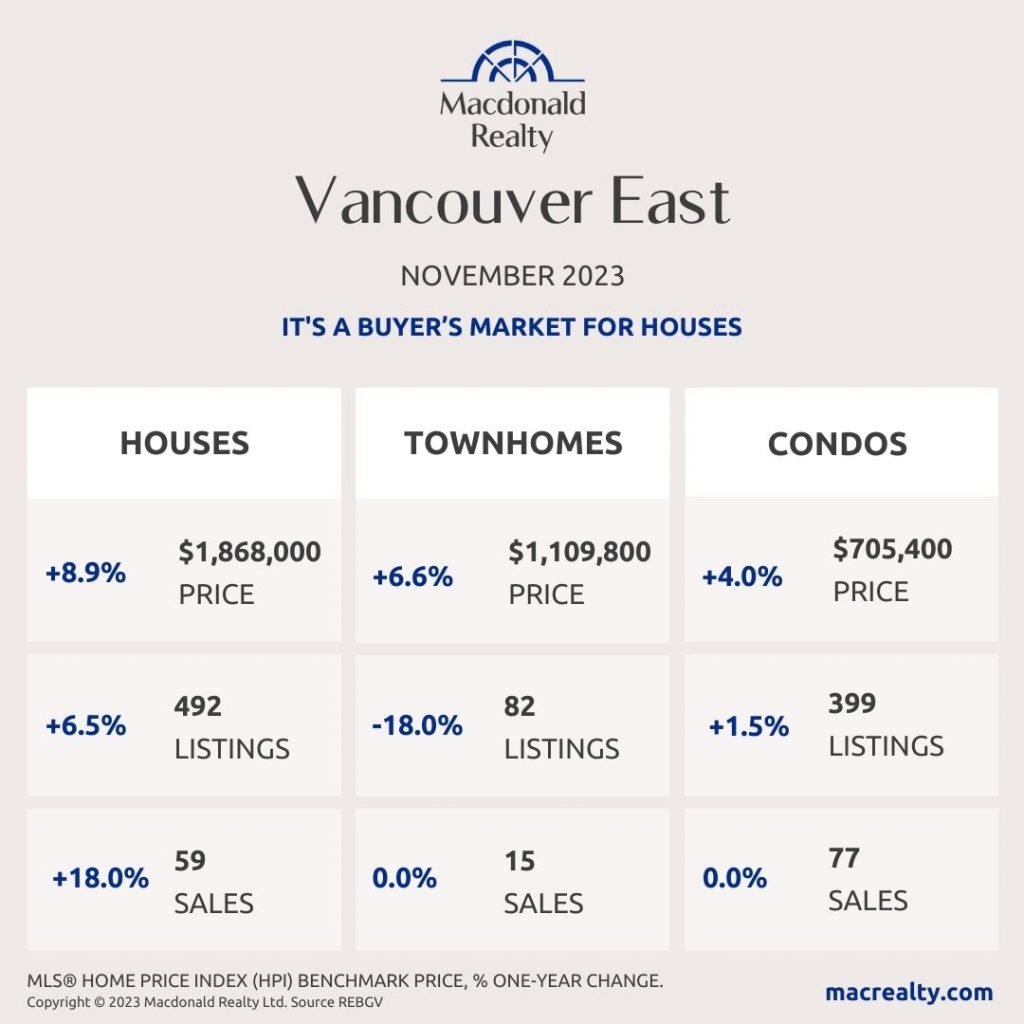
Vancouver East
Vancouver West

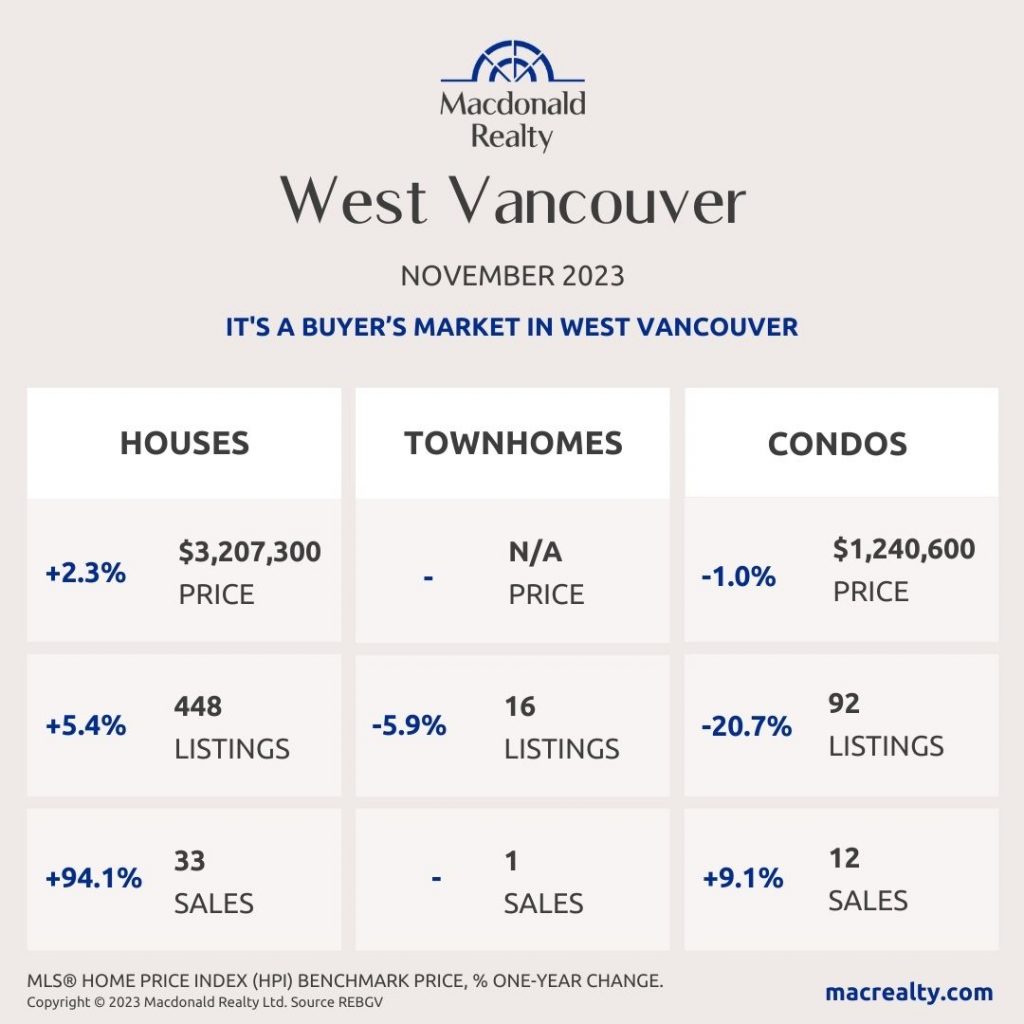
West Vancouver
Looking for more information about the real estate market in specific neighbourhoods in the Greater Vancouver?
Macdonald Realty has offices across the Greater Vancouver. Please email [email protected] or call 1-877-278-3888 to be matched with a REALTOR® working in your area.
MLS® Home Price Index (HPI) Benchmark Price
Average and median home prices are often misinterpreted, are affected by change in the mix of homes sold, and can swing dramatically from month to month (based on the types and prices of properties that sold in a given month). The MLS® HPI overcomes these shortcomings and uses the concept of a benchmark home, a notional home with common attributes of typical homes in a defined area. Visit www.housepriceindex.ca for more information.
This blog post is based on market data provided by the Real Estate Board of Greater Vancouver (REBGV) www.rebgv.org
by Macrealty Marketing Team | Nov 3, 2023 | Market Updates
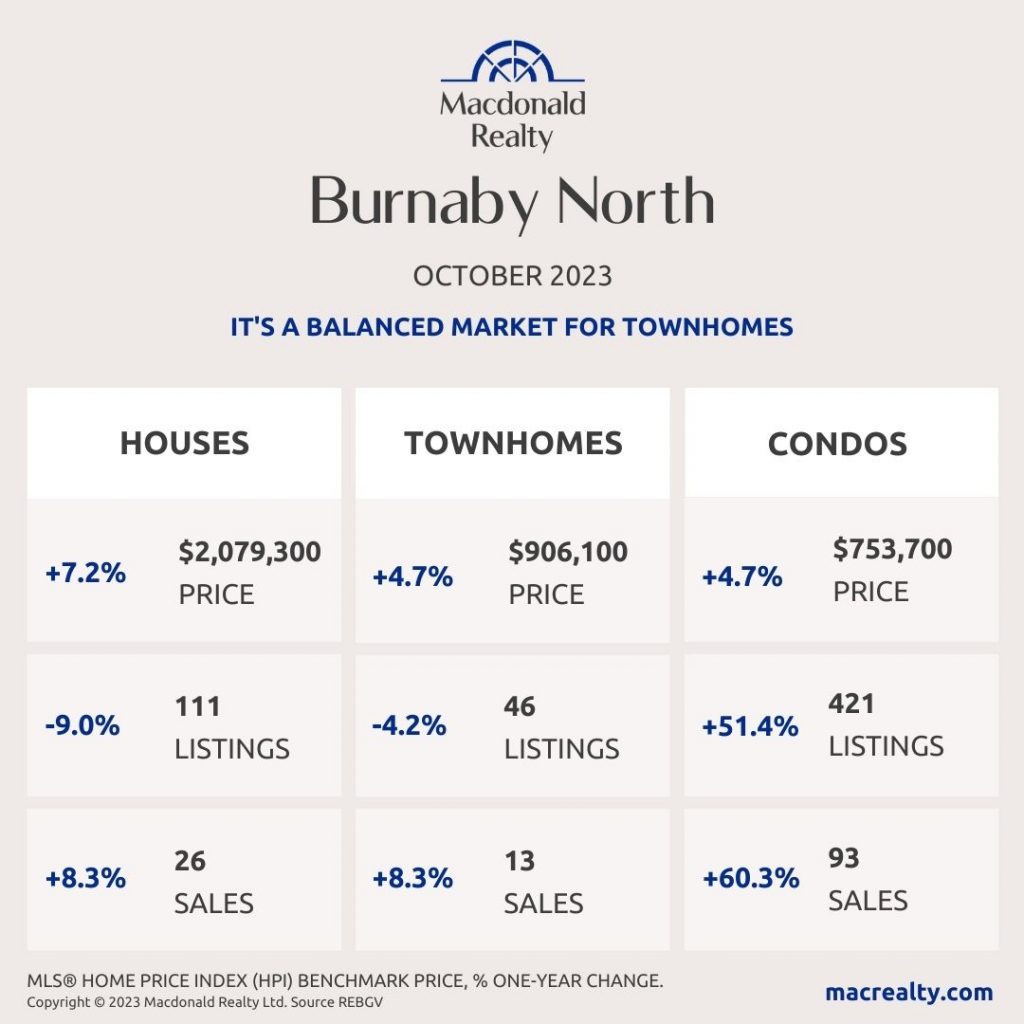
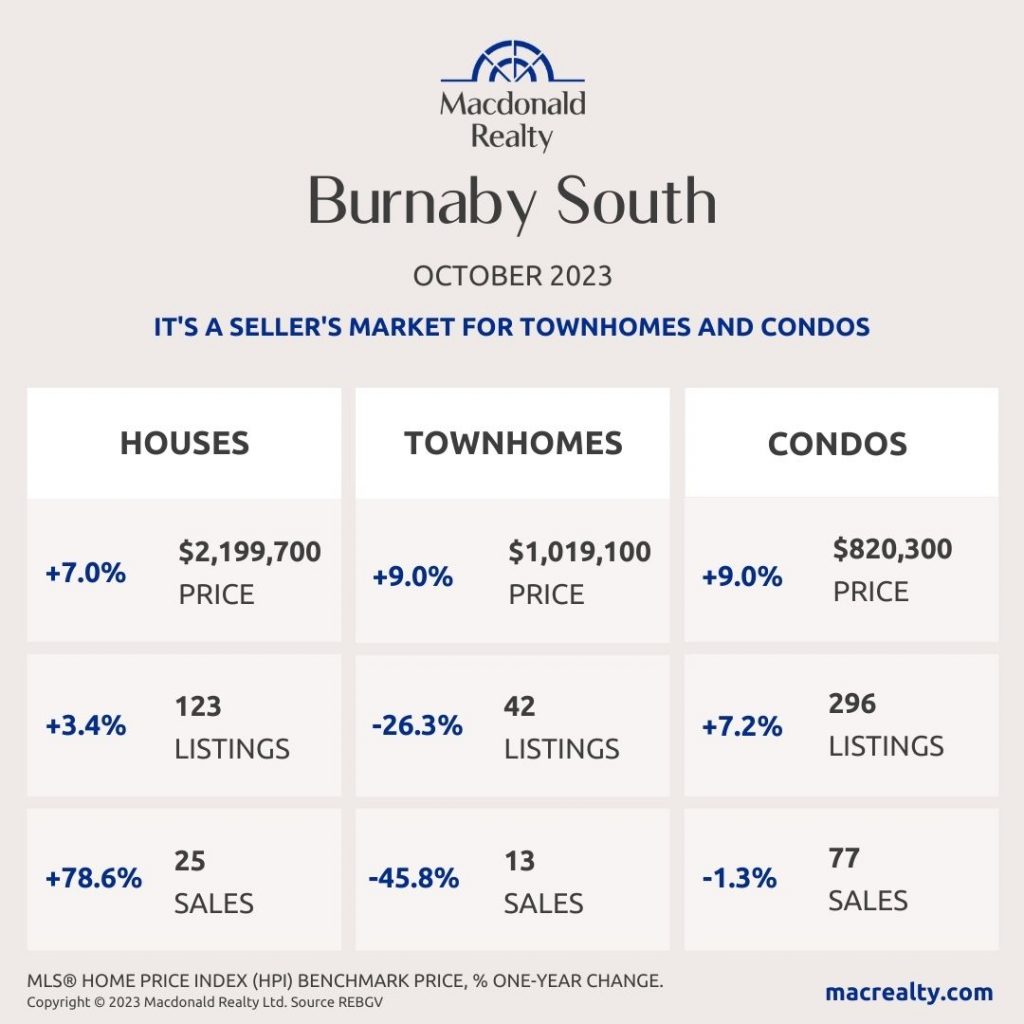
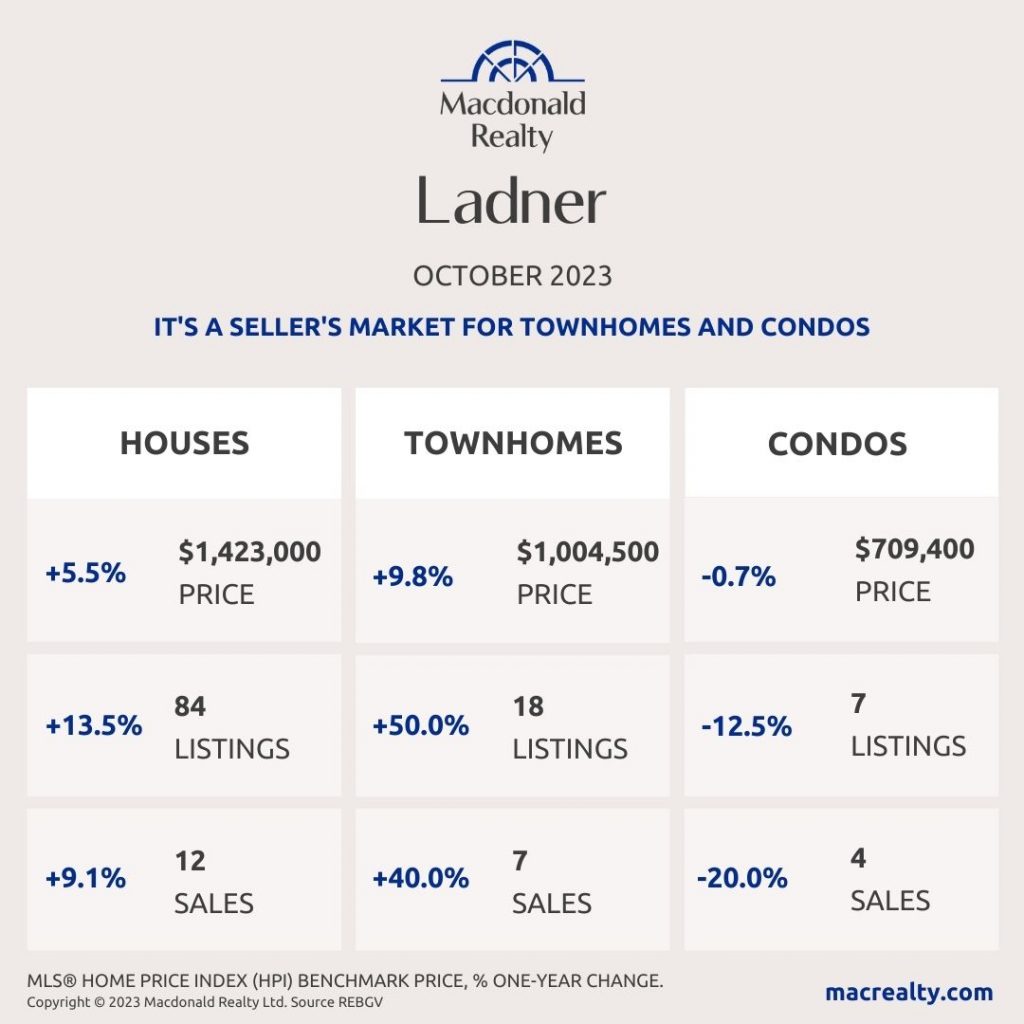
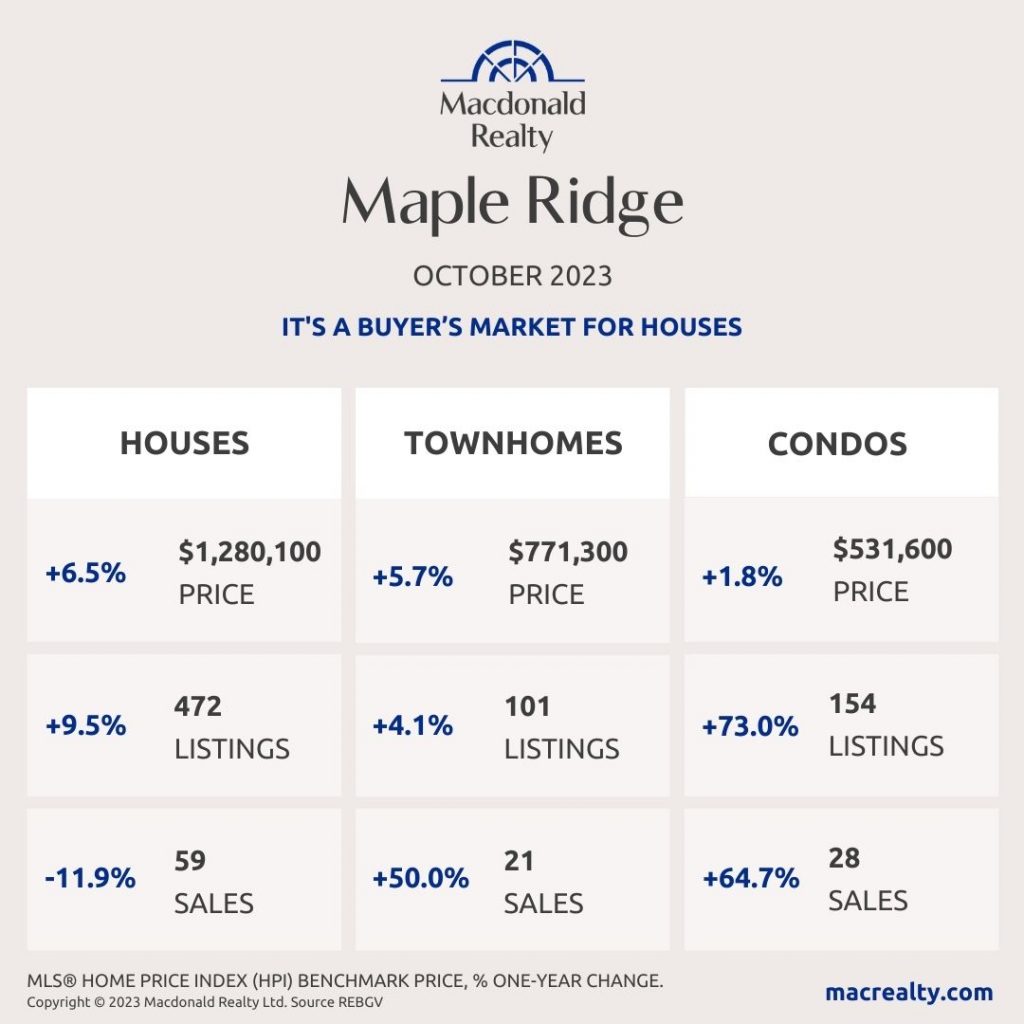
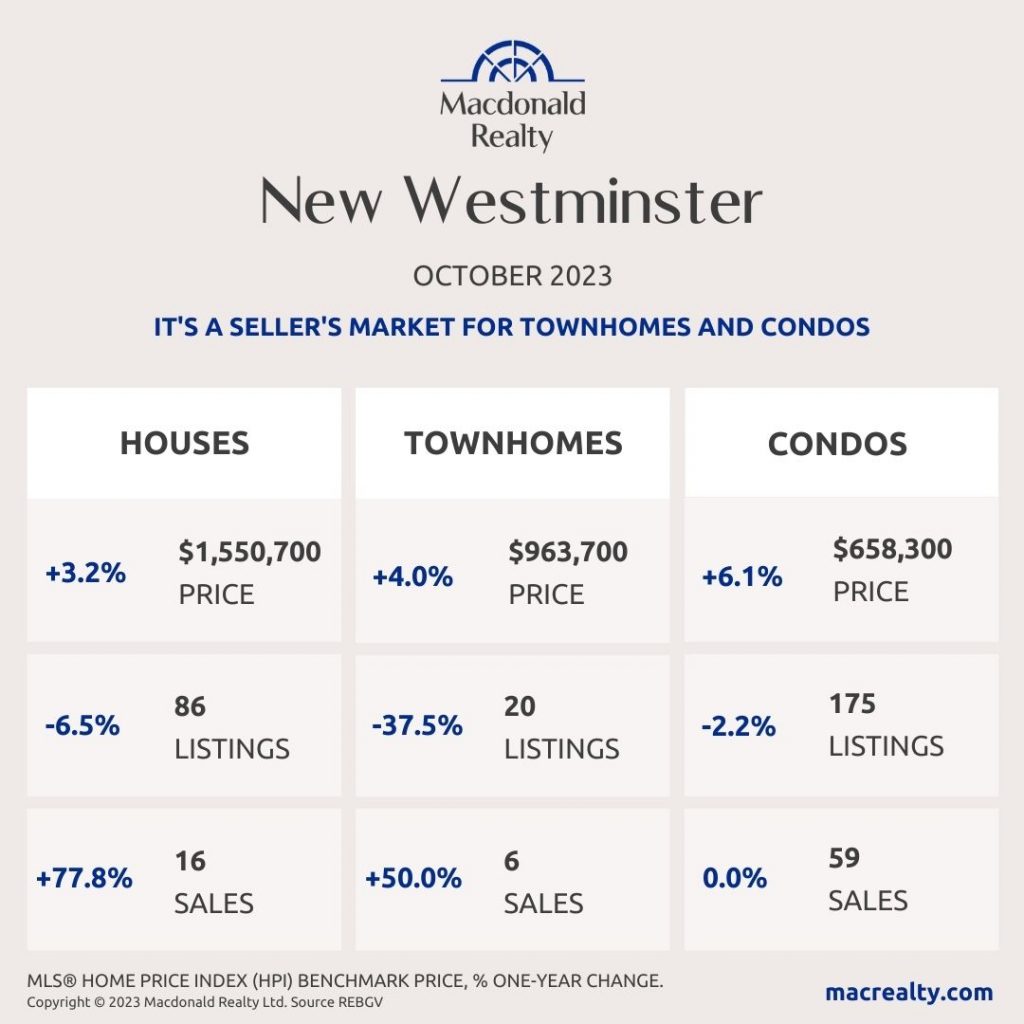
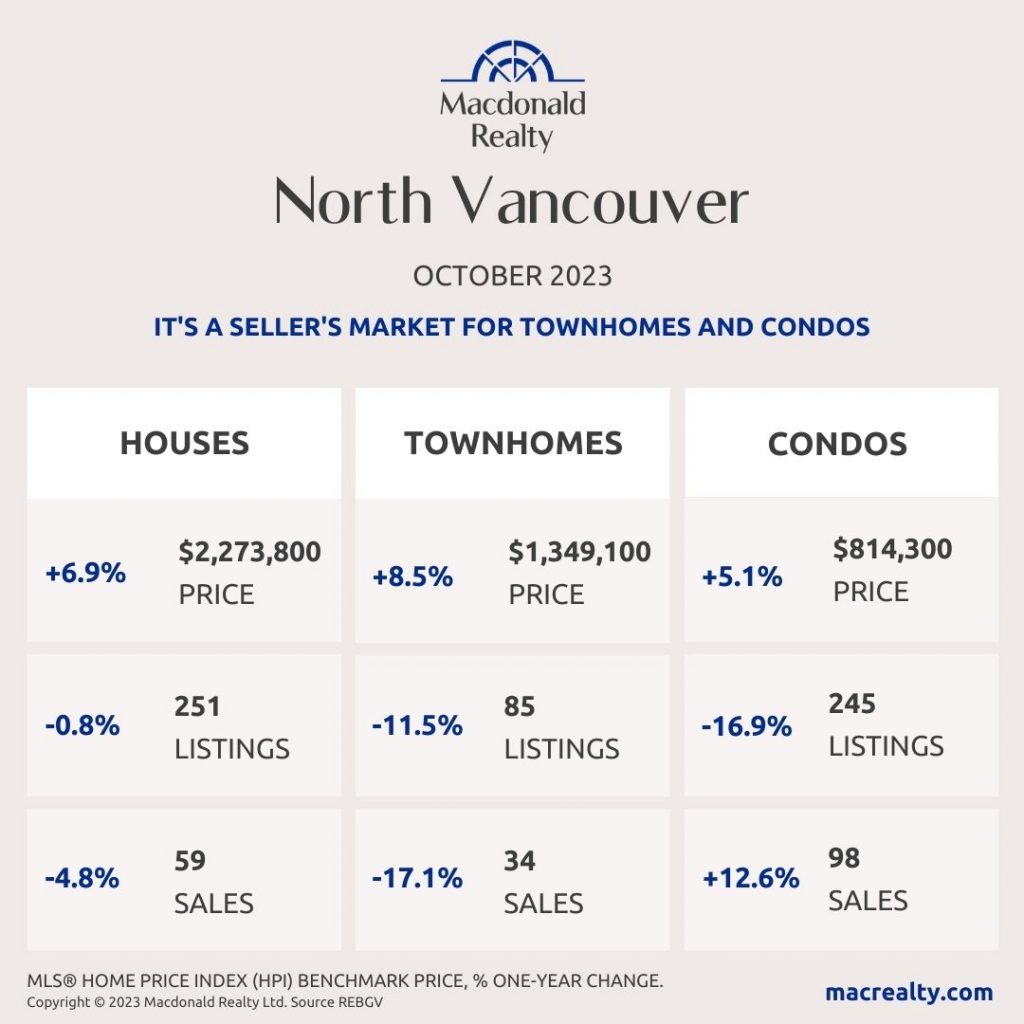
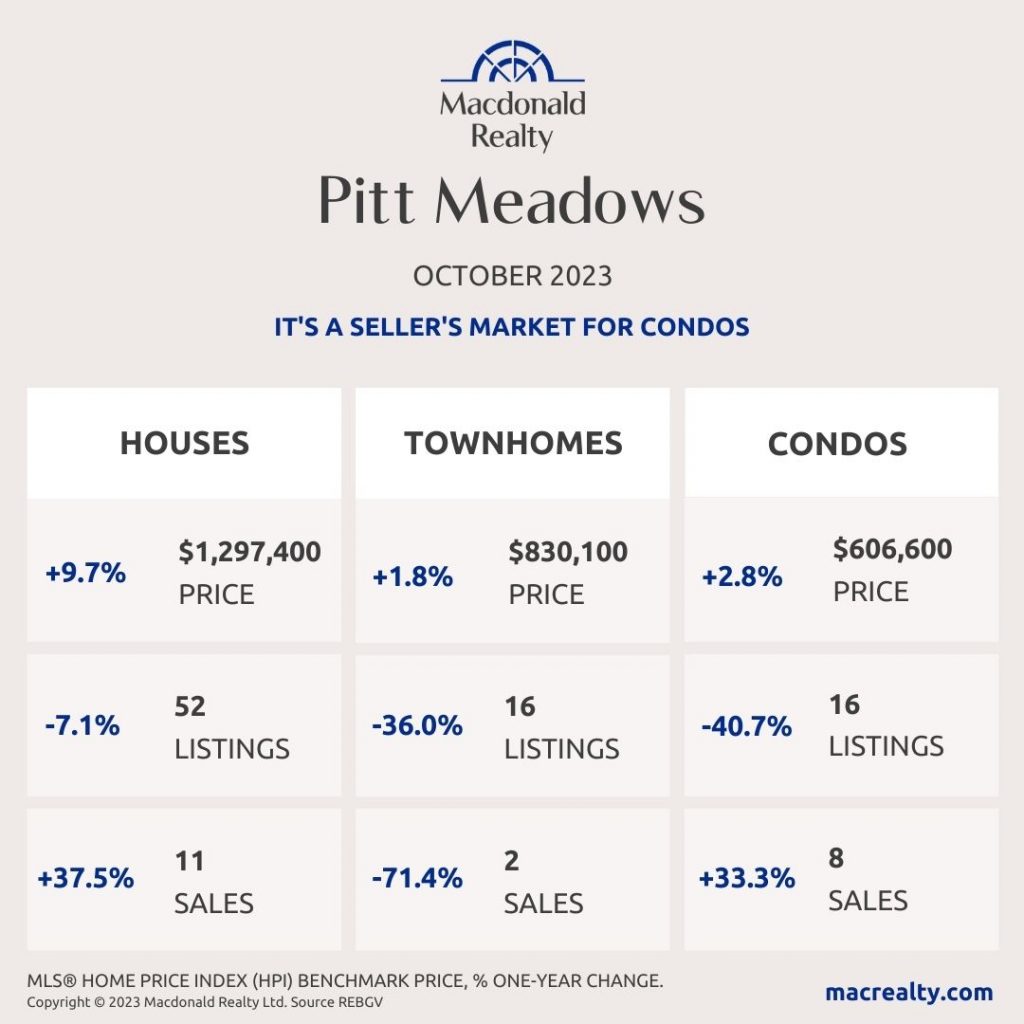
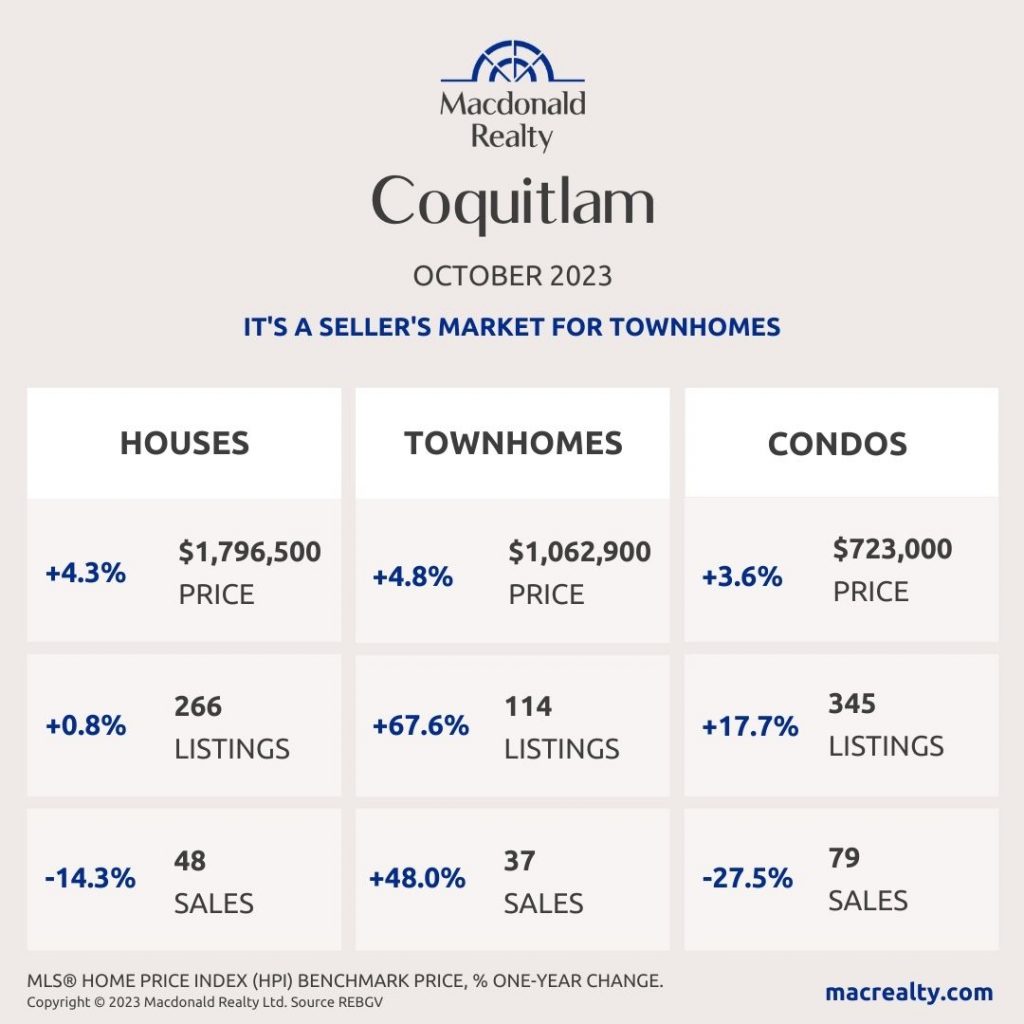
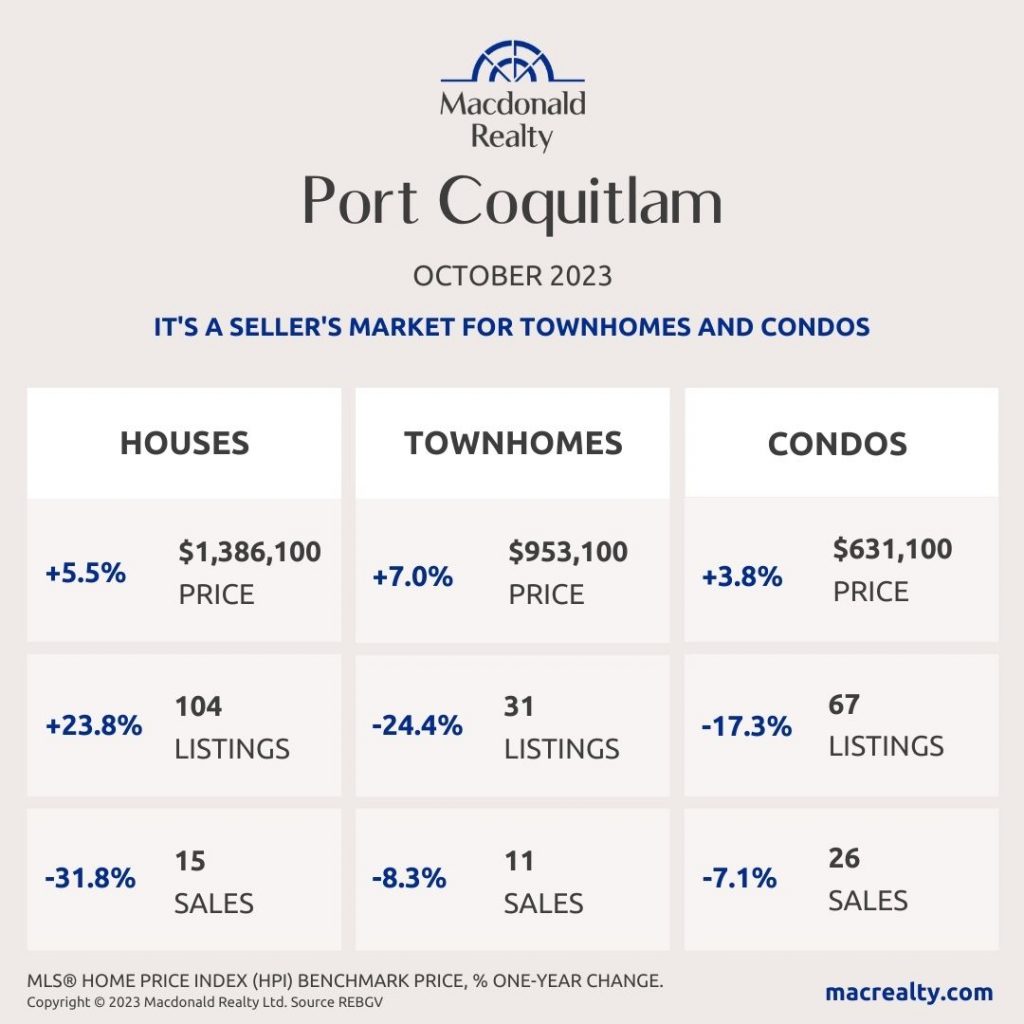
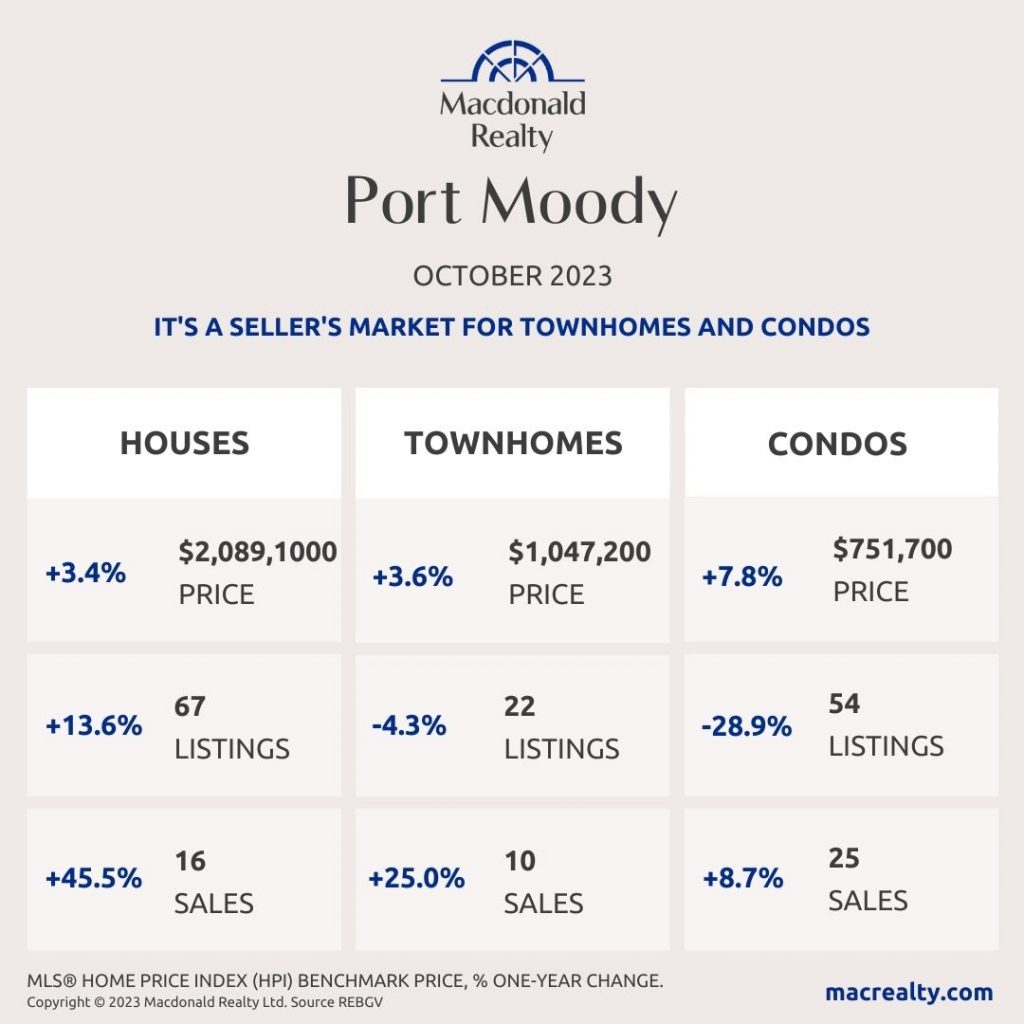
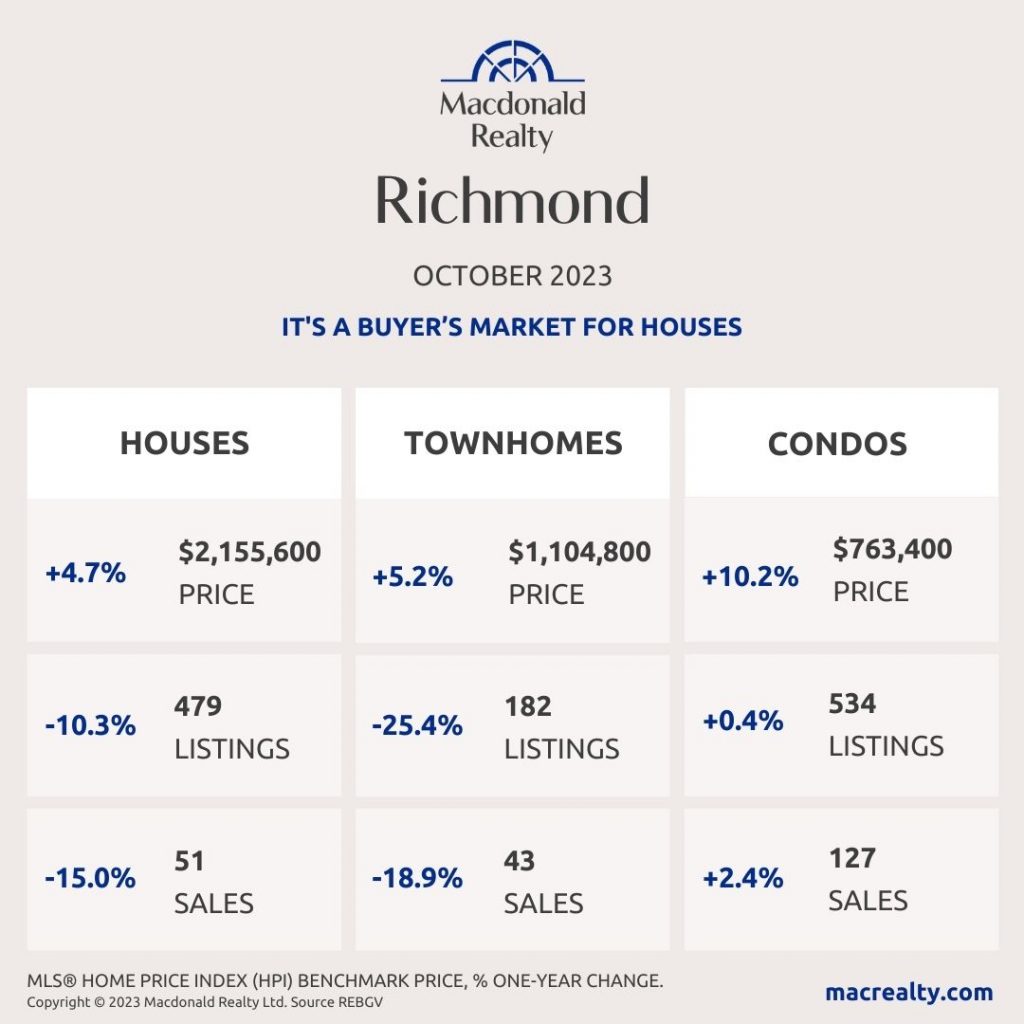
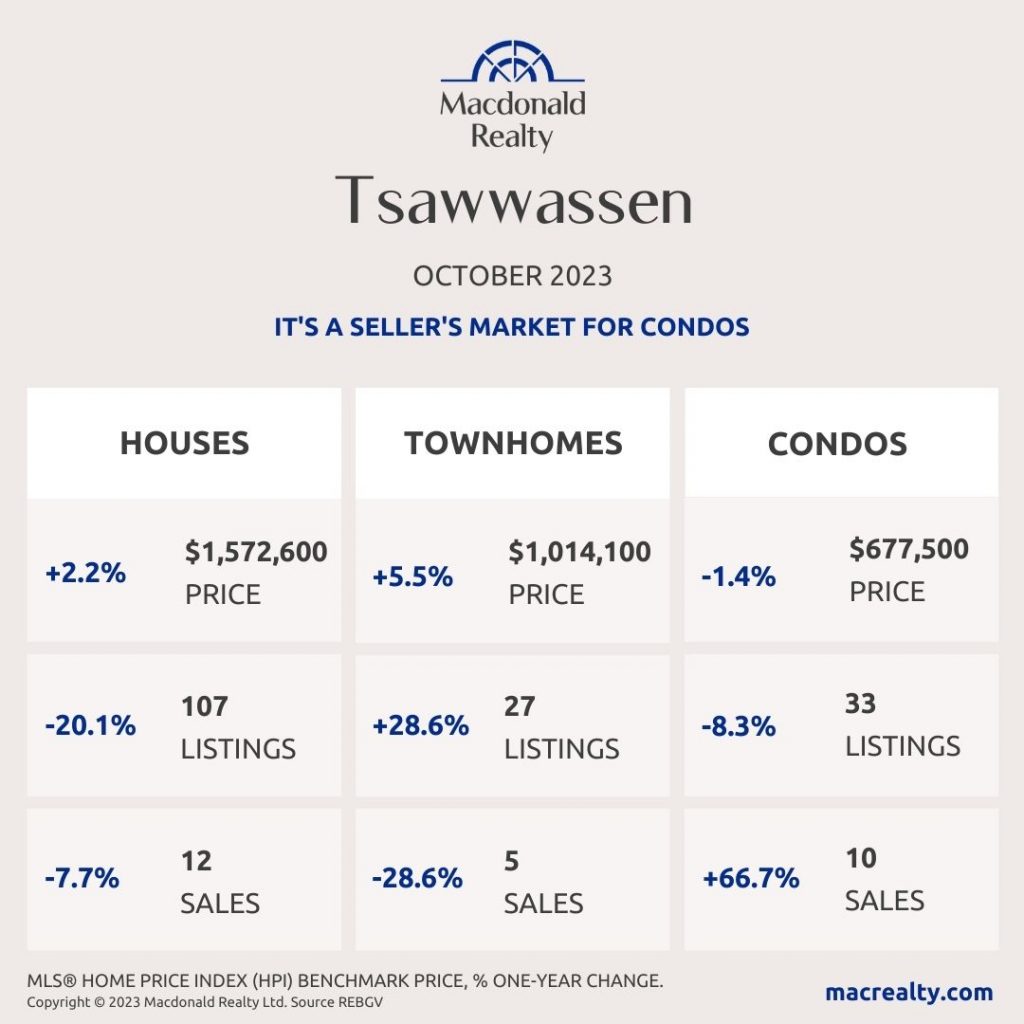
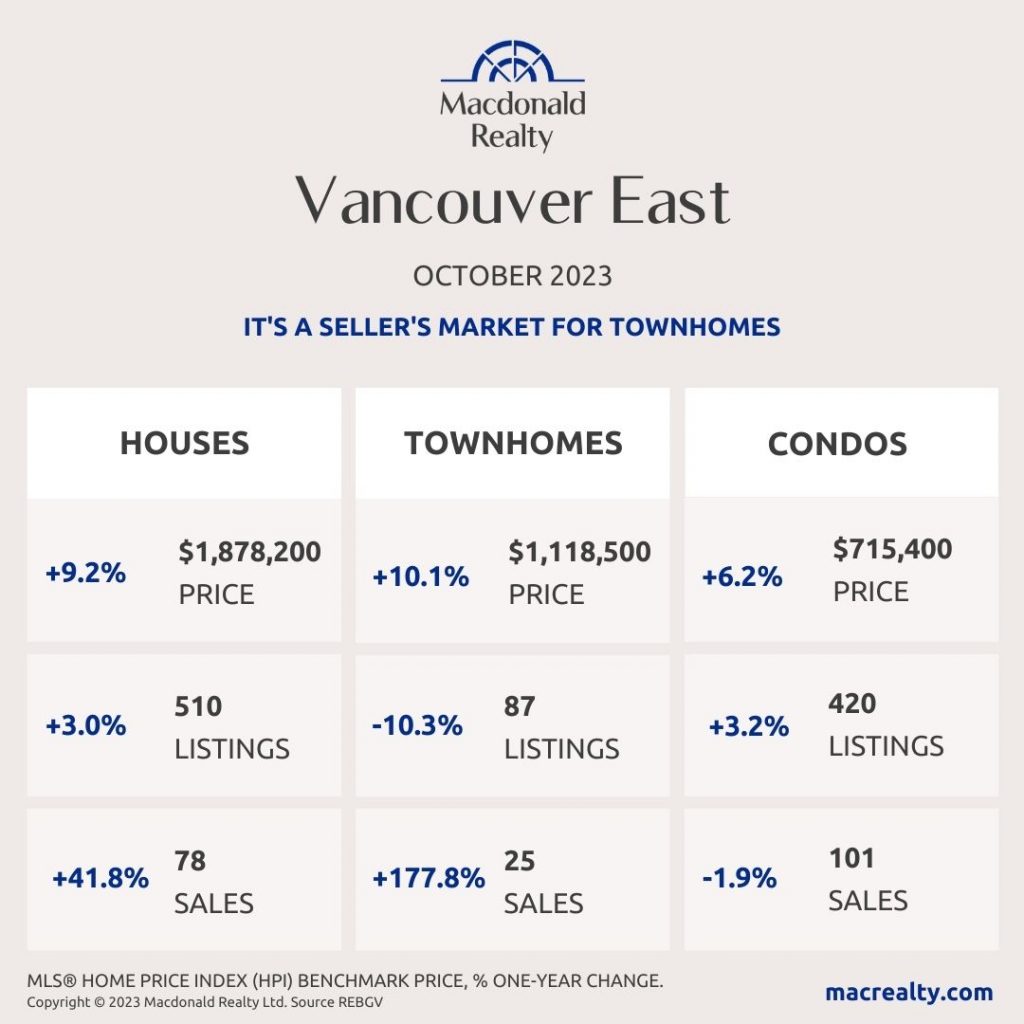
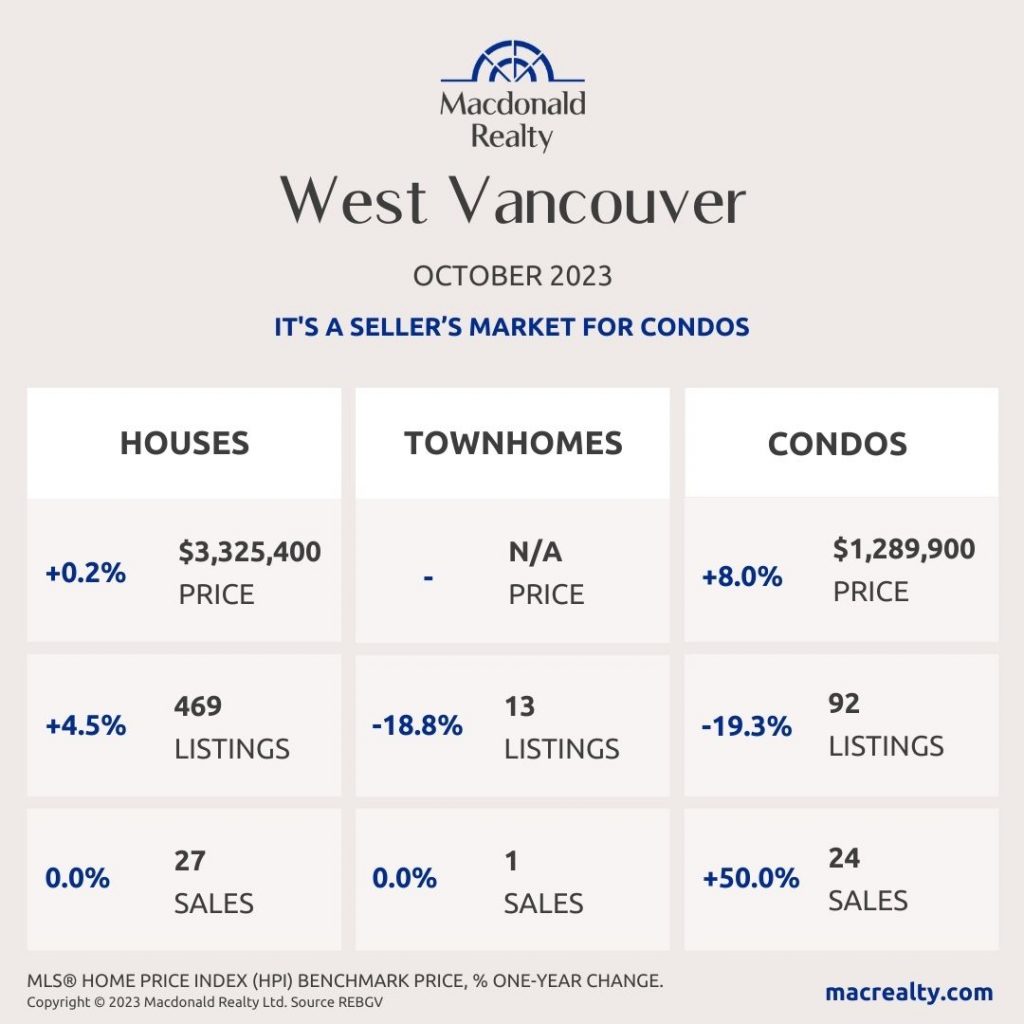
Here are the latest real estate market statistics from Macdonald Realty on the Greater Vancouver listings and sales in October 2023. Find all the infographics by visiting the Facebook Album.
An increase in newly listed properties is providing more choice to home buyers across Metro Vancouver, but sales remain below long-term averages.
The Real Estate Board of Greater Vancouver (REBGV) reports that residential sales in the region totalled 1,996 in October 2023, a 3.7 per cent increase from the 1,924 sales recorded in October 2022. This total is 29.5 per cent below the 10-year seasonal average (2,832) for October.
“With properties coming to market at a rate roughly five per cent above the ten-year seasonal average, there seems to be a continuation of the renewed interest on the part of sellers to participate in the market that we’ve been watching this fall,” Andrew Lis, REBGV’s director of economics and data analytics said. “Counterbalancing this increase in supply, however, is the fact sales remain almost 30 per cent below their ten-year seasonal average, which tells us demand is not as strong as we might expect this time of year.”
There were 4,664 detached, attached and apartment properties newly listed for sale on the Multiple Listing Service® (MLS®) in Metro Vancouver in October 2023. This represents a 15.4 per cent increase compared to the 4,043 properties listed in October 2022 and is 4.8 per cent above the 10-year seasonal average (4,449) for the month.
The total number of properties currently listed for sale on the MLS® system in Metro Vancouver is 11,599, a 12.6 per cent increase compared to October 2022 (10,305). This change is also 0.6 per cent above the 10-year seasonal average (11,526).
Across all detached, attached and apartment property types, the sales-to-active listings ratio for October 2023 is 17.9 per cent. By property type, the ratio is 12.9 per cent for detached homes, 20.9 per cent for attached, and 21.5 per cent for apartments.
Analysis of the historical data suggests downward pressure on home prices occurs when the ratio dips below 12 per cent for a sustained period, while home prices often experience upward pressure when it surpasses 20 per cent over several months.
“With more supply in the form of resale inventory, and weaker demand in the form of slower sales, we’ve seen market conditions overall adjust towards more balanced conditions. It’s noteworthy that the multifamily segment remains more active than the detached segment at this time,” Lis said. “While the highest borrowing costs we’ve seen in over a decade continue to constrain affordability, a silver lining for buyers is that price increases have abated with these more balanced market conditions, meaning purchasing power is holding steady for the moment.”
The MLS® Home Price Index composite benchmark price for all residential properties in Metro Vancouver is currently $1,196,500. This represents a 4.4 per cent increase over October 2022 and a 0.6 per cent decrease compared to September 2023.
*Areas covered by the Real Estate Board of Greater Vancouver include Burnaby, Coquitlam, Maple Ridge, New Westminster, North Vancouver, Pitt Meadows, Port Coquitlam, Port Moody, Richmond, South Delta, Squamish, Sunshine Coast, Vancouver, West Vancouver, and Whistler. Check out the infographics of Squamish, Sunshine Coast and Whistler, HERE.
Bowen Island
Burnaby East
Burnaby North
Burnaby South
Ladner
Maple Ridge
New Westminster
North Vancouver
Pitt Meadows
Coquitlam
Port Coquitlam
Port Moody
Richmond
Tsawwassen
Vancouver East
Vancouver West

West Vancouver
Looking for more information about the real estate market in specific neighbourhoods in the Greater Vancouver?
Macdonald Realty has offices across the Greater Vancouver. Please email [email protected] or call 1-877-278-3888 to be matched with a REALTOR® working in your area.
MLS® Home Price Index (HPI) Benchmark Price
Average and median home prices are often misinterpreted, are affected by change in the mix of homes sold, and can swing dramatically from month to month (based on the types and prices of properties that sold in a given month). The MLS® HPI overcomes these shortcomings and uses the concept of a benchmark home, a notional home with common attributes of typical homes in a defined area. Visit www.housepriceindex.ca for more information.
This blog post is based on market data provided by the Real Estate Board of Greater Vancouver (REBGV) www.rebgv.org
by Macrealty Marketing Team | Nov 2, 2023 | Market Updates
November 2023 – Lower Mainland Monthly Update
At 6.1 Months of Inventory, Prices are expected to Remain Flat.
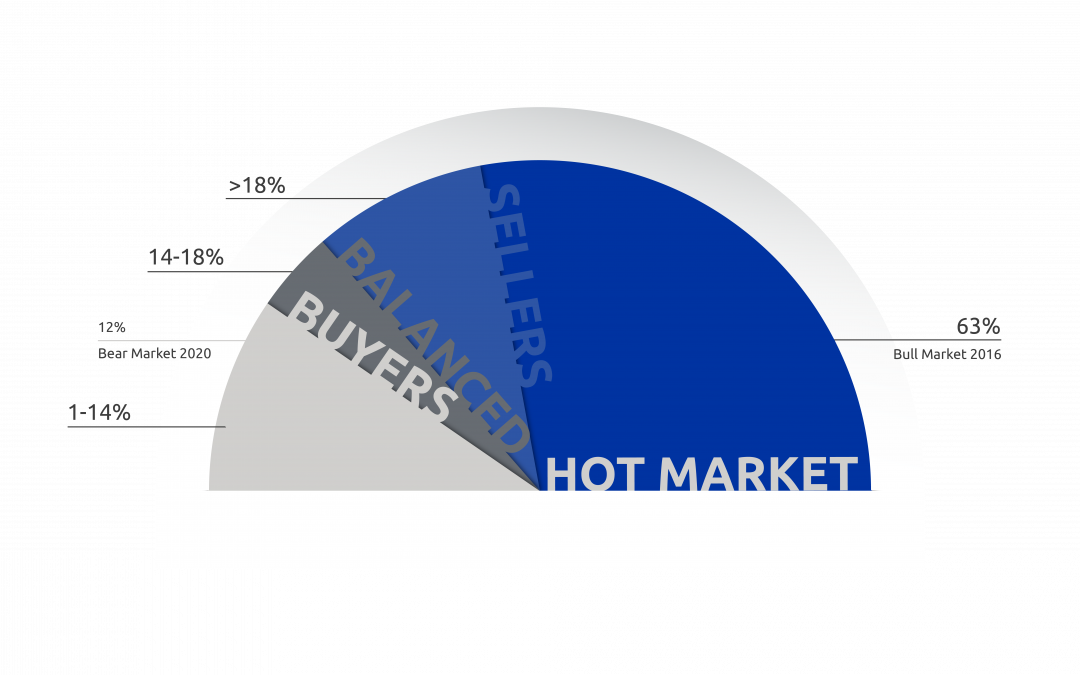
The most reliable indicator of market prices is the Sales to Active Listings Ratio (SAL). This is the ratio between the number of sales in a given month and the number of active listings at month-end.
In hotter markets in BC, a long-term analysis has shown that prices will usually act in the following ways:
- 7+ Months of Inventory (Under 14% SAL): Prices will likely DECLINE
- 5 – 7 Months of Inventory (14% – 18% SAL): Prices will likely be STABLE
- Less than 5.5 Months of Inventory (Over 18% SAL): Prices will likely RISE
Visit this link to learn more about house prices and inventory.
Sales
Sales (2,966) were 5% higher than a year ago (2,804), and were 30% below the 10-year average (4,082).
Cumulative Year-to-date Sales
2023 continues to be slower as sales (36,163) remain below the 10-year average (45,215).
Inventory
Inventory (18,179 active listings) increased slightly from the previous month, and are now above the 10-year average for the first time since Nov 2020 (19,041 average).


Sales to Active Listings
Low sales but modest inventory kept the Sales to Active Listing Ratio at 16%, indicating flat prices.
Months of Inventory
Similarly, Months of Inventory rose to 6.1 MOI, indicating a balanced market and flat prices.
Want to learn more about these stats or discuss your move to Macdonald Realty?
Check out careersinbcrealestate.com to connect today!