December 2023 – Lower Mainland Monthly Update
November 2023 – Lower Mainland Monthly Update
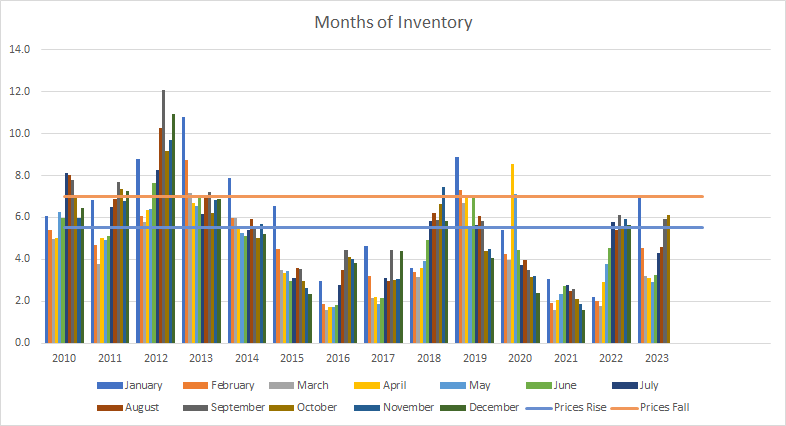
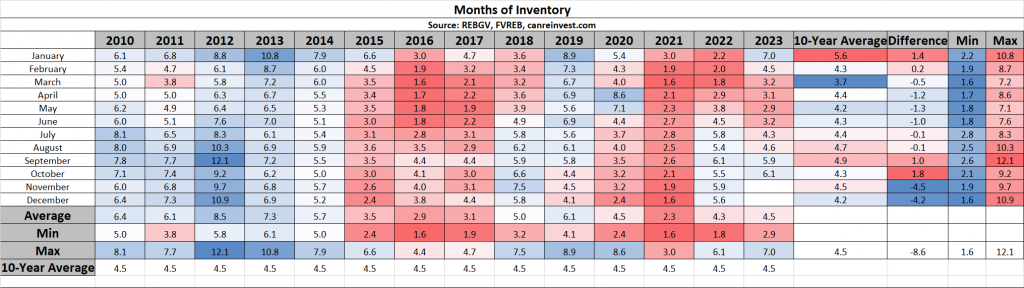
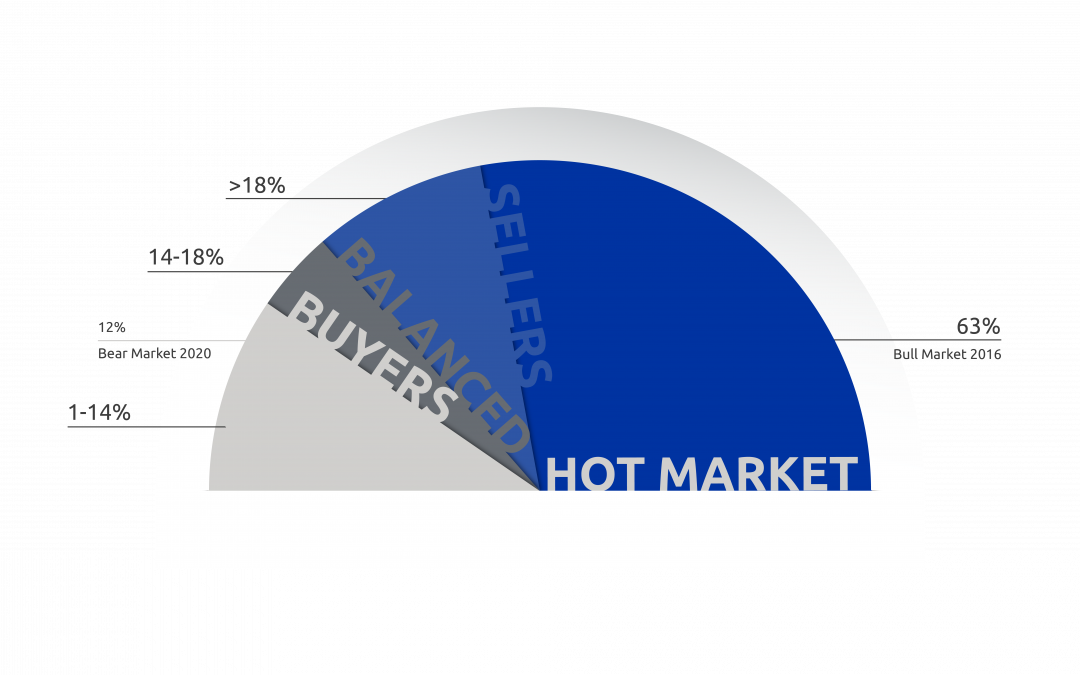
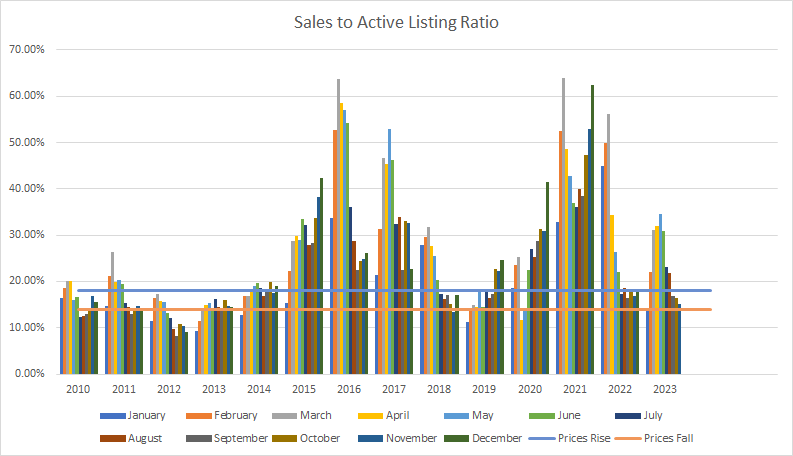
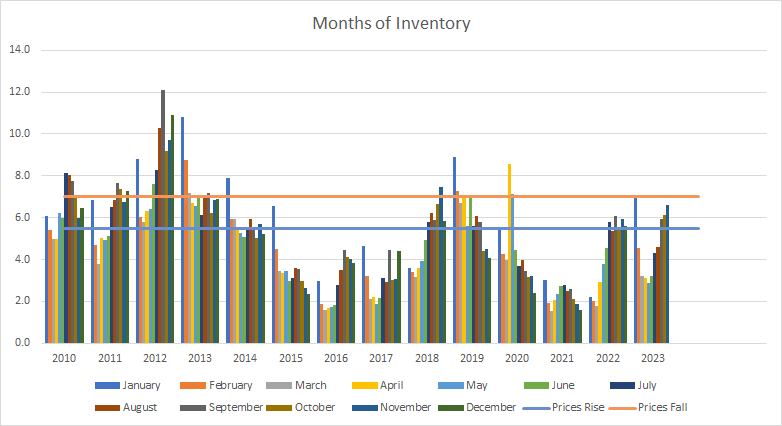
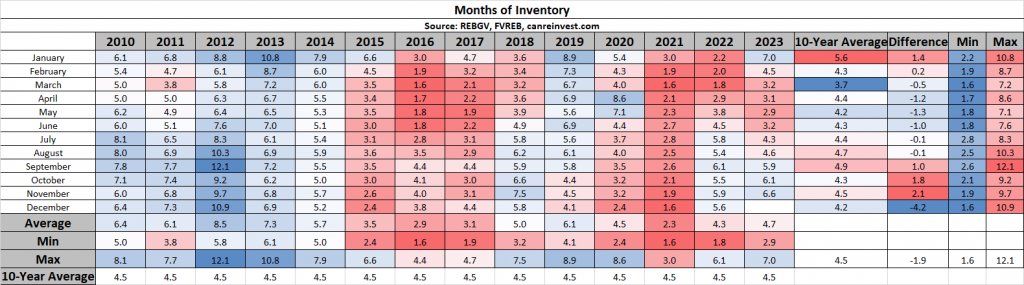
At 6.6 Months of Inventory, Prices have traditionally softened.


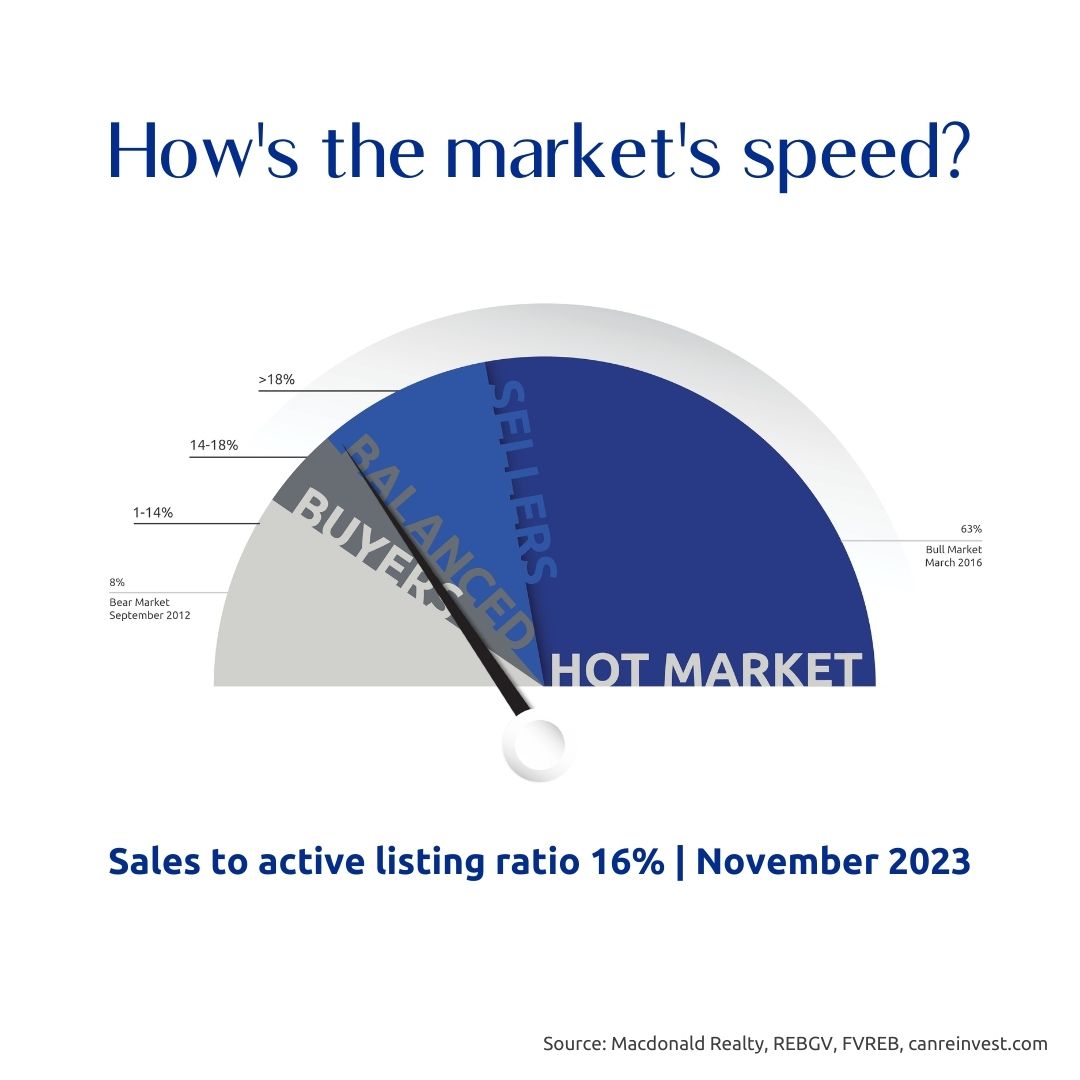
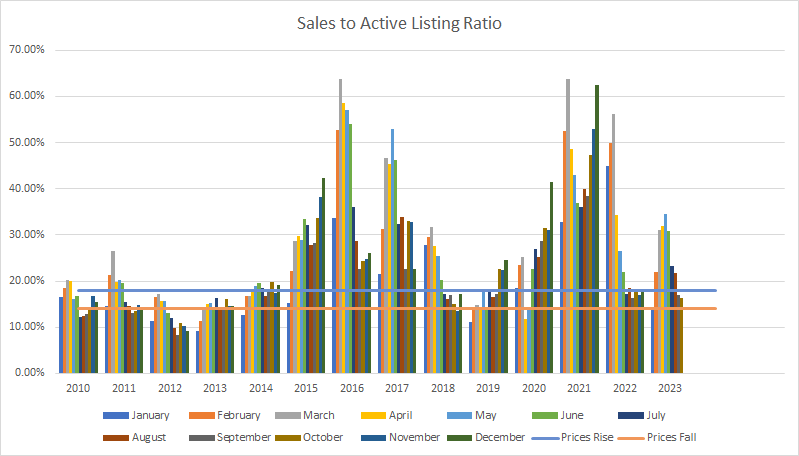
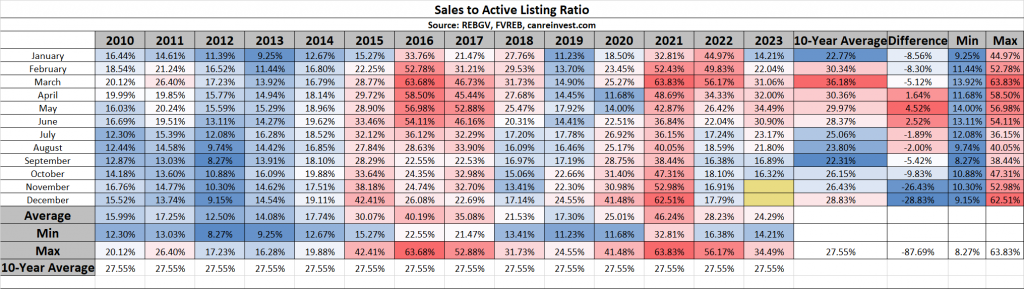
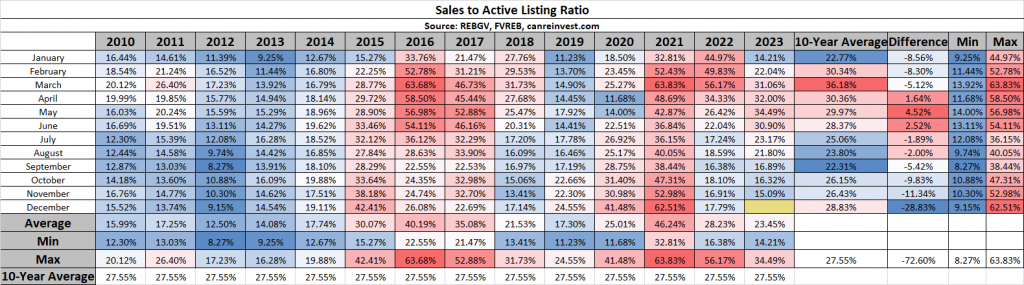
The most reliable indicator of market prices is the Sales to Active Listings Ratio (SAL). This is the ratio between the number of sales in a given month and the number of active listings at month-end.
In hotter markets in BC, a long-term analysis has shown that prices will usually act in the following ways:
- 7+ Months of Inventory (Under 14% SAL): Prices will likely DECLINE
- 5 – 7 Months of Inventory (14% – 18% SAL): Prices will likely be STABLE
- Less than 5.5 Months of Inventory (Over 18% SAL): Prices will likely RISE
Visit this link to learn more about house prices and inventory.
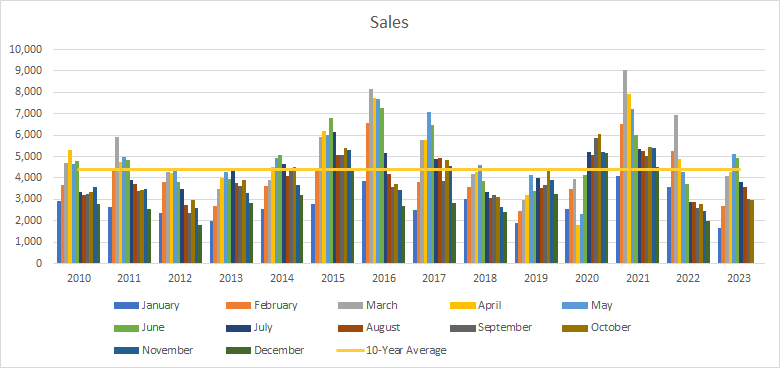
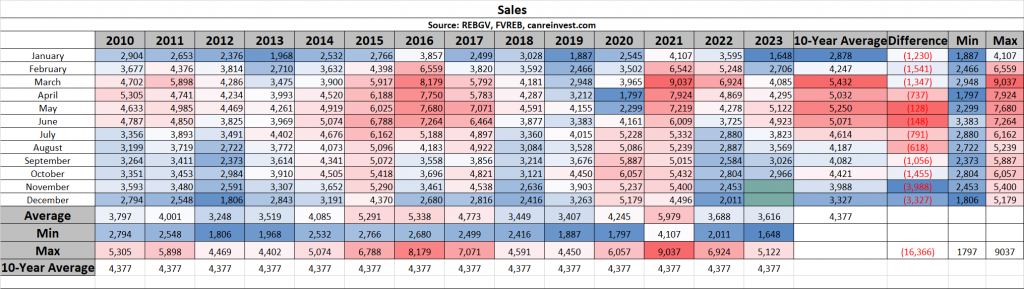
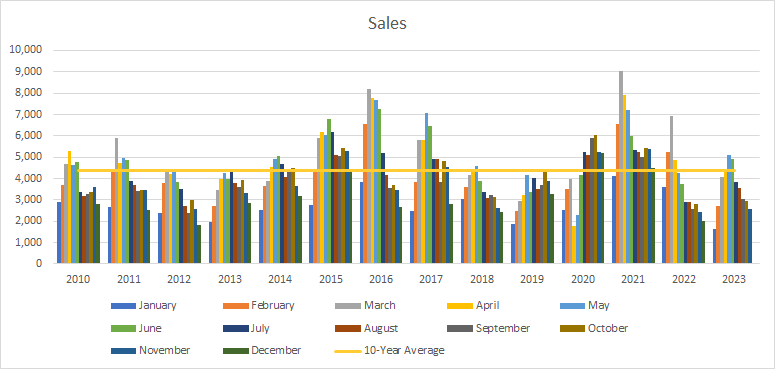
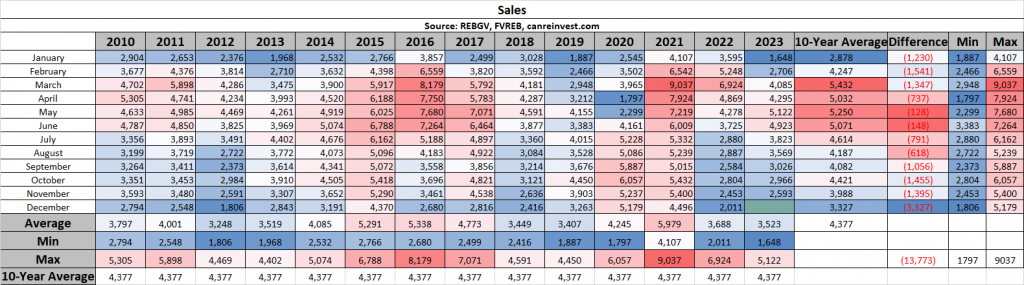
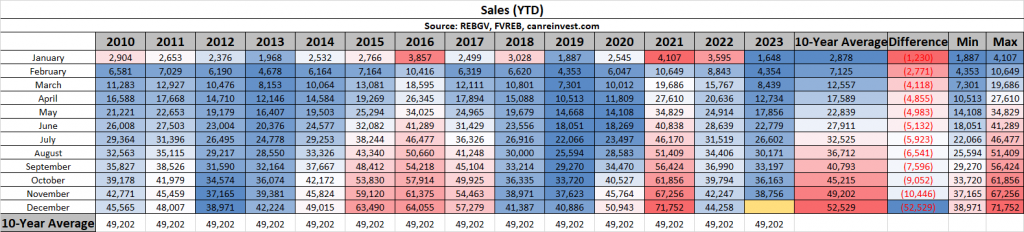
Sales
Sales (2,593) were about the same as a year ago (2,453), and were 25% below the 10-year average (3,988).
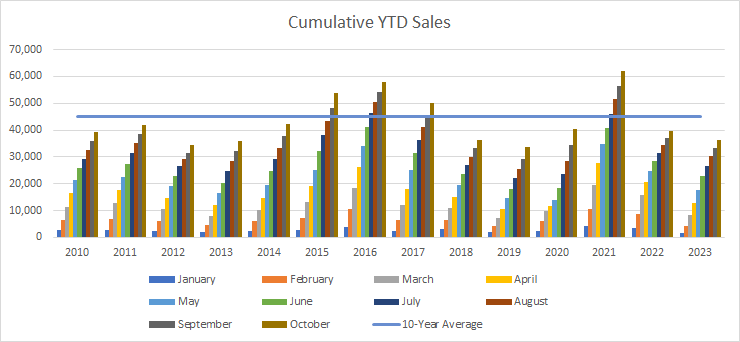
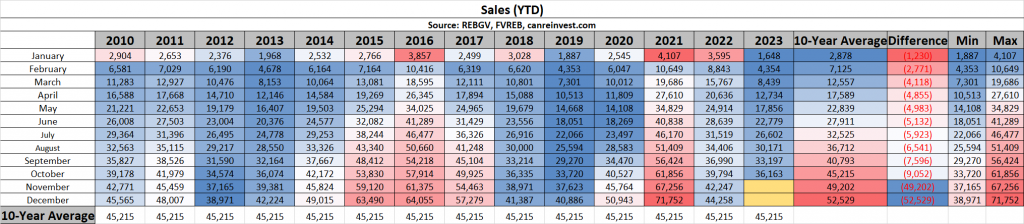
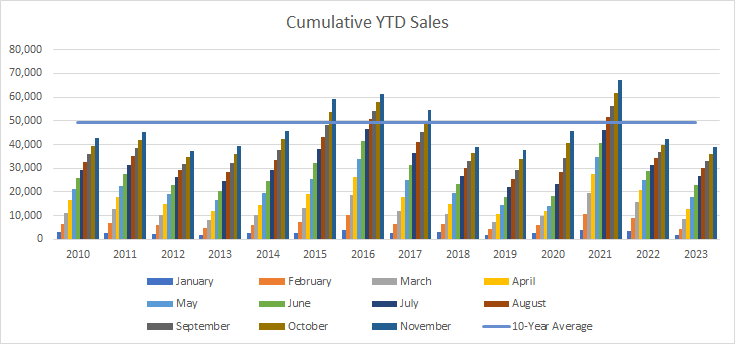
Cumulative Year-to-date Sales
2023 will likely end up as one of the slowest years in recent memory as sales (38,756) remain far below the 10-year average (49,202).
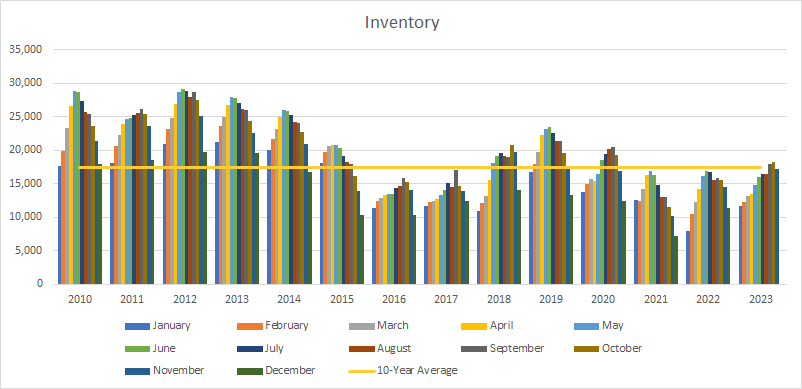
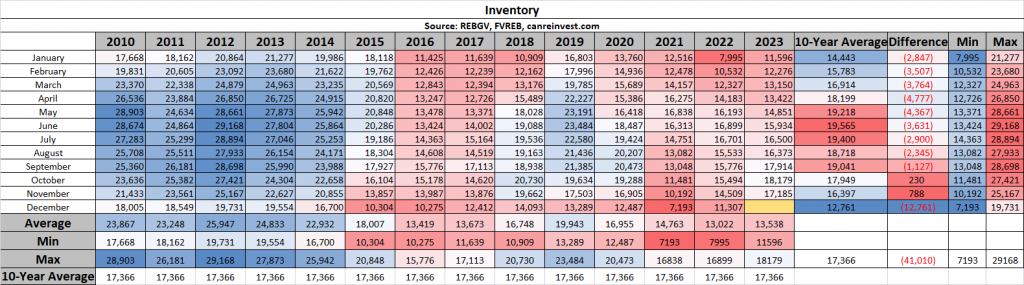
Inventory
Inventory (17,185 active listings) fell slightly from the previous month, but remain above the 10-year average for the first time since Nov 2020 (16,397 average).e).
Sales to Active Listings
Low sales and rising inventory have the Sales to Active Listing Ratio at 15%, indicating softening prices.
Months of Inventory
Similarly, Months of Inventory rose to 6.6 MOI, indicating a slow market and softening prices.
Want to learn more about these stats or discuss your move to Macdonald Realty?
Check out careersinbcrealestate.com to connect today!