Squamish, Whistler and Sunshine Coast Real Estate Market Statistics – December 2019
Here are the latest real estate market statistics from Macdonald Realty on Squamish, Whistler, and Sunshine Coast listings and sales in December 2019.
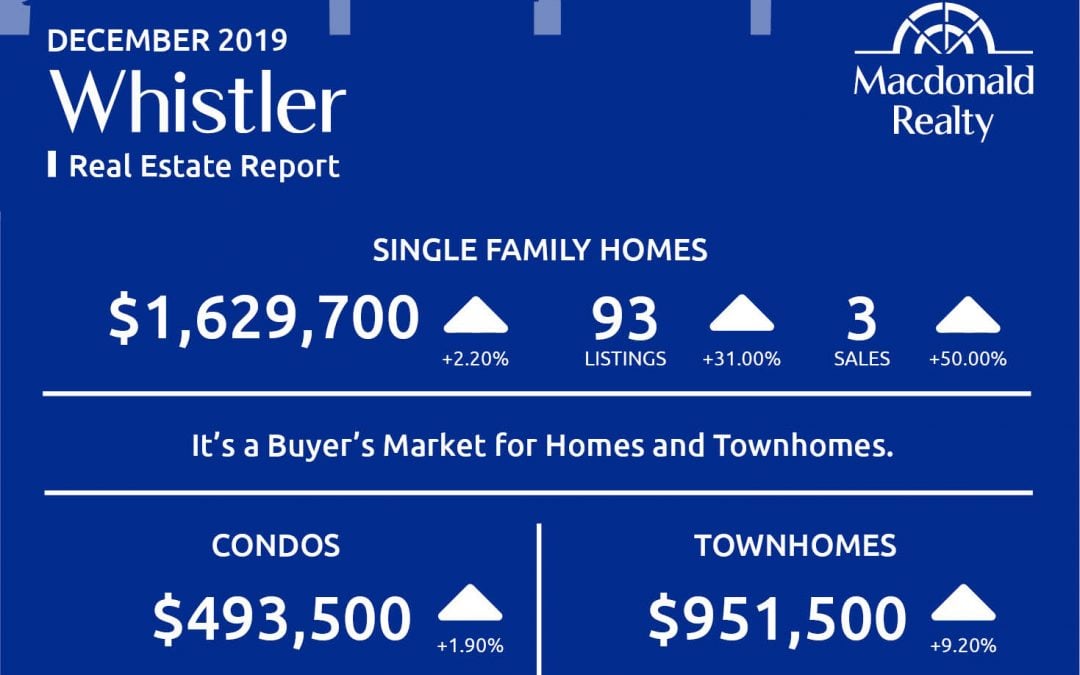
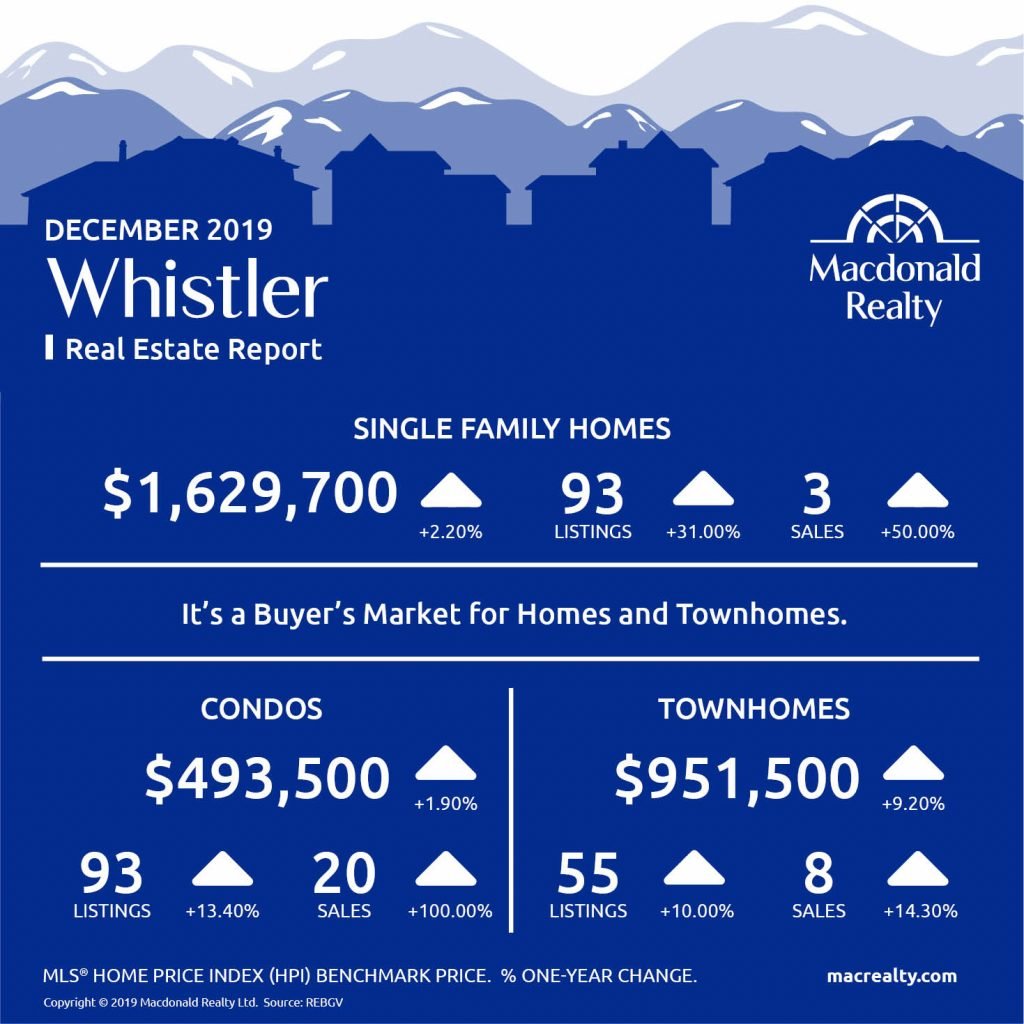
Whistler
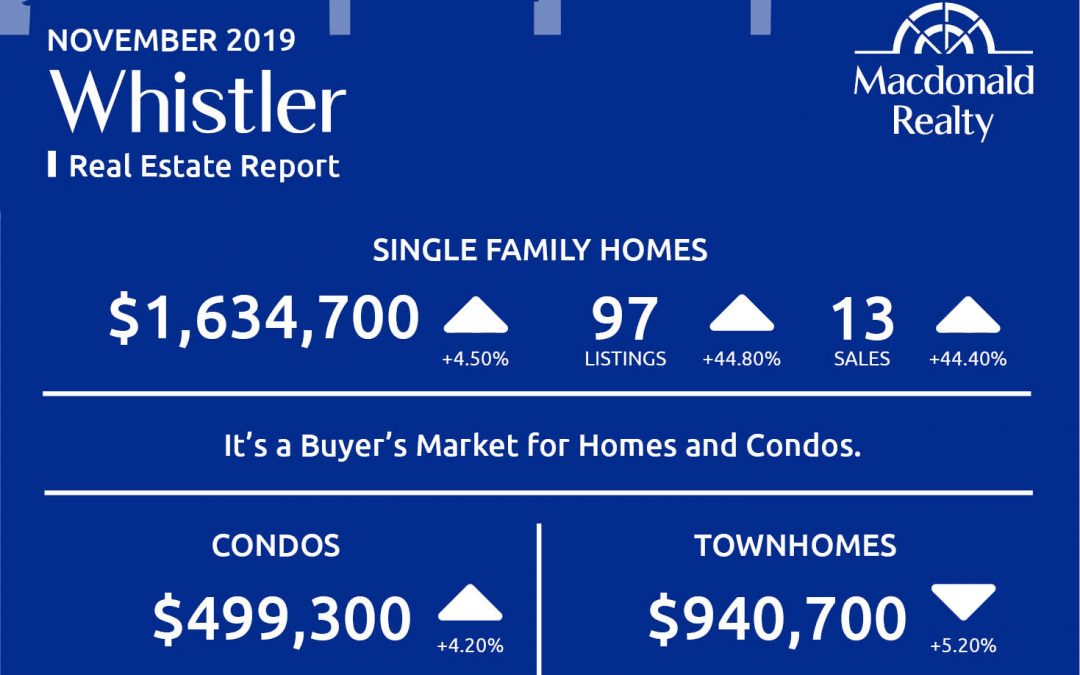
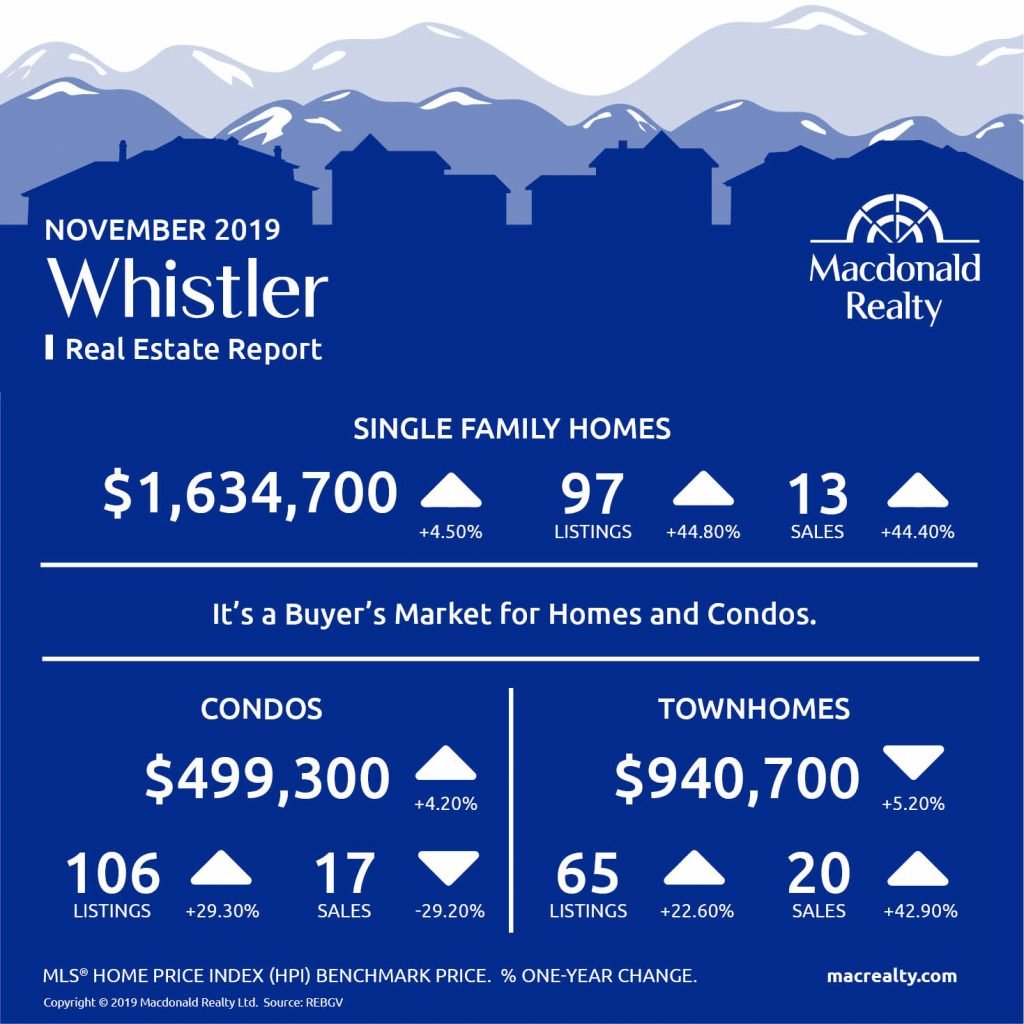
In November 2019, Whistler had 3 sales of detached homes and 93 active listings. The benchmark sale price was $1,629,700.
The condo market had 20 sales and 93 active listings at the end of the month. The benchmark sale price was $493,500.
Townhome sales were 8 sales, active listings were 55. The benchmark sale price was $951,500.
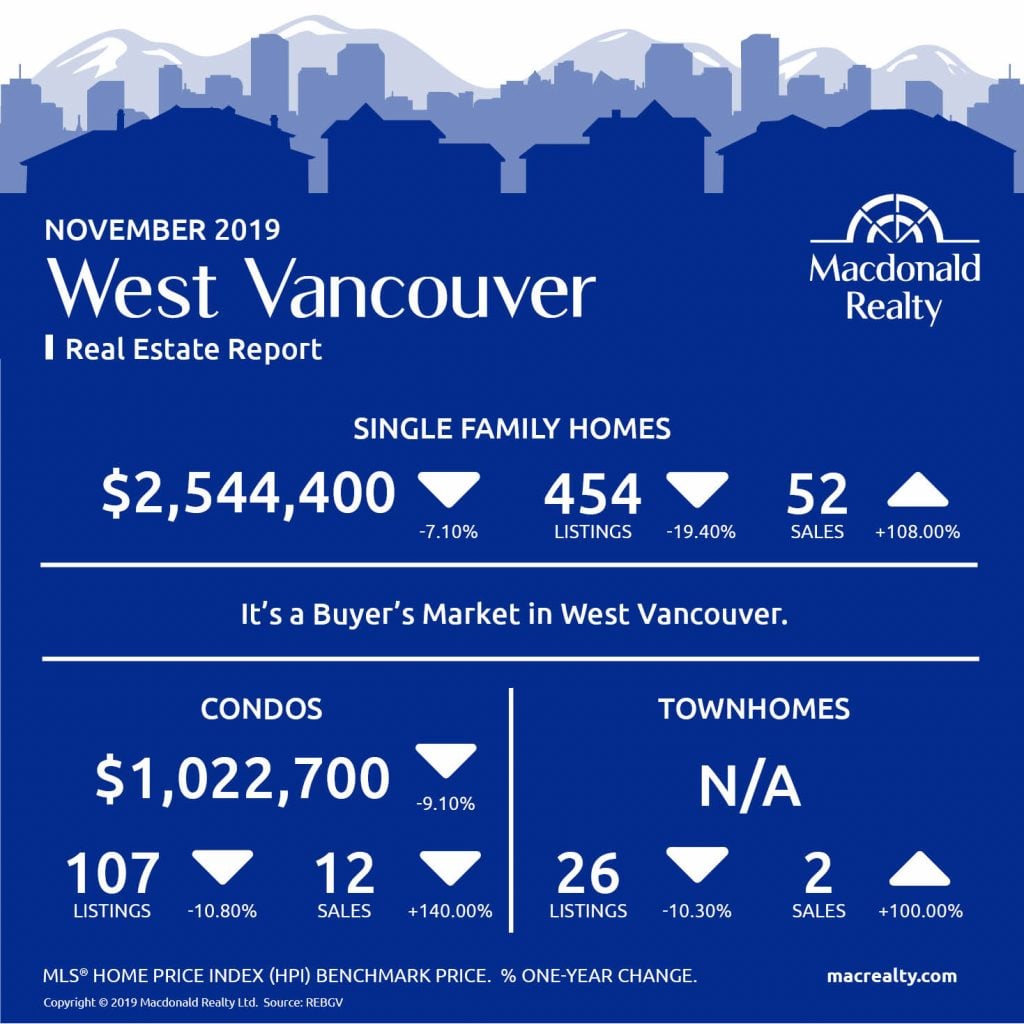
It’s a buyer’s market for homes and townhomes in Whistler.
Squamish
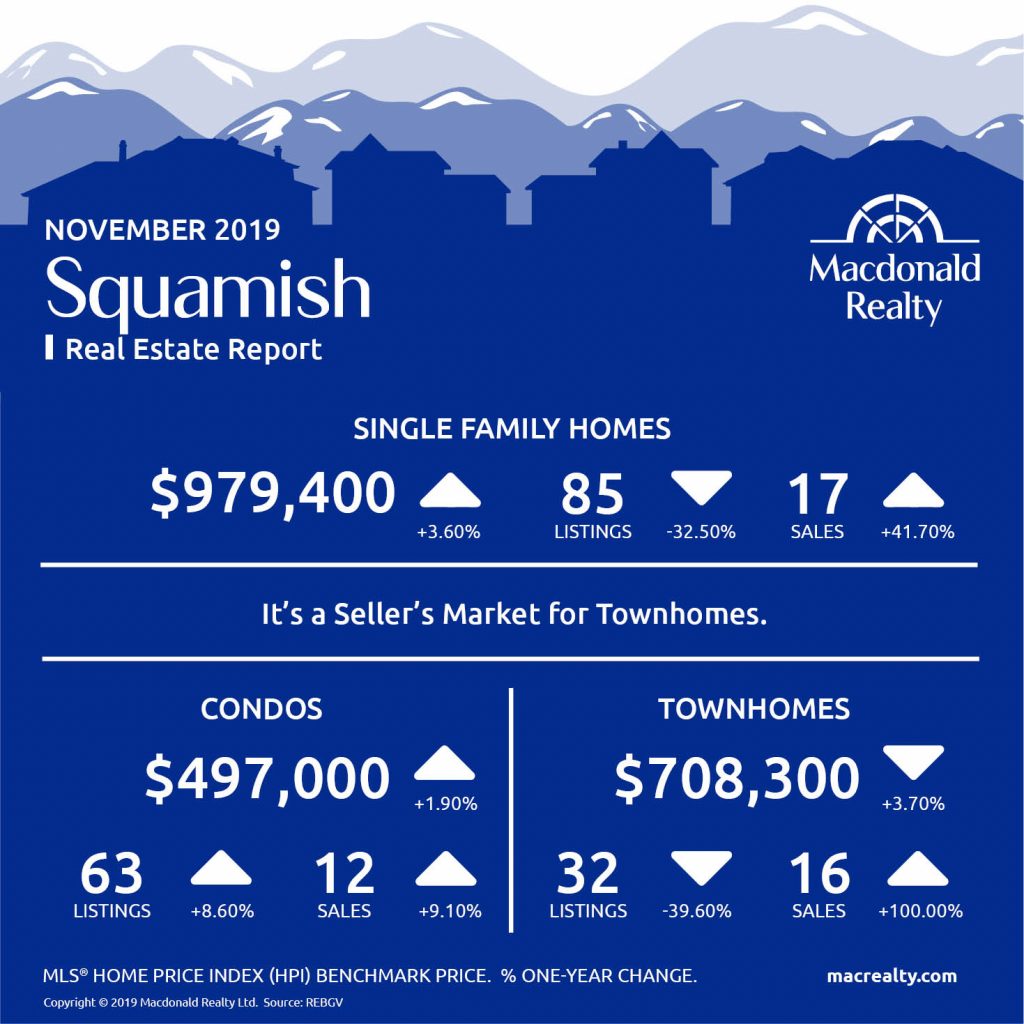
In November 2019, there were 13 sales of detached homes and 66 active listings in Squamish. The benchmark sale price was $977,900.
The condo market had 12 sales and 44 active listings at the end of the month. The benchmark sale price was $486,500.
The townhome market had 9 sales and, the active listings were 15. The benchmark sale price was $732,300.
It’s a seller’s market for condos and townhomes in Squamish.

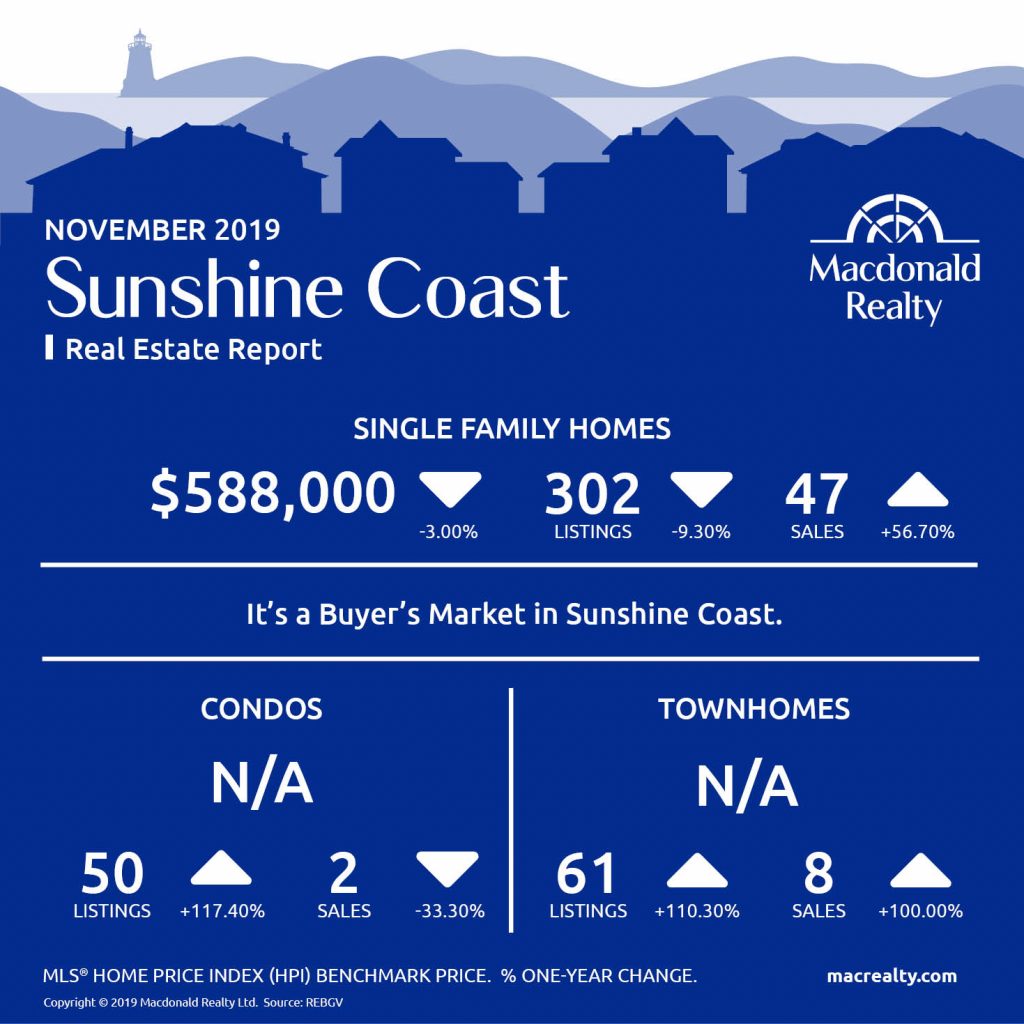
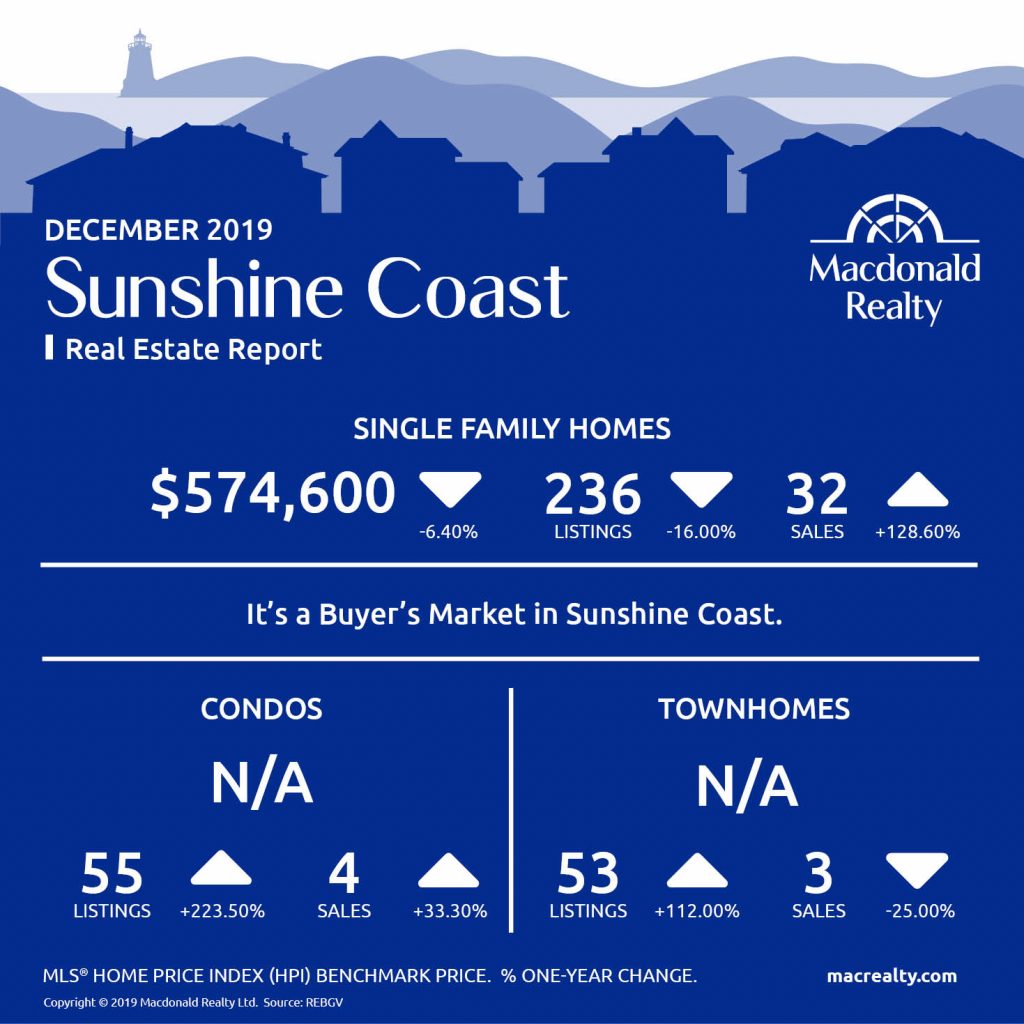
Sunshine Coast
In November 2019, Sunshine Coast had 32 sales of detached homes and 236 active listings. The benchmark sale price was $574,600.
The condo market had 4 sales and 55 active listings at the end of the month.
Townhome sales were 3 sales while active listings were 53.
It’s a buyer’s market in Sunshine Coast.
Looking for more information about the real estate market in specific neighbourhoods in Squamish, Whistler, and Sunshine Coast?
Macdonald Realty has offices in Squamish, Whistler, and Sunshine Coast. Please email [email protected] or call 1-877-278-3888 to be matched with a REALTOR® working in your area.
MLS® Home Price Index (HPI) Benchmark Price
Average and median home prices are often misinterpreted, are affected by change in the mix of homes sold, and can swing dramatically from month to month (based on the types and prices of properties that sold in a given month). The MLS® HPI overcomes these shortcomings and uses the concept of a benchmark home, a notional home with common attributes of typical homes in a defined area. Visit www.housepriceindex.ca for more information.
This blog post is based on market data provided by the Real Estate Board of Greater Vancouver (REBGV) www.rebgv.org