North Delta, Surrey, Langley and Fraser Valley Real Estate Market Statistics – October 2019
Here are the latest real estate market statistics from Macdonald Realty on Abbotsford, Cloverdale, Langley, Mission, North Delta, North Surrey, Surrey Central, White Rock/South Surrey listings and sales in October 2019.
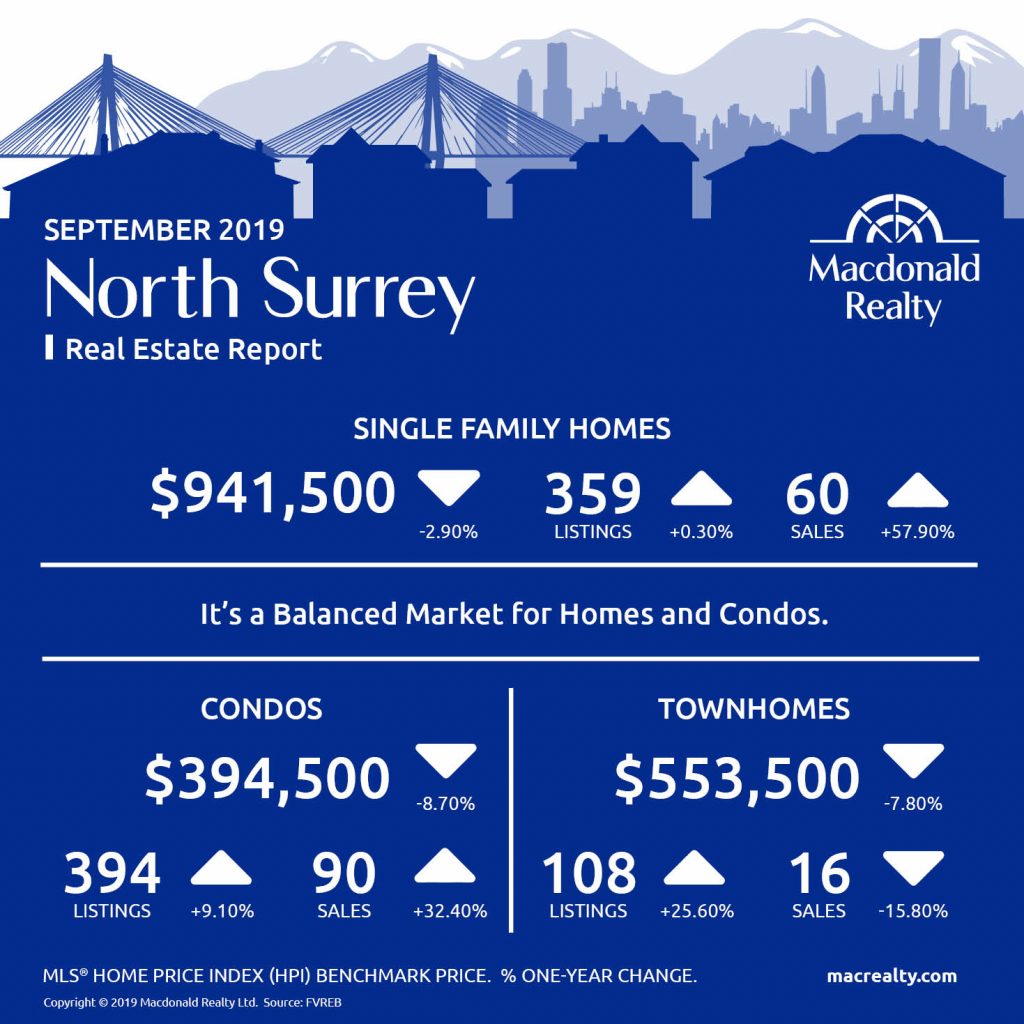
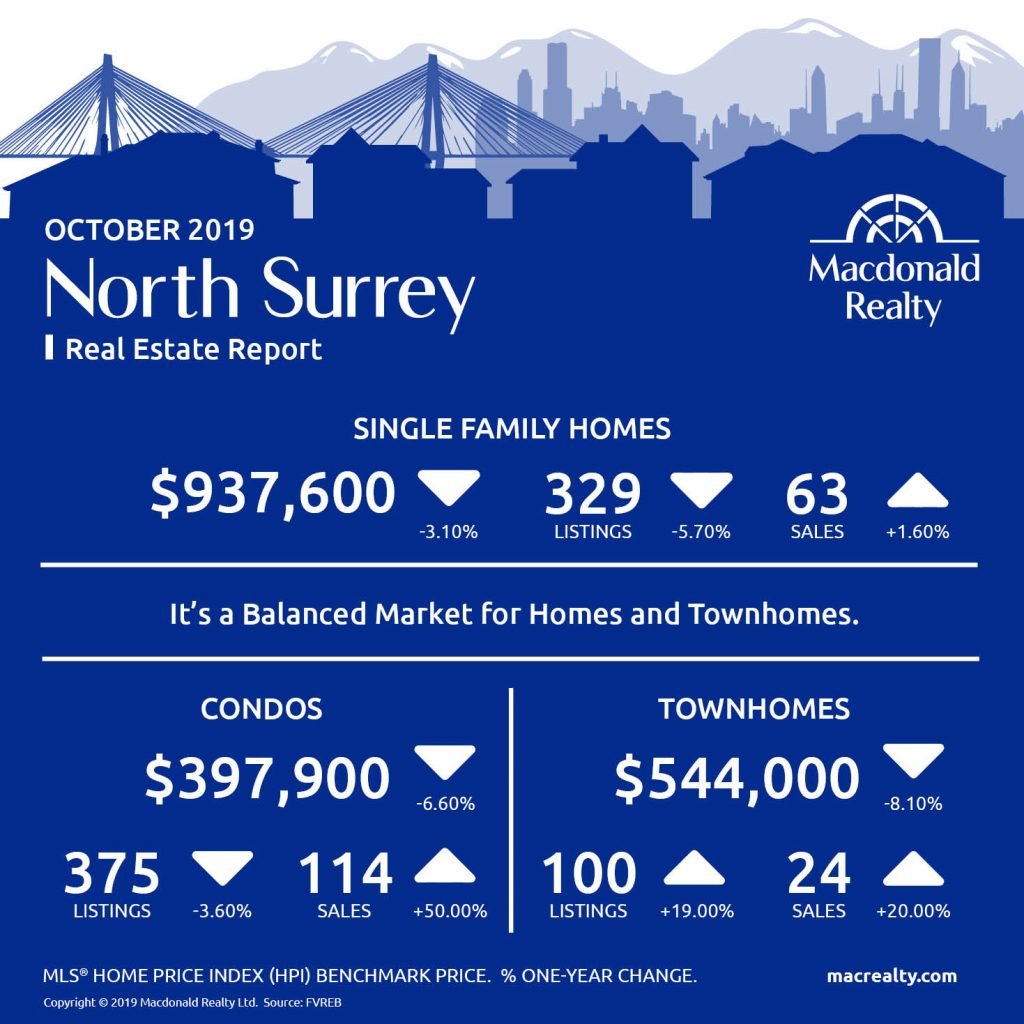
North Surrey
In the North Surrey market, there were 63 sales of detached homes and 329 active listings at the end of the month. The benchmark sale price was $937,600.
In comparison, the condo market had 114 sales, 375 active listings, and the benchmark sale price was $397,900.
Townhome market featured 40 sales, 200 active listings and a $382,100 benchmark sale price.
It’s a balanced market for homes and townhomes in North Surrey.
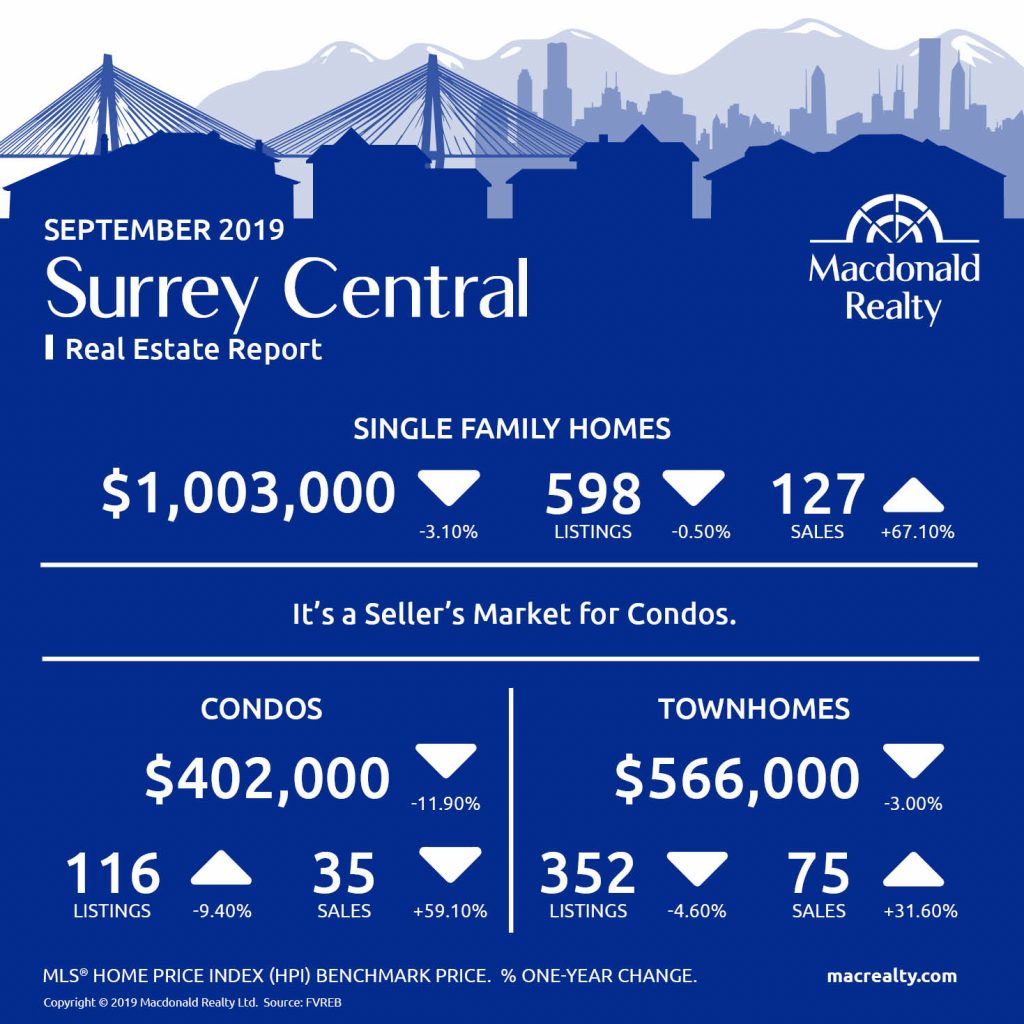
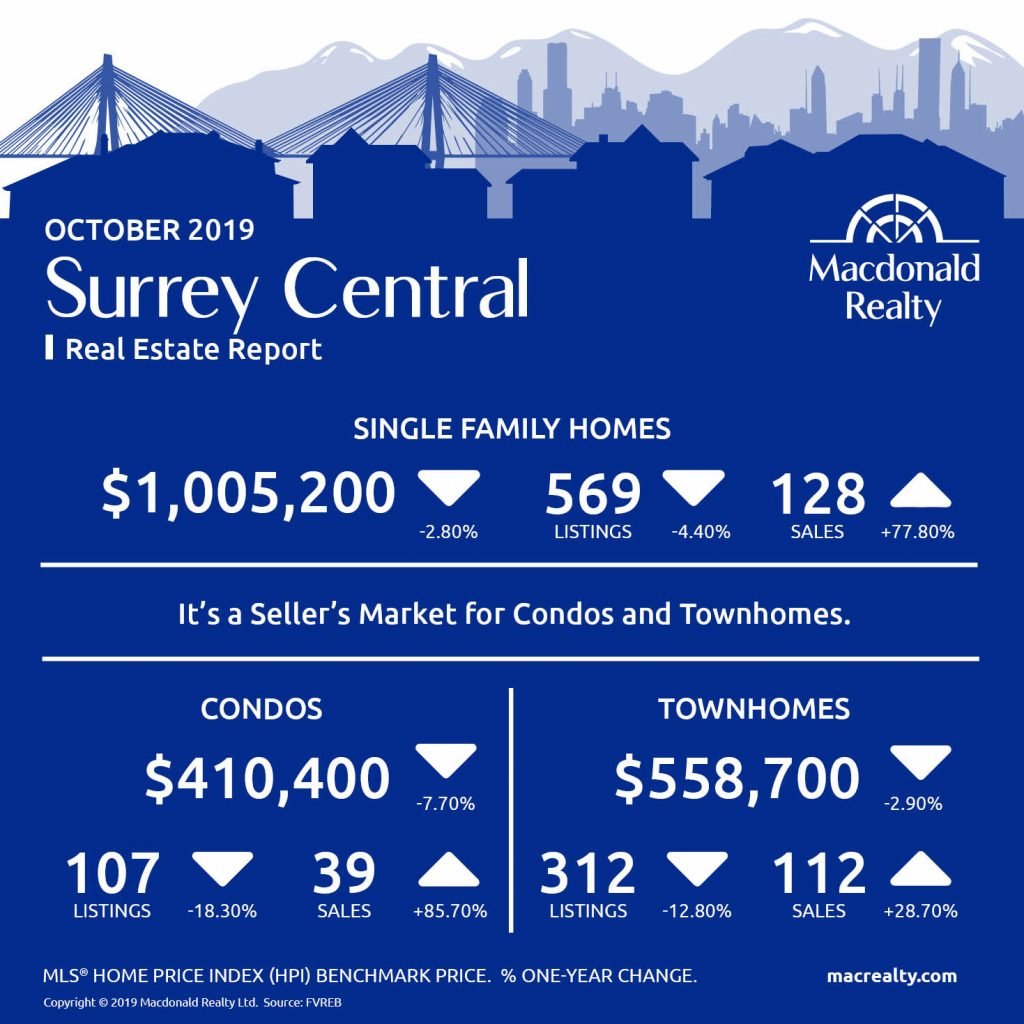
Surrey Central
In the Surrey Central market, the benchmark sale price was $1,005,200 for detached homes. At the end of the month, there were 569 active listings and 128 sales.
The condo market had 39 sales and 107 active listings. The benchmark sale price was $410,400.
Townhomes featured 112 sales, 312 active listings and a $558,700 benchmark sale price.
It’s a seller’s market for condos and townhomes in Surrey Central.
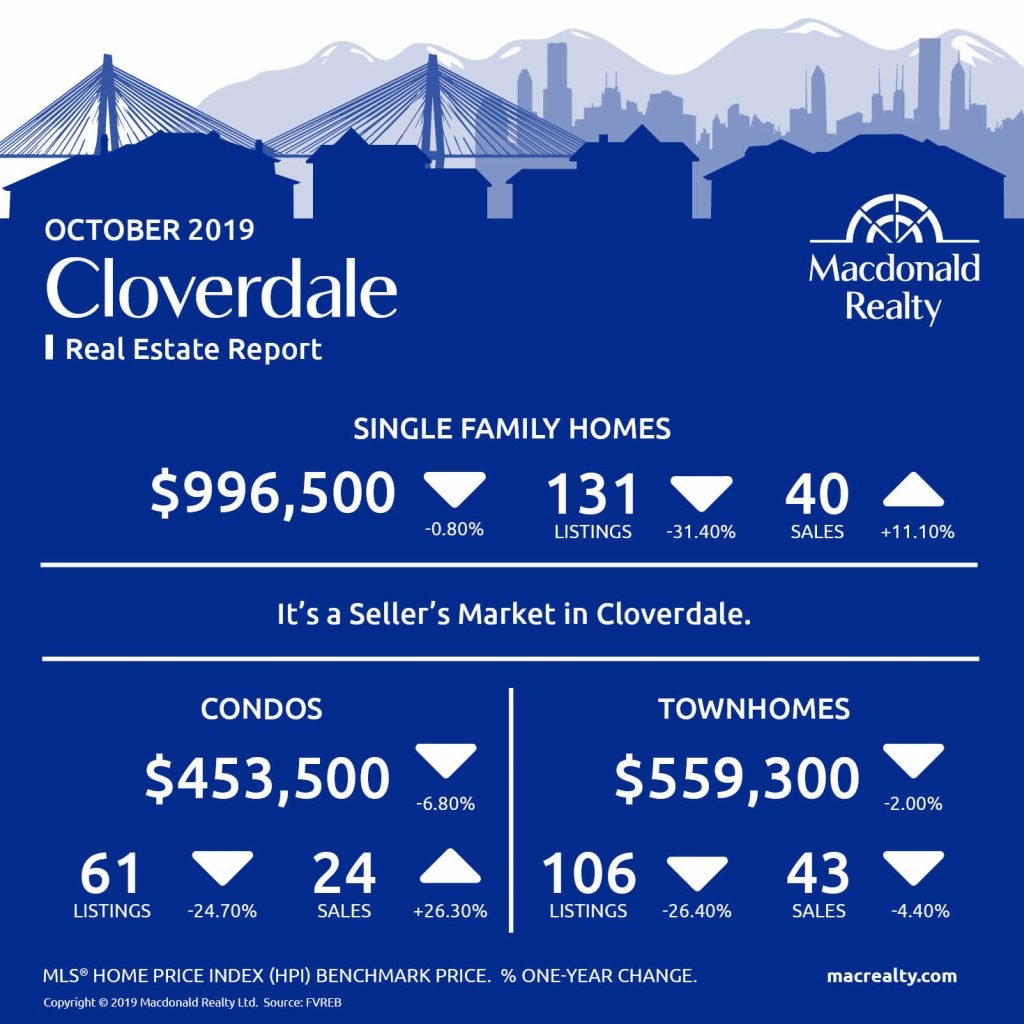
Cloverdale
There were 40 sales, 131 active listings, and a $996,500 benchmark sale price for detached homes in the Cloverdale market.
The condo market featured 24 sales, 61 active listings and a benchmark sale price of $453,500 at the end of the month.
In comparison, townhome sales were 43, active listings were 106 and the benchmark sale price was $559,300.
It’s a seller’s market in Cloverdale.
White Rock/South Surrey
In the White Rock/South Surrey market, the benchmark sale price was $1,318,300 for detached homes. At the end of the month, there were 560 active listings and 73 sales.
The condo market had 62 sales and 291 active listings. The benchmark sale price was $474,800.
Townhomes featured 69 sales, 252 active listings and a $640,300 benchmark sale price.
It’s a buyer’s market for homes in White Rock/South Surrey.

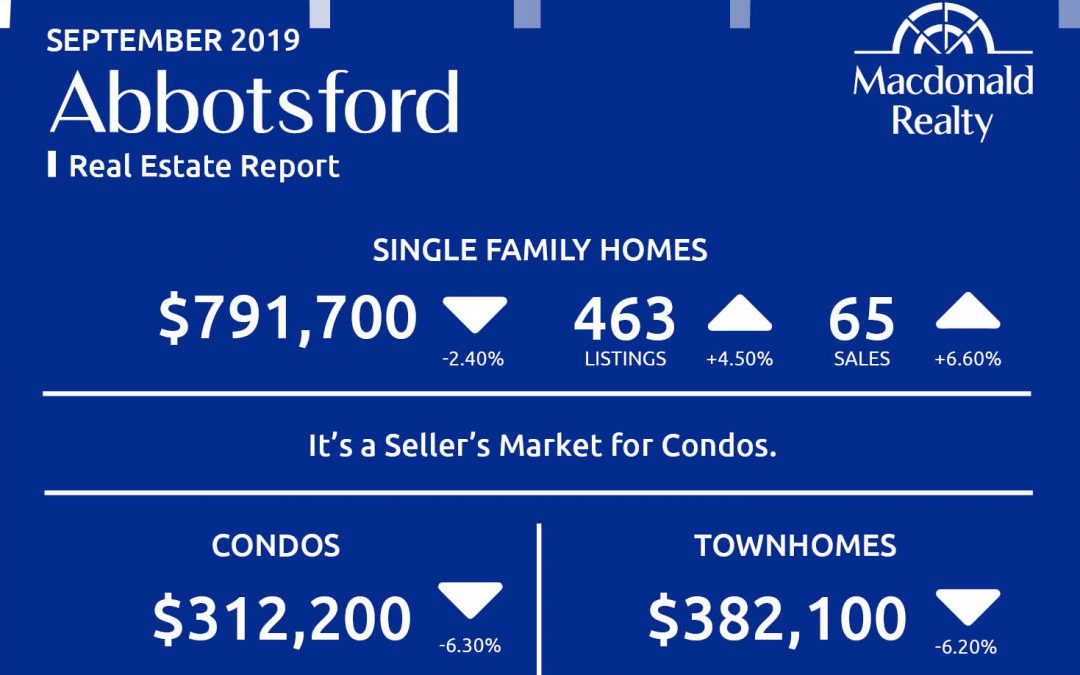
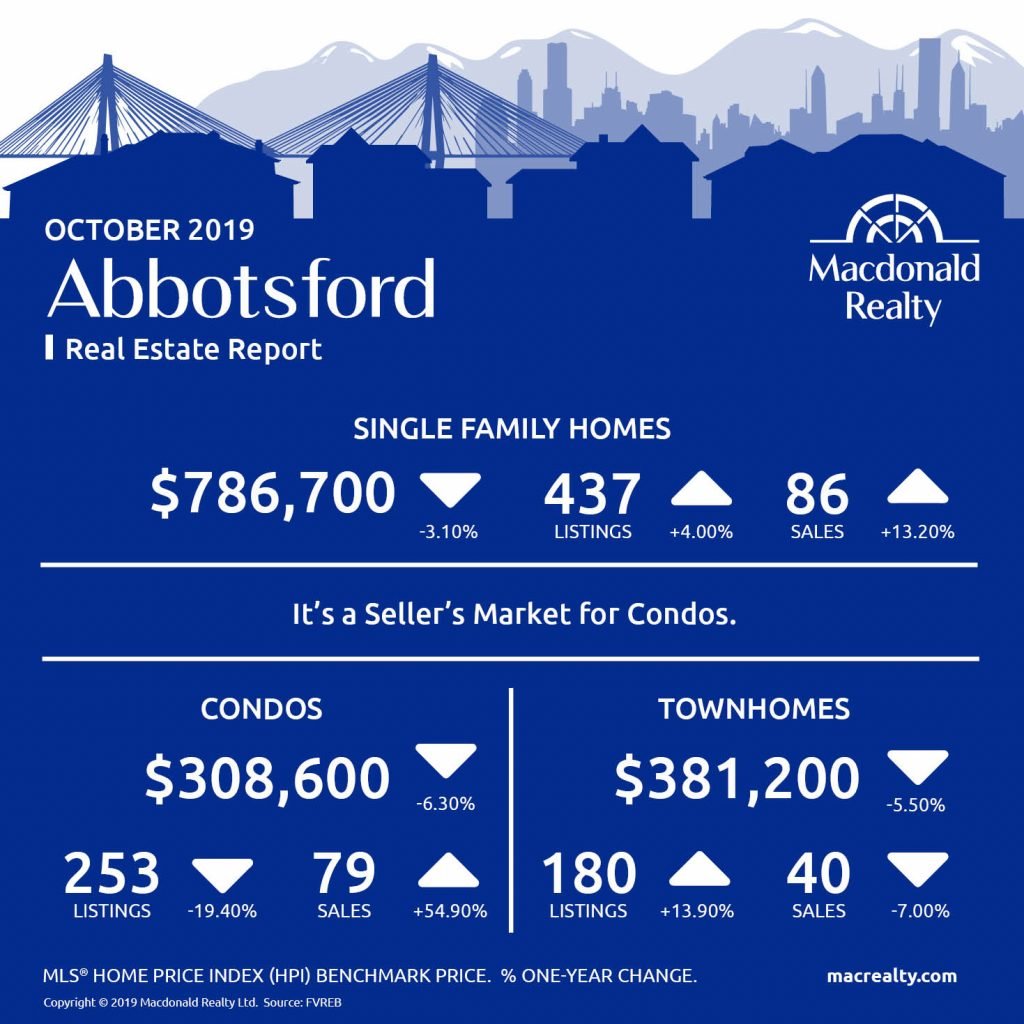
Abbotsford
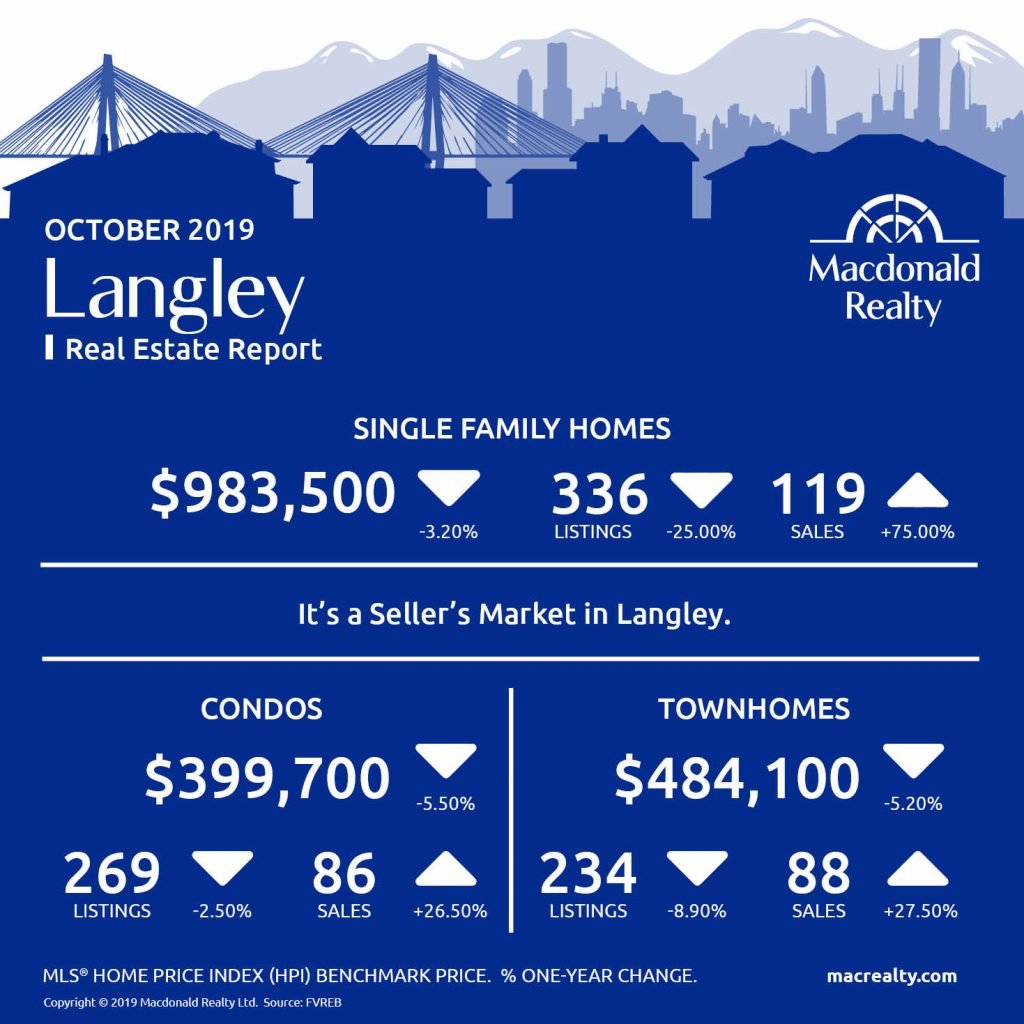
Langley
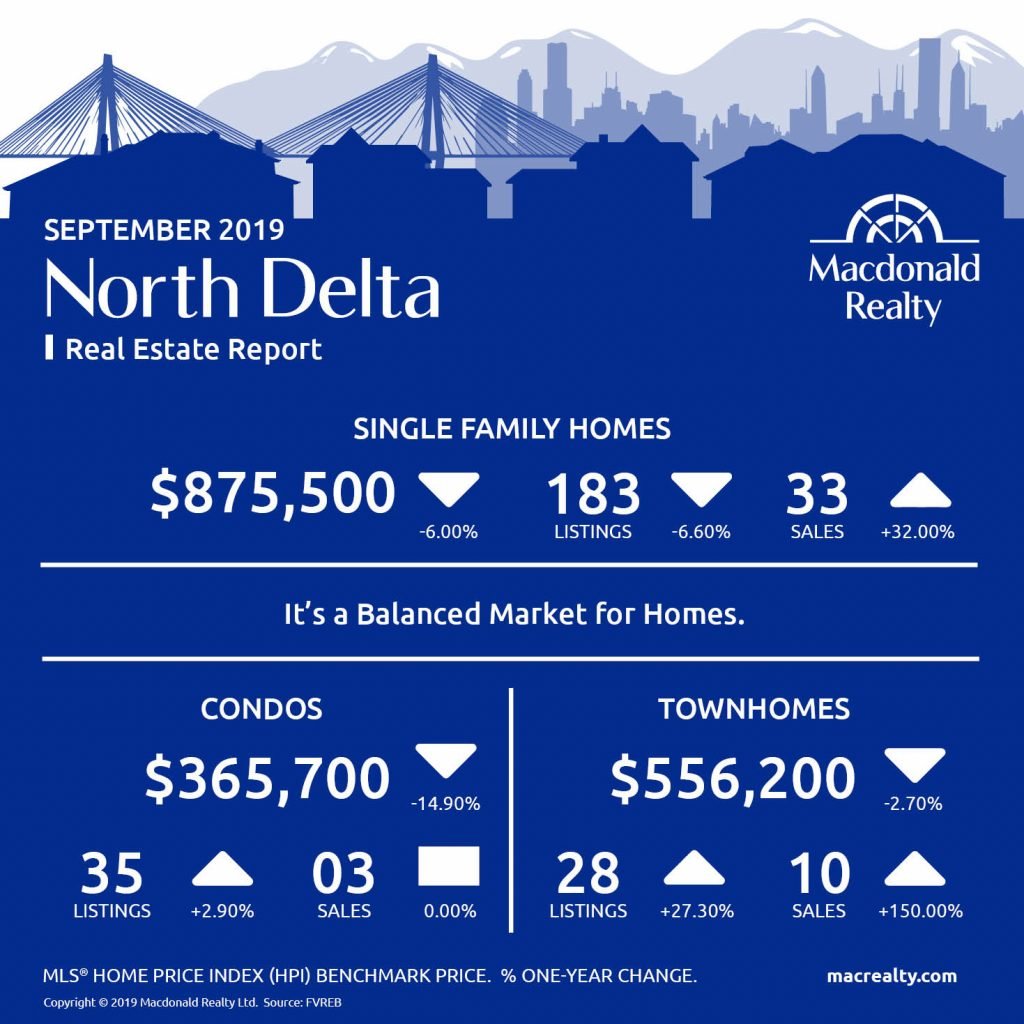
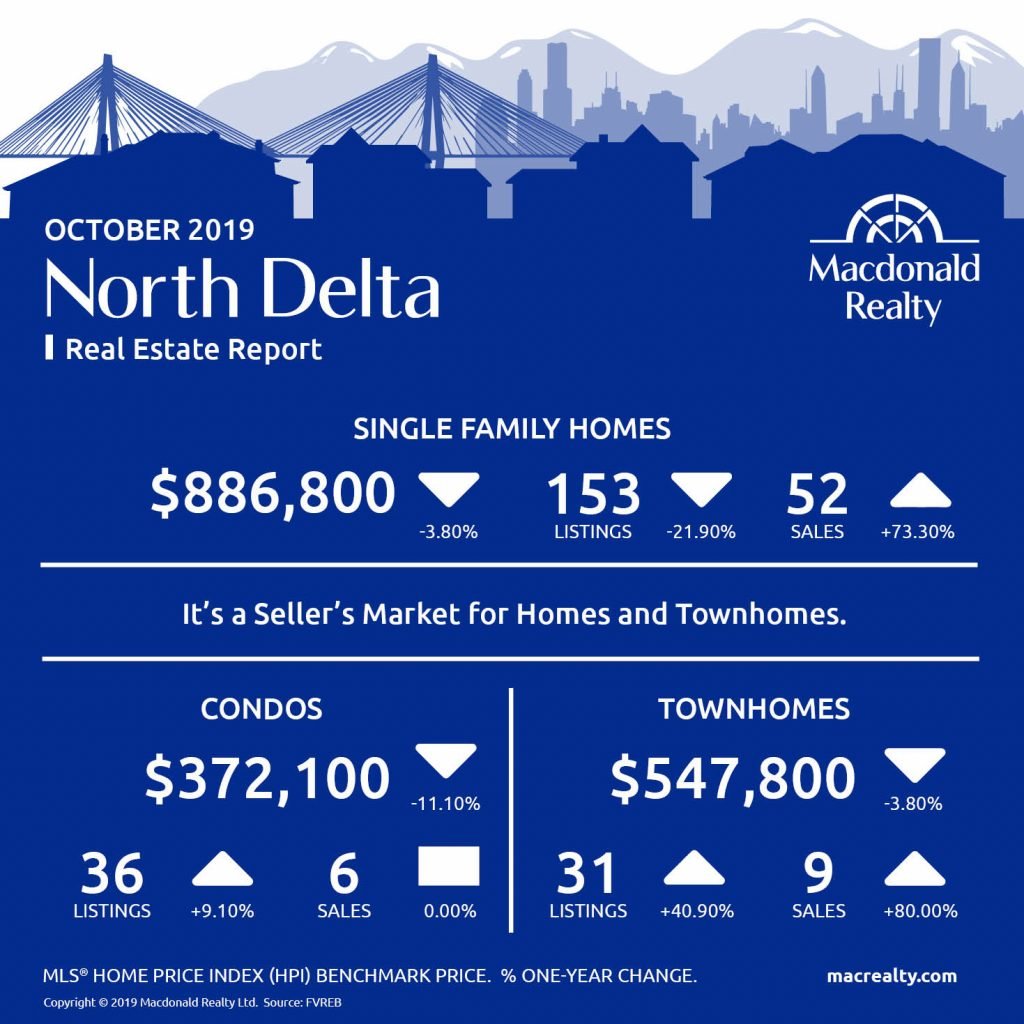
North Delta
Mission

Looking for more information about the real estate market in specific neighbourhoods in Surrey, Langley and Fraser Valley?
Macdonald Realty has offices in North Delta, White Rock/South Surrey, and Langley. Please email [email protected] or call 1-877-278-3888 to be matched with a REALTOR® working in your area.
MLS® Home Price Index (HPI) Benchmark Price
Average and median home prices are often misinterpreted, are affected by change in the mix of homes sold, and can swing dramatically from month to month (based on the types and prices of properties that sold in a given month). The MLS® HPI overcomes these shortcomings and uses the concept of a benchmark home, a notional home with common attributes of typical homes in a defined area. Visit www.housepriceindex.ca for more information.
This blog post is based on market data provided by the Fraser Valley Real Estate Board (FVREB) www.fvreb.bc.ca