Greater Victoria, Parksville and Nanaimo Real Estate Market Statistics – November 2019
Here are the latest real estate market statistics from Macdonald Realty on Greater Victoria, Parksville/Qualicum, and Nanaimo listings and sales in November 2019.
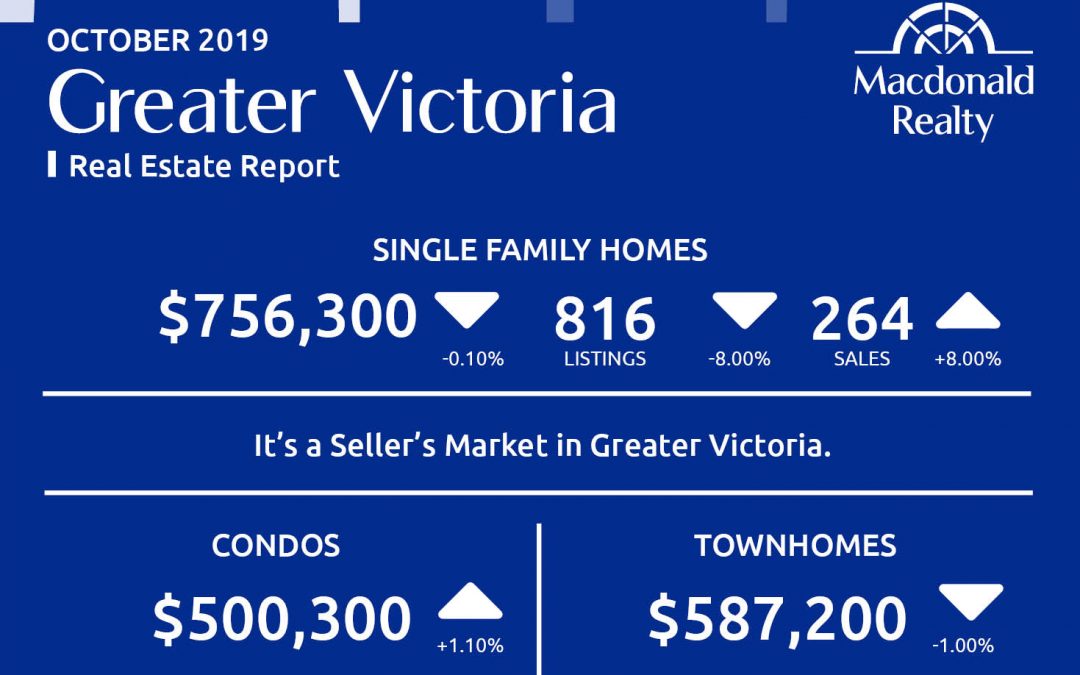
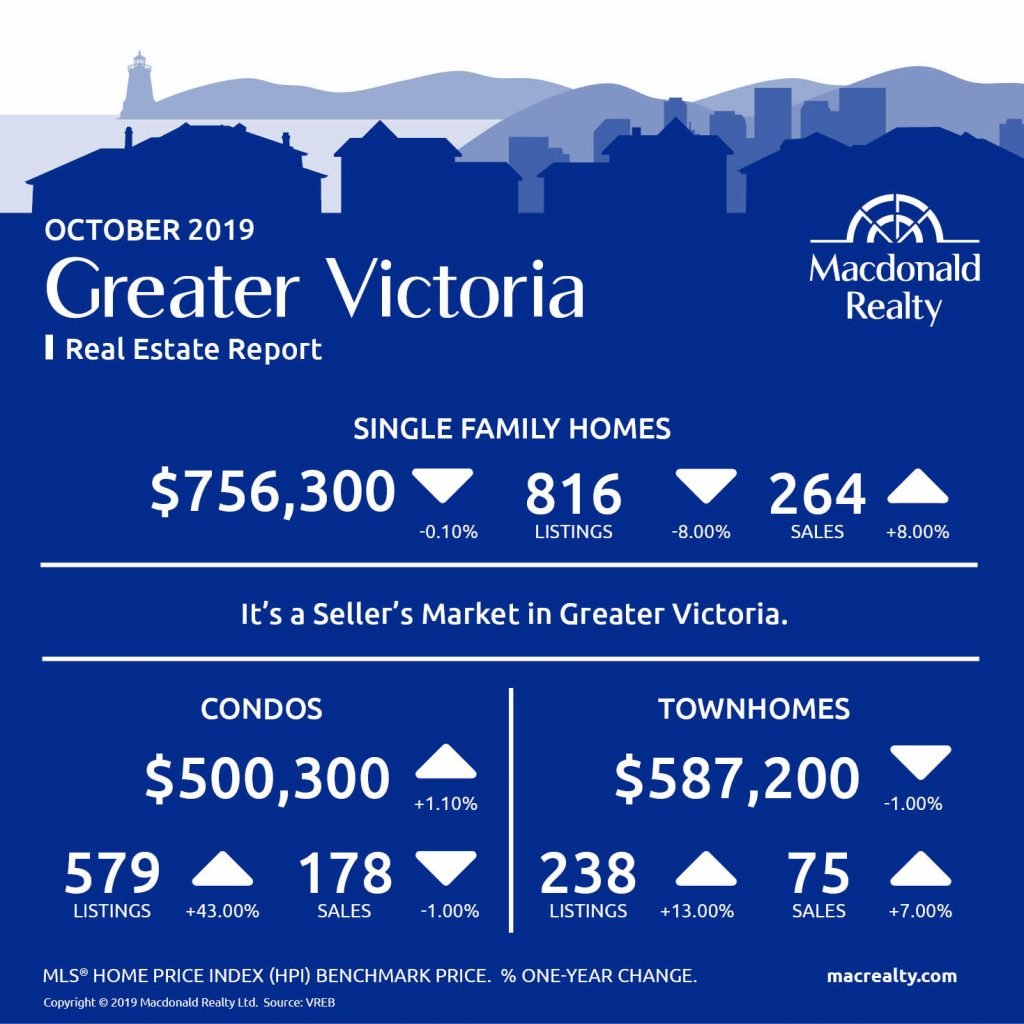
Greater Victoria
As released in the Victoria Real Estate Board report, the President of the Board Cheryl Woolley talks about the low inventory and strong demand for low to mid-priced properties in the area, which is pushing pricing up on condos and single-family homes that fall within that segment. She explains that it is a challenging time for those shopping for properties in this price range as they can often find themselves in a competing offer situation.
“The market this year is behaving as we’d expected, in the wake of tighter mortgage requirements and after the rapid pace of price increases, we saw two years ago,” adds Woolley. “Appropriate pricing and awareness of market trends are essential right now if you want to buy or sell a home in our area. That is why it is important to have a Realtor guide you through the process. It’s worth getting this professional help, for what likely will be the biggest purchase or sale of your lifetime.”
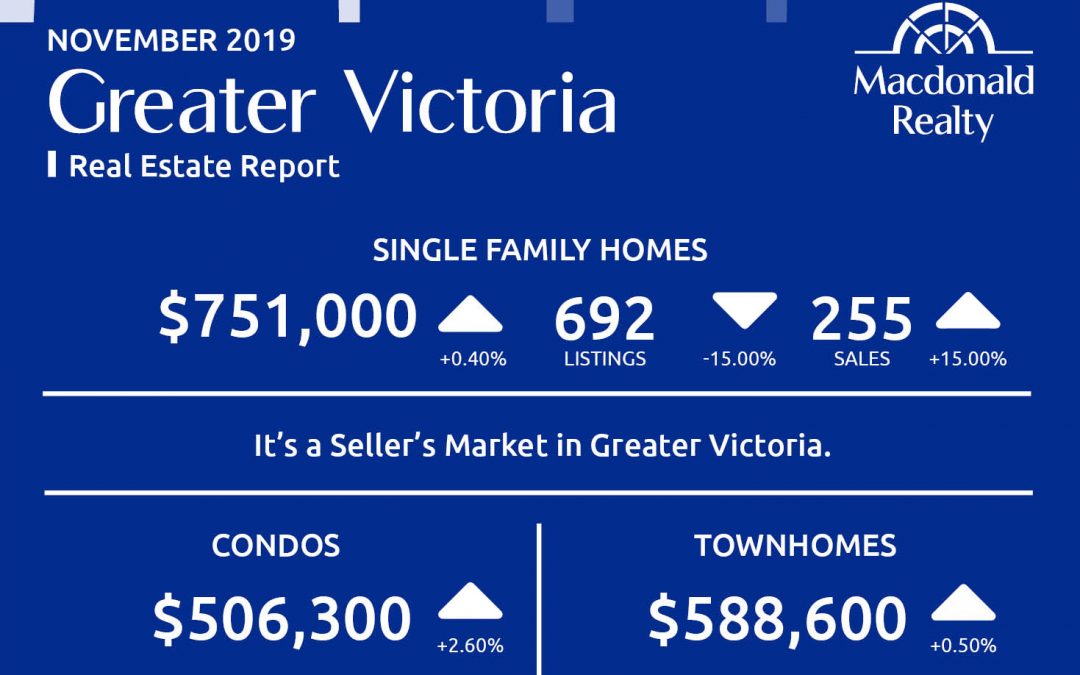
In November 2019, there were 692 sales of single-family homes and 255 active listings in Greater Victoria. The benchmark sale price was $751,000.
In comparison, the Condo market had 161 sales and 553 active listings at the end of the month. The benchmark sale price was $506,300.
Townhome sales were 74, active listings were 194 and the benchmark sale price was $588,600.
It’s a seller’s market in Greater Victoria.

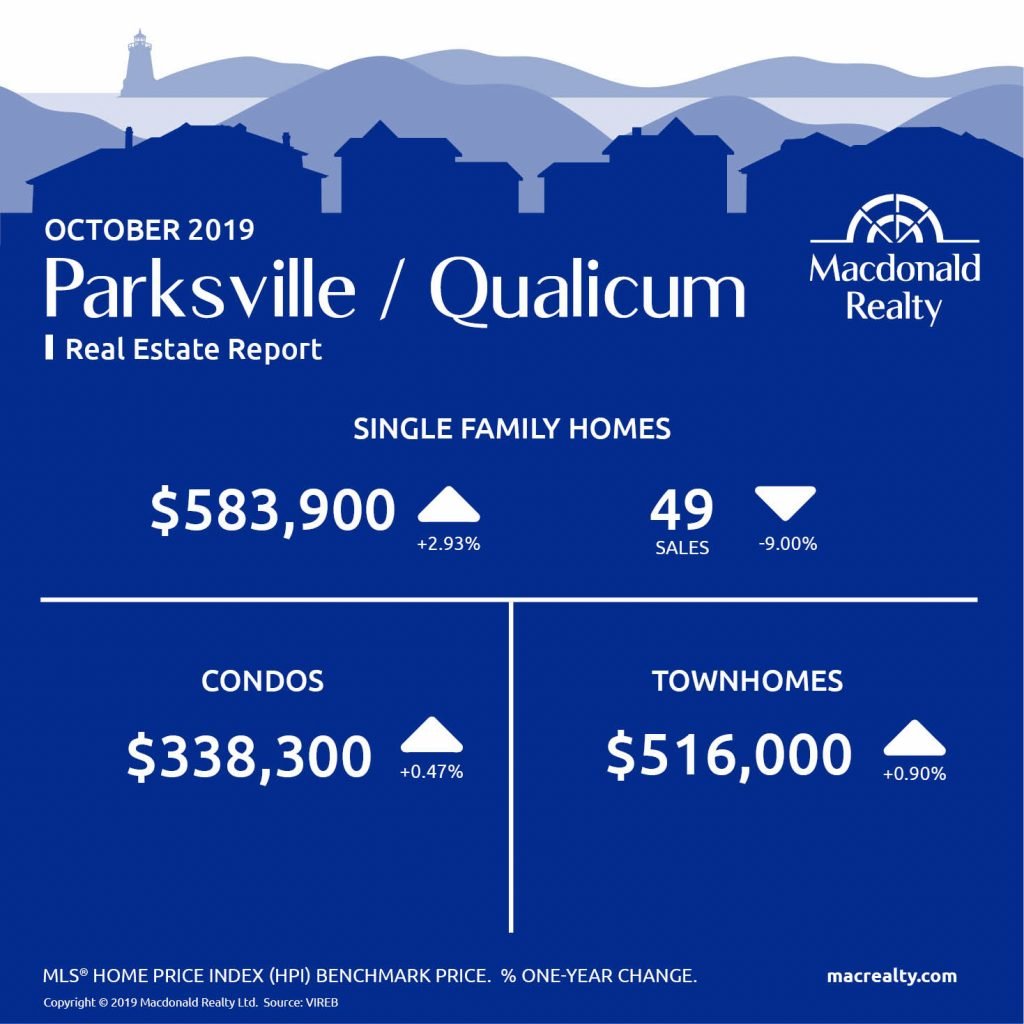
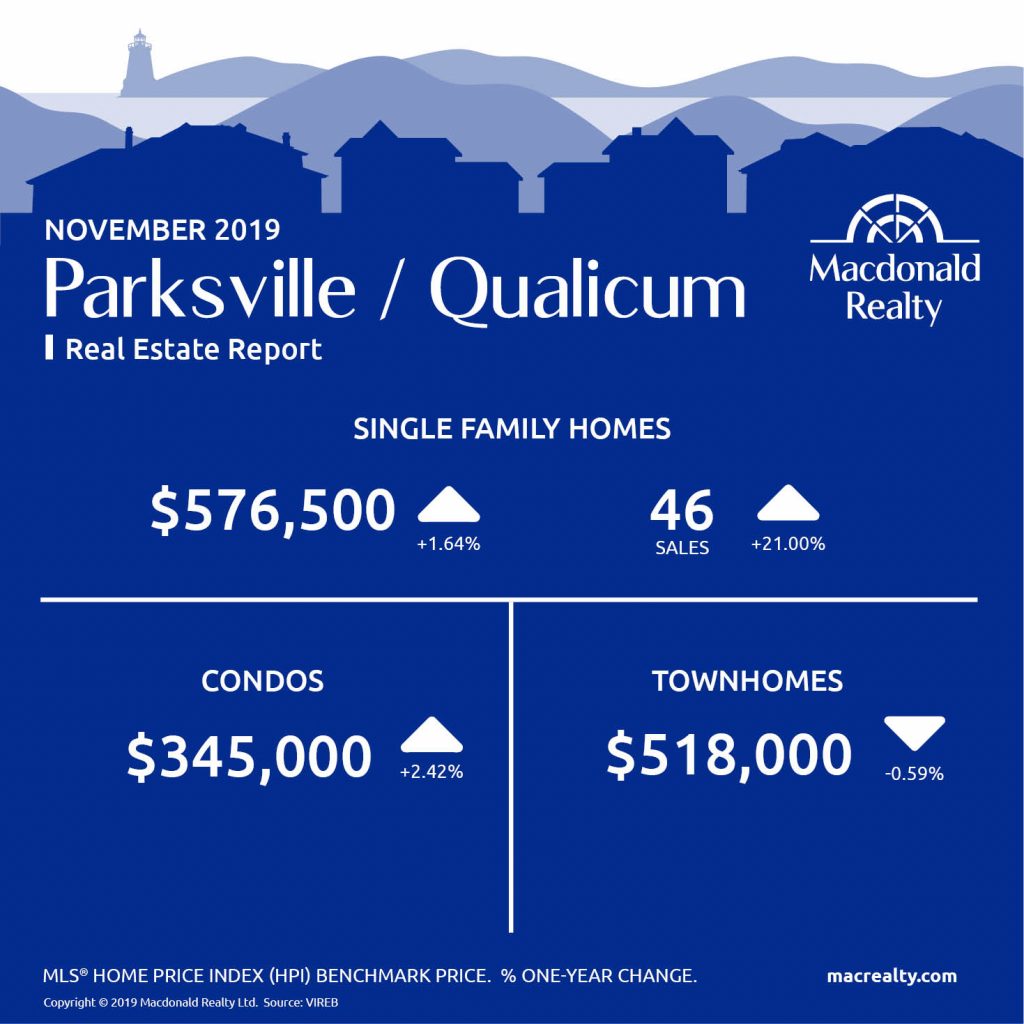
Parksville / Qualicum
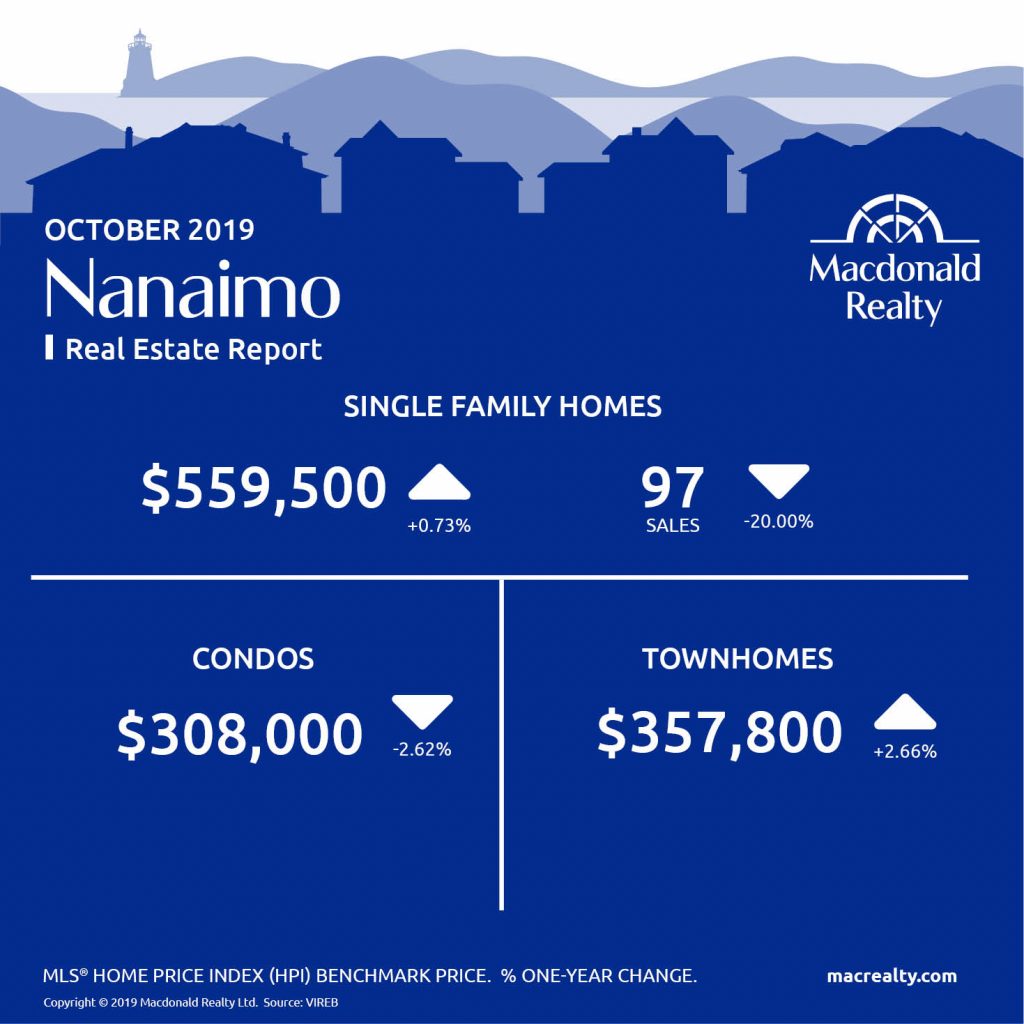
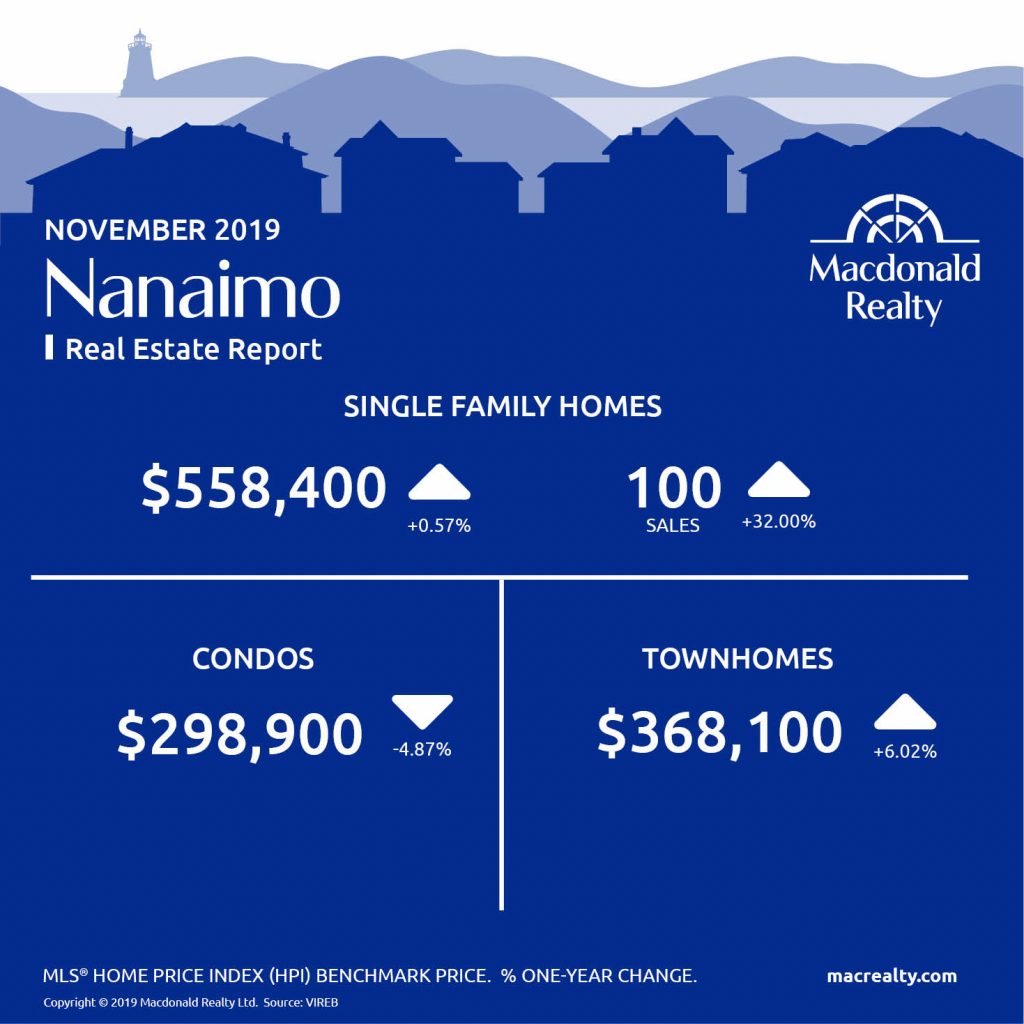
Nanaimo
Looking for more information about the real estate market in specific neighbourhoods in Victoria, Parksville, Nanaimo, Vancouver Island and the Gulf Islands?
Macdonald Realty has offices in downtown Victoria, Sidney, Parksville and on Salt Spring Island. Please email [email protected] or call 1-877-278-3888 to be matched with a REALTOR® working in your area.
MLS® Home Price Index (HPI) Benchmark Price
Average and median home prices are often misinterpreted, are affected by change in the mix of homes sold, and can swing dramatically from month to month (based on the types and prices of properties that sold in a given month). The MLS® HPI overcomes these shortcomings and uses the concept of a benchmark home, a notional home with common attributes of typical homes in a defined area. Visit www.housepriceindex.ca for more information.
This blog post is based on market data provided by the Victoria Real Estate Board (VREB) www.vreb.org and the Vancouver Island Real Estate Board (VIREB) www.vireb.com. Market data from the VIREB includes listings and sales in Campbell River, Comox Valley, Cowichan Valley Nanaimo, Parksville/Qualicum, Port Alberni/West, North Island, and the Islands.