by Macrealty Marketing Team | Apr 6, 2023 | Market Updates
Here are the latest real estate market statistics from Macdonald Realty on the Greater Vancouver listings and sales in March 2023. Find all the infographics by visiting the Facebook Album.
Home prices across Metro Vancouver’s housing market showed modest increases in March, while new listings remained below long-term historical averages.
March data also indicates home sales are making a stronger than expected spring showing so far, despite elevated borrowing costs.
The Real Estate Board of Greater Vancouver (REBGV) reports that residential home sales in the region totalled 2,5352 in March 2023, a 42.5 per cent decrease from the 4,405 sales recorded in March 2022, and 28.4 per cent below the 10-year seasonal average (3,540).
The MLS® Home Price Index composite benchmark price for all residential properties in Metro Vancouver is currently $1,143,900. This represents a 9.5 per cent decrease over March 2022 and a 1.8 per cent increase compared to February 2023.
“On the pricing side, the spring market is already on track to outpace our 2023 forecast, which anticipated modest price increases of about one to two per cent across all product types,” Andrew Lis, REBGV’s director of economics and data analytics said. “The surprising part of this recent activity is that these price increases are occurring against a backdrop of elevated borrowing costs, below-average sales, and new listing activity that continues to suggest that sellers are awaiting more favorable market conditions.”
There were 4,317 detached, attached and apartment properties newly listed for sale on the Multiple Listing Service® (MLS®) in Metro Vancouver in March 2023. This represents a 35.5 per cent decrease compared to the 6,690 homes listed in March 2022, and was 22.3 per cent below the 10-year seasonal average (5,553).
The total number of homes currently listed for sale on the MLS® system in Metro Vancouver is 8,617, an 8.1 per cent increase compared to March 2022 (7,970), and 17.3 per cent below the 10-year seasonal average (10,421).
Across all detached, attached and apartment property types, the sales-to-active listings ratio for March 2023 is 30.7 per cent. By property type, the ratio is 23.3 per cent for detached homes, 36.7 per cent for townhomes, and 34.9 per cent for apartments.
Analysis of historical data suggests downward pressure on home prices occurs when the ratio dips below 12 per cent for a sustained period, while home prices often experience upward pressure when it surpasses 20 per cent over several months.
“If home sellers remain on the sidelines, monthly MLS® sales figures will continue to appear lower than historical averages as we move toward summer,” Lis said. “But it’s important to recognize the chicken-and-egg nature of these statistics. The number of sales in any given month is partially determined by the number of homes that come to market that month, along with the inventory of unsold homes listed in previous months. With fewer homes coming on the market, homes sales will remain lower than we’re accustomed to seeing at this point in the year, almost entirely by definition.”
*Areas covered by the Real Estate Board of Greater Vancouver include Burnaby, Coquitlam, Maple Ridge, New Westminster, North Vancouver, Pitt Meadows, Port Coquitlam, Port Moody, Richmond, South Delta, Squamish, Sunshine Coast, Vancouver, West Vancouver, and Whistler. Check out the infographics of Squamish, Sunshine Coast and Whistler, HERE.
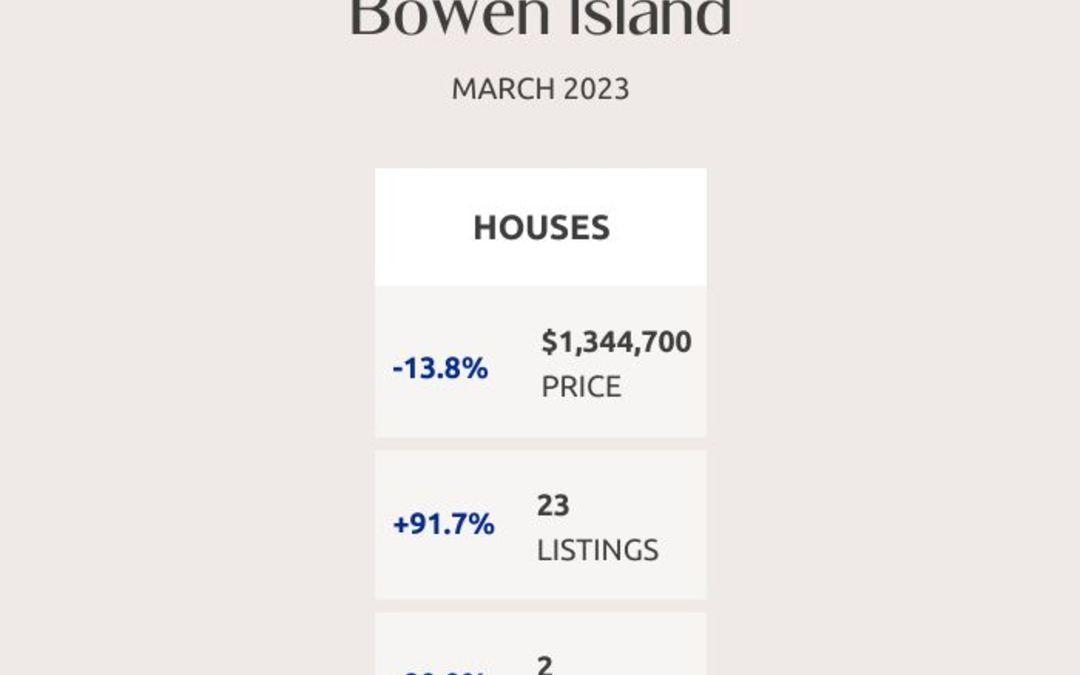
Bowen Island

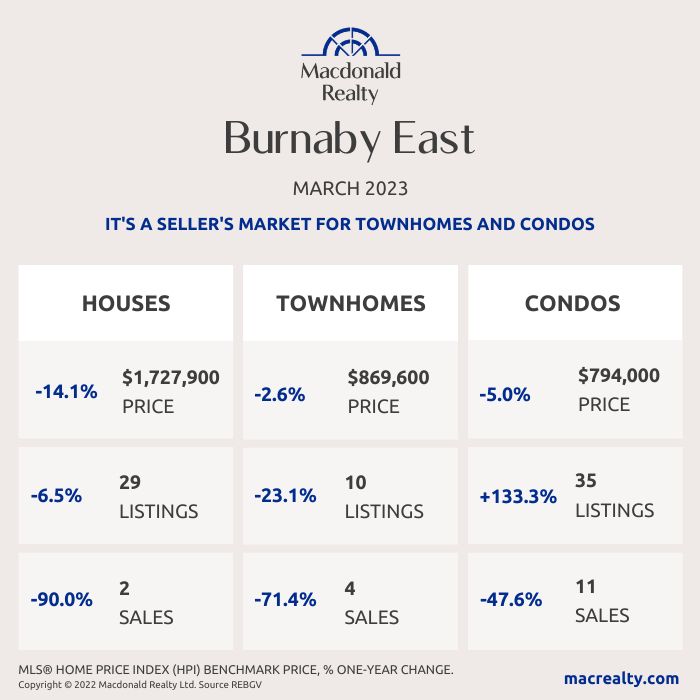
Burnaby East
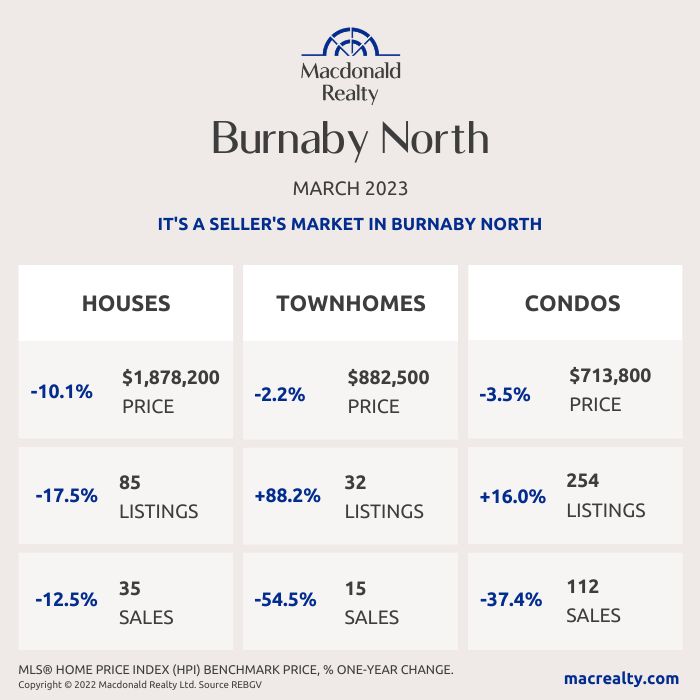
Burnaby North
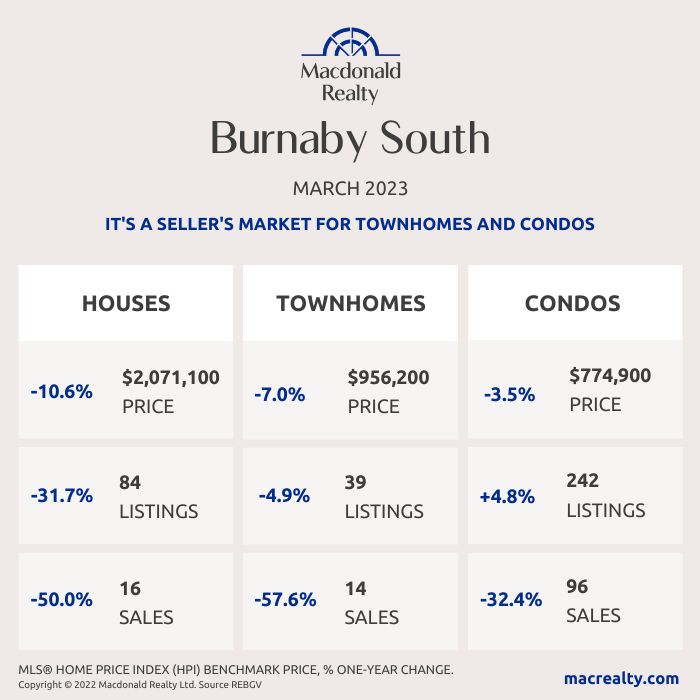
Burnaby South
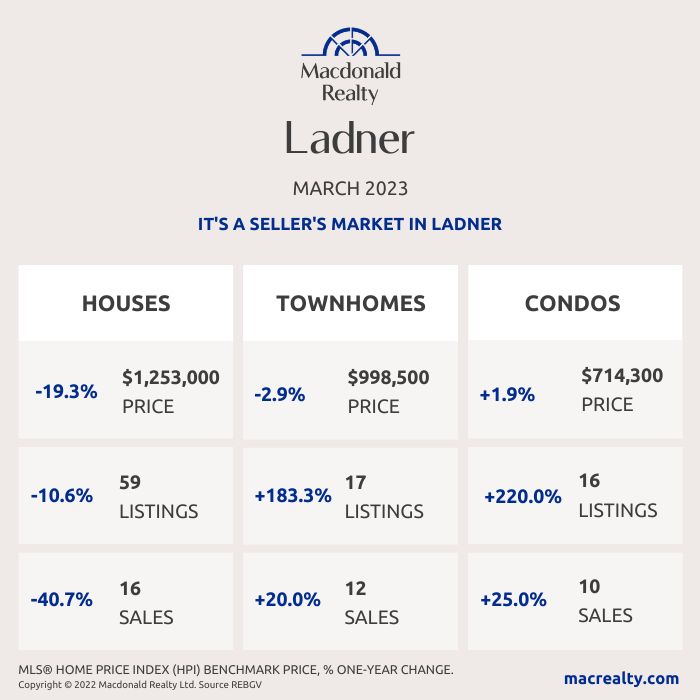
Ladner
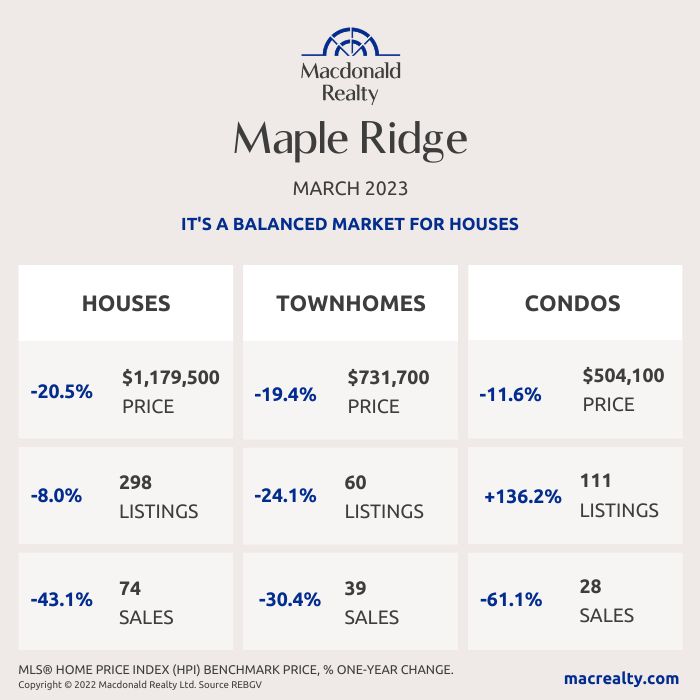
Maple Ridge
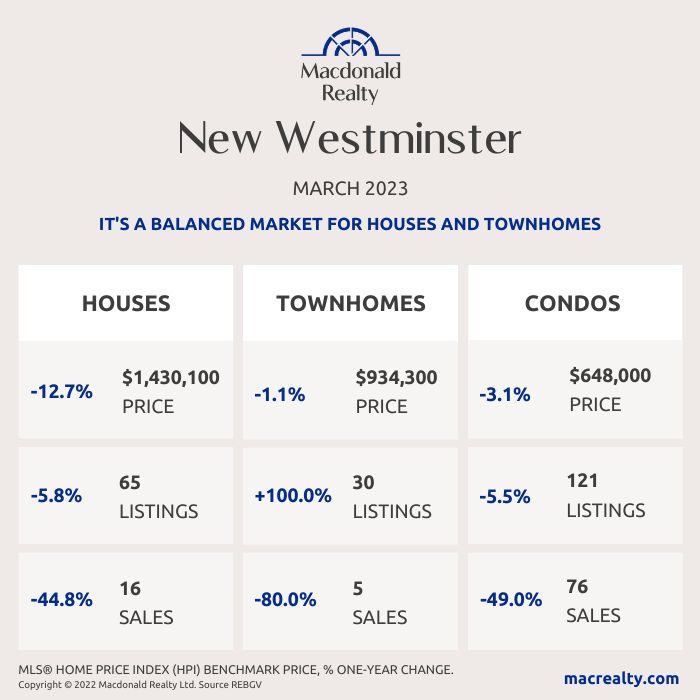
New Westminster
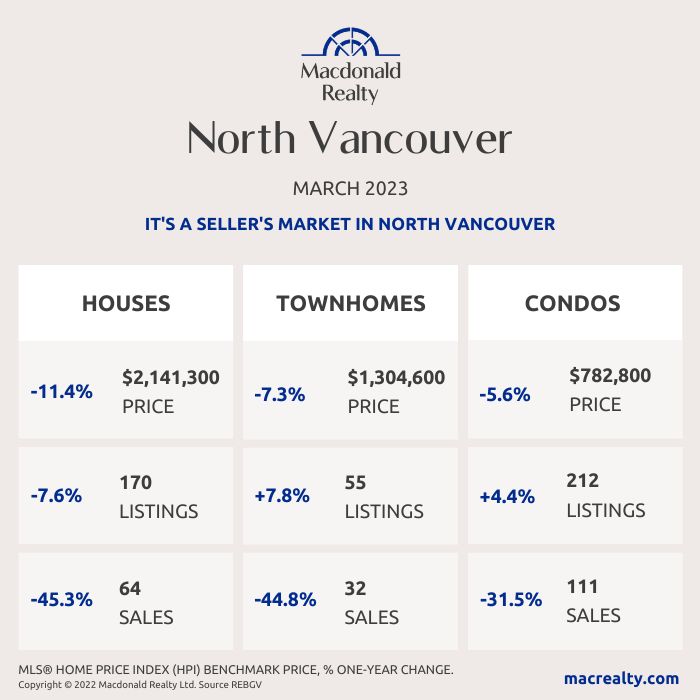
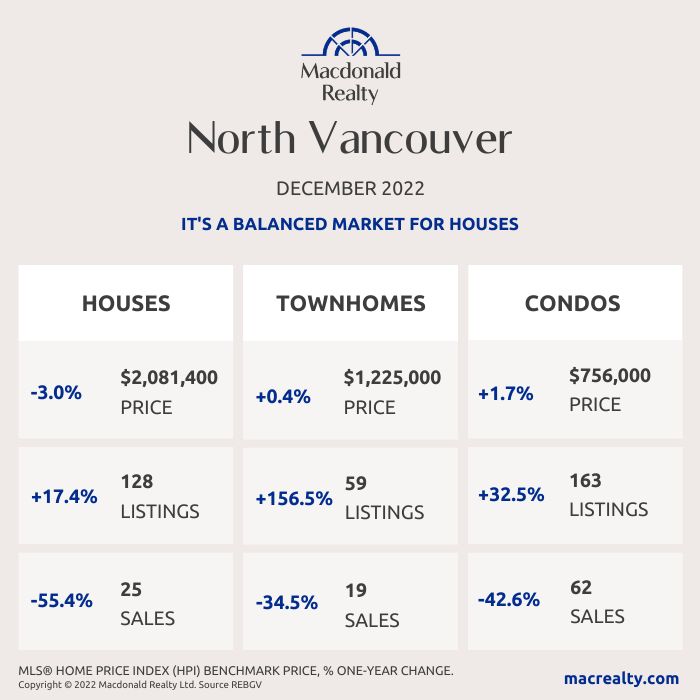
North Vancouver
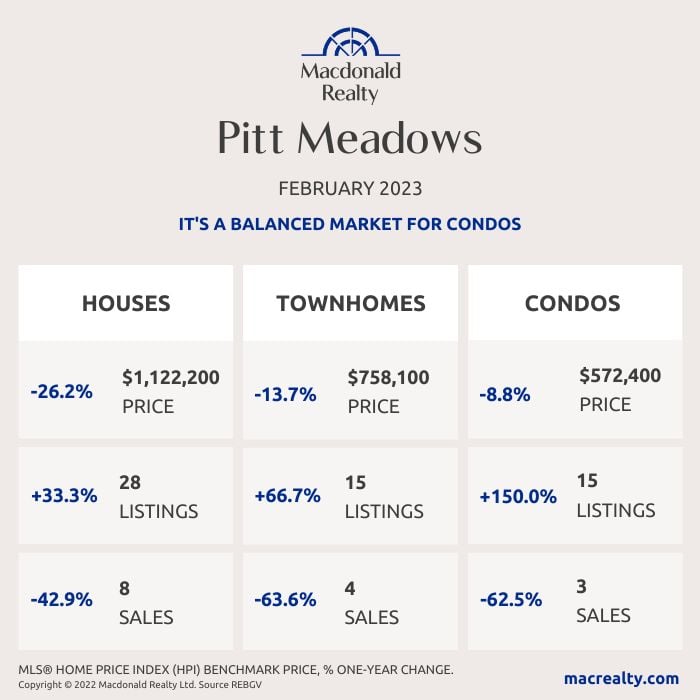
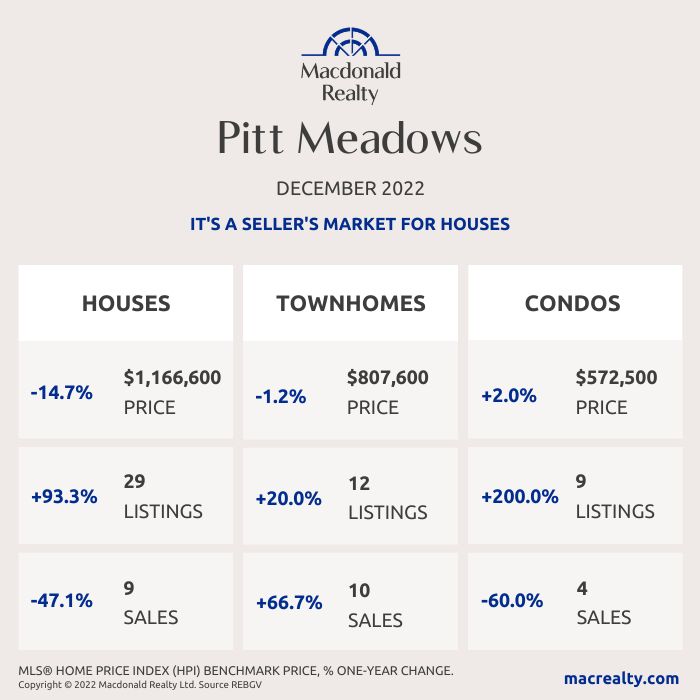
Pitt Meadows

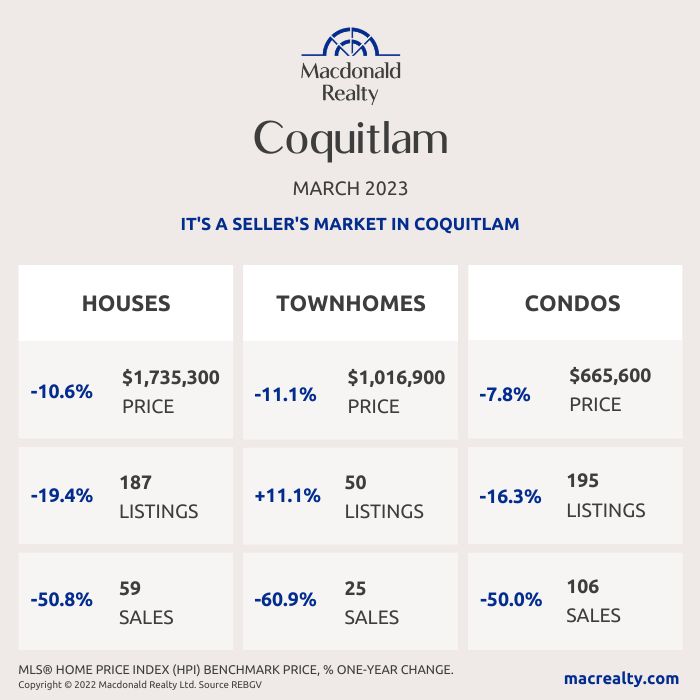
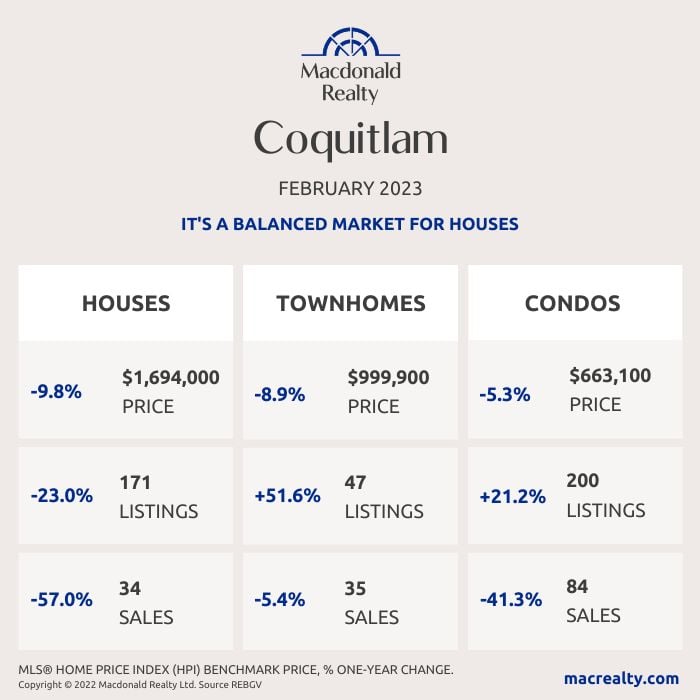
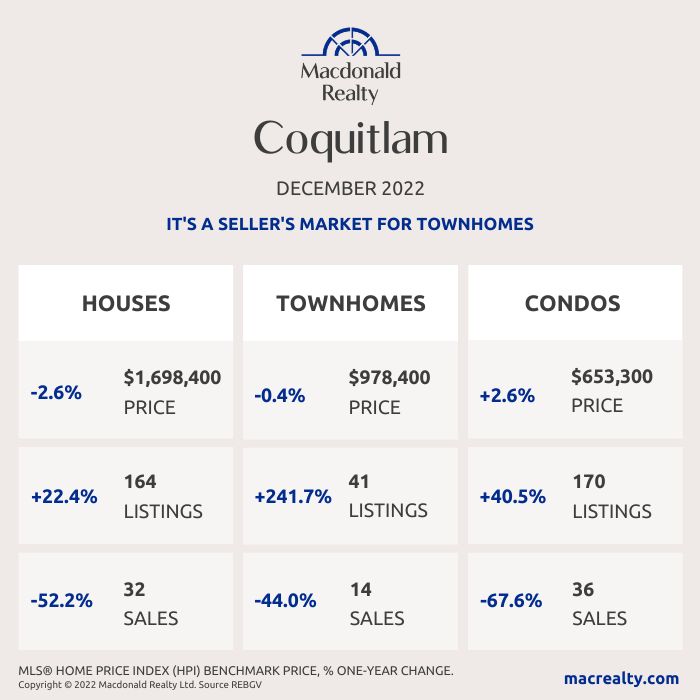
Coquitlam
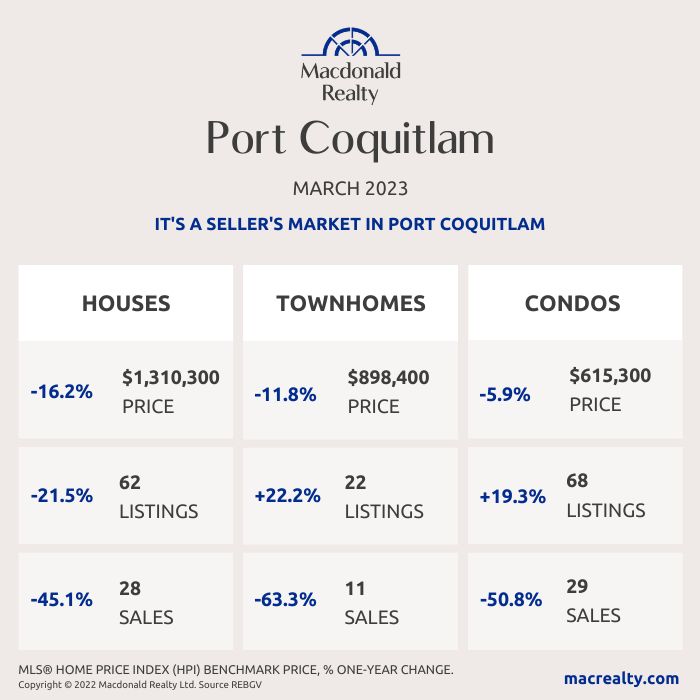
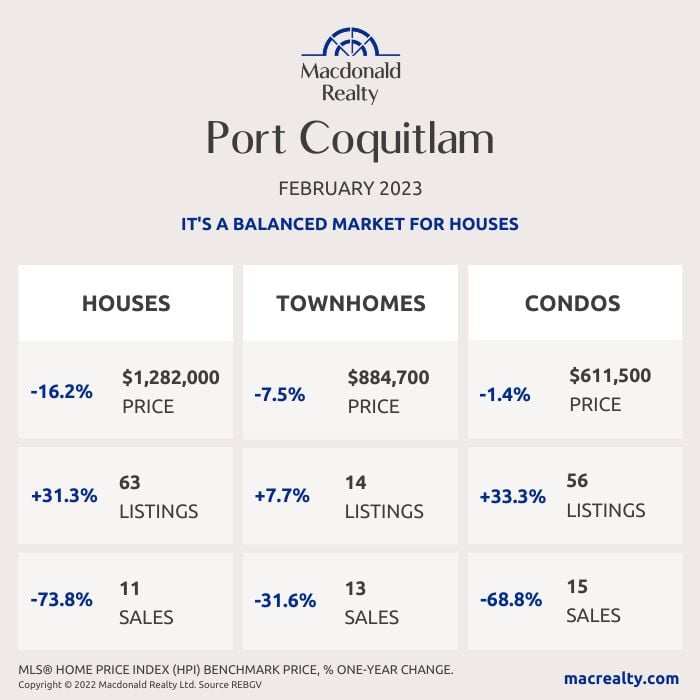
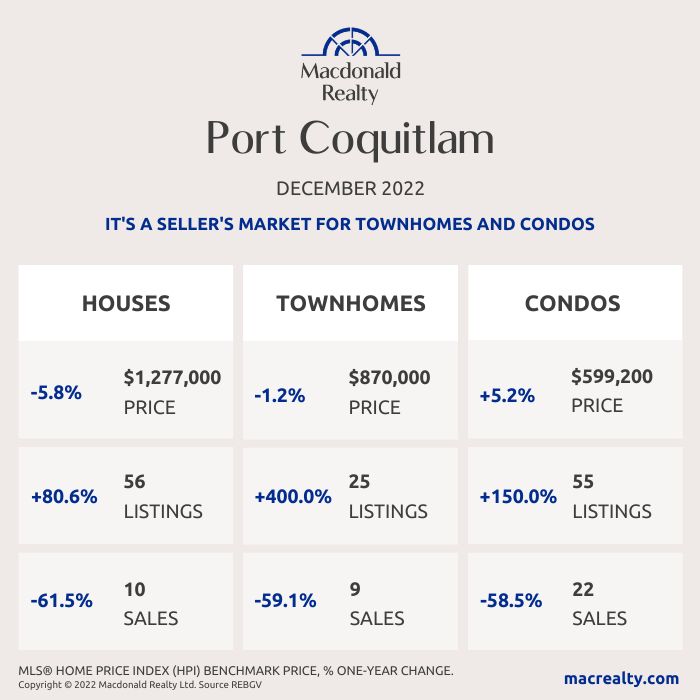
Port Coquitlam
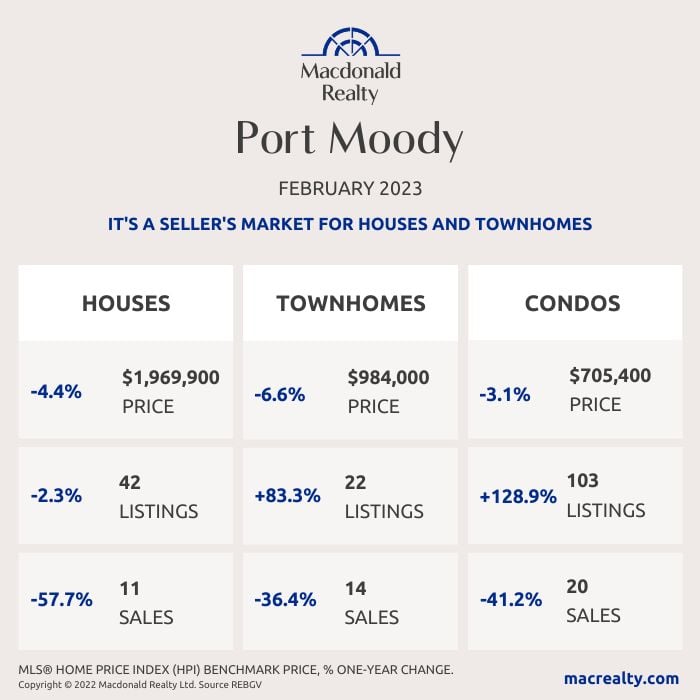
Port Moody

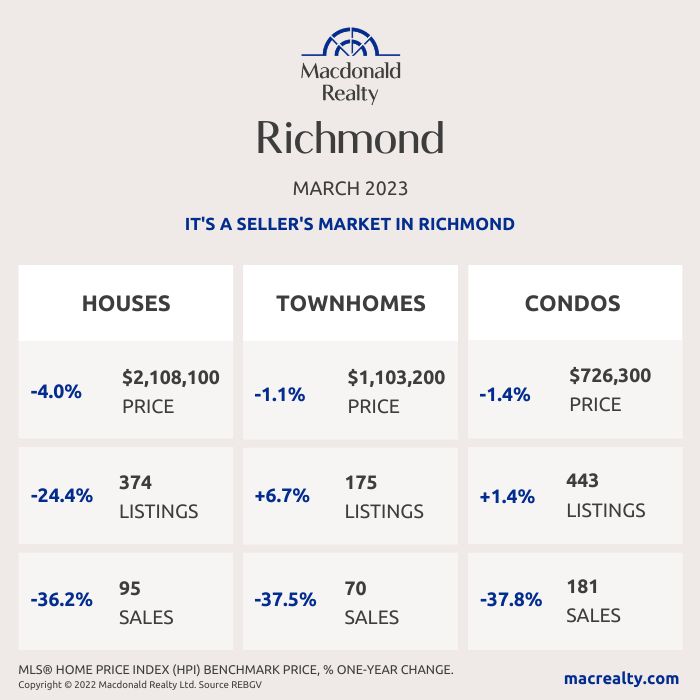
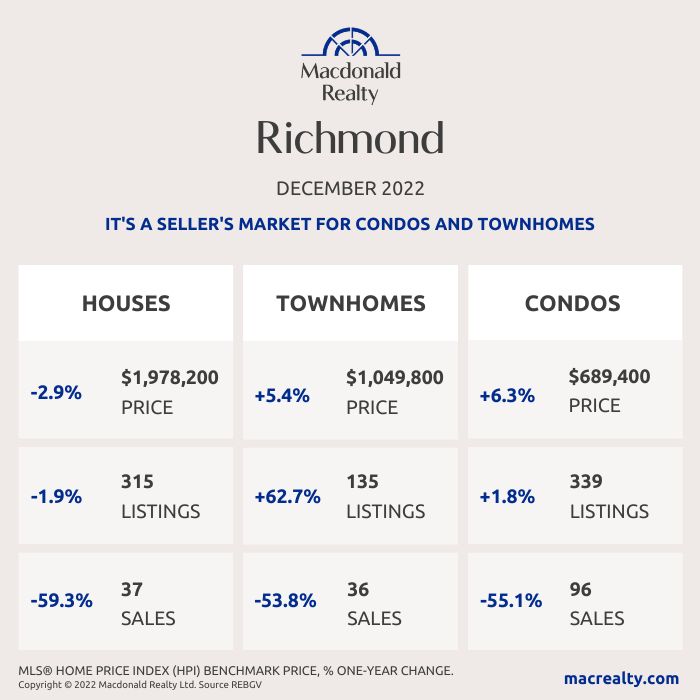
Richmond
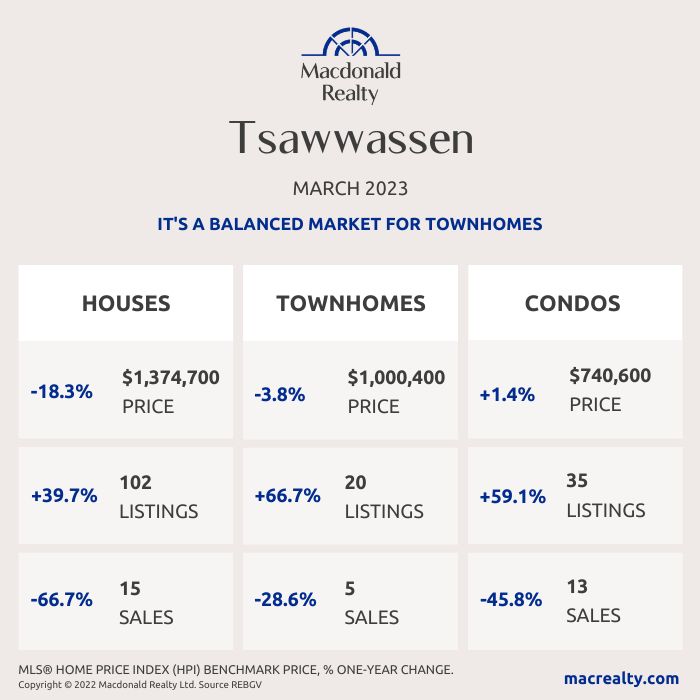
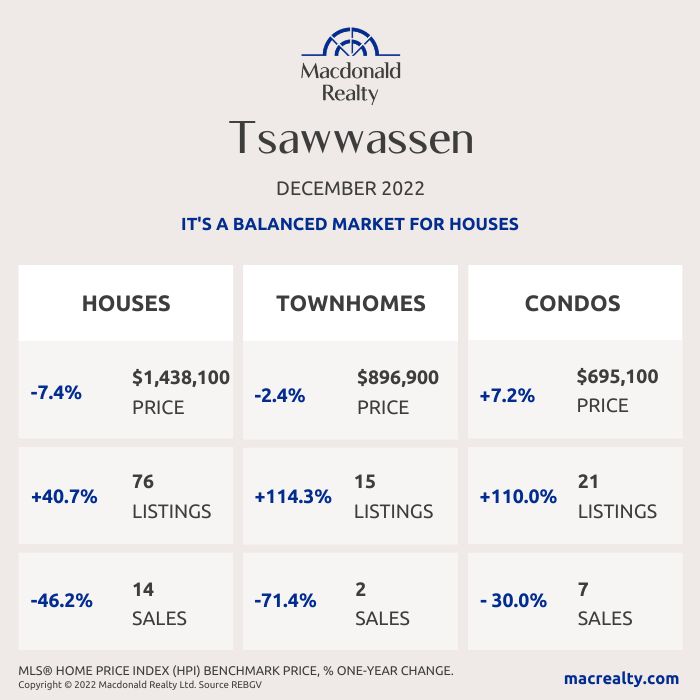
Tsawwassen
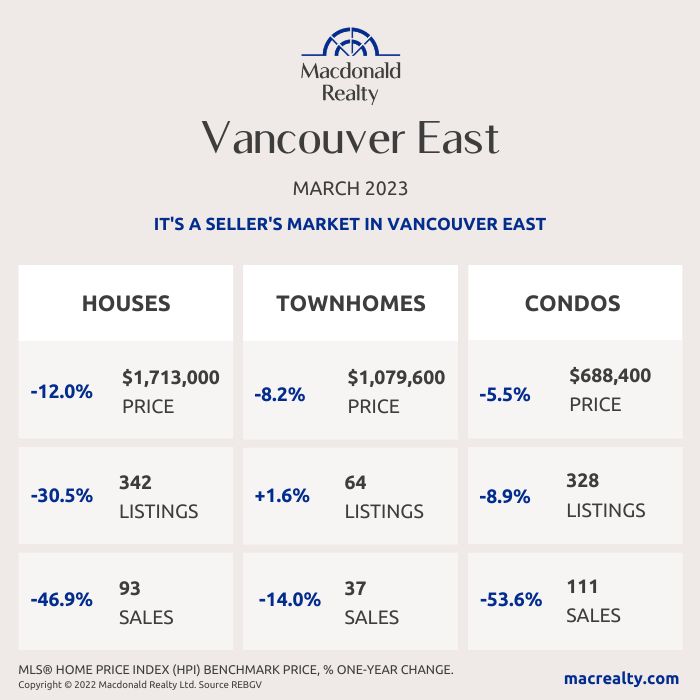
Vancouver East
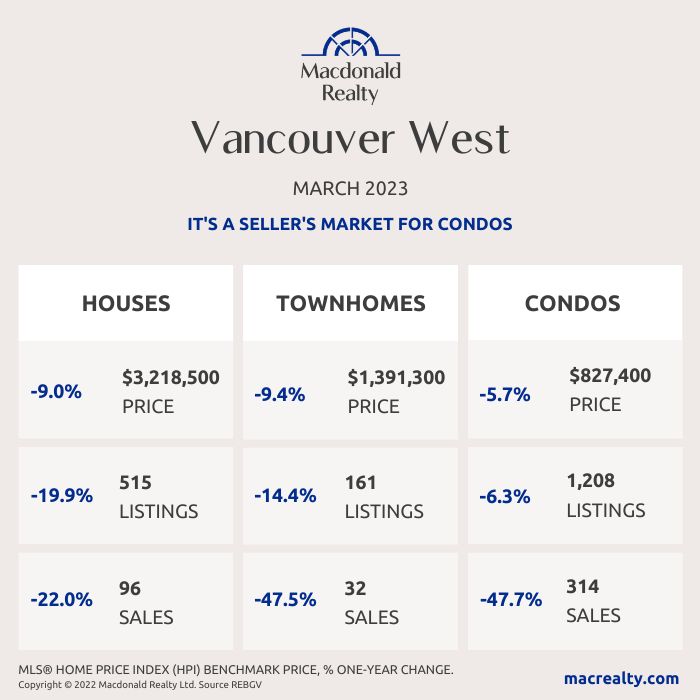
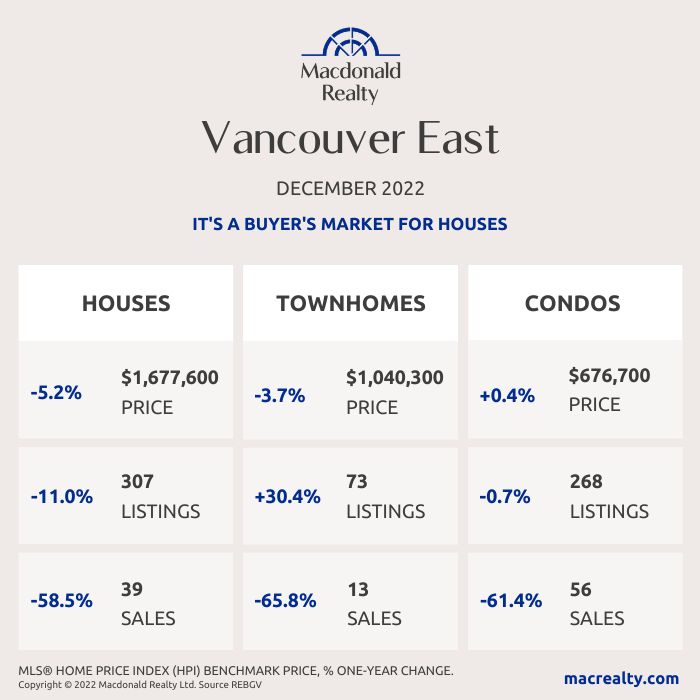
Vancouver West
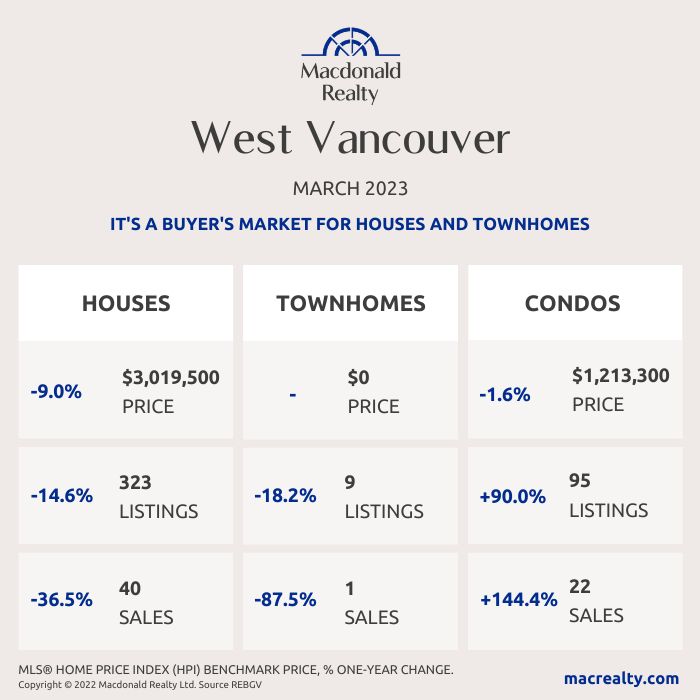
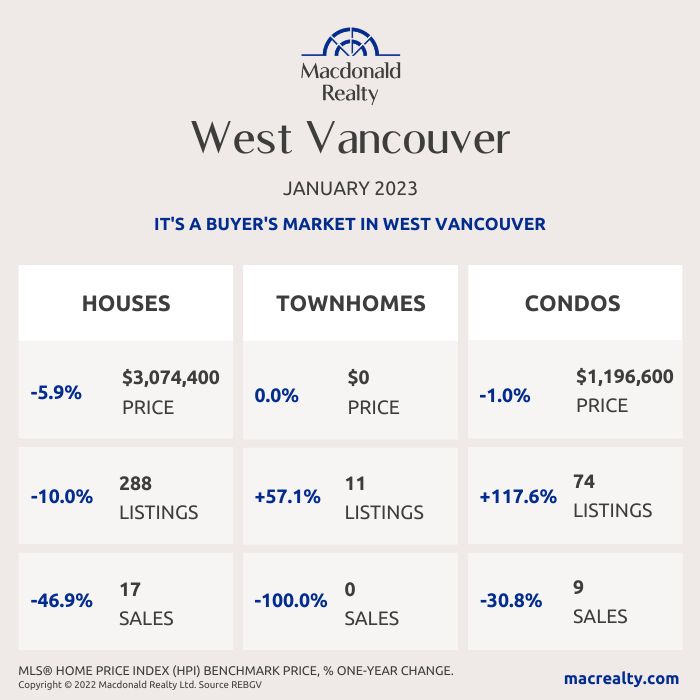
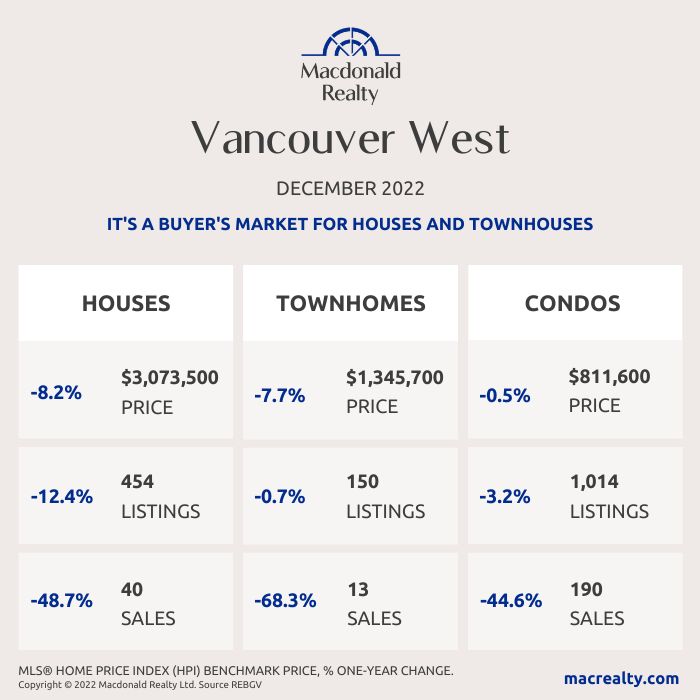
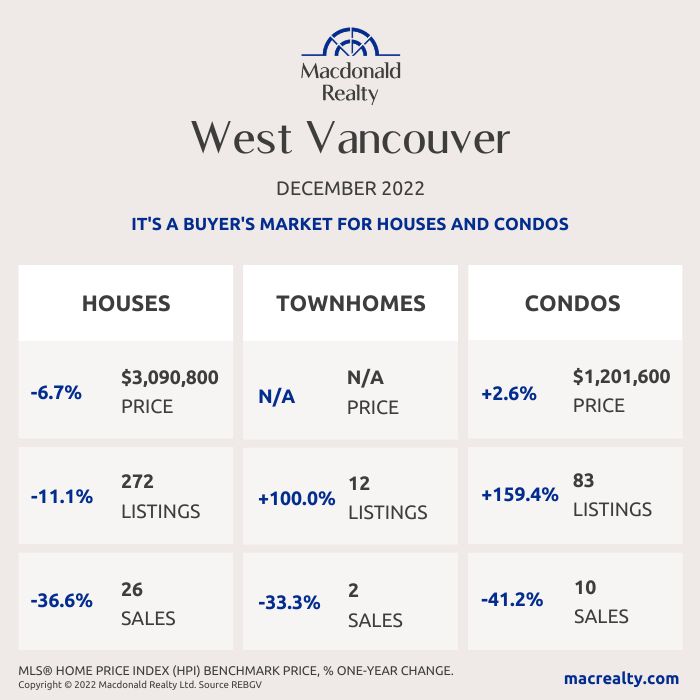
West Vancouver
Looking for more information about the real estate market in specific neighbourhoods in the Greater Vancouver?
Macdonald Realty has offices across the Greater Vancouver. Please email [email protected] or call 1-877-278-3888 to be matched with a REALTOR® working in your area.
MLS® Home Price Index (HPI) Benchmark Price
Average and median home prices are often misinterpreted, are affected by change in the mix of homes sold, and can swing dramatically from month to month (based on the types and prices of properties that sold in a given month). The MLS® HPI overcomes these shortcomings and uses the concept of a benchmark home, a notional home with common attributes of typical homes in a defined area. Visit www.housepriceindex.ca for more information.
This blog post is based on market data provided by the Real Estate Board of Greater Vancouver (REBGV) www.rebgv.org
by Macrealty Marketing Team | Mar 7, 2023 | Market Updates
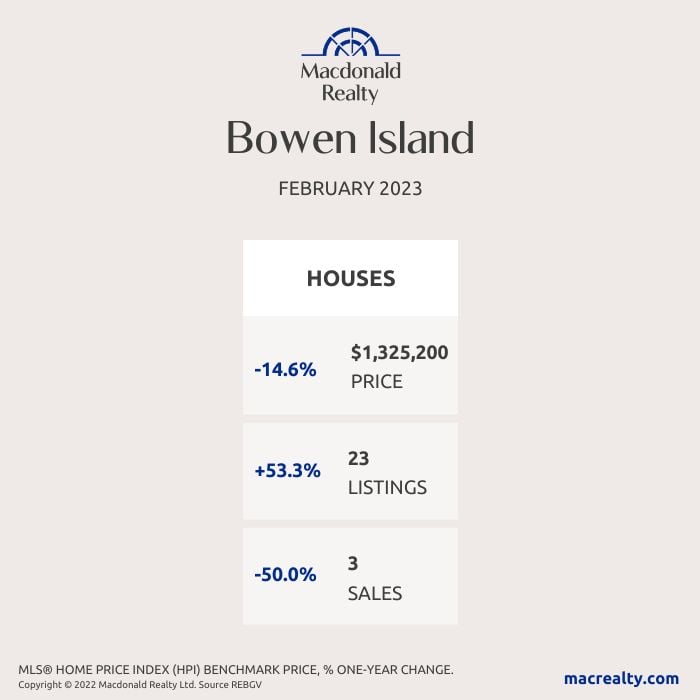
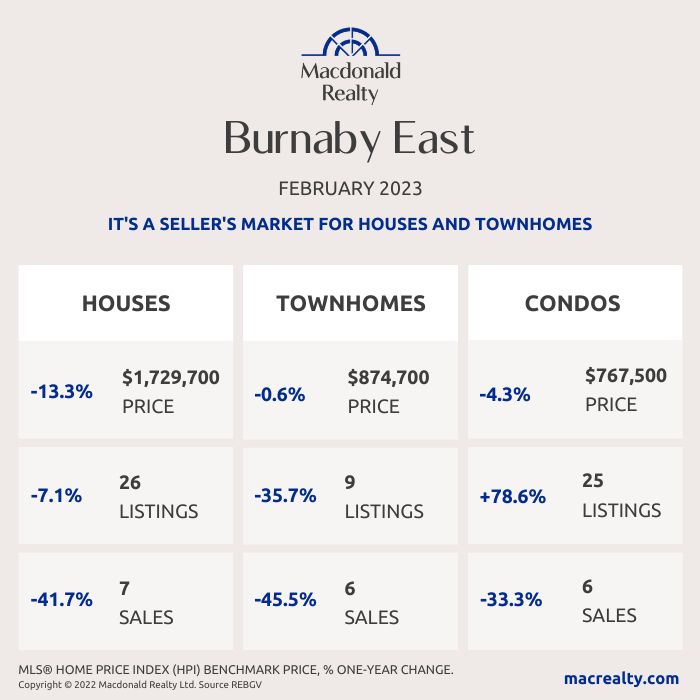
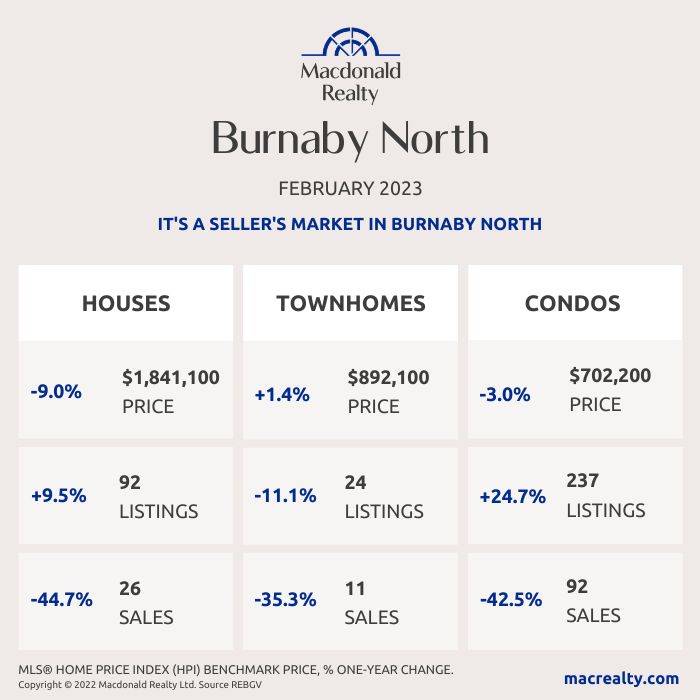
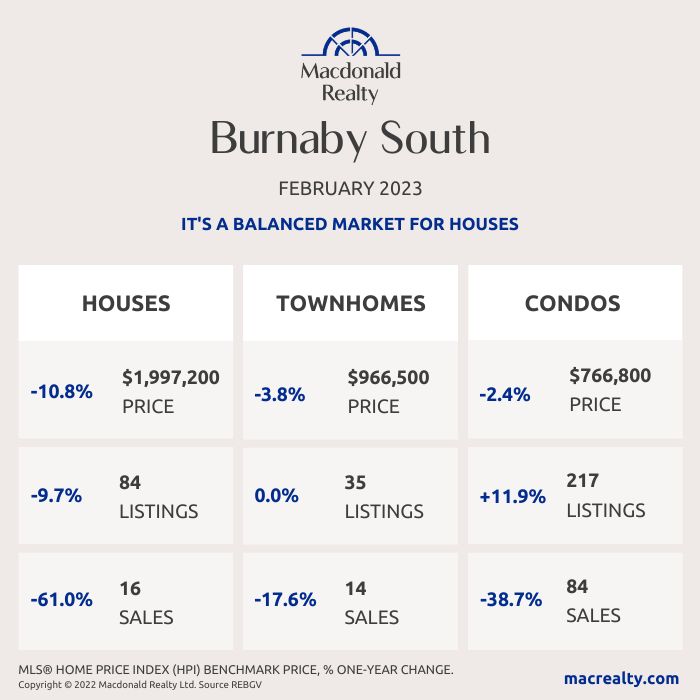
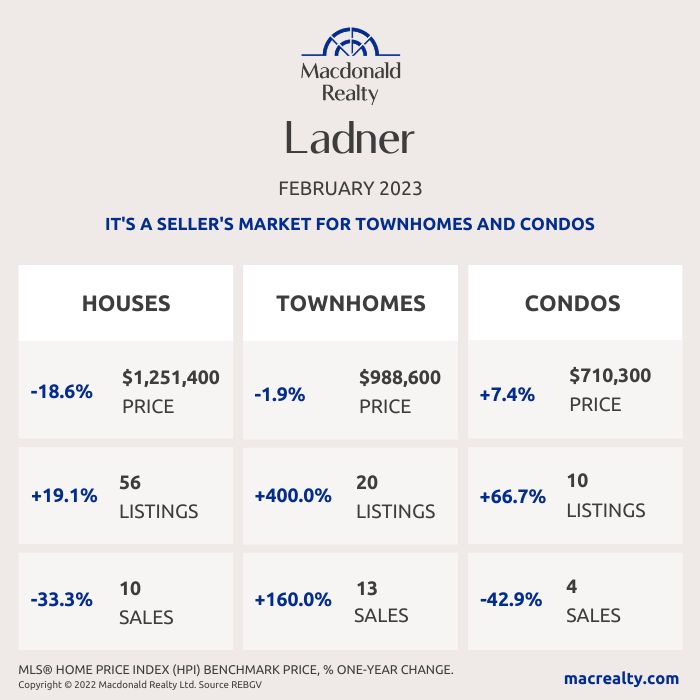
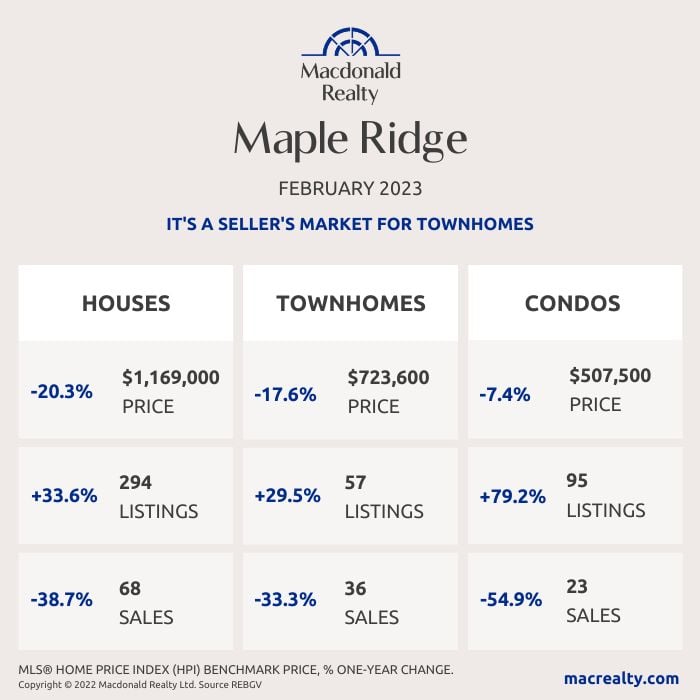
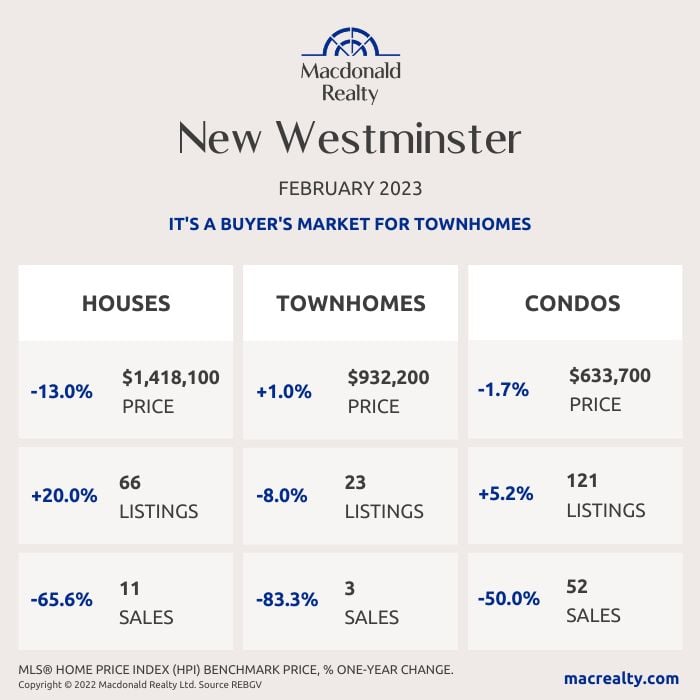
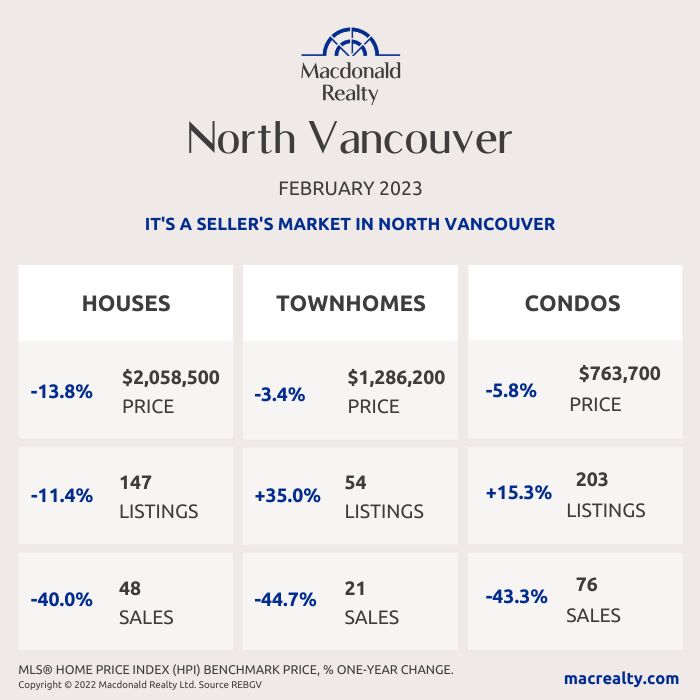
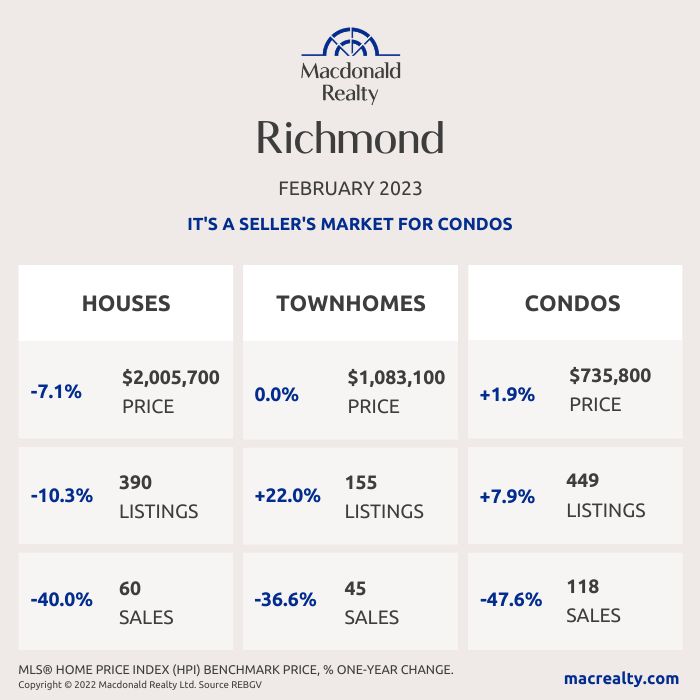
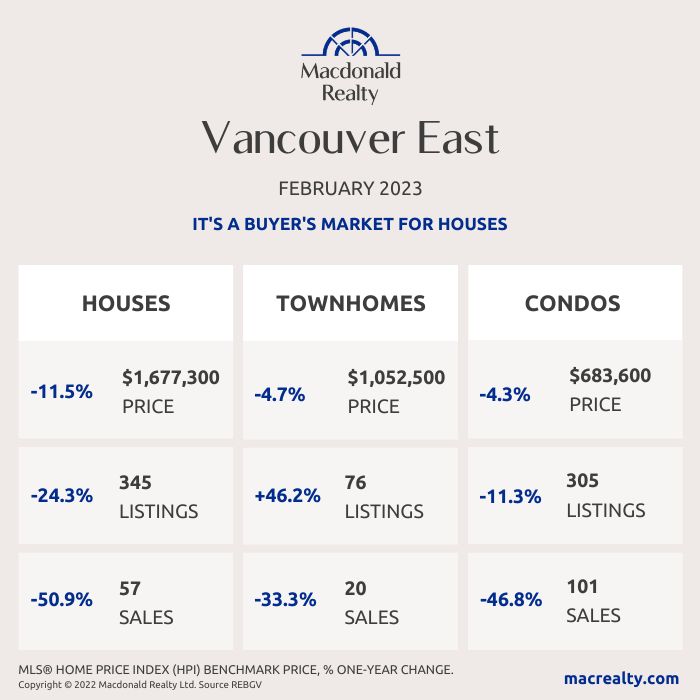
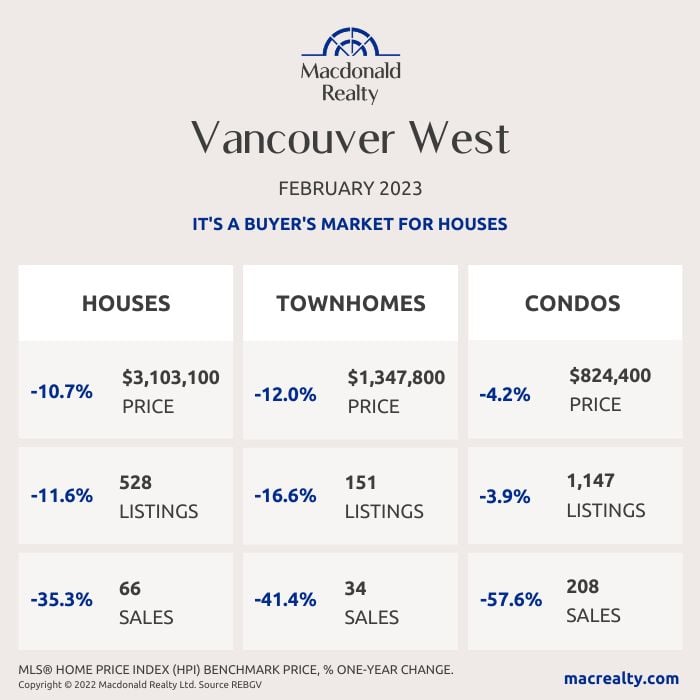
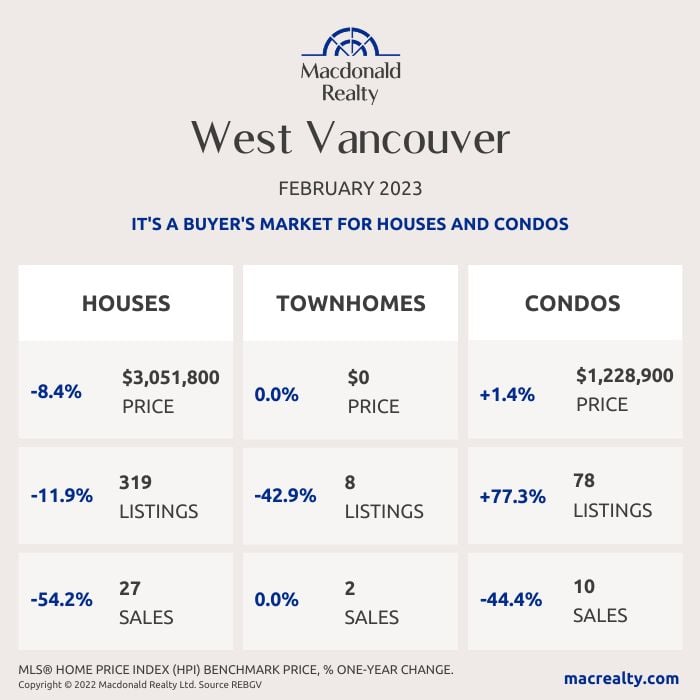
Here are the latest real estate market statistics from Macdonald Realty on the Greater Vancouver listings and sales in February 2023. Find all the infographics by visiting the Facebook Album.
Below average home sales allow inventory to inch upwards.
February listing data show a continued reluctance among prospective home sellers to engage in Metro Vancouver’s* housing market, leading to below-average sales activity. With sales remaining well-below historical norms, the number of available homes for sale in the region have continued inching upwards.
The Real Estate Board of Greater Vancouver (REBGV) reports that residential home sales in the region totalled 1,808 in February 2023, a 47.2 per cent decrease from the 3,424 sales recorded in February 2022, and a 76.9 per cent increase from the 1,022 homes sold in January 2023.
Last month’s sales were 33 per cent below the 10-year February sales average.
“It’s hard to sell what you don’t have, and with new listing activity remaining among the lowest in recent history, sales are struggling to hit typical levels for this point in the year,” said Andrew Lis, REBGV’s director, economics and data analytics. “On the plus side for prospective buyers, the below-average sales activity is allowing inventory to accumulate, which is keeping market conditions from straying too deeply into sellers’ market territory, particularly in the more affordably priced segments.”
There were 3,467 detached, attached and apartment properties newly listed for sale on the Multiple Listing Service® (MLS®) in Metro Vancouver in February 2023. This represents a 36.6 per cent decrease compared to the 5,471 homes listed in February 2022 and a 5.2 per cent increase compared to January 2023 when 3,297 homes were listed.
The total number of homes currently listed for sale on the MLS® system in Metro Vancouver is 7,868, a 16.7 per cent increase compared to February 2022 (6,742) and a 5.2 per cent increase compared to January 2023 (7,478).
“While we continue to expect home price trends to show year-over-year declines for a few more months, current data and market activity suggest pricing is firming up. In fact, some leading indicators suggest we may see modest price increases this spring, particularly if sales activity increases and mortgage rates hold steady,” Lis said. “In the somewhat unusual market environment we find ourselves in right now with higher mortgage rates, fewer sales, and inventory that is inching higher but remains far from abundant, working with a Realtor who understands your local market conditions and has experience navigating challenging markets is paramount.”
*Areas covered by the Real Estate Board of Greater Vancouver include Burnaby, Coquitlam, Maple Ridge, New Westminster, North Vancouver, Pitt Meadows, Port Coquitlam, Port Moody, Richmond, South Delta, Squamish, Sunshine Coast, Vancouver, West Vancouver, and Whistler. Check out the infographics of Squamish, Sunshine Coast and Whistler, HERE.
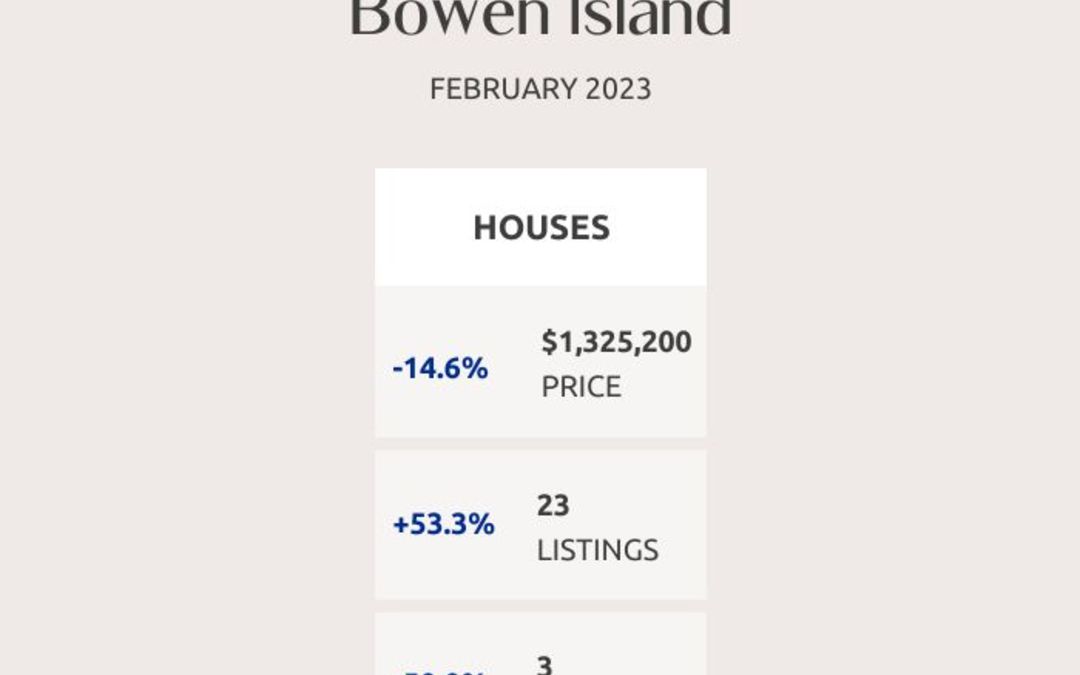
Bowen Island
Burnaby East
Burnaby North
Burnaby South
Ladner
Maple Ridge
New Westminster
North Vancouver
Pitt Meadows
Coquitlam
Port Coquitlam
Port Moody
Richmond
Tsawwassen

Vancouver East
Vancouver West
West Vancouver
Looking for more information about the real estate market in specific neighbourhoods in the Greater Vancouver?
Macdonald Realty has offices across the Greater Vancouver. Please email [email protected] or call 1-877-278-3888 to be matched with a REALTOR® working in your area.
MLS® Home Price Index (HPI) Benchmark Price
Average and median home prices are often misinterpreted, are affected by change in the mix of homes sold, and can swing dramatically from month to month (based on the types and prices of properties that sold in a given month). The MLS® HPI overcomes these shortcomings and uses the concept of a benchmark home, a notional home with common attributes of typical homes in a defined area. Visit www.housepriceindex.ca for more information.
This blog post is based on market data provided by the Real Estate Board of Greater Vancouver (REBGV) www.rebgv.org
by Macrealty Marketing Team | Feb 7, 2023 | Market Updates
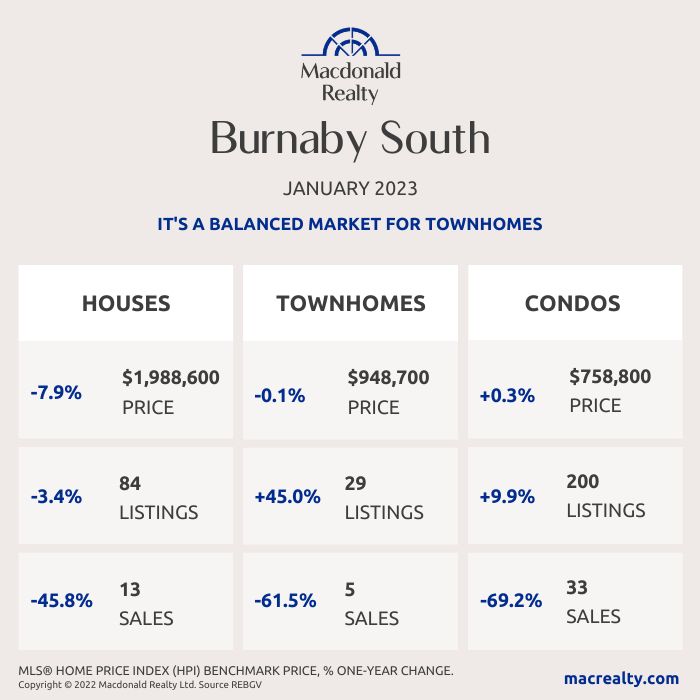
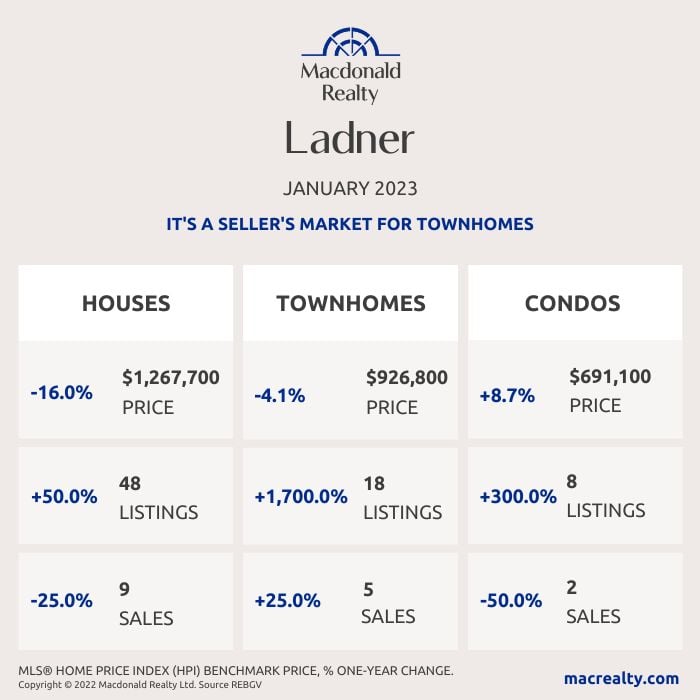
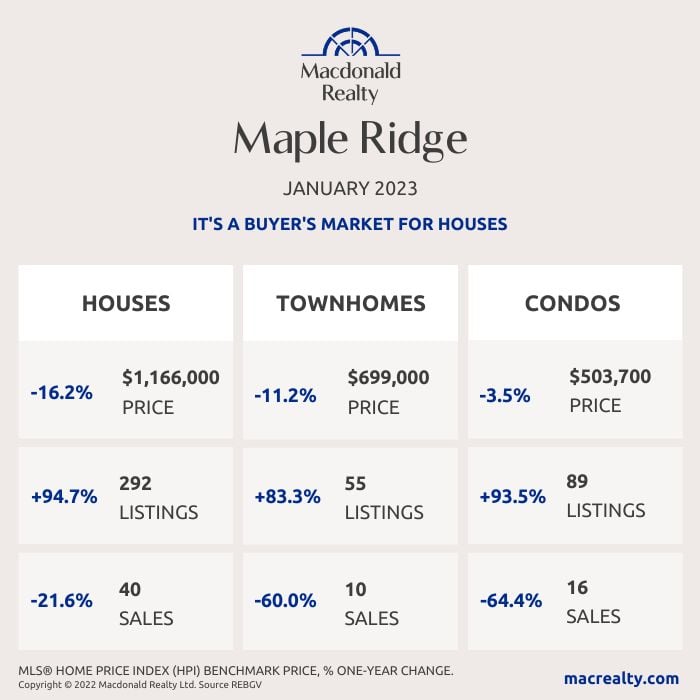
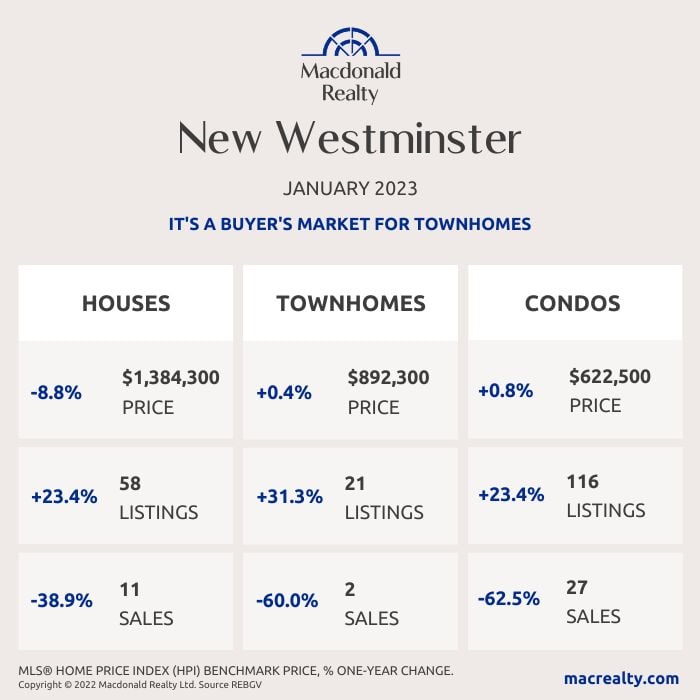
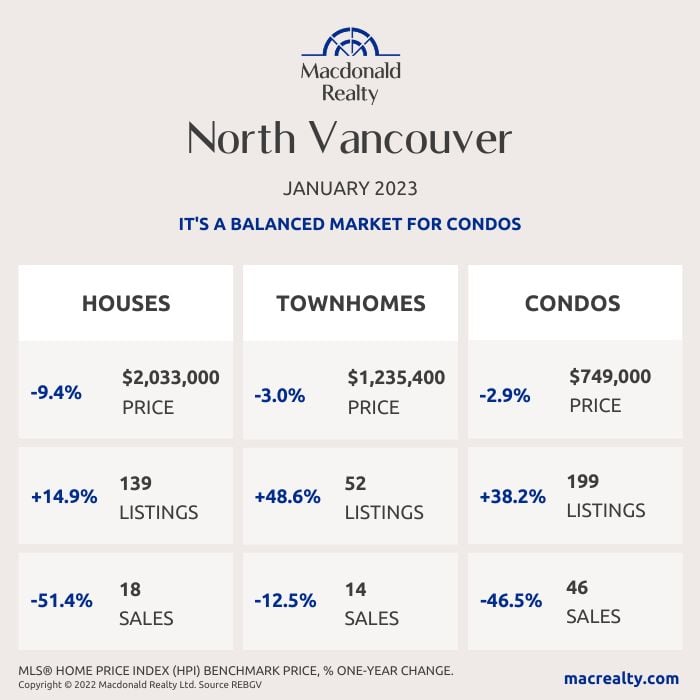
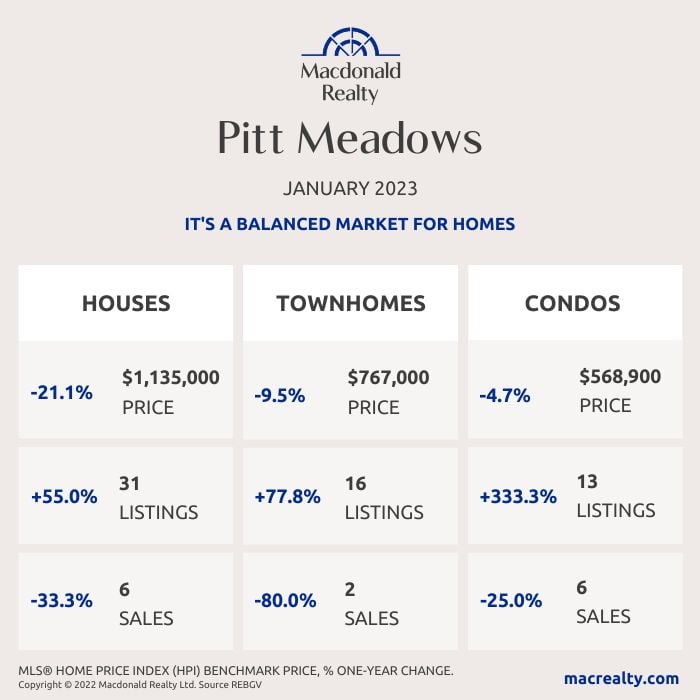
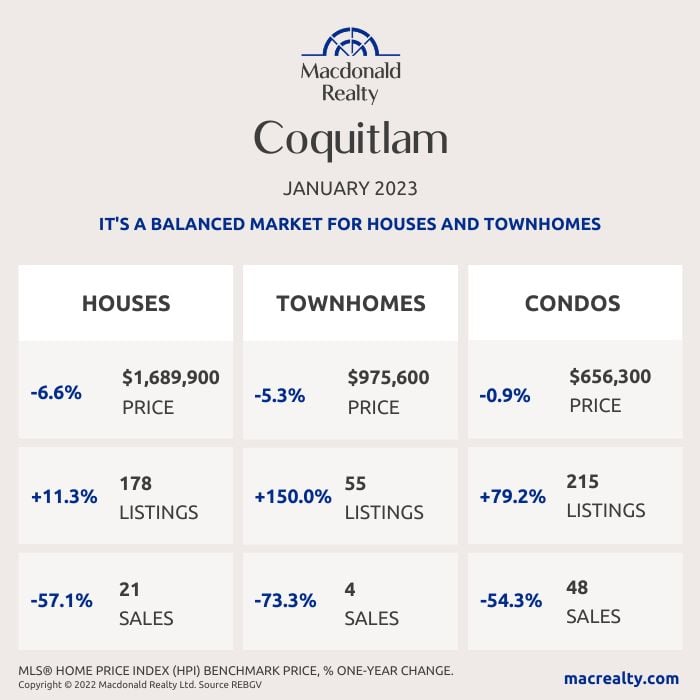
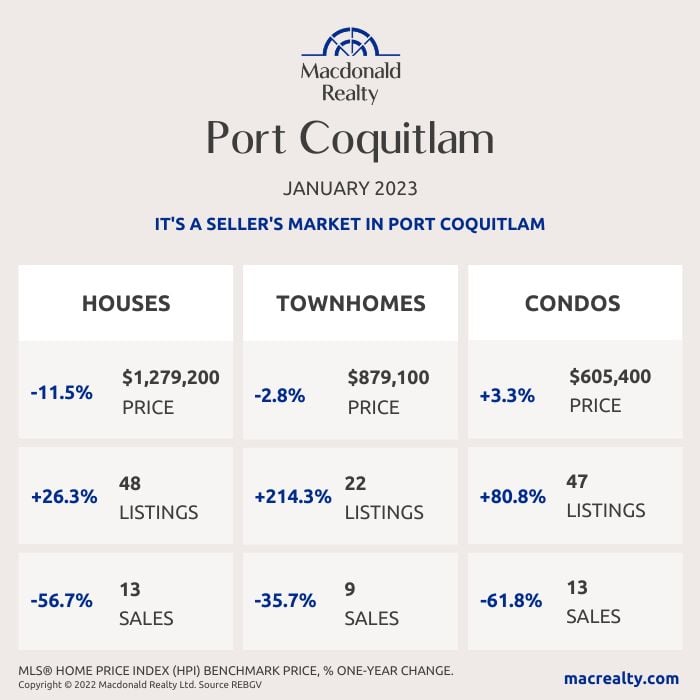
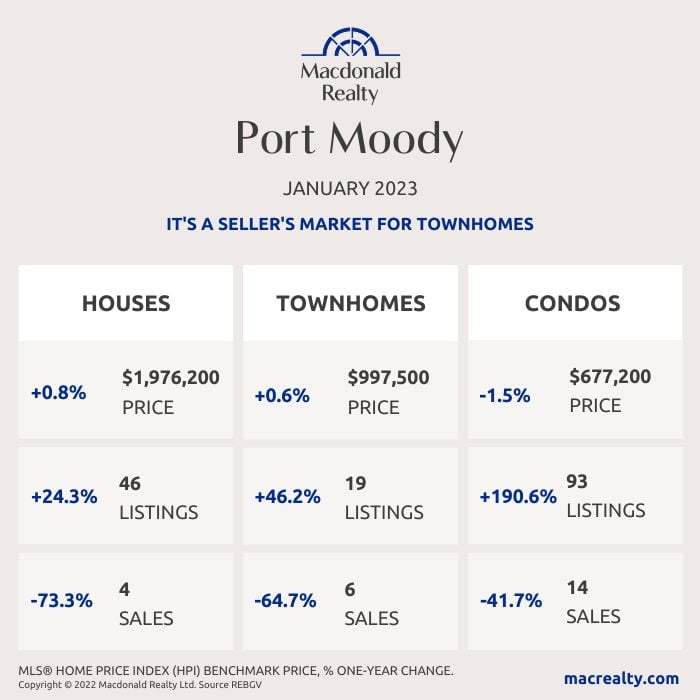
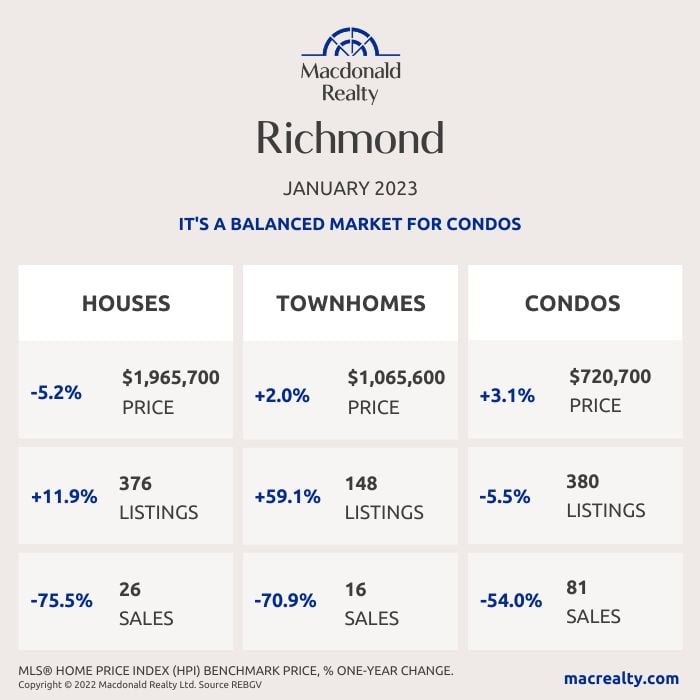
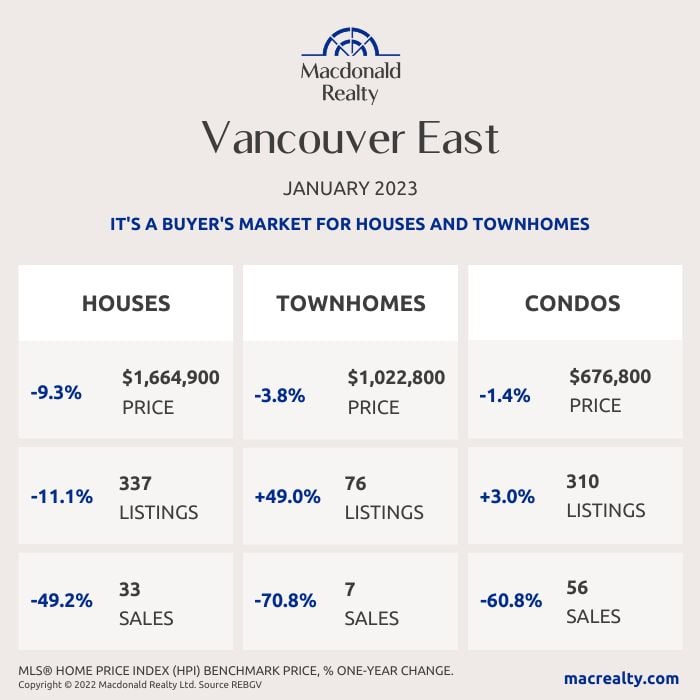
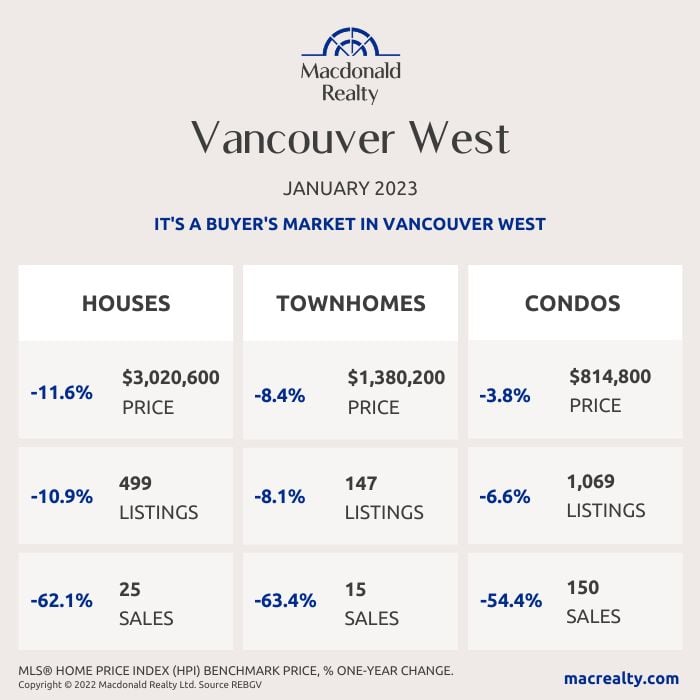
Here are the latest real estate market statistics from Macdonald Realty on the Greater Vancouver listings and sales in January 2023. Find all the infographics by visiting the Facebook Album.
Inventory remains low in Metro Vancouver while home sales dipped well below monthly historical averages in January.
The Real Estate Board of Greater Vancouver (REBGV) reports that residential home sales in the region totalled 1,022 in January 2023, a 55.3 per cent decrease from the 2,285 sales recorded in January 2022, and a 21.1 per cent decrease from the 1,295 homes sold in December 2022.
Last month’s sales were 42.9 per cent below the 10-year January sales average.
“Due to seasonality, market activity is quieter in January. With mortgage rates having risen so rapidly over the last year, we anticipated sales this month would be among the lowest in recent history,” said Andrew Lis, REBGV’s director, economics and data analytics. “Looking forward, however, the Bank of Canada has said that it will pause further rate increases as long as the incoming economic data continues to support this policy stance. This should provide more certainty for home buyers and sellers in the market.”
There were 3,297 detached, attached and apartment properties newly listed for sale on the Multiple Listing Service® (MLS®) in Metro Vancouver in January 2023. This represents a 20.9 per cent decrease compared to the 4,170 homes listed in January 2022 and a 173.4 per cent increase compared to December 2022 when 1,206 homes were listed.
The total number of homes currently listed for sale on the MLS® system in Metro Vancouver is 7,478, a 32.1 per cent increase compared to January 2022 (5,663) and a 1.3 per cent increase compared to December 2022 (7,384).
For all property types, the sales-to-active listings ratio for January 2023 is 13.7 per cent. By property type, the ratio is 10.2 per cent for detached homes, 13.4 per cent for townhomes, and 16.7 per cent for apartments.
Generally, analysts say downward pressure on home prices occurs when the ratio dips below 12 per cent for a sustained period, while home prices often experience upward pressure when it surpasses 20 per cent over several months.
“We know the peak for prices in our market occurred last spring. Over the coming months, year-over-year data comparisons will show larger price declines than we’ve been reporting up to now,” said Lis. “It’s important to understand that year-over-year calculations are backward-looking. These price declines already happened, and what we are seeing today is that prices may have found a footing, even if it’s an awkward one sandwiched between low inventory and higher borrowing costs.”
*Areas covered by the Real Estate Board of Greater Vancouver include Burnaby, Coquitlam, Maple Ridge, New Westminster, North Vancouver, Pitt Meadows, Port Coquitlam, Port Moody, Richmond, South Delta, Squamish, Sunshine Coast, Vancouver, West Vancouver, and Whistler. Check out the infographics of Squamish, Sunshine Coast and Whistler, HERE.
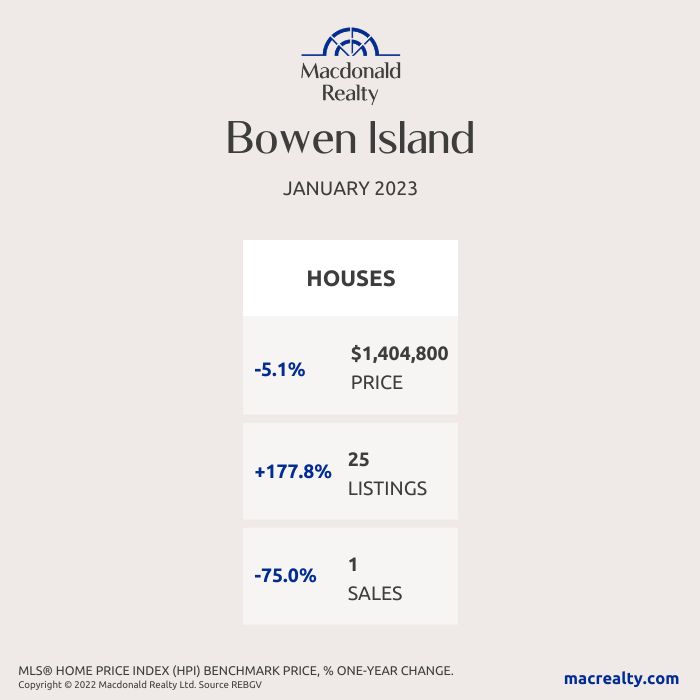
Bowen Island
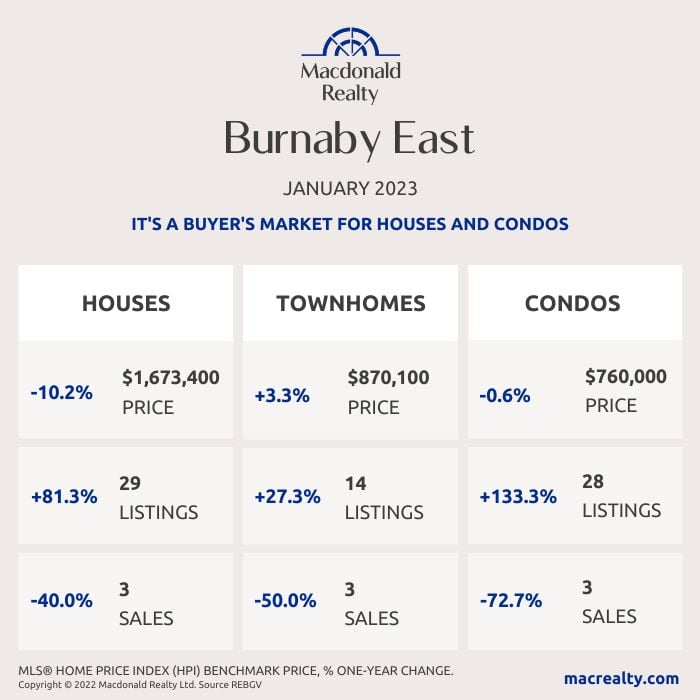
Burnaby East
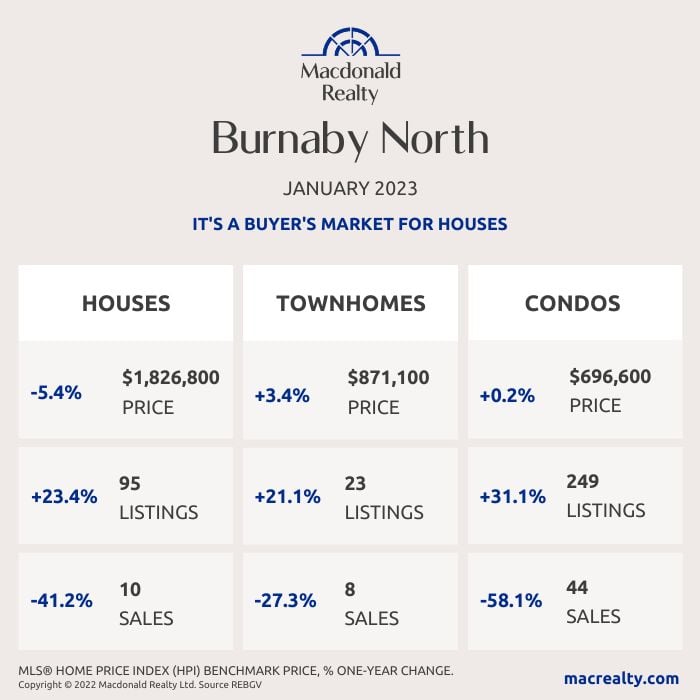
Burnaby North
Burnaby South
Ladner
Maple Ridge
New Westminster
North Vancouver
Pitt Meadows
Coquitlam
Port Coquitlam
Port Moody
Richmond
Tsawwassen

Vancouver East
Vancouver West
West Vancouver
Looking for more information about the real estate market in specific neighbourhoods in the Greater Vancouver?
Macdonald Realty has offices across the Greater Vancouver. Please email [email protected] or call 1-877-278-3888 to be matched with a REALTOR® working in your area.
MLS® Home Price Index (HPI) Benchmark Price
Average and median home prices are often misinterpreted, are affected by change in the mix of homes sold, and can swing dramatically from month to month (based on the types and prices of properties that sold in a given month). The MLS® HPI overcomes these shortcomings and uses the concept of a benchmark home, a notional home with common attributes of typical homes in a defined area. Visit www.housepriceindex.ca for more information.
This blog post is based on market data provided by the Real Estate Board of Greater Vancouver (REBGV) www.rebgv.org
by Macrealty Marketing Team | Jan 9, 2023 | Market Updates
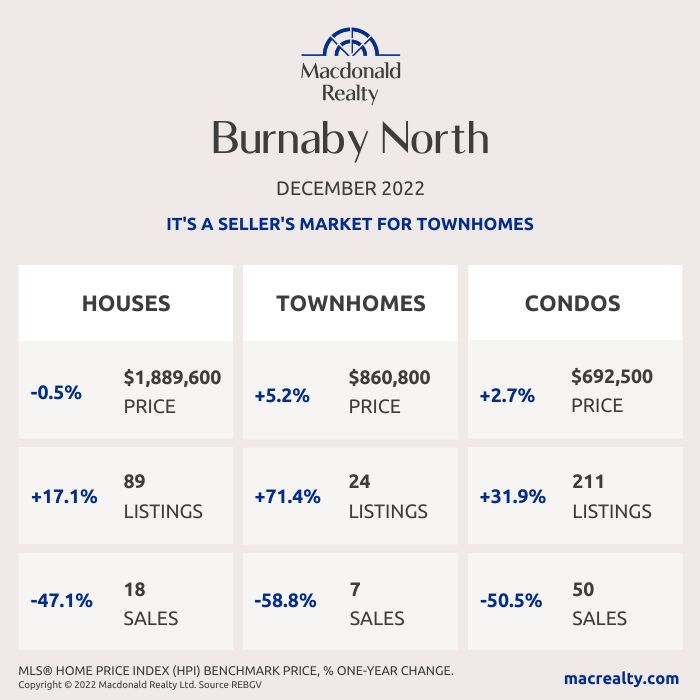
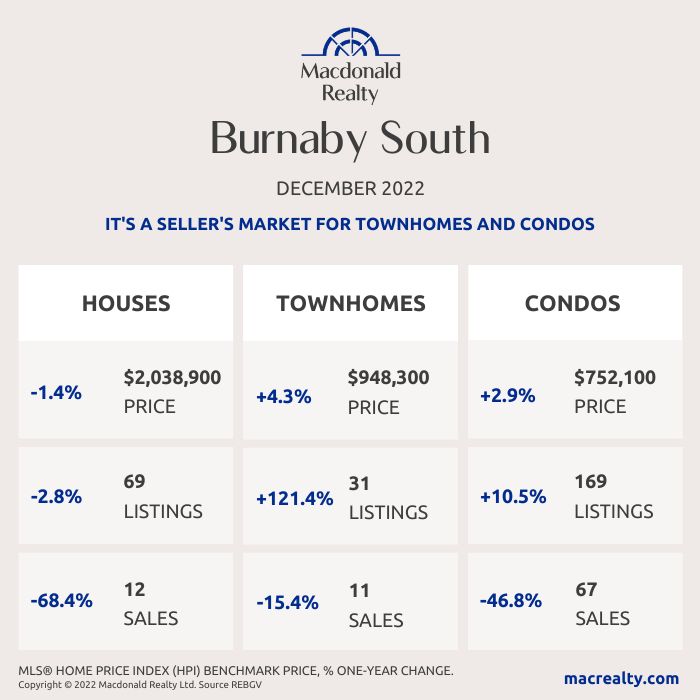
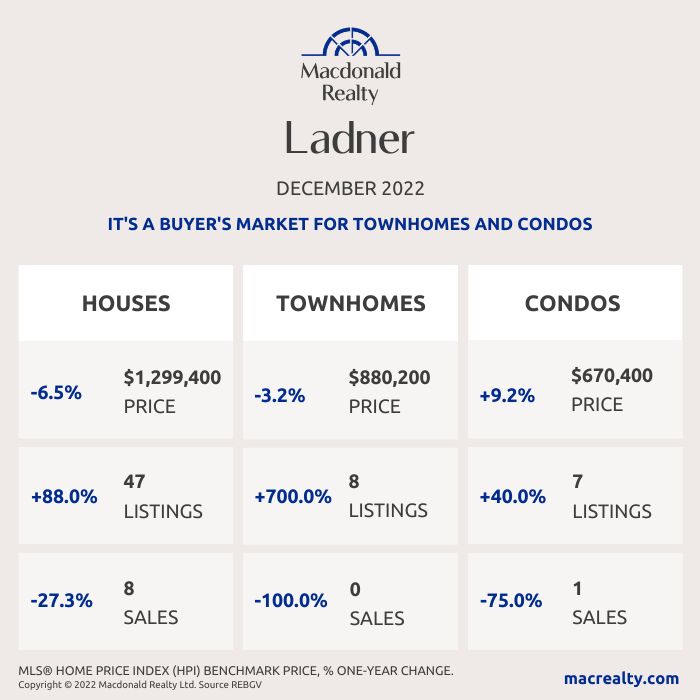
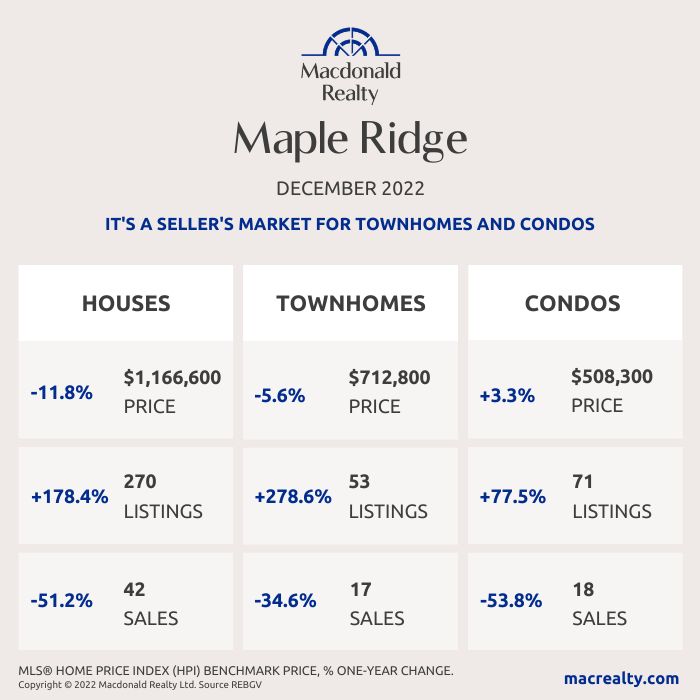
Here are the latest real estate market statistics from Macdonald Realty on the Greater Vancouver listings and sales in December 2022. Find all the infographics by visiting the Facebook Album.
Rising mortgage rates brought uncertainty and caution to Metro Vancouver’s housing market in 2022. After seeing record sales and prices during the pandemic, Metro Vancouver’s* housing market experienced a year of caution in 2022 due to rising borrowing costs fueled by the Bank of Canada’s ongoing battle with inflation.
The Real Estate Board of Greater Vancouver (REBGV) reports that residential home sales in the region totalled 28,903 in 2022, a 34.3 per cent decrease from the 43,999 sales recorded in 2021, and a 6.6 per cent decrease from the 30,944 homes sold in 2020.
Last year’s sales total was 13.4 per cent below the 10-year sales average.
“The headline story in our market in 2022 was all about inflation and the Bank of Canada’s efforts to bring inflation back to target by rapidly raising the policy rate. This is a story we expect to continue to make headlines into 2023, as inflationary pressures remain persistent across Canada,” Andrew Lis, REBGV’s director, economics and data analytics said.
Home listings on the Multiple Listing Service® (MLS®) in Metro Vancouver reached 53,865 in 2022. This is a 13.5 per cent decrease compared to the 62,265 homes listed in 2021 and a 0.8 per cent decrease compared to the 54,305 homes listed in 2020.
Last year’s listings total was 3.2 per cent below the region’s 10-year average.
The total number of homes currently listed for sale on the MLS® system in Metro Vancouver is 7,384, a 41 per cent increase compared to December 2021 (5,236) and a 19.6 per cent decrease compared to November 2022 ( 9,179).
The MLS® Home Price Index composite benchmark price for all residential properties in Metro Vancouver is currently $1,114,300. This represents a 3.3 per cent decrease over December 2021, a 1.5 per cent decrease compared to November 2022, and a 9.8 per cent decrease over the past six months.
“Closing out 2022, the data show that the Bank of Canada’s decisions to increase the policy rate at seven of the eight interest rate announcement dates in 2022 has translated into downward pressure on home sale activity and, to a lesser extent, home prices in Metro Vancouver,” Lis said. “While the consensus among many economists and forecasters suggest the Bank of Canada may be near the end of this tightening cycle, rates may remain elevated for longer than previously expected since the latest inflation figures aren’t showing signs of abating quickly. We’ll watch the 2023 spring market closely to see if buyers and sellers have adjusted to the higher borrowing-costs and are participating more actively in the market than we have seen over the last 12 months.”
*Areas covered by the Real Estate Board of Greater Vancouver include Burnaby, Coquitlam, Maple Ridge, New Westminster, North Vancouver, Pitt Meadows, Port Coquitlam, Port Moody, Richmond, South Delta, Squamish, Sunshine Coast, Vancouver, West Vancouver, and Whistler. Check out the infographics of Squamish, Sunshine Coast and Whistler, HERE.
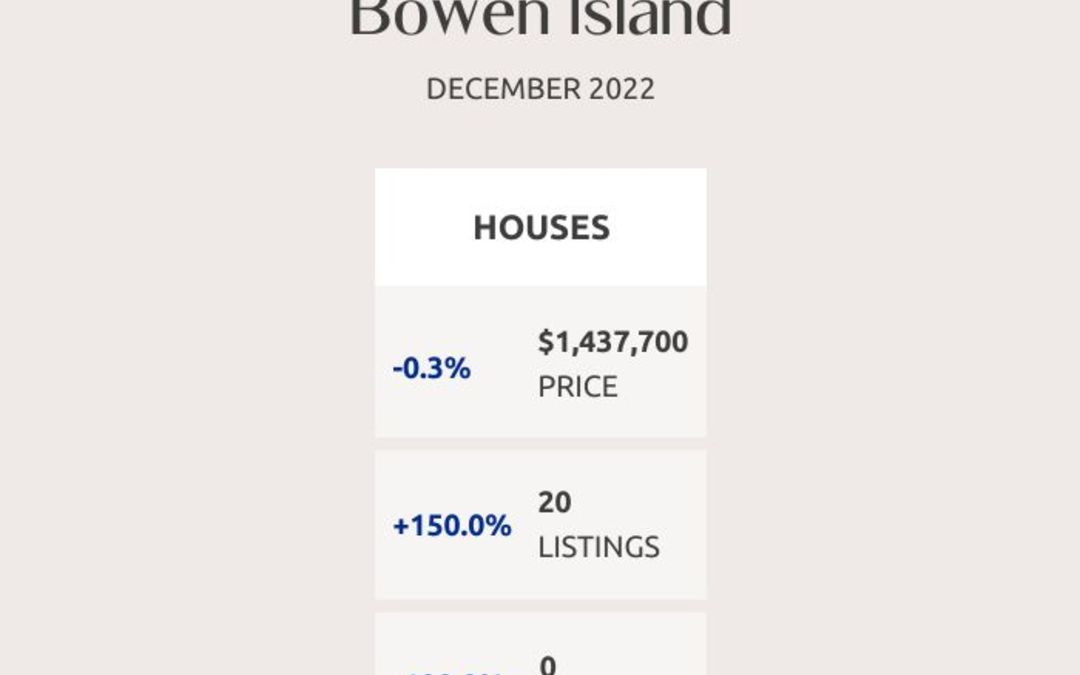
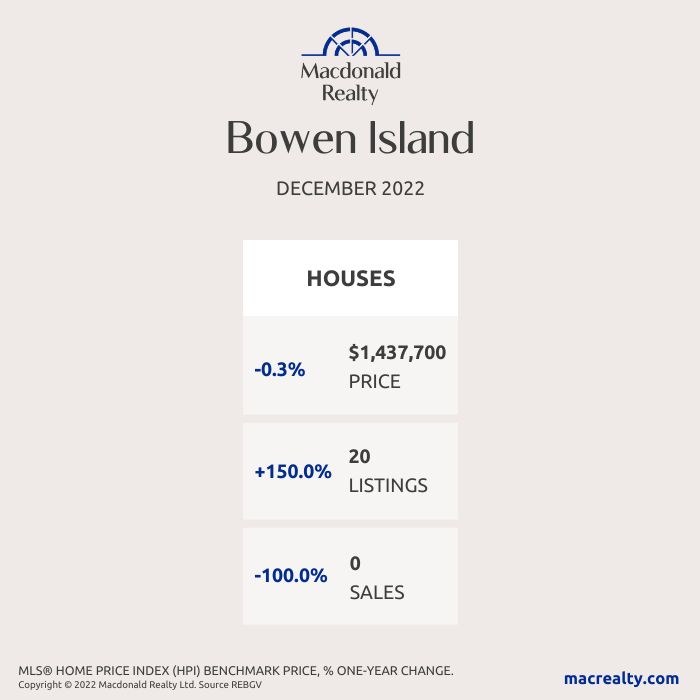
Bowen Island
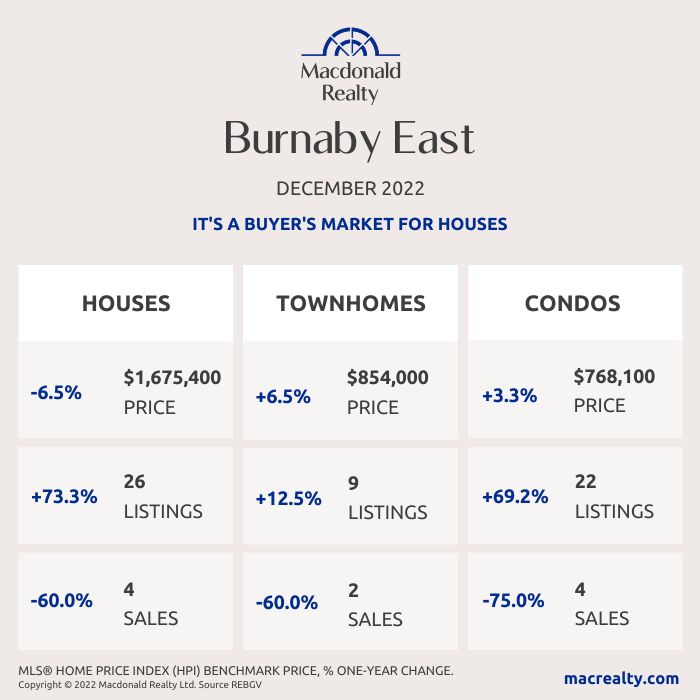
Burnaby East
Burnaby North
Burnaby South
Ladner
Maple Ridge
New Westminster

North Vancouver
Pitt Meadows
Coquitlam
Port Coquitlam
Port Moody

Richmond
Tsawwassen
Vancouver East
Vancouver West
West Vancouver
Looking for more information about the real estate market in specific neighbourhoods in the Greater Vancouver?
Macdonald Realty has offices across the Greater Vancouver. Please email [email protected] or call 1-877-278-3888 to be matched with a REALTOR® working in your area.
MLS® Home Price Index (HPI) Benchmark Price
Average and median home prices are often misinterpreted, are affected by change in the mix of homes sold, and can swing dramatically from month to month (based on the types and prices of properties that sold in a given month). The MLS® HPI overcomes these shortcomings and uses the concept of a benchmark home, a notional home with common attributes of typical homes in a defined area. Visit www.housepriceindex.ca for more information.
This blog post is based on market data provided by the Real Estate Board of Greater Vancouver (REBGV) www.rebgv.org

by Macrealty Marketing Team | Dec 7, 2022 | Market Updates
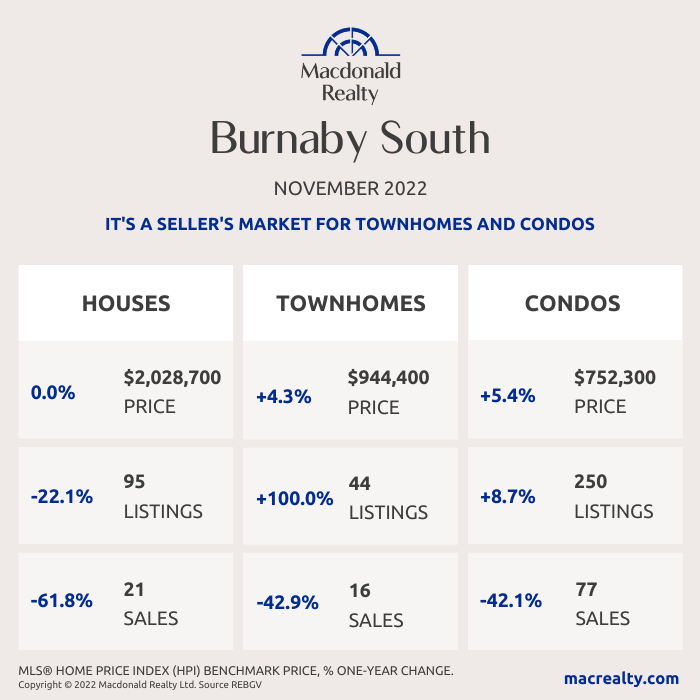
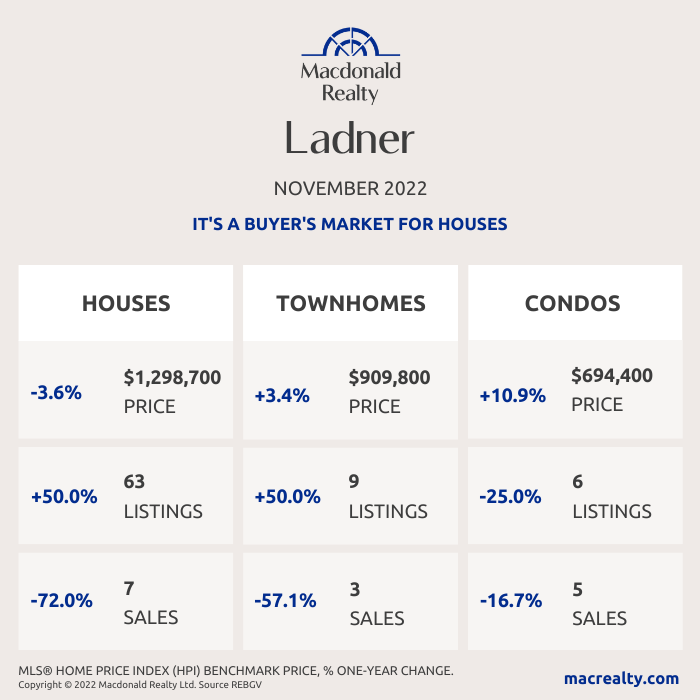
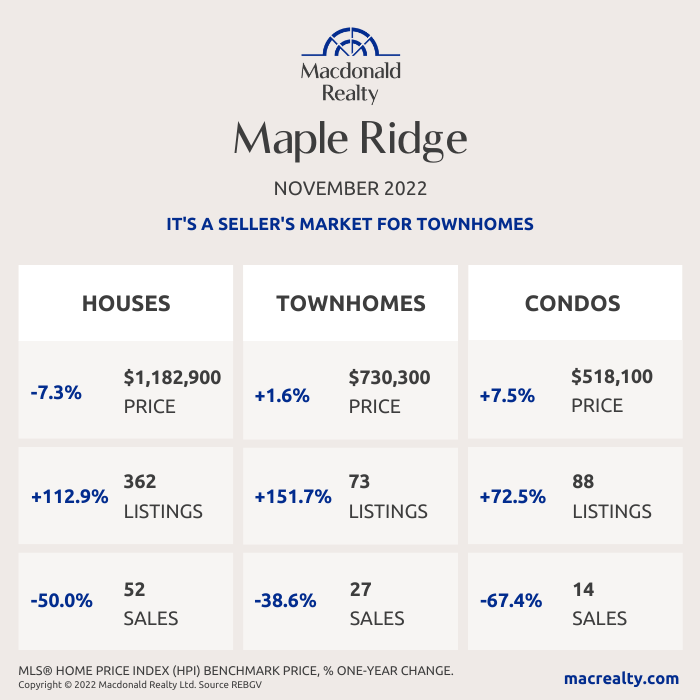
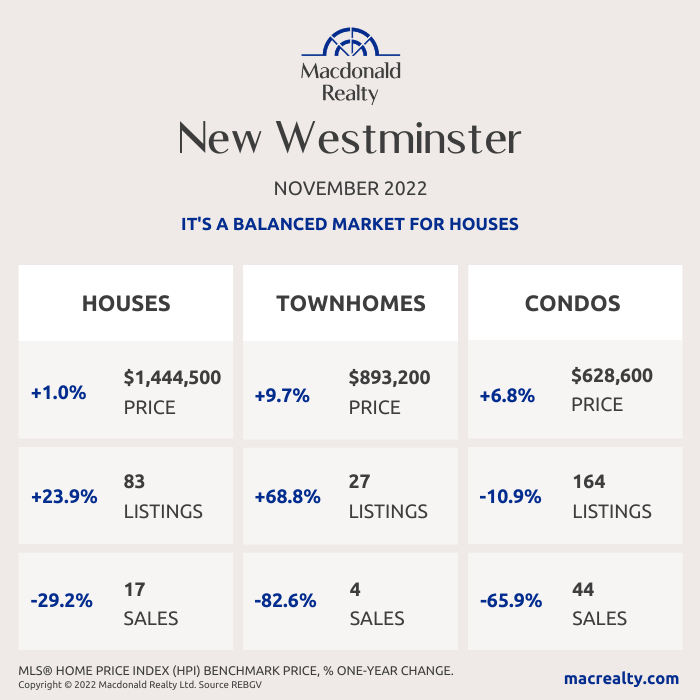
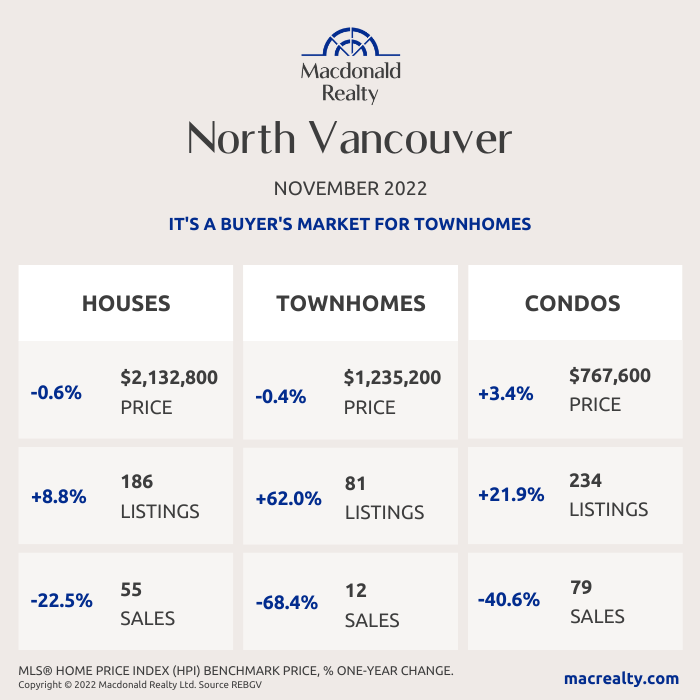
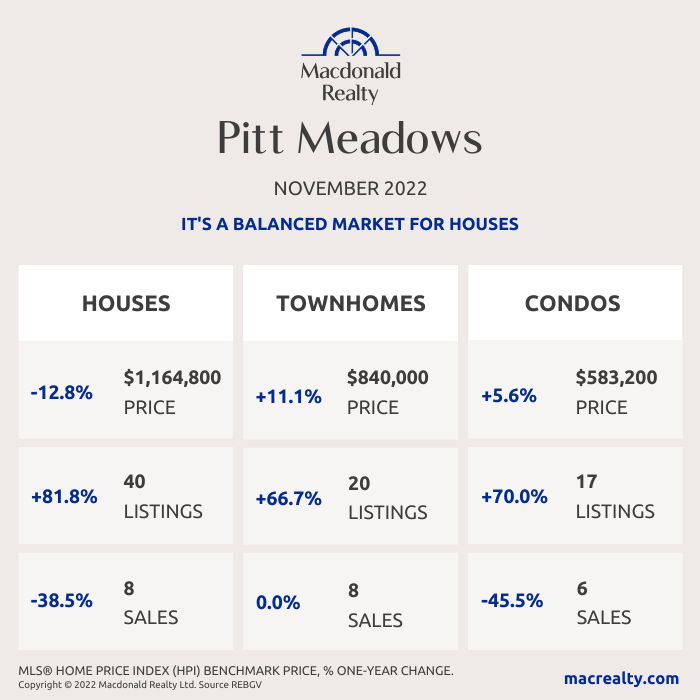
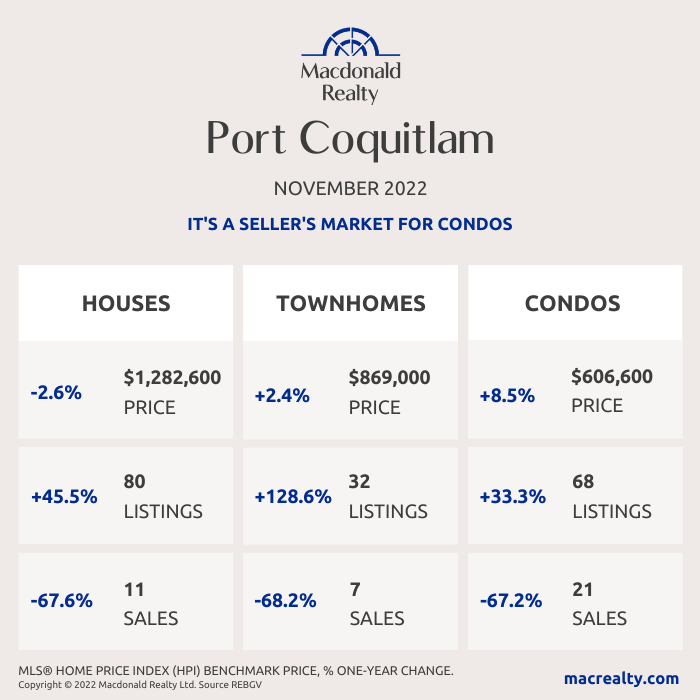
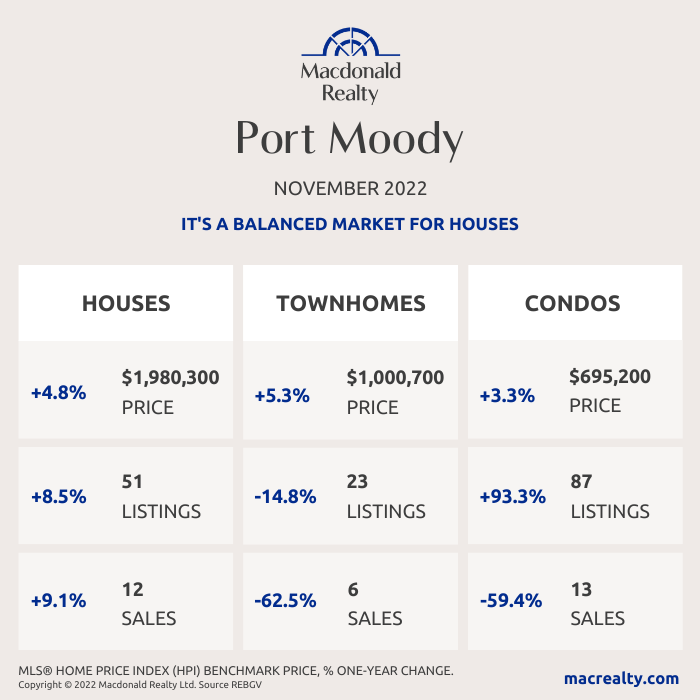
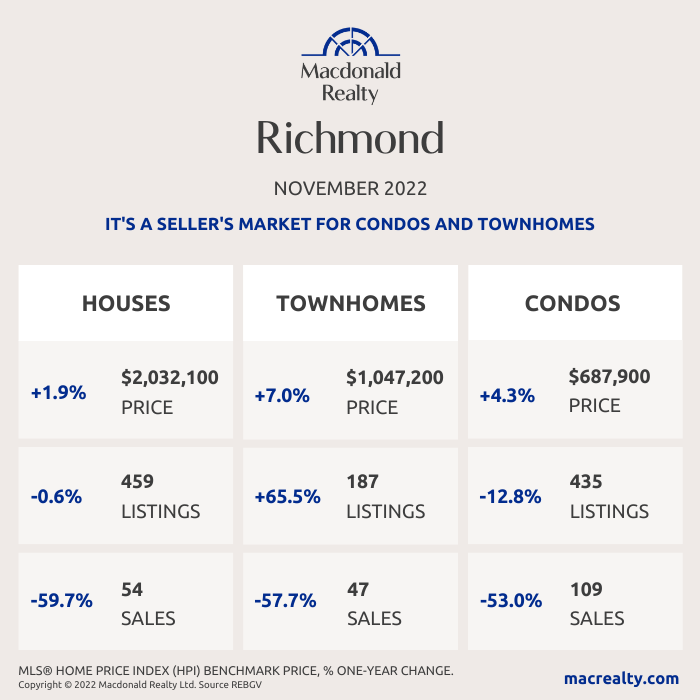
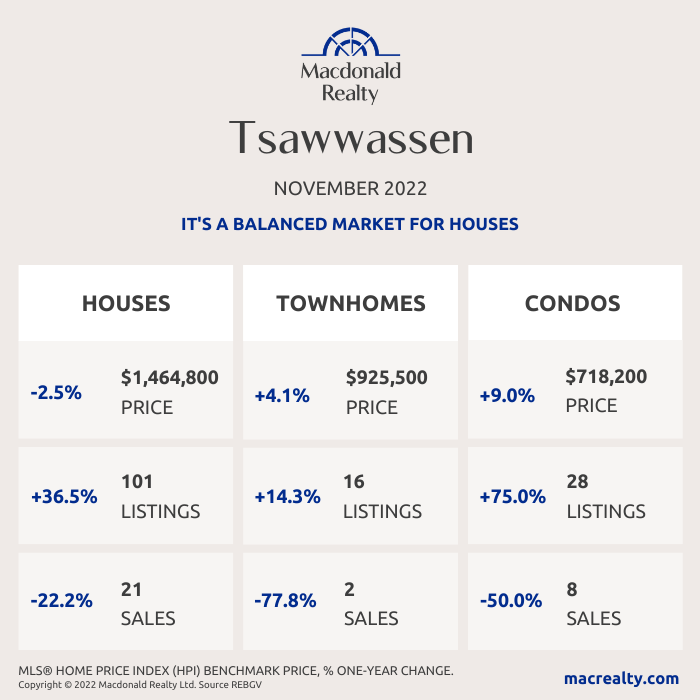
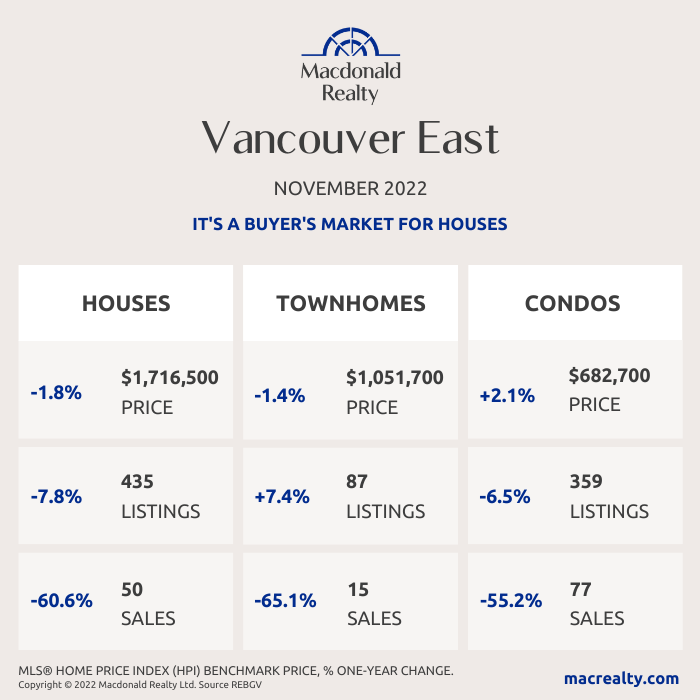
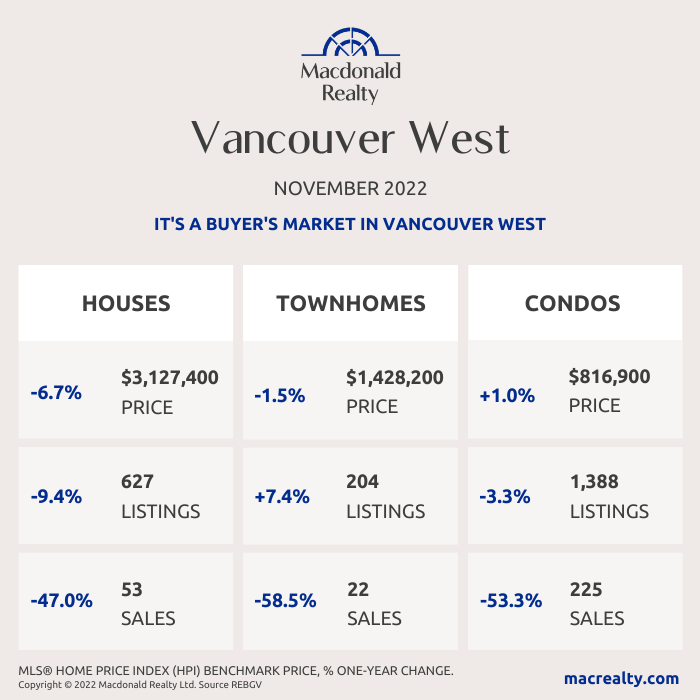
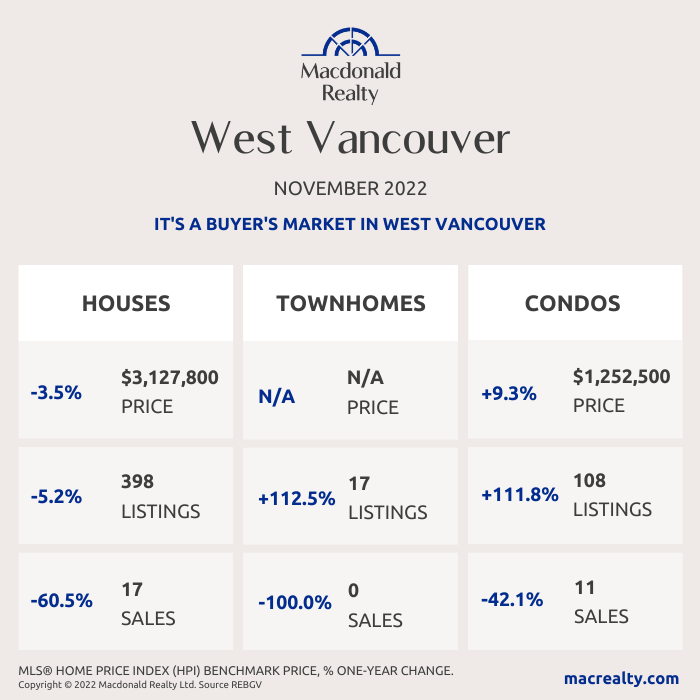
Here are the latest real estate market statistics from Macdonald Realty on the Greater Vancouver listings and sales in November 2022. Find all the infographics by visiting the Facebook Album.
While typically a quiet month of market activity based on seasonal patterns, November home sale and listing totals lagged below the region’s long-term averages.
The Real Estate Board of Greater Vancouver (REBGV) reports that residential home sales in the region totalled 1,614 in November 2022, a 52.9 per cent decrease from the 3,428 sales recorded in November 2021, and a 15.2 per cent decrease from the 1,903 homes sold in October 2022.
Last month’s sales were 36.9 per cent below the 10-year November sales average.
“With the most recent core inflation metrics showing a stubborn reluctance to respond significantly to the furious pace of rate increases, the Bank of Canada may choose to act more forcefully to bring inflation back toward target levels.” Andrew Lis, REBGV’s director, economics and data analytics said. “While it’s always difficult to predict what the bank will do with certainty, this persistent inflationary backdrop sets up the December 7* rate announcement to be yet another increase, making holiday-season home purchases something many people may end up foregoing this year.”
There were 3,055 detached, attached and apartment properties newly listed for sale on the Multiple Listing Service® (MLS®) in Metro Vancouver in November 2022. This represents a 22.9 per cent decrease compared to the 3,964 homes listed in November 2021 and a 24.2 per cent decrease compared to October 2022 when sellers listed 4,033 homes.
The total number of homes currently listed for sale on the MLS® system in Metro Vancouver is 9,179, a 28.5 per cent increase compared to November 2021 (7,144) and a 6.8 per cent decrease compared to October 2022 (9,852).
*Areas covered by the Real Estate Board of Greater Vancouver include Burnaby, Coquitlam, Maple Ridge, New Westminster, North Vancouver, Pitt Meadows, Port Coquitlam, Port Moody, Richmond, South Delta, Squamish, Sunshine Coast, Vancouver, West Vancouver, and Whistler. Check out the infographics of Squamish, Sunshine Coast and Whistler, HERE.
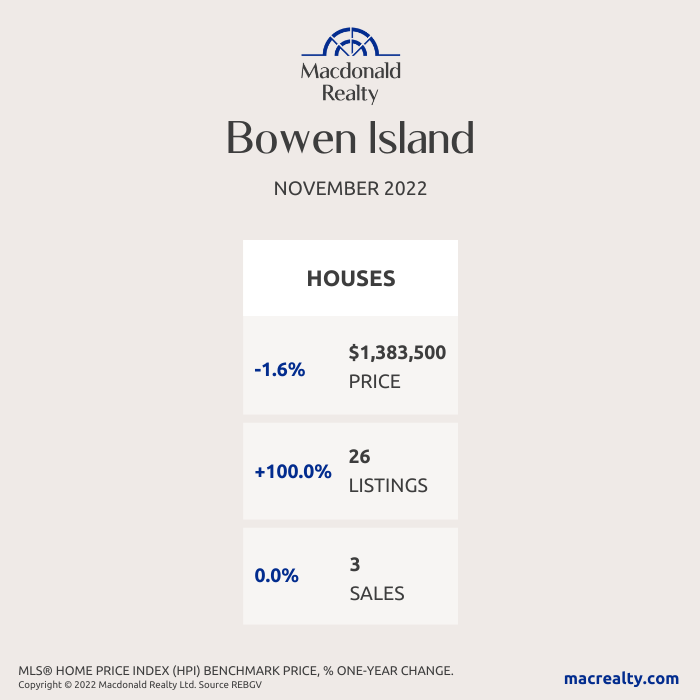
Bowen Island
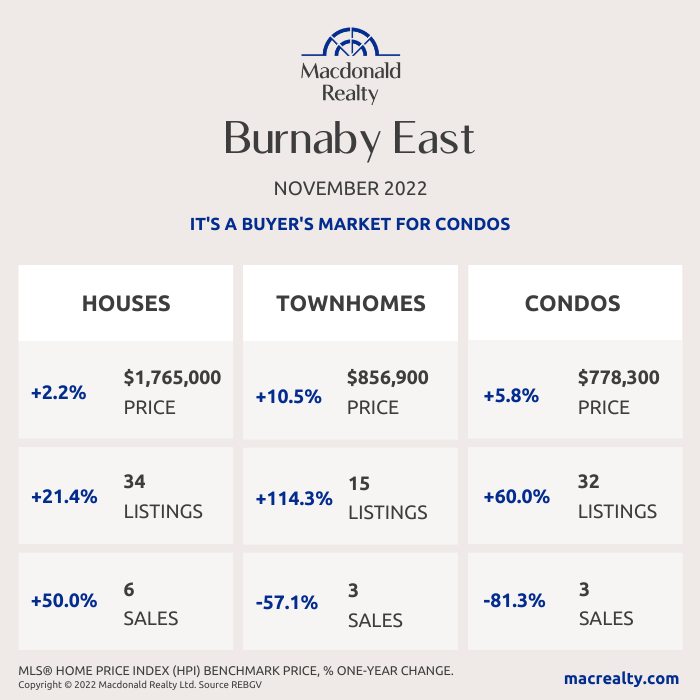
Burnaby East
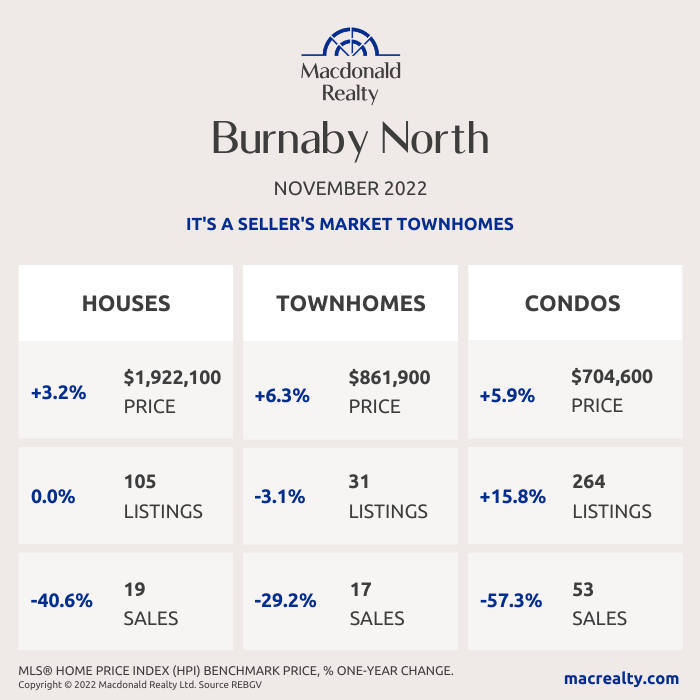
Burnaby North
Burnaby South
Ladner
Maple Ridge
New Westminster
North Vancouver
Pitt Meadows
Coquitlam

Port Coquitlam
Port Moody
Richmond
Tsawwassen
Vancouver East
Vancouver West
West Vancouver
Looking for more information about the real estate market in specific neighbourhoods in the Greater Vancouver?
Macdonald Realty has offices across the Greater Vancouver. Please email [email protected] or call 1-877-278-3888 to be matched with a REALTOR® working in your area.
MLS® Home Price Index (HPI) Benchmark Price
Average and median home prices are often misinterpreted, are affected by change in the mix of homes sold, and can swing dramatically from month to month (based on the types and prices of properties that sold in a given month). The MLS® HPI overcomes these shortcomings and uses the concept of a benchmark home, a notional home with common attributes of typical homes in a defined area. Visit www.housepriceindex.ca for more information.
This blog post is based on market data provided by the Real Estate Board of Greater Vancouver (REBGV) www.rebgv.org

