by Macrealty Marketing Team | Jun 8, 2022 | Market Updates
Here are the latest real estate market statistics from Macdonald Realty on the Greater Vancouver listings and sales in May 2022. Find all the infographics by visiting the Facebook Album.
After reaching record-setting levels in 2021, home sale activity has returned to more typical seasonal levels in Metro Vancouver* this spring due, in large part, to rising interest rates.
The Real Estate Board of Greater Vancouver (REBGV) reports that residential home sales in the region totalled 2,918 in May 2022, a 31.6 per cent decrease from the 4,268 sales recorded in May 2021, and a 9.7 per cent decrease from the 3,232 homes sold in April 2022.
Last month’s sales were 12.9 per cent below the 10-year May sales average.
“With interest rates rising, home buyers are taking more time to make their decisions in today’s housing market,” said Daniel John, REBGV Chair. “Home buyers have been operating in a frenzied environment for much of the past two years. This spring is providing a calmer environment, with fewer multiple offer situations, which is allowing buyers to explore their housing options, understand the changing mortgage market, and do their due diligence.”
*Areas covered by the Real Estate Board of Greater Vancouver include Burnaby, Coquitlam, Maple Ridge, New Westminster, North Vancouver, Pitt Meadows, Port Coquitlam, Port Moody, Richmond, South Delta, Squamish, Sunshine Coast, Vancouver, West Vancouver, and Whistler. Check out the infographics of Squamish, Sunshine Coast and Whistler, HERE.
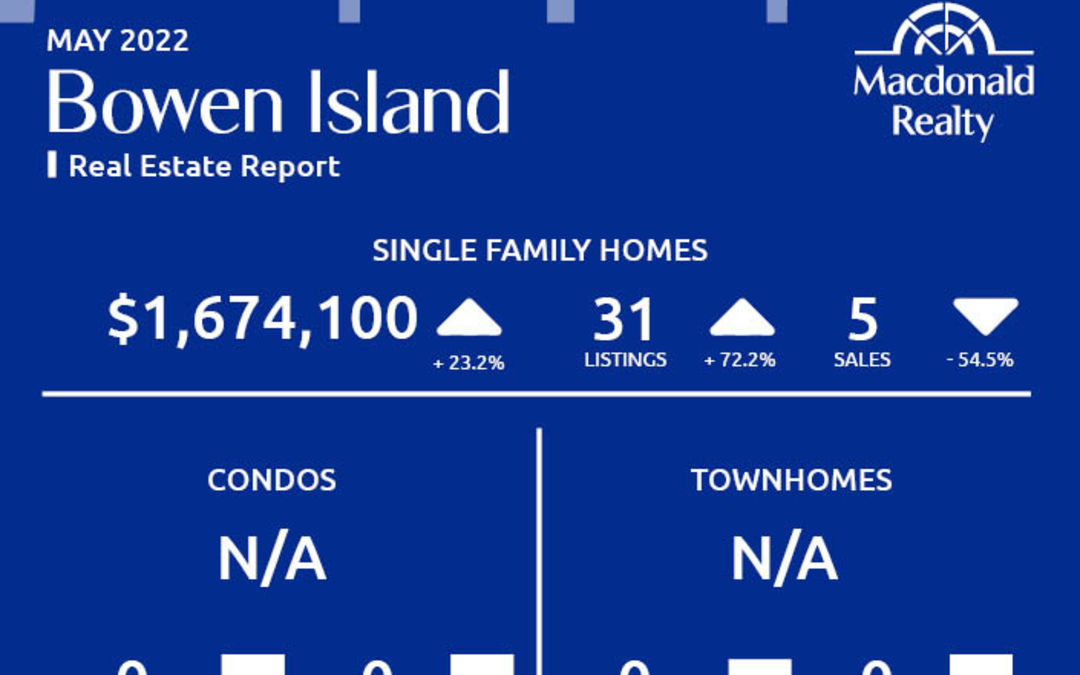
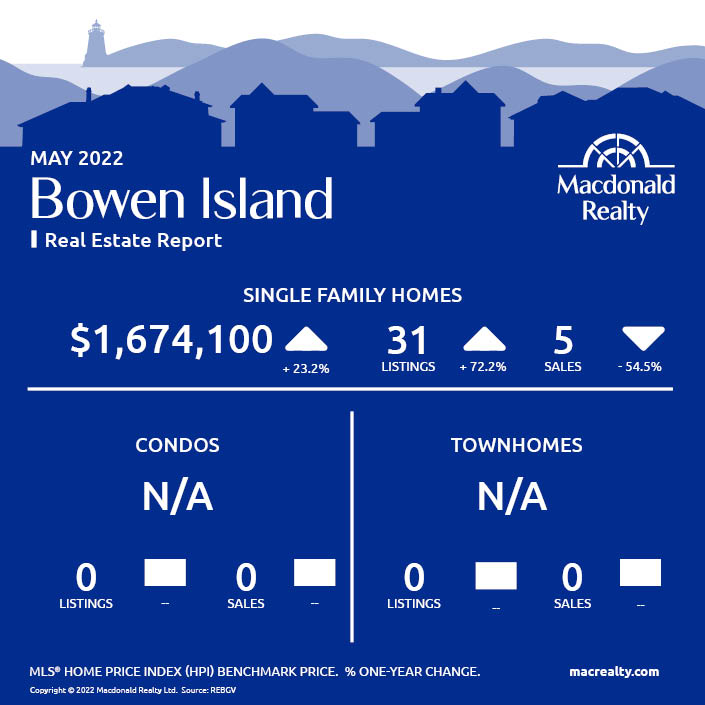
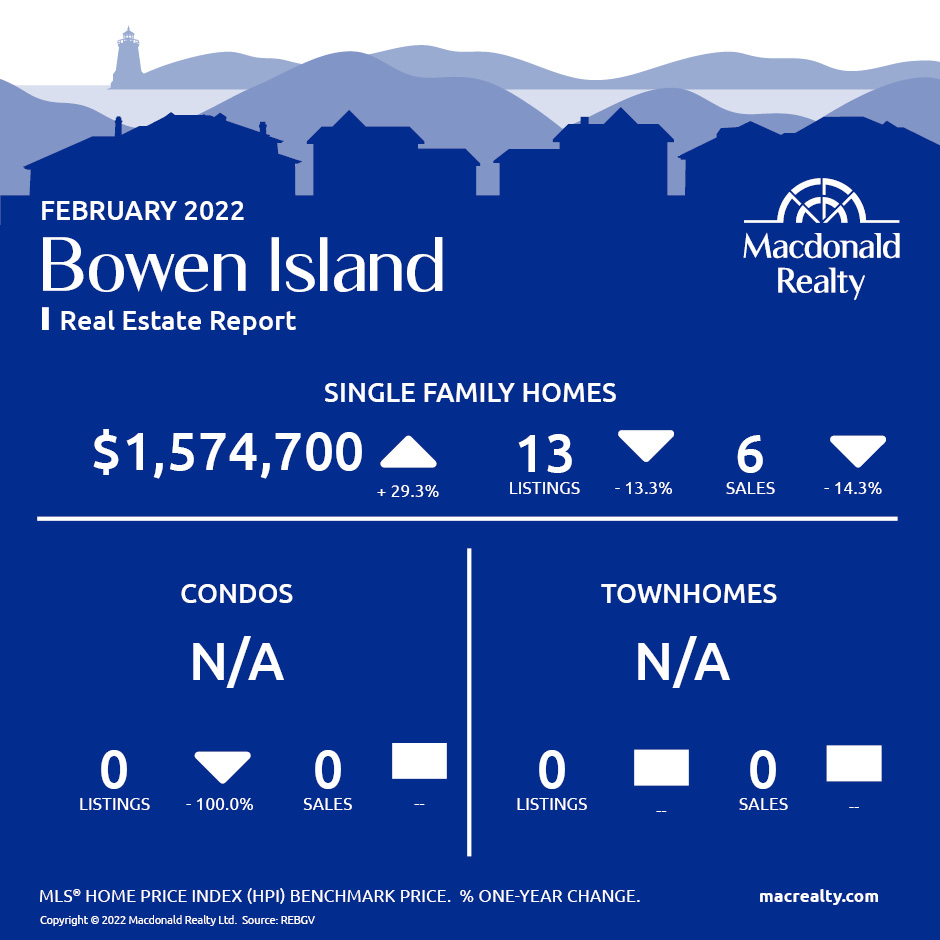
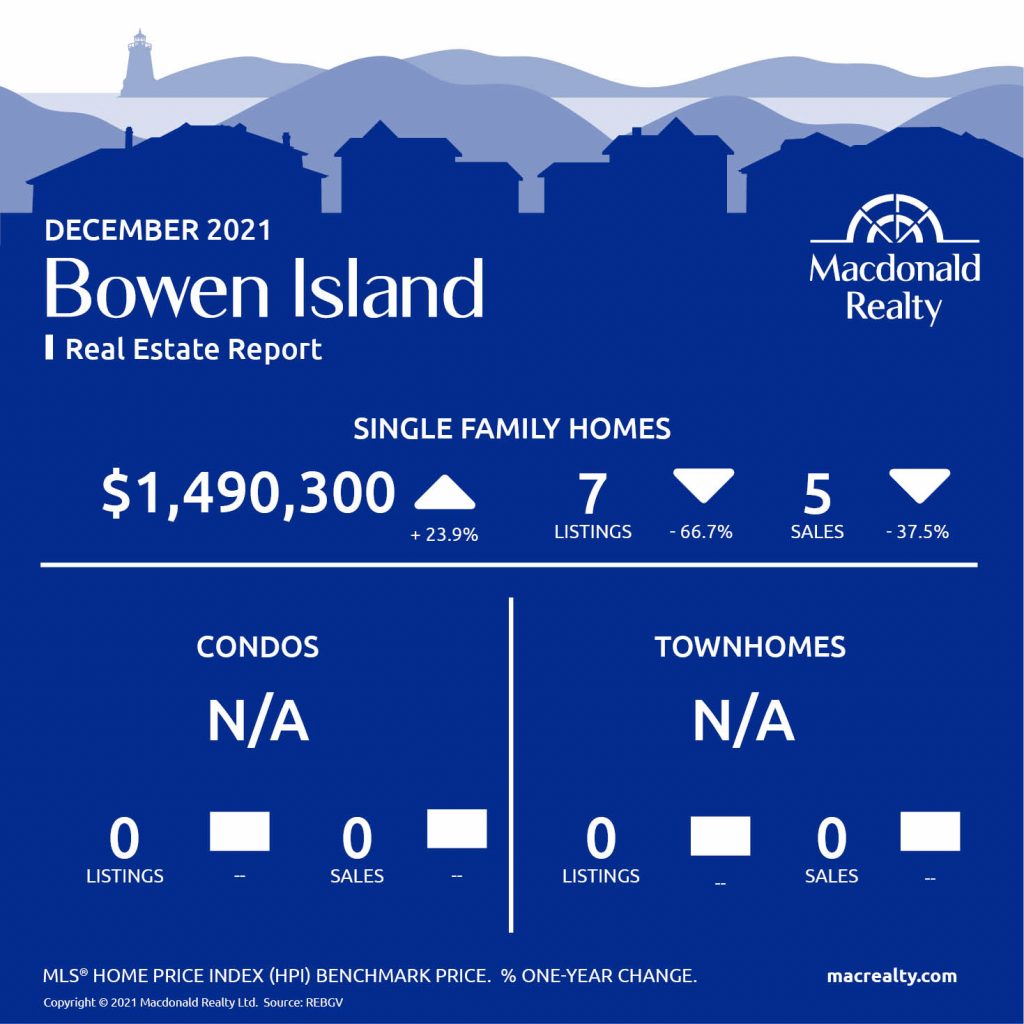
Bowen Island
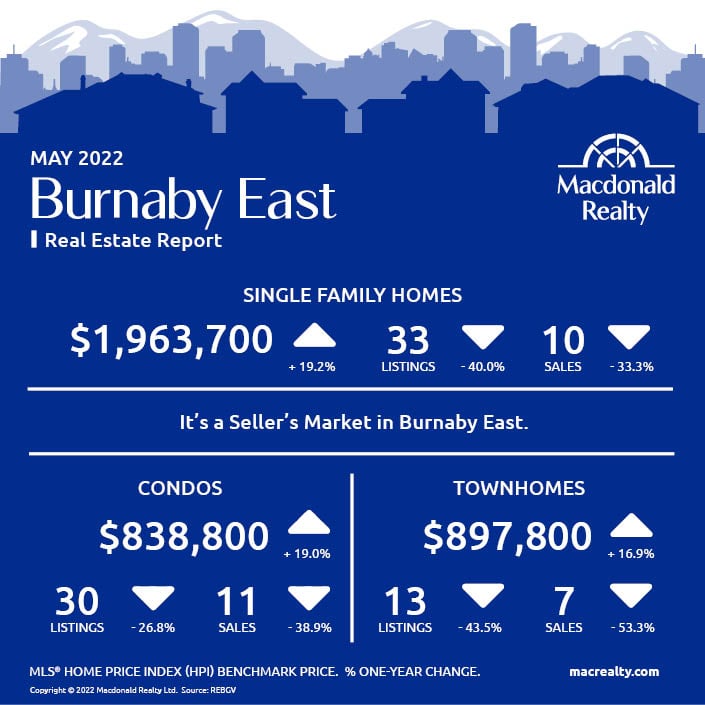
Burnaby East
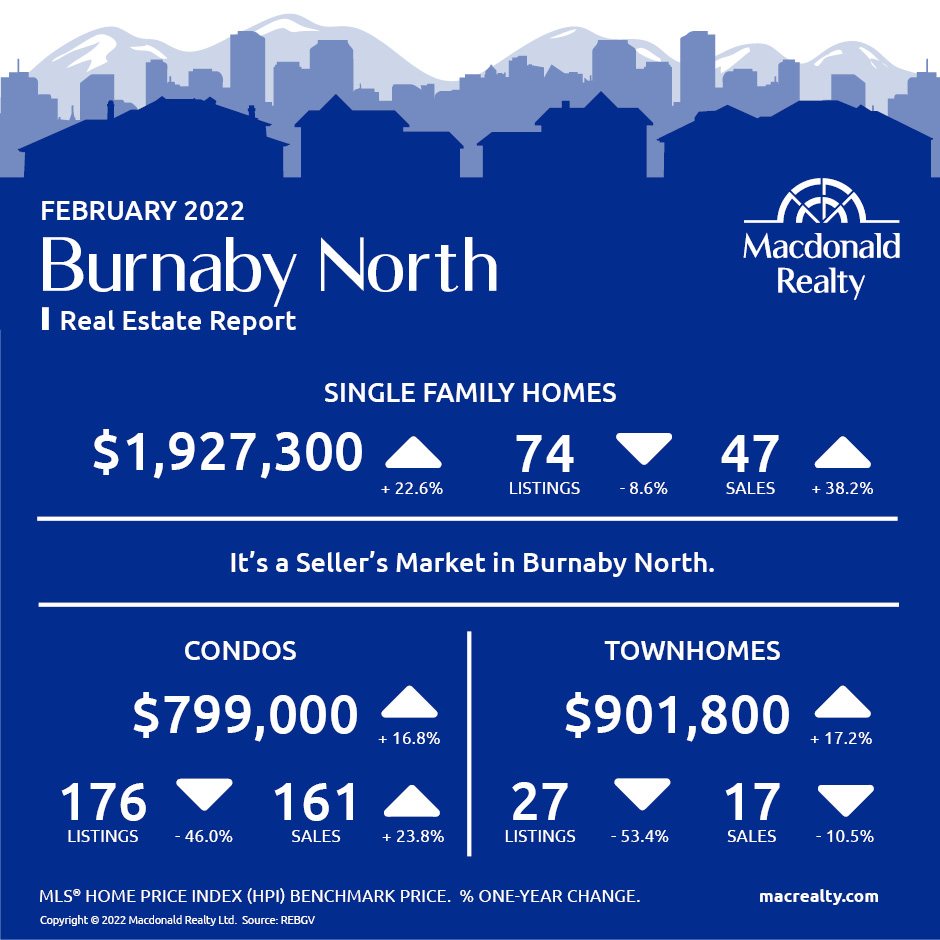
Burnaby North

Burnaby South

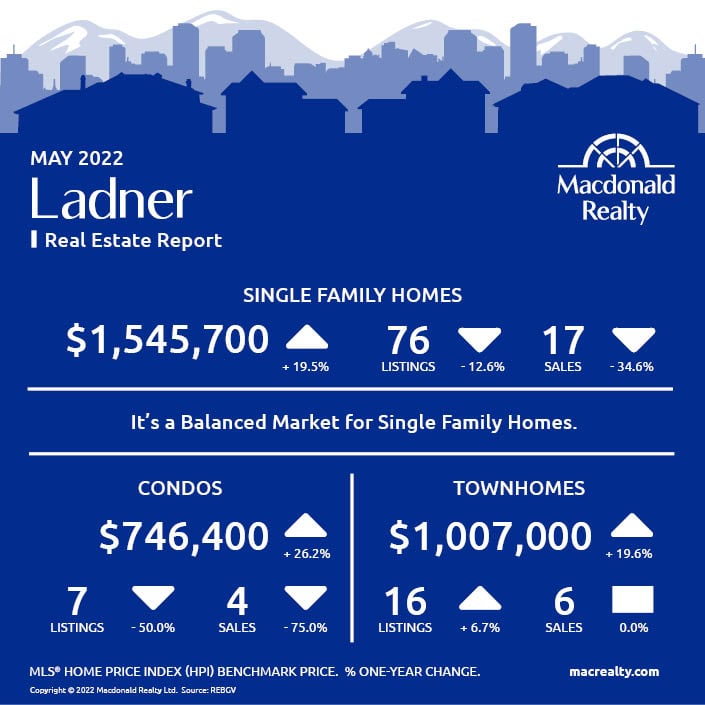
Ladner
Maple Ridge

New Westminster

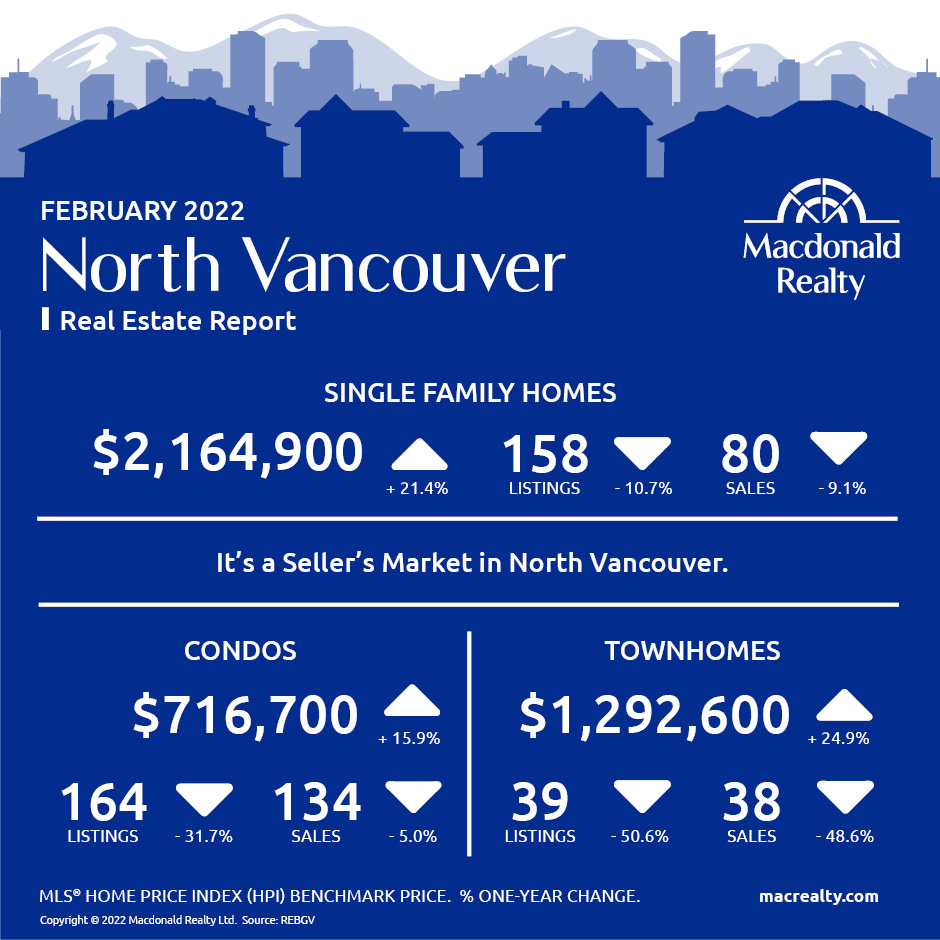
North Vancouver

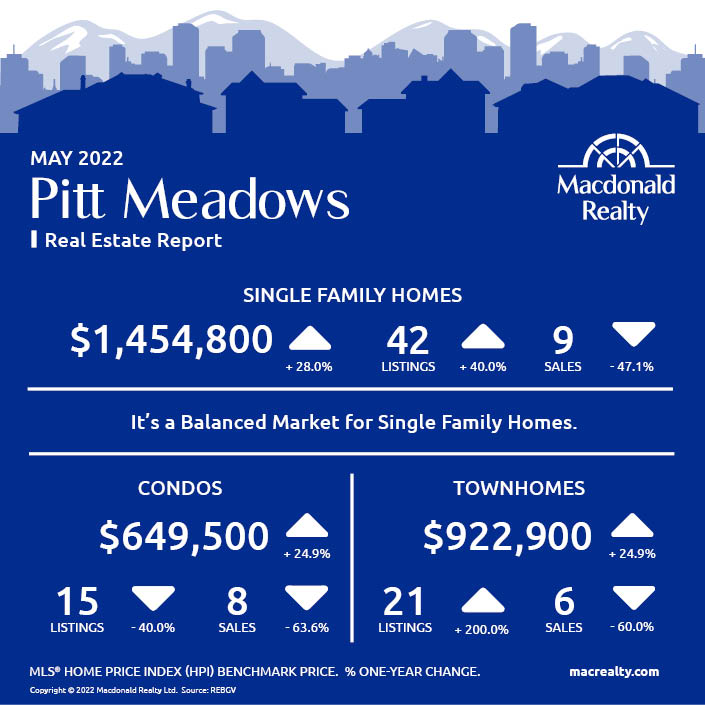
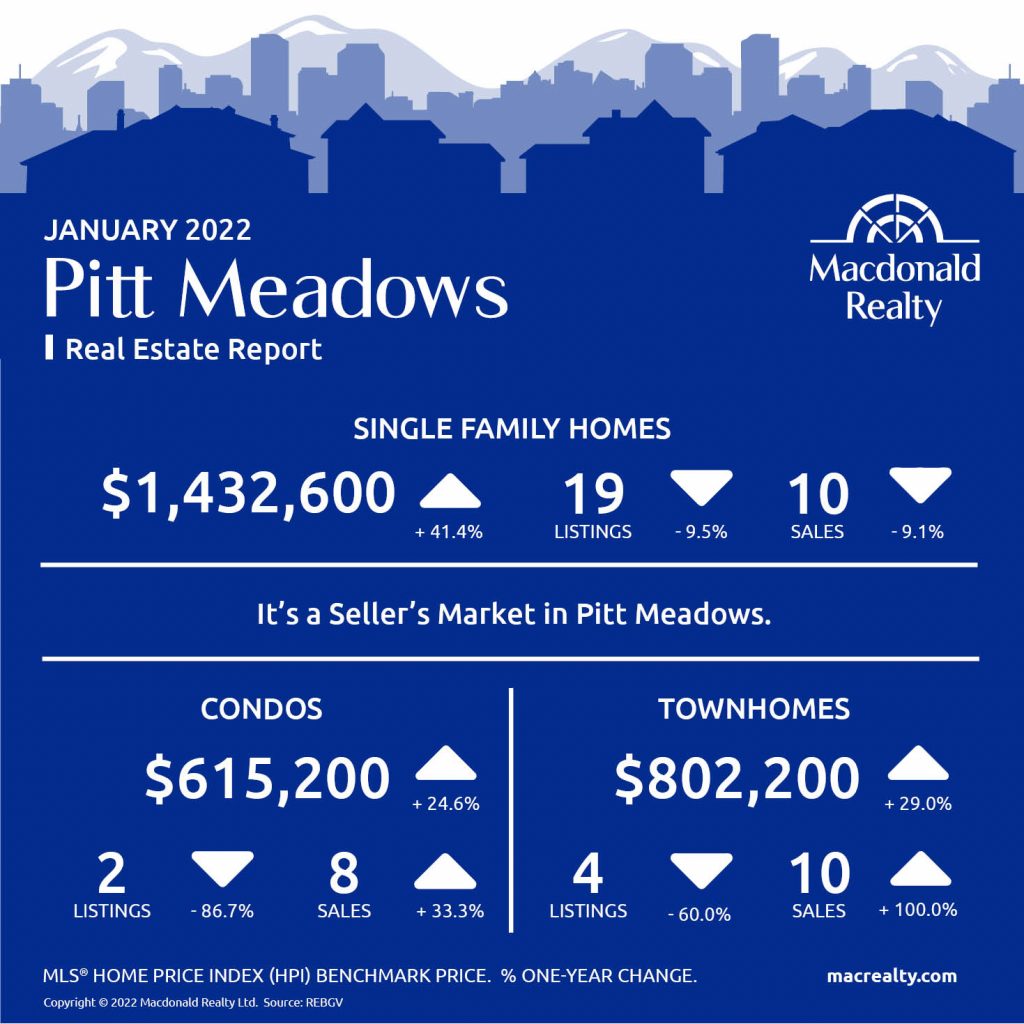
Pitt Meadows
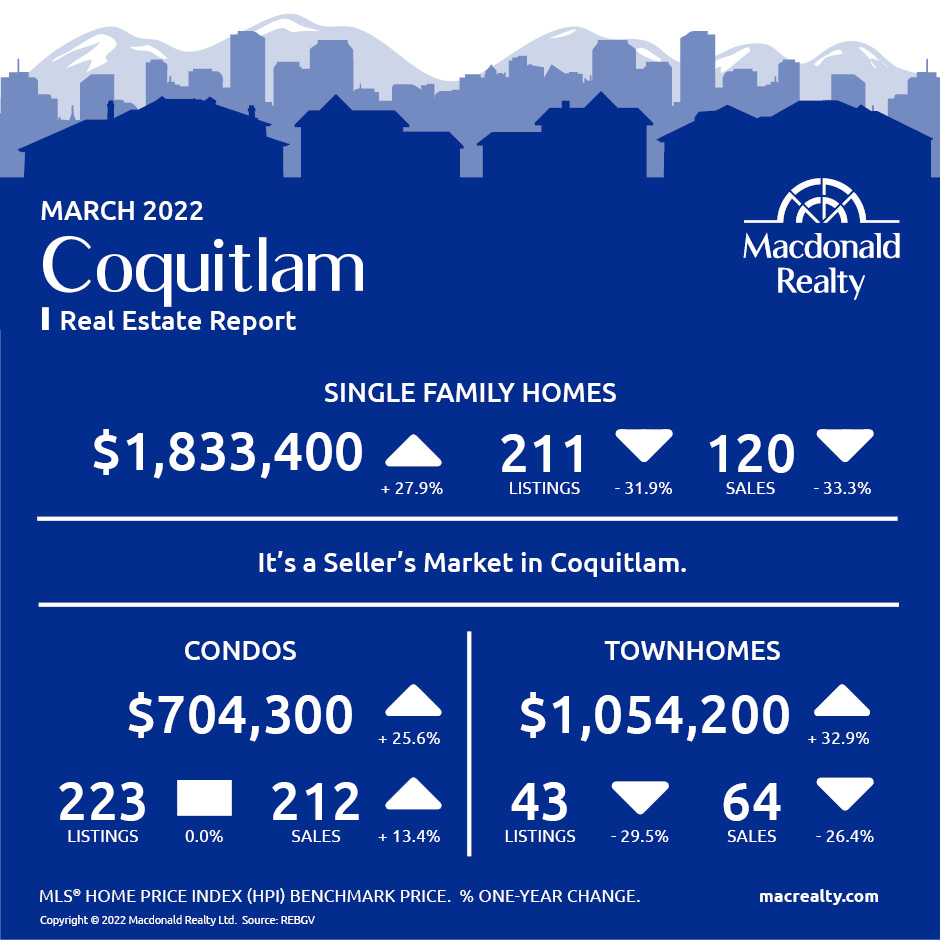
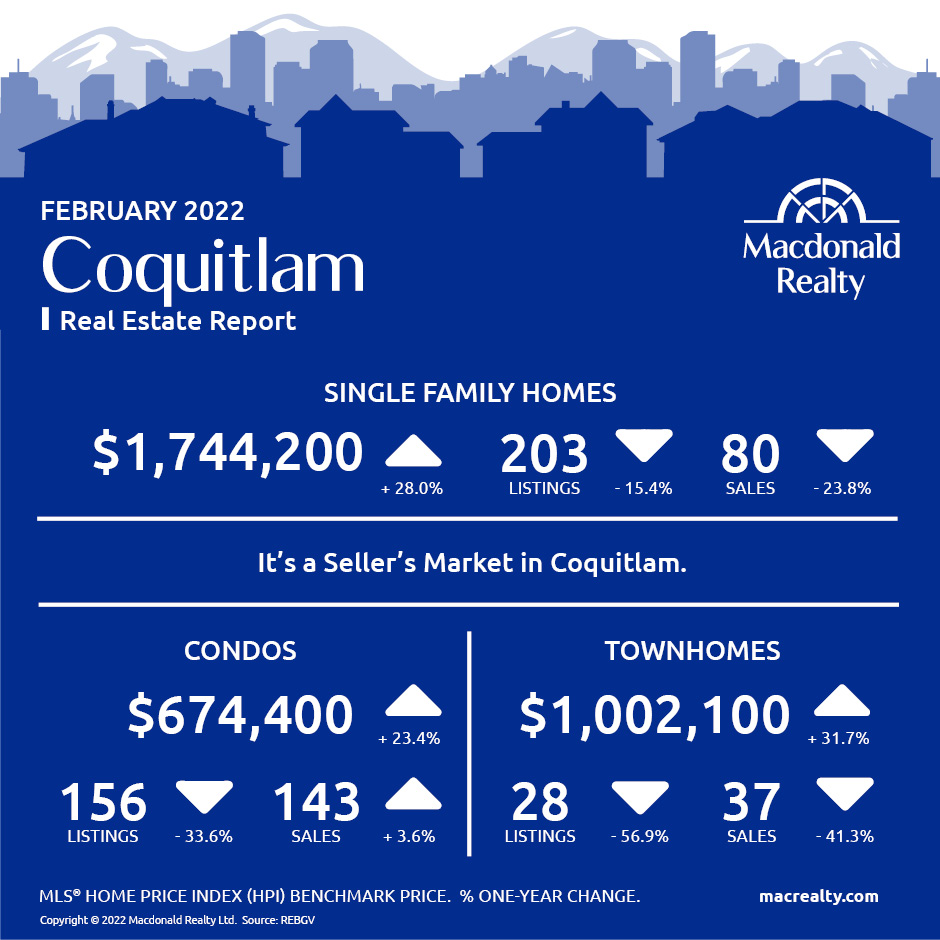
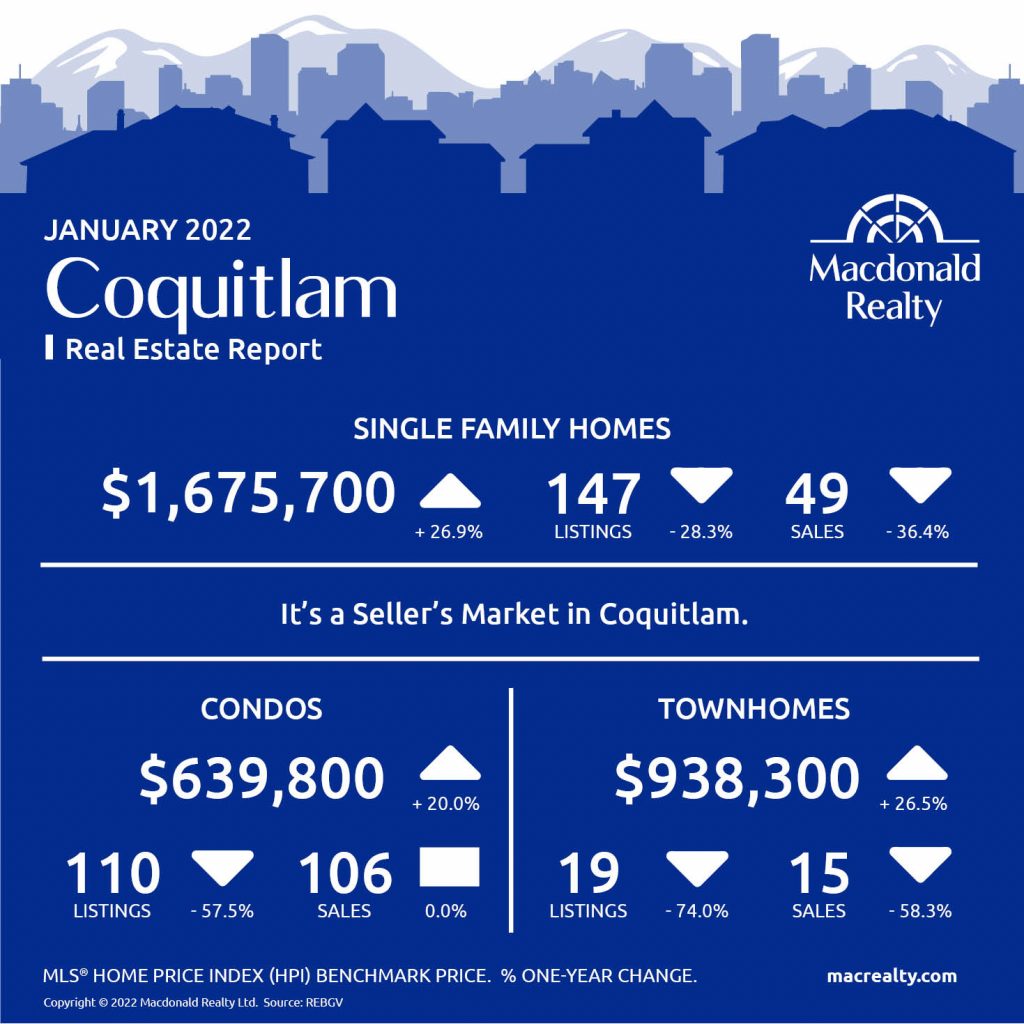
Coquitlam

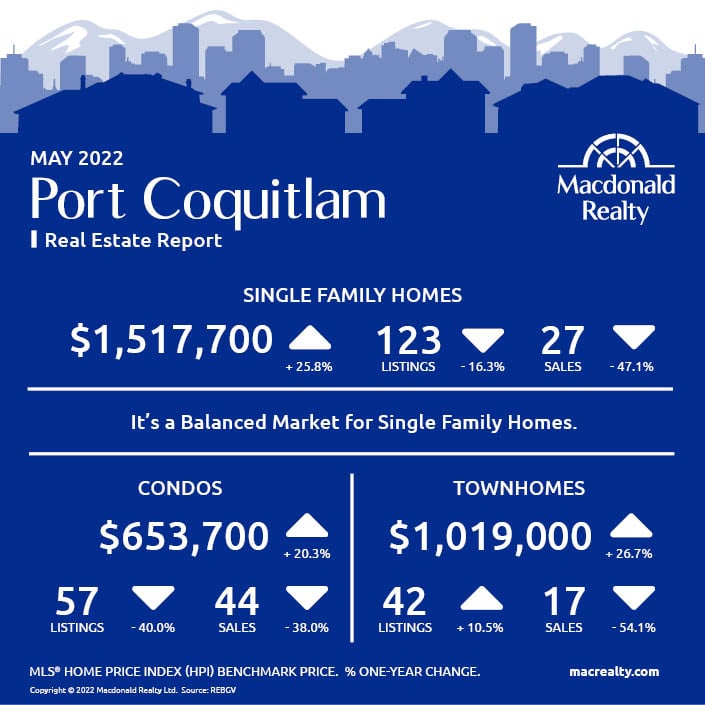
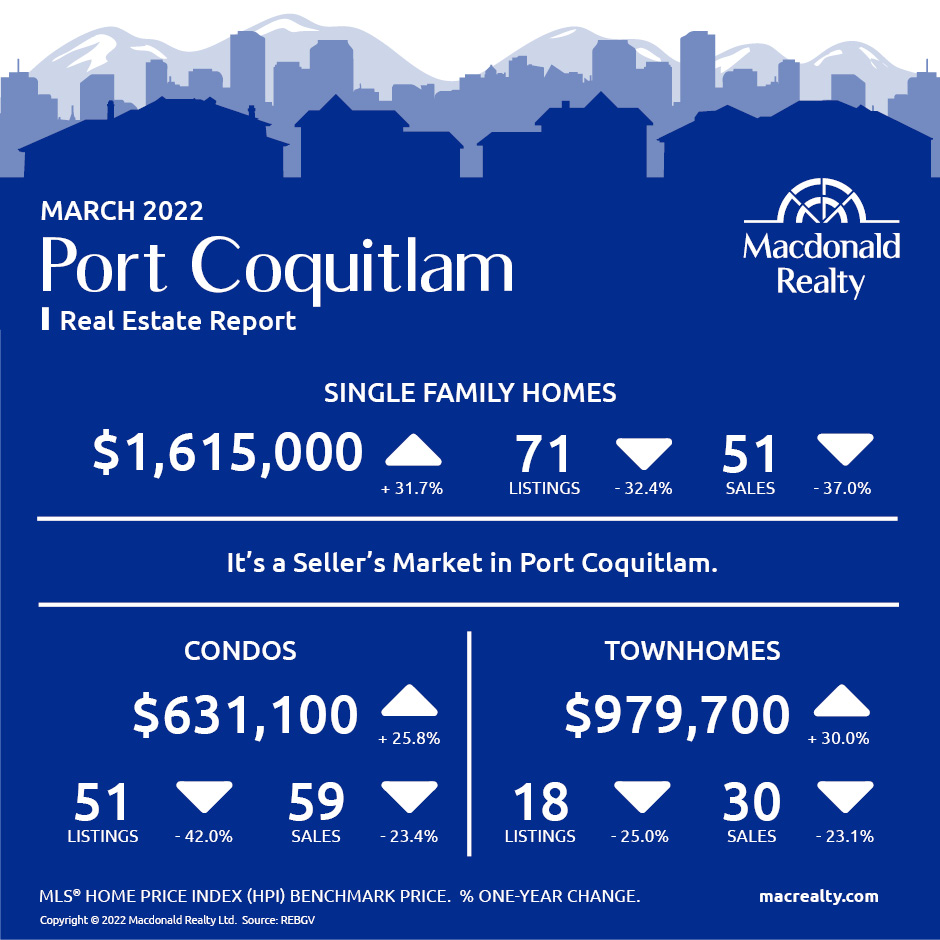
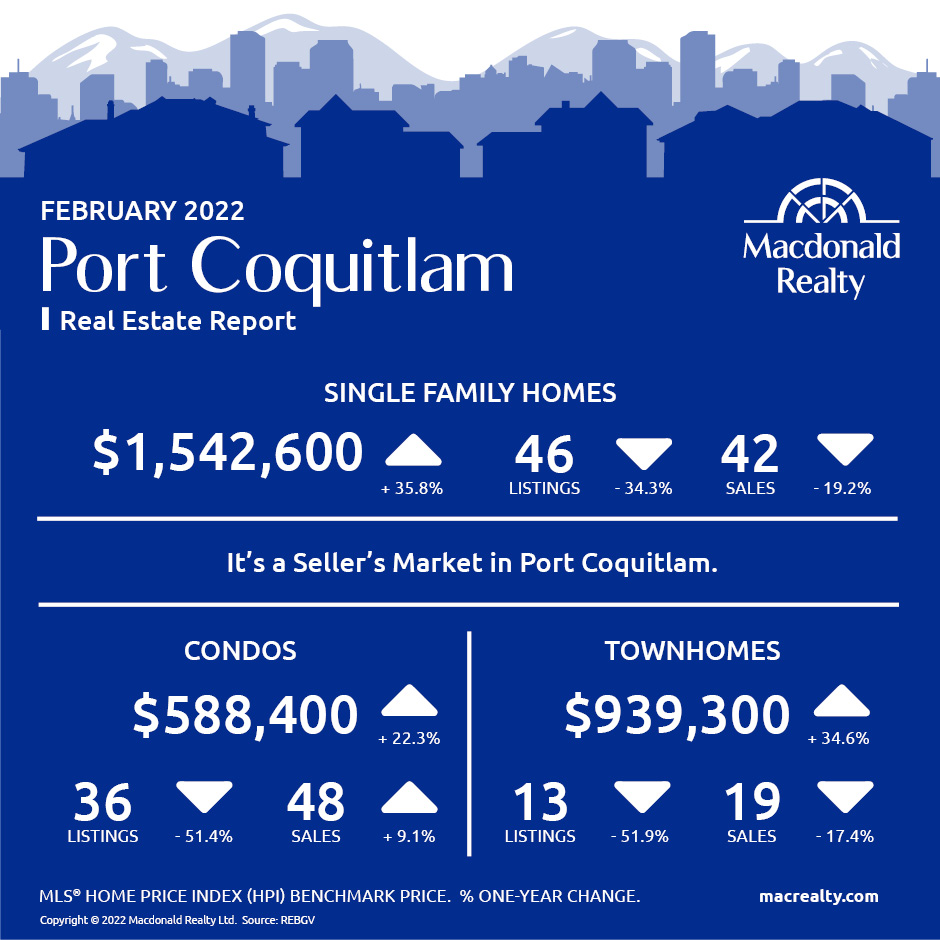
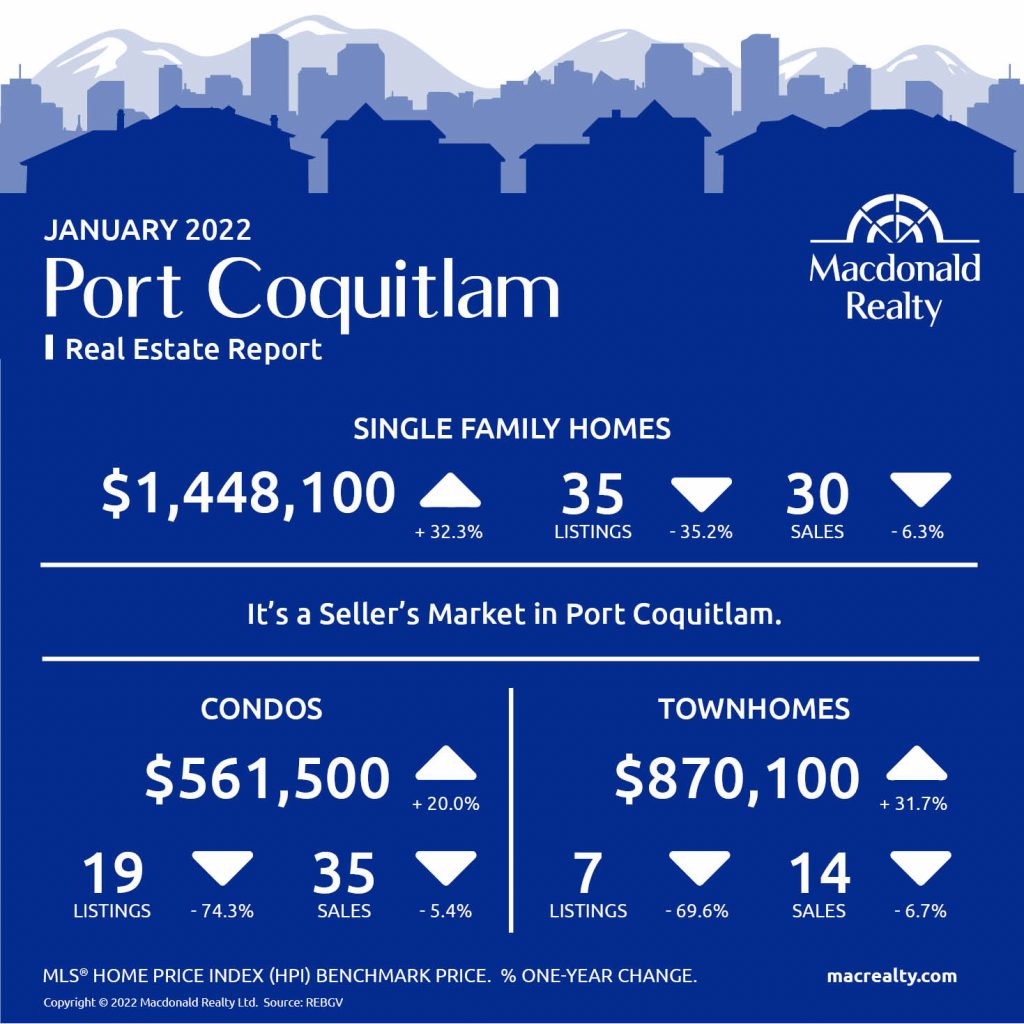
Port Coquitlam
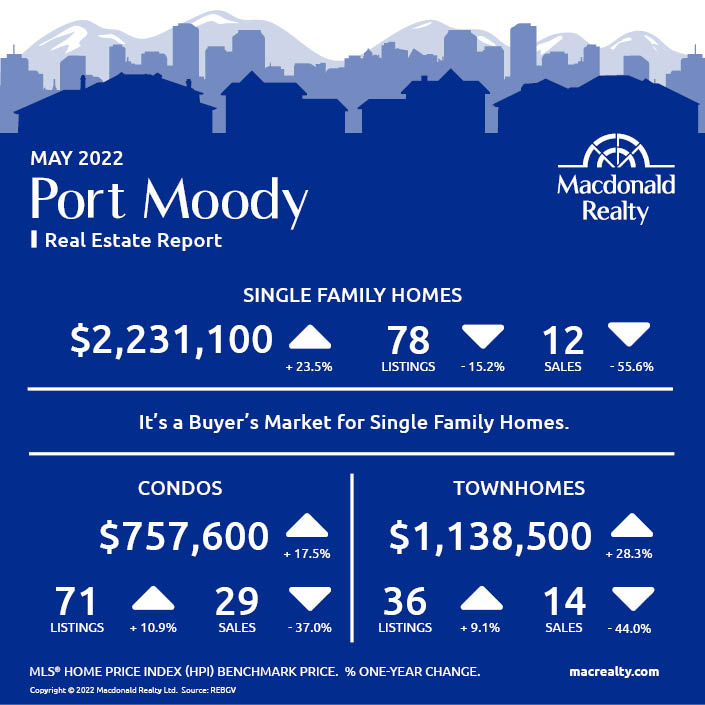
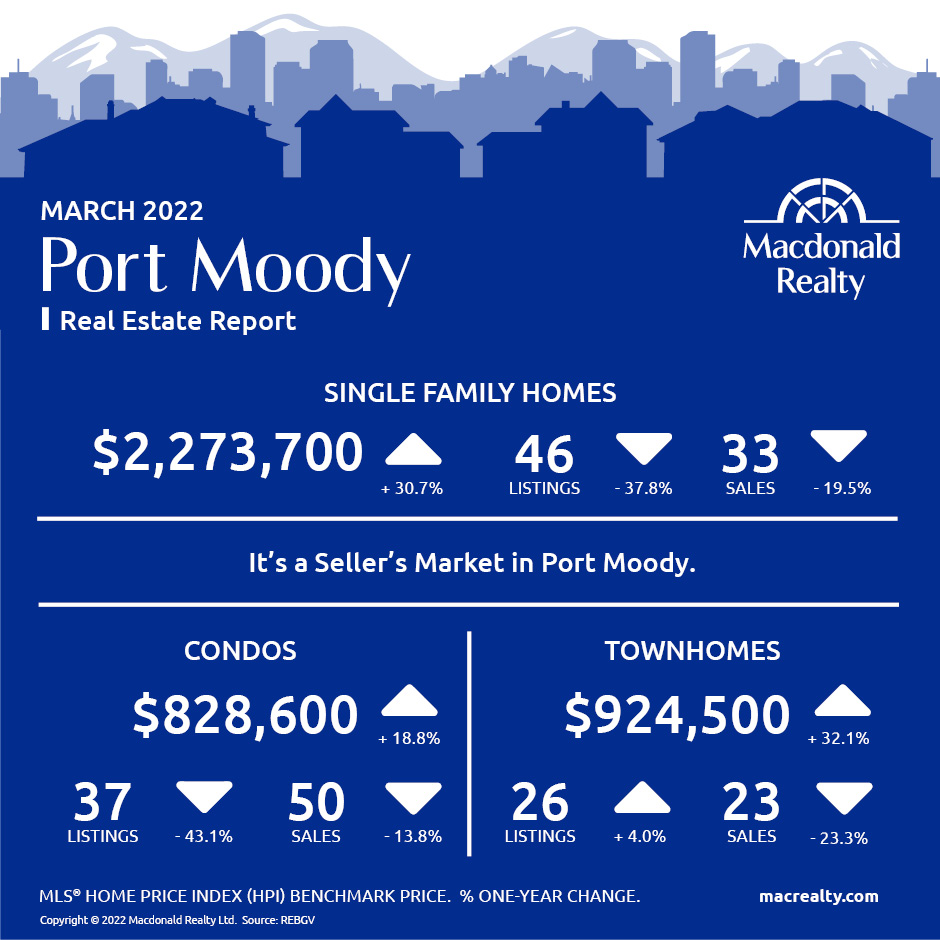
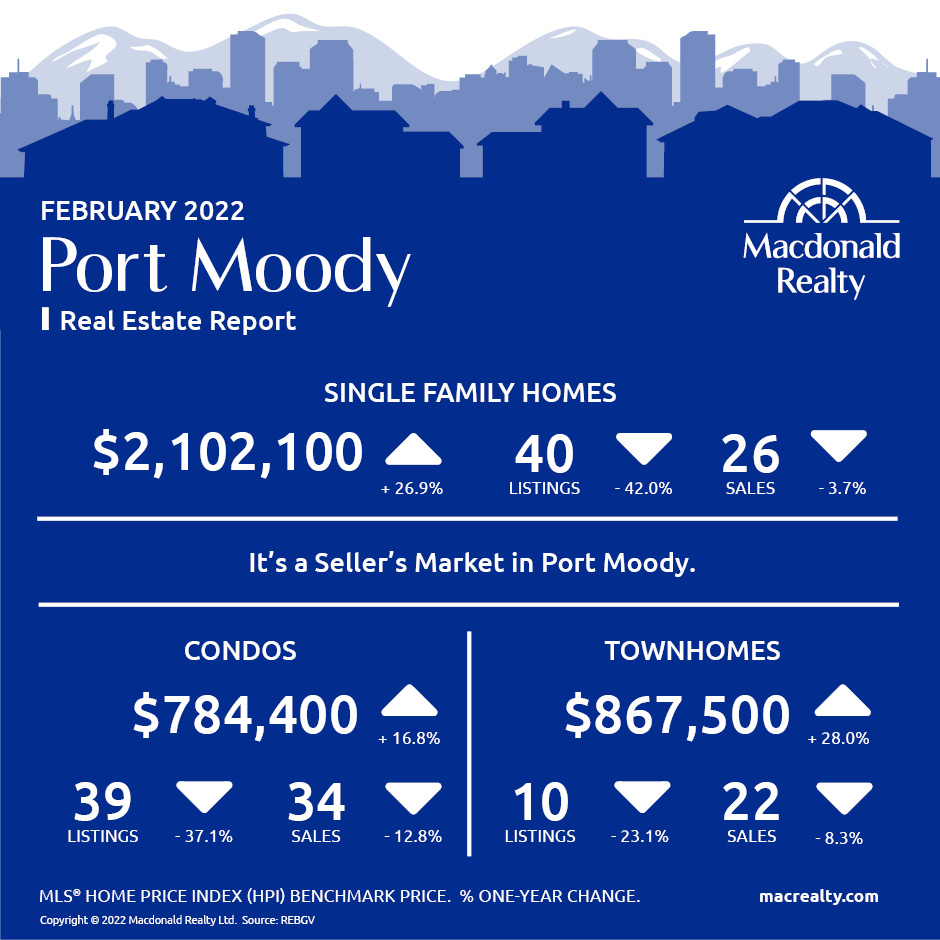
Port Moody
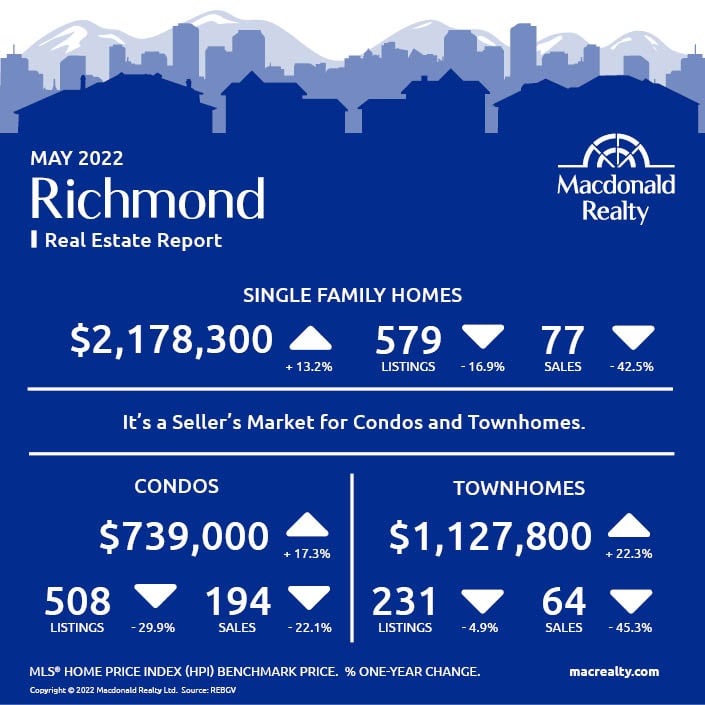
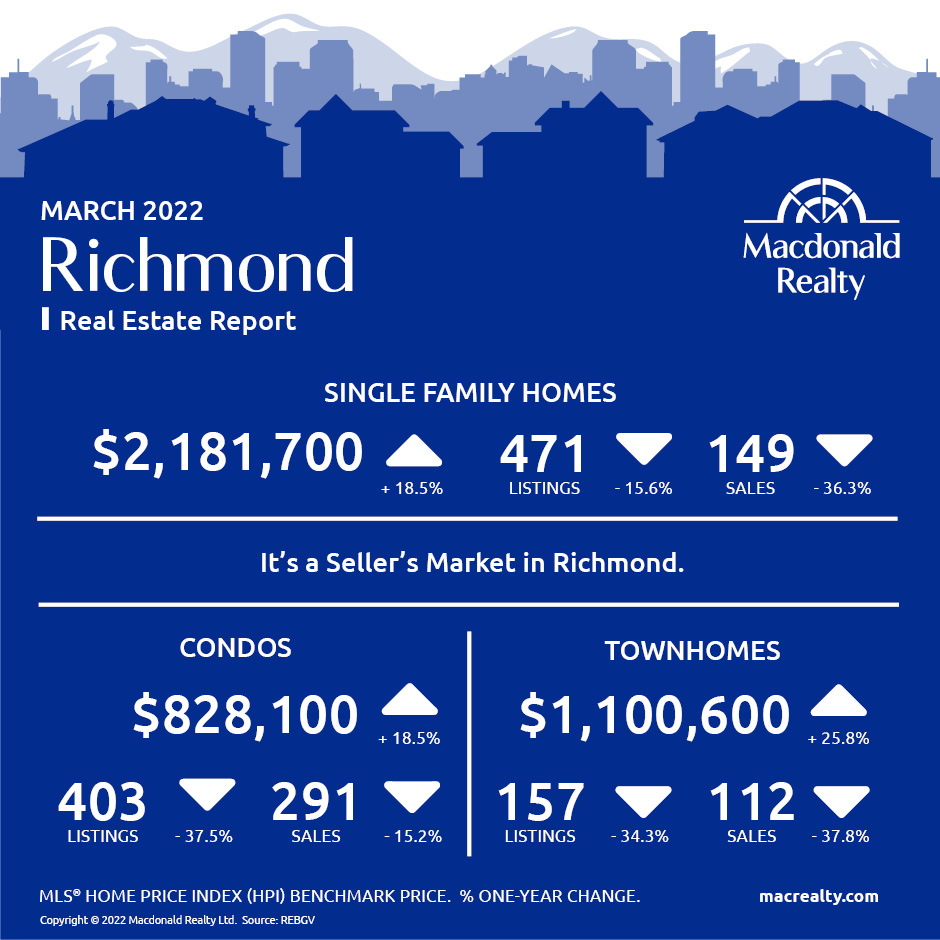
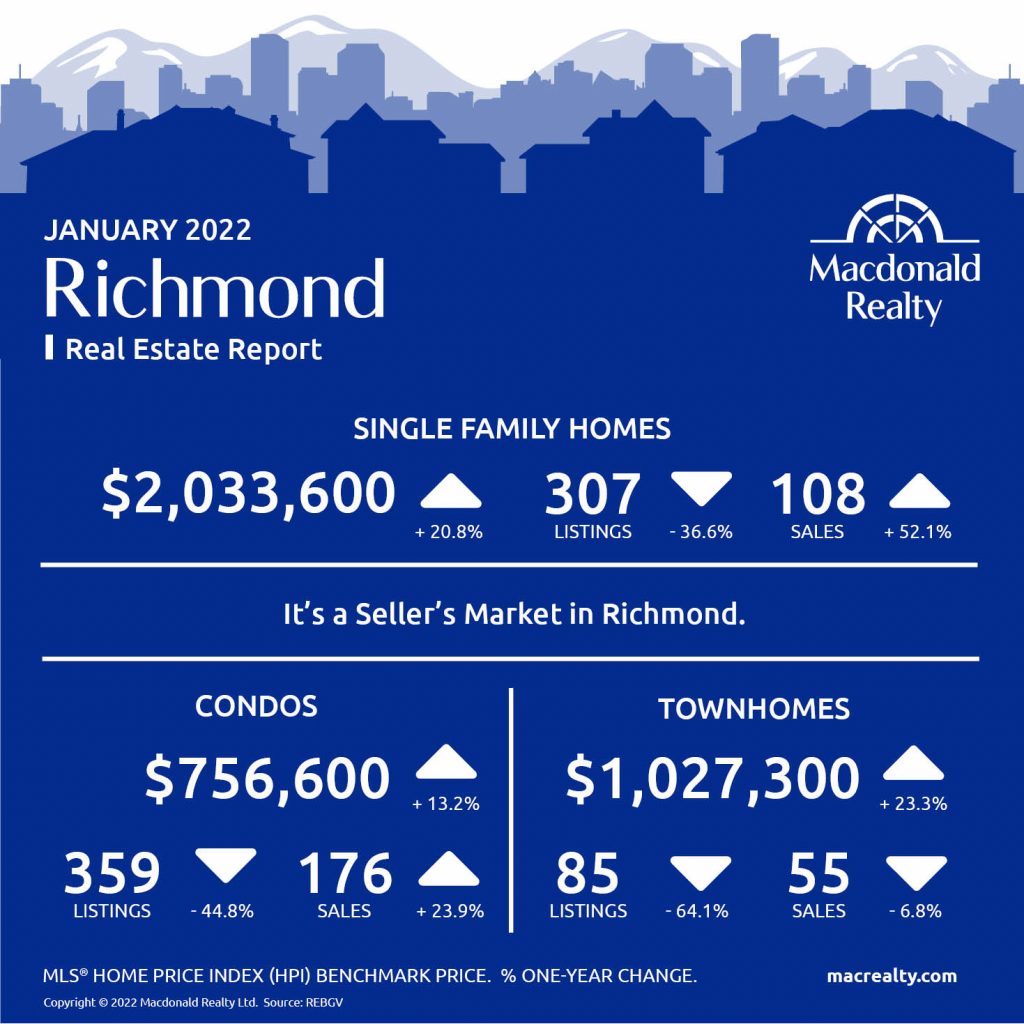
Richmond
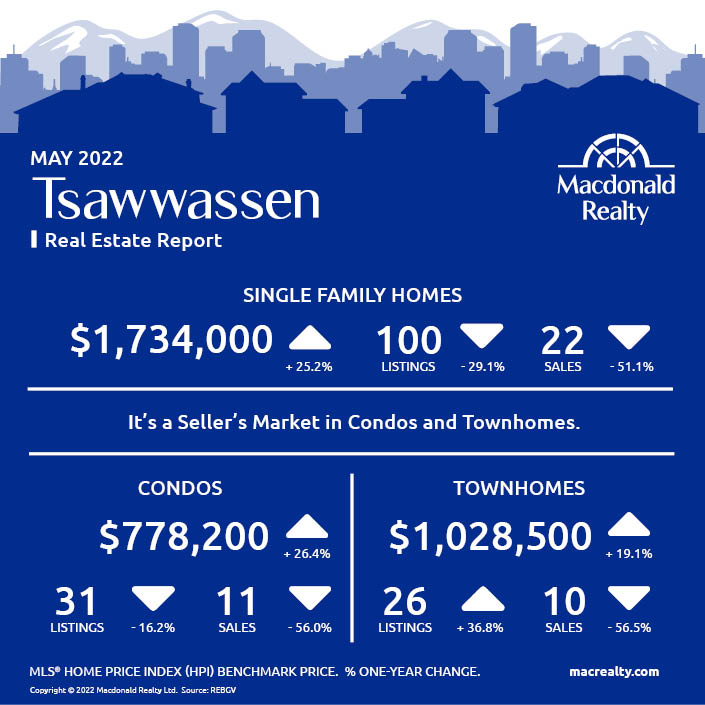
Tsawwassen
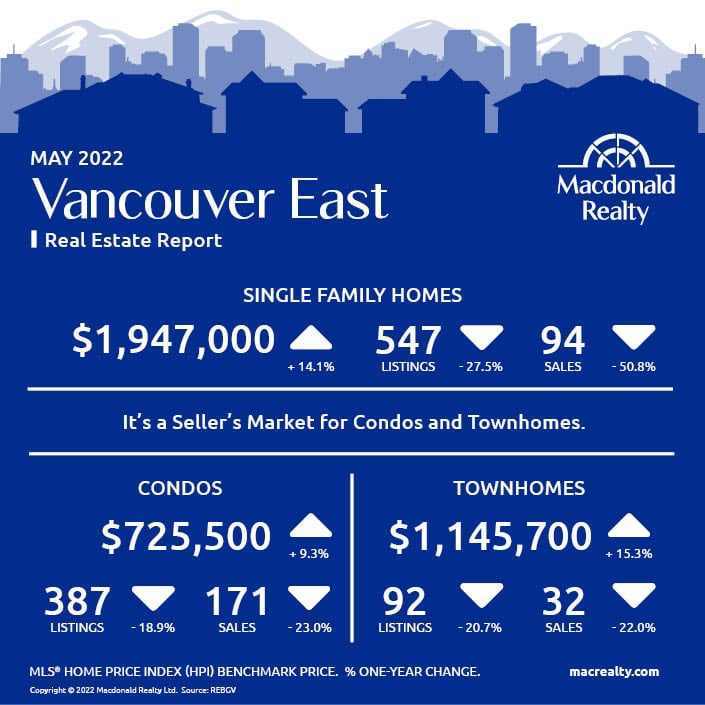
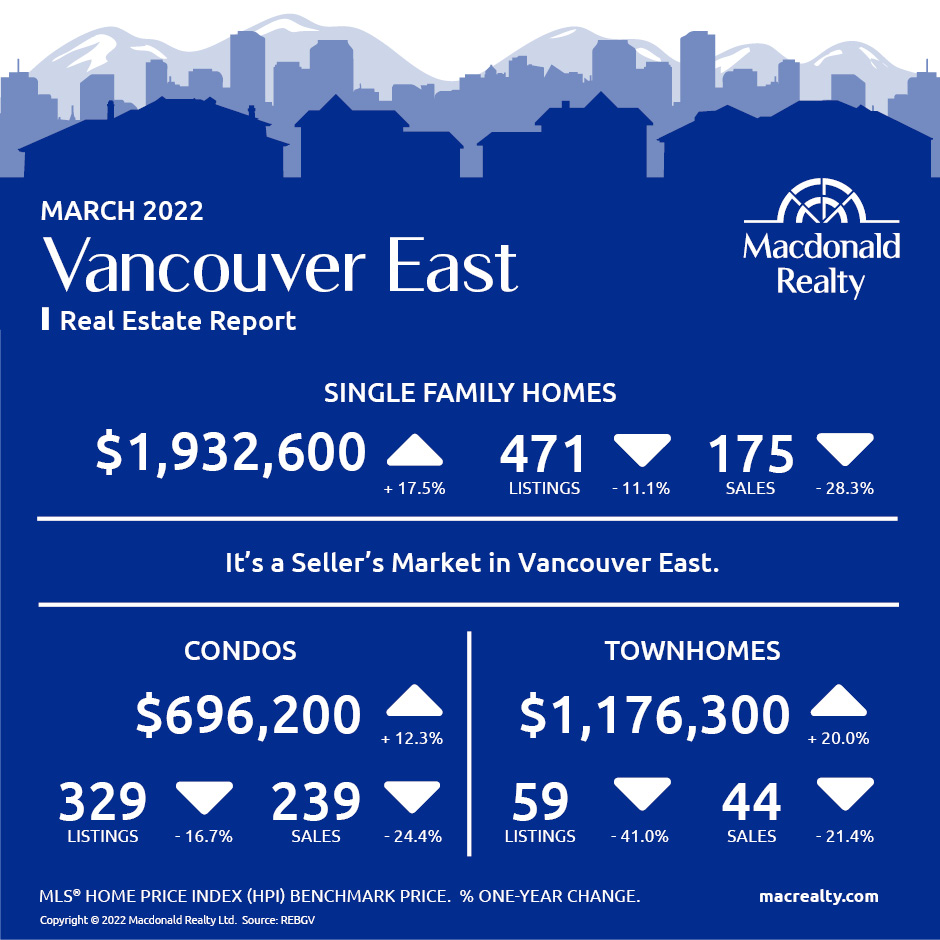
Vancouver East
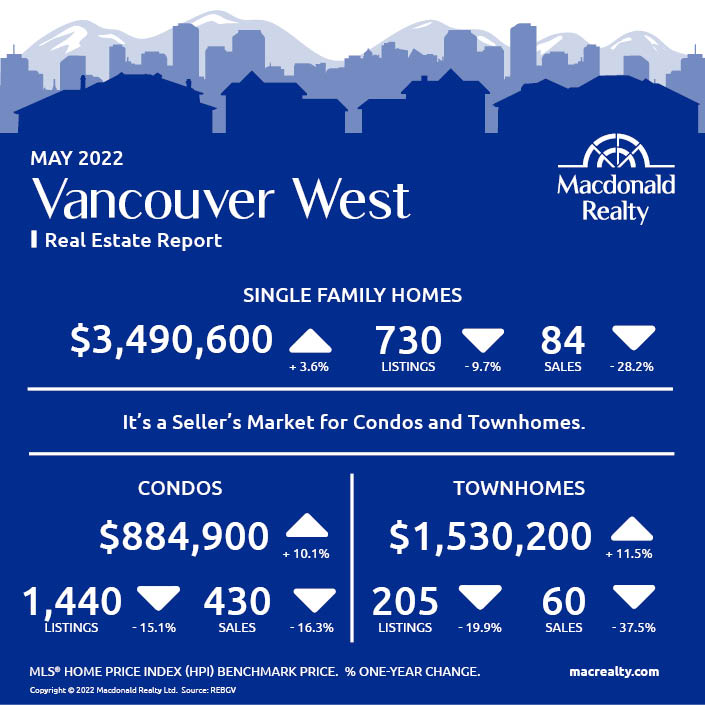
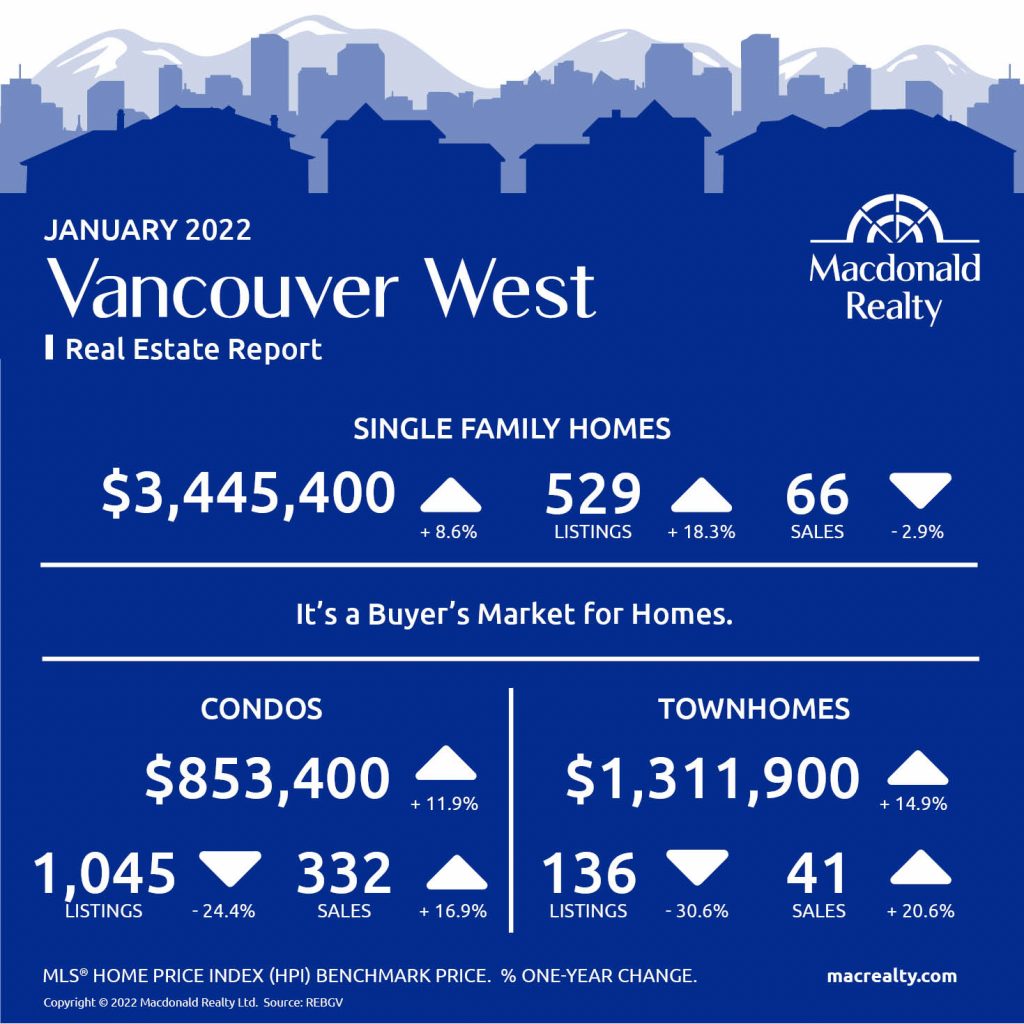
Vancouver West
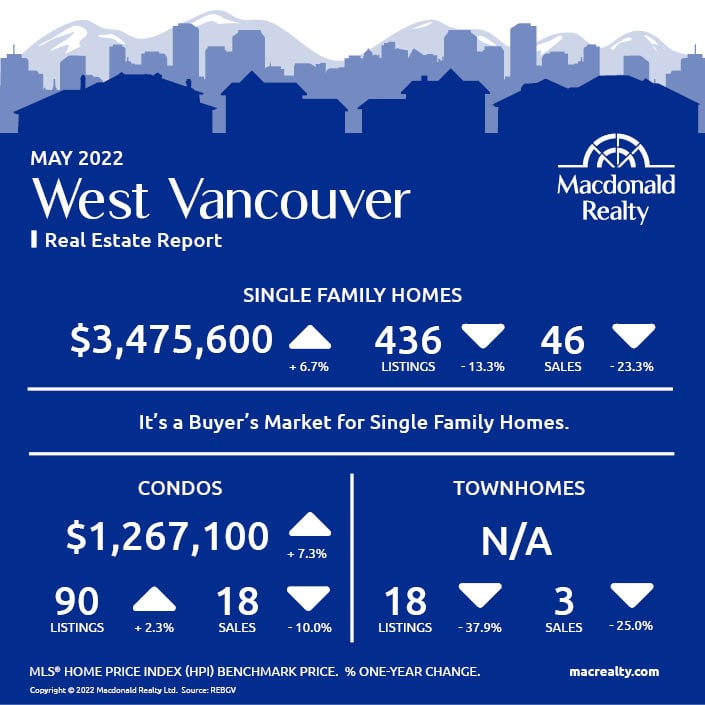
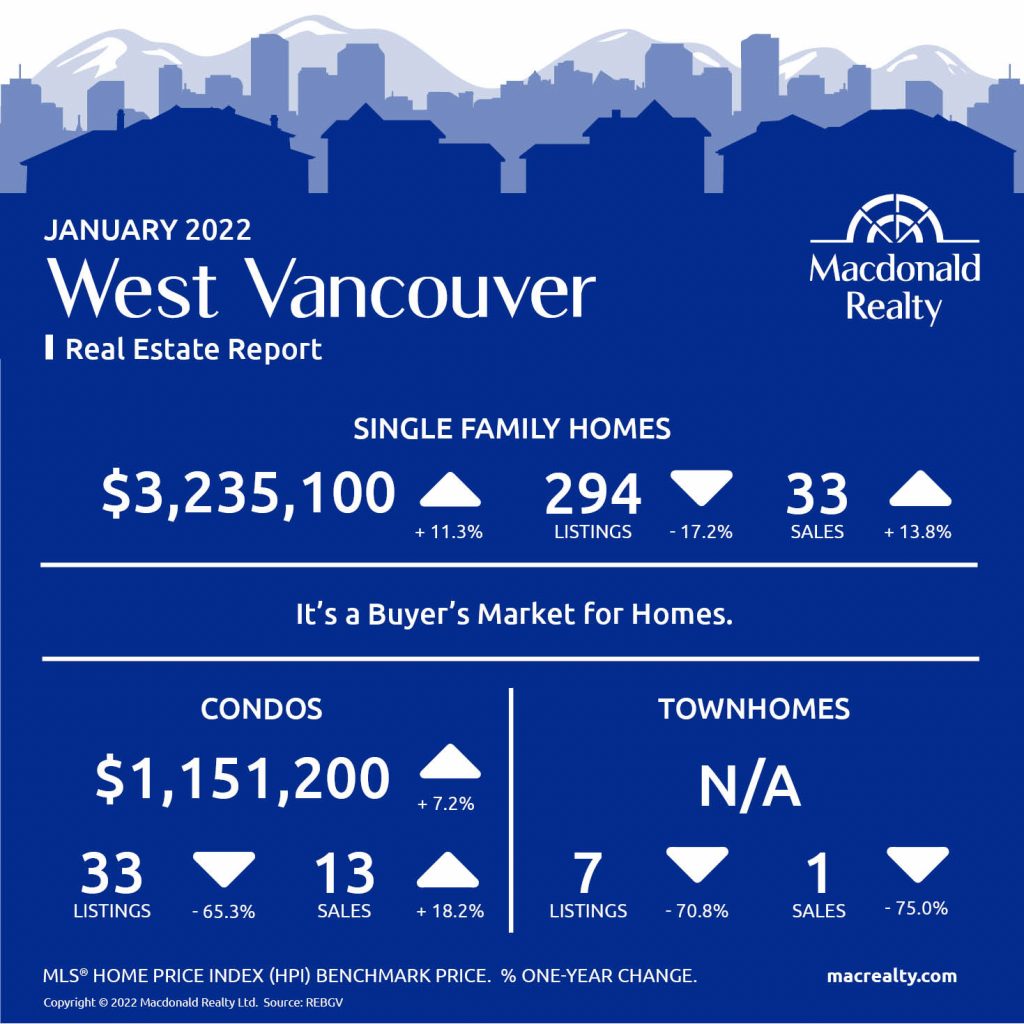
West Vancouver
Looking for more information about the real estate market in specific neighbourhoods in the Greater Vancouver?
Macdonald Realty has offices across the Greater Vancouver. Please email [email protected] or call 1-877-278-3888 to be matched with a REALTOR® working in your area.
MLS® Home Price Index (HPI) Benchmark Price
Average and median home prices are often misinterpreted, are affected by change in the mix of homes sold, and can swing dramatically from month to month (based on the types and prices of properties that sold in a given month). The MLS® HPI overcomes these shortcomings and uses the concept of a benchmark home, a notional home with common attributes of typical homes in a defined area. Visit www.housepriceindex.ca for more information.
This blog post is based on market data provided by the Real Estate Board of Greater Vancouver (REBGV) www.rebgv.org
by Macrealty Marketing Team | Apr 8, 2022 | Market Updates
Here are the latest real estate market statistics from Macdonald Realty on the Greater Vancouver listings and sales in March 2022. Find all the infographics by visiting the Facebook Album.
Calmer than last spring’s record pace, Metro Vancouver home buyer demand remains elevated.
While down from last year’s record numbers, home sale activity in Metro Vancouver’s housing market remained elevated in March.
The Real Estate Board of Greater Vancouver (REBGV) reports that residential home sales in the region totalled 4,344 in March 2022, a 23.9 per cent decrease from the 5,708 sales recorded in March 2021, and a 26.9 per cent increase from the 3,424 homes sold in February 2022.
Last month’s sales were 25.5 per cent above the 10-year March sales average.
“March of 2021 was the highest selling month in our history. This year’s activity, while still elevated, is happening at a calmer pace than we experienced 12 months ago,” Daniel John, REBGV Chair said. “Home buyers are keeping a close eye on rising interest rates, hoping to make a move before their locked-in rates expire.”
March of 2021 was the highest selling month in our history. This year’s activity, while still elevated, is happening at a calmer pace than we experienced 12 months ago,” Daniel John, REBGV Chair said. “Home buyers are keeping a close eye on rising interest rates, hoping to make a move before their locked-in rates expire.
March of 2021 was the highest selling month in our history. This year’s activity, while still elevated, is happening at a calmer pace than we experienced 12 months ago,” Daniel John, REBGV Chair said. “Home buyers are keeping a close eye on rising interest rates, hoping to make a move before their locked-in rates expire.
The Board also has informed:
“We’re still seeing upward pressure on prices across all housing categories in the region. Lack of supply is driving this pressure,” John said. “The number of homes listed for sale on our MLS® system today is less than half of what’s needed to shift the market into balanced territory.”
*Areas covered by the Real Estate Board of Greater Vancouver include Burnaby, Coquitlam, Maple Ridge, New Westminster, North Vancouver, Pitt Meadows, Port Coquitlam, Port Moody, Richmond, South Delta, Squamish, Sunshine Coast, Vancouver, West Vancouver, and Whistler. Check out the infographics of Squamish, Sunshine Coast and Whistler, HERE.
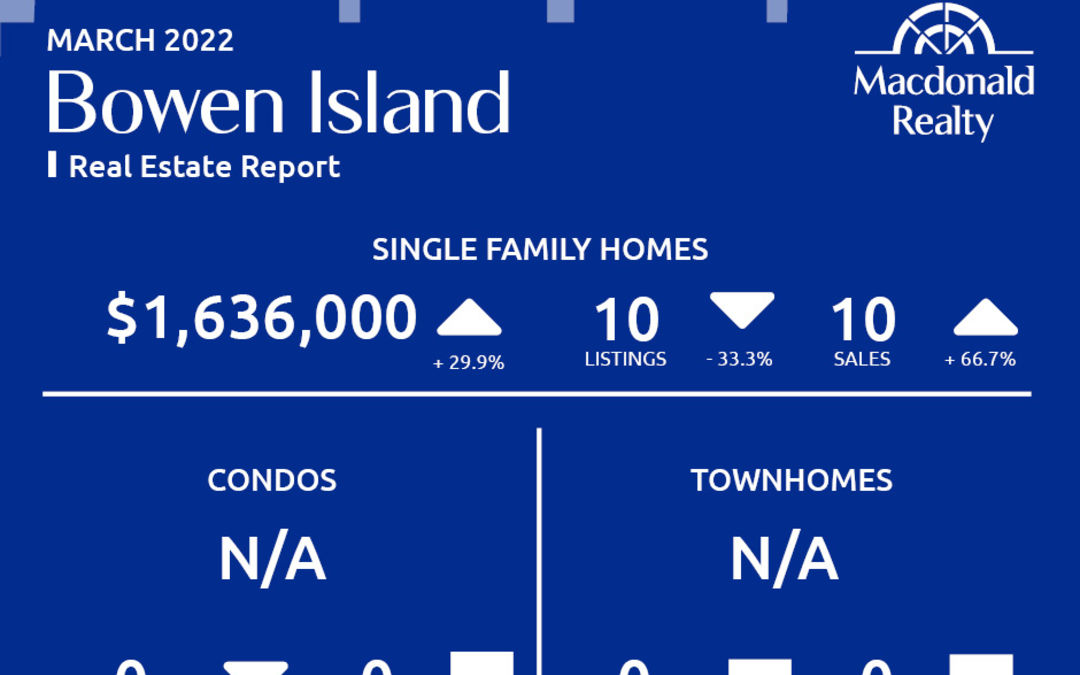
Bowen Island
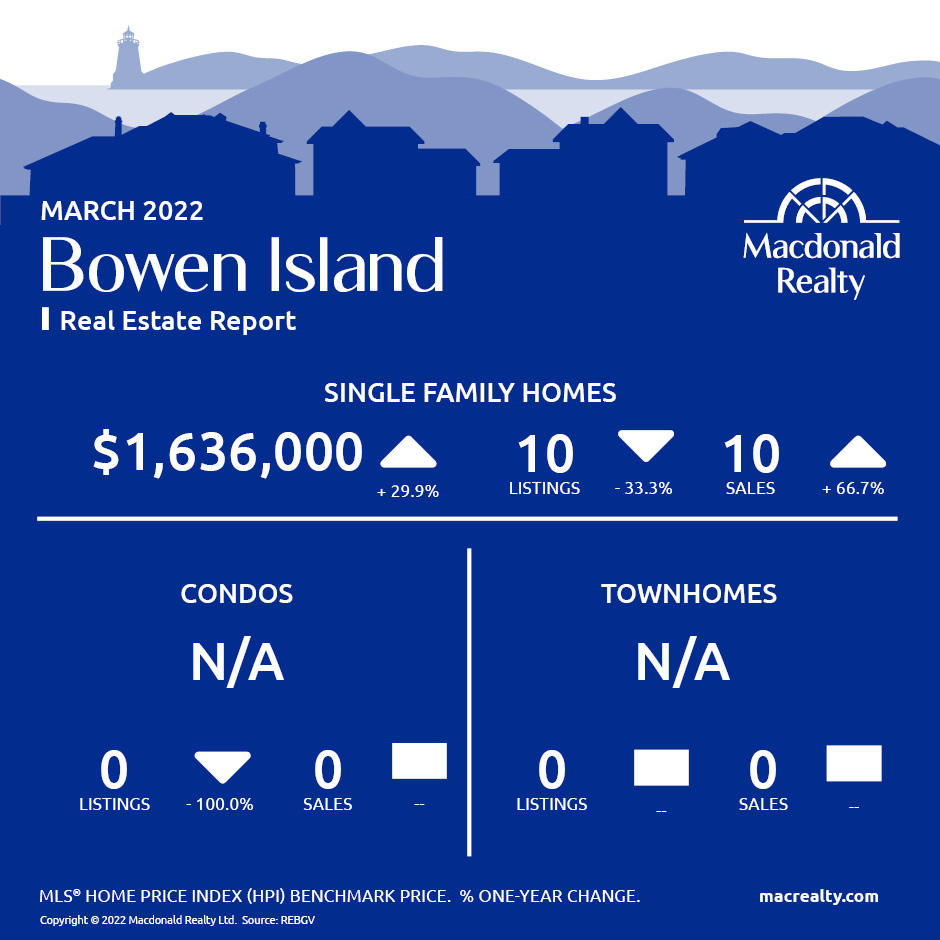
Burnaby East
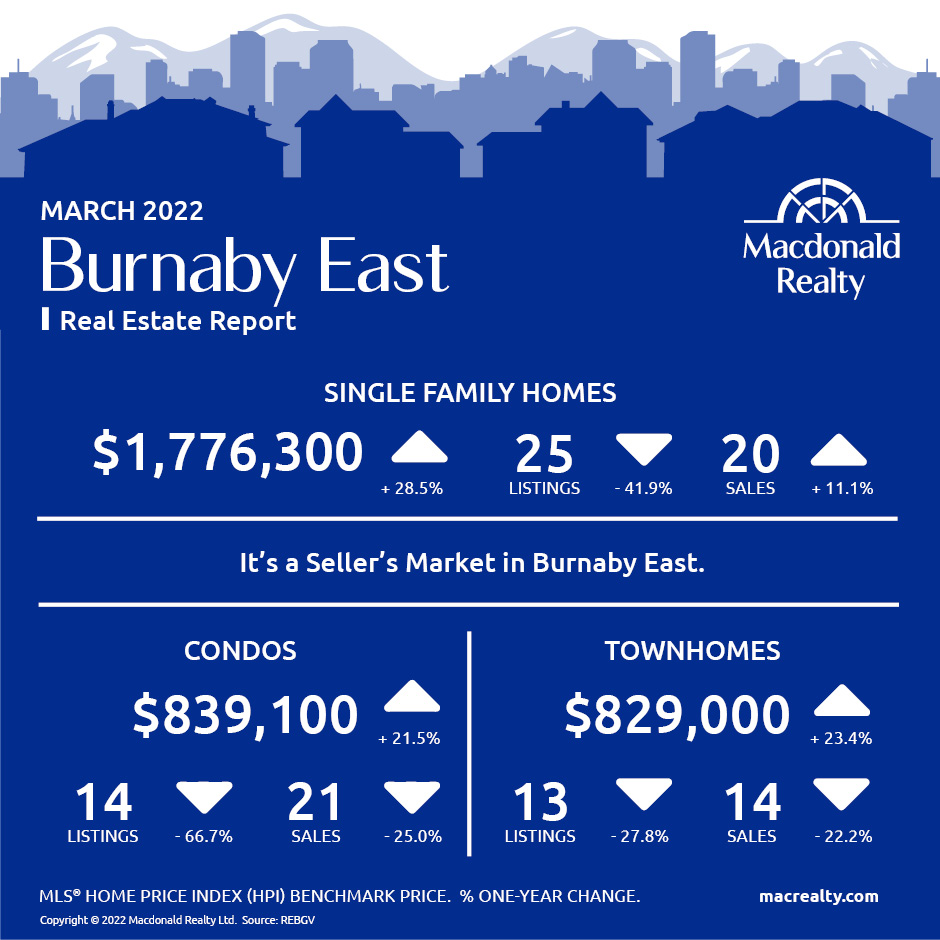
Burnaby North
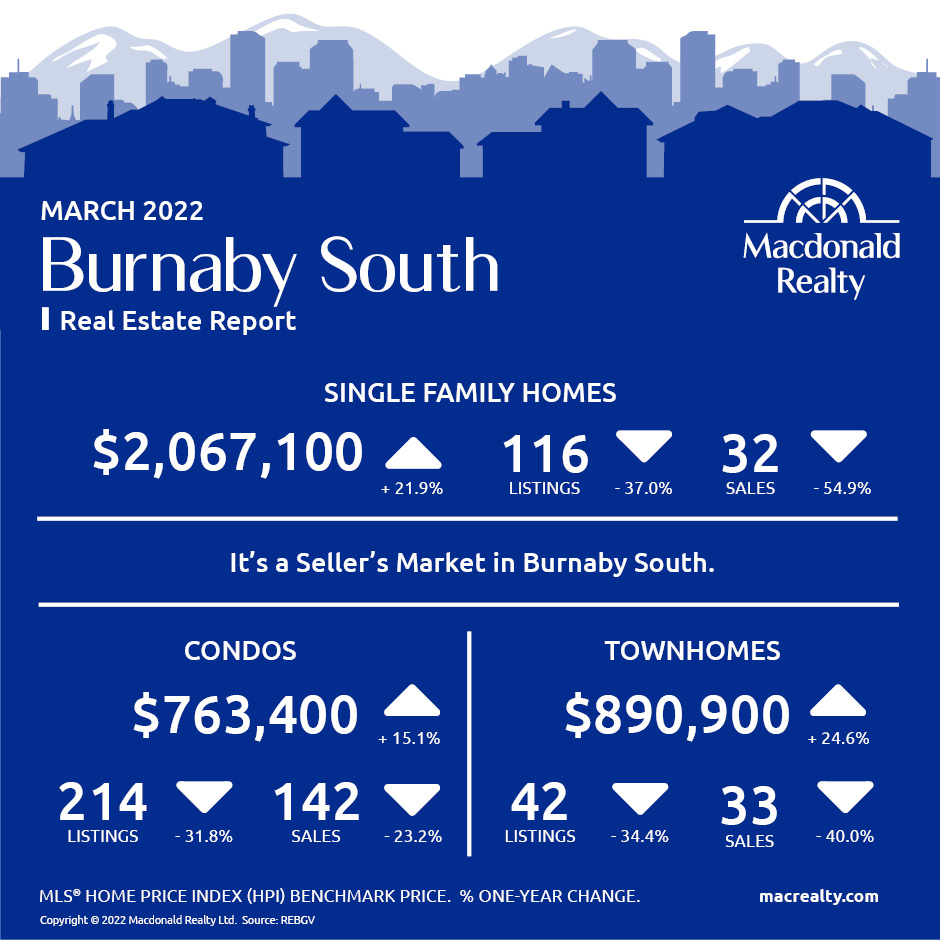
Burnaby South
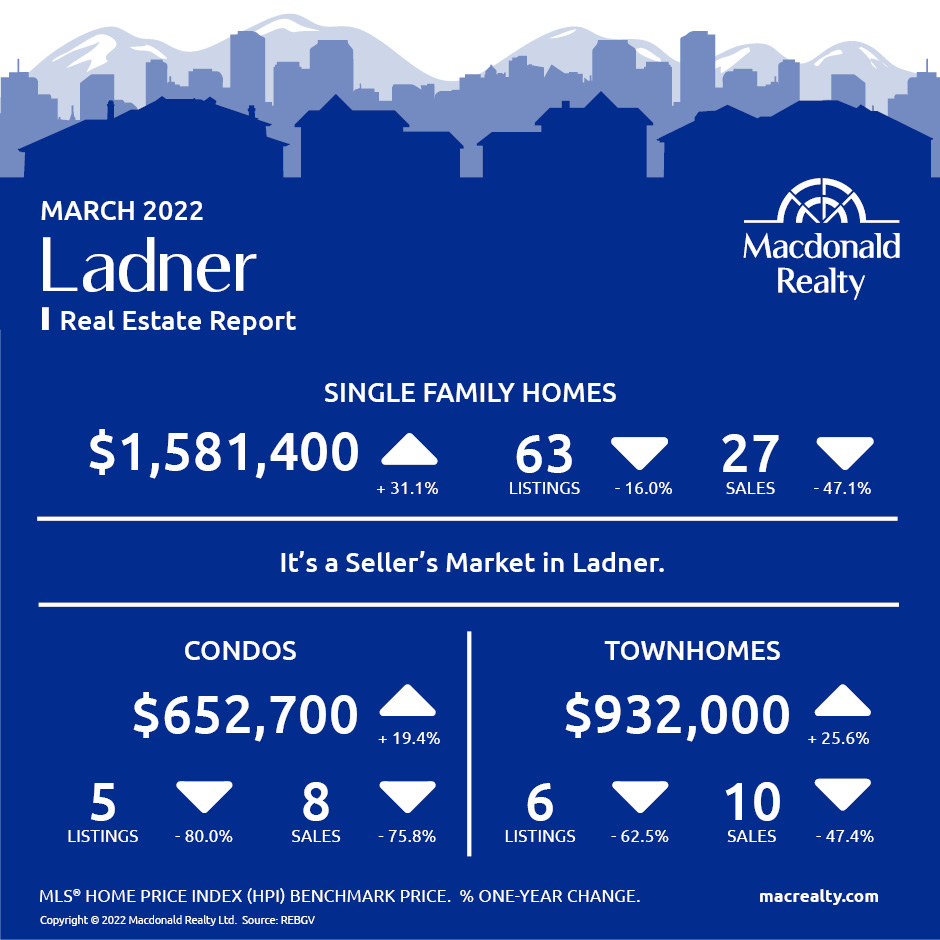
Ladner
Maple Ridge

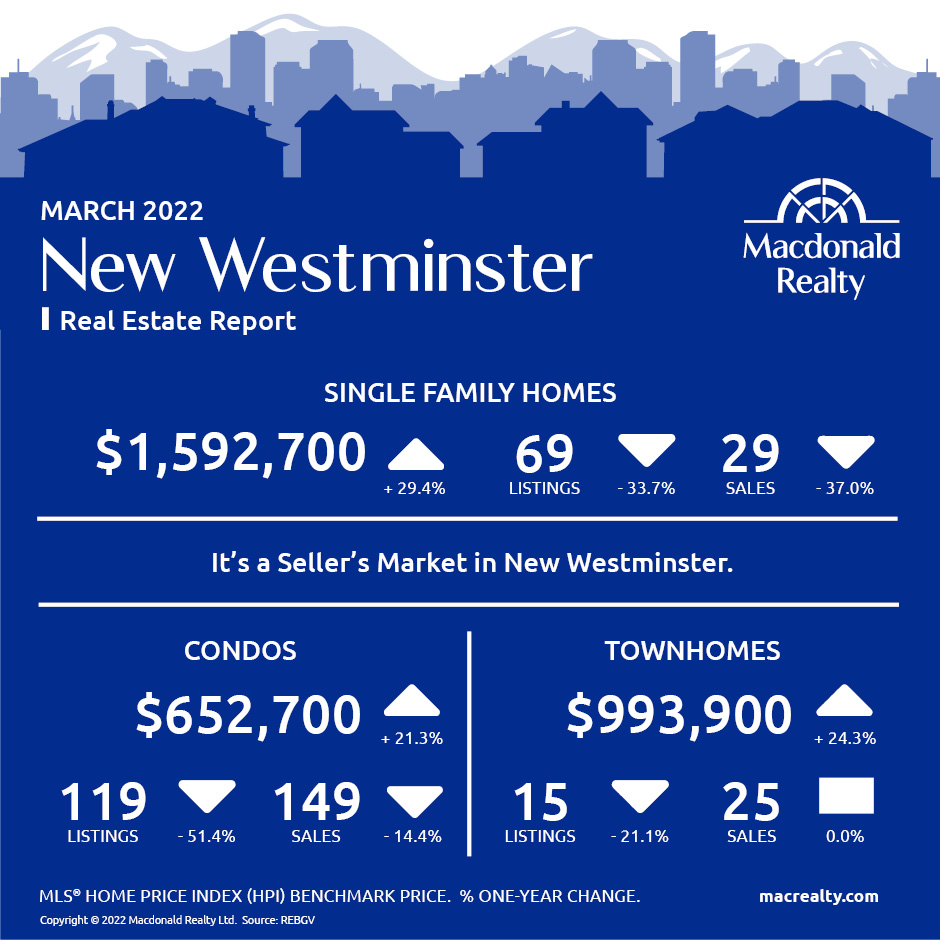
New Westminster
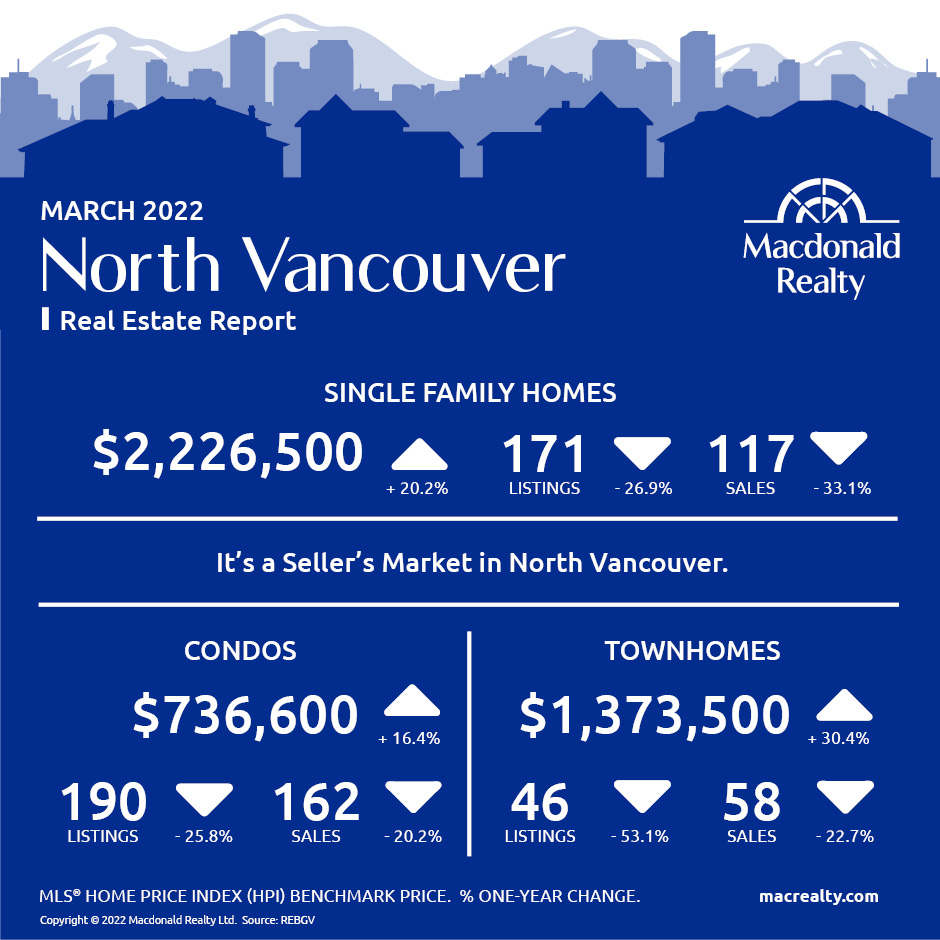
North Vancouver
Pitt Meadows

Coquitlam
Port Coquitlam
Port Moody
Richmond
Tsawwassen

Vancouver East
Vancouver West

West Vancouver

Looking for more information about the real estate market in specific neighbourhoods in the Greater Vancouver?
Macdonald Realty has offices across the Greater Vancouver. Please email [email protected] or call 1-877-278-3888 to be matched with a REALTOR® working in your area.
MLS® Home Price Index (HPI) Benchmark Price
Average and median home prices are often misinterpreted, are affected by change in the mix of homes sold, and can swing dramatically from month to month (based on the types and prices of properties that sold in a given month). The MLS® HPI overcomes these shortcomings and uses the concept of a benchmark home, a notional home with common attributes of typical homes in a defined area. Visit www.housepriceindex.ca for more information.
This blog post is based on market data provided by the Real Estate Board of Greater Vancouver (REBGV) www.rebgv.org
by Macrealty Marketing Team | Mar 8, 2022 | Market Updates
Here are the latest real estate market statistics from Macdonald Realty on the Greater Vancouver listings and sales in February 2022. Find all the infographics by visiting the
Facebook Album.
The Metro Vancouver* housing market saw steady home sales activity, modest increases in home listings and continued upward trends in pricing in February.
The Real Estate Board of Greater Vancouver (REBGV) reports that residential home sales in the region totalled 3,424 in February 2022, an 8.1 per cent decrease from the 3,727 sales recorded in February 2021, and a 49.8 per cent increase from the 2,285 homes sold in January 2022.
Last month’s sales were 26.9 per cent above the 10-year February sales average.
“As we prepare to enter what’s traditionally the busiest season of the year, the Metro Vancouver housing market is seeing more historically typical home sale activity and a modest uptick in home listing activity compared to last year,” Taylor Biggar, REBGV Chair said.
There were 5,471 detached, attached and apartment properties newly listed for sale on the Multiple Listing Service® (MLS®) in Metro Vancouver in February 2022. This represents an 8.4 per cent increase compared to the 5,048 homes listed in February 2021 and a 31.2 per cent increase compared to January 2022 when 4,170 homes were listed.
The total number of homes currently listed for sale on the MLS® system in Metro Vancouver is 6,742, a 19.3 per cent decrease compared to February 2021 (8,358) and a 19.1 per cent increase compared to January 2022 (5,663).
The Board also has informed:
“Despite having a higher volume of people listing their homes for sale in February, the region’s housing market remains significantly undersupplied, which has been pushing home prices to new highs month after month,” Biggar said.
*Areas covered by the Real Estate Board of Greater Vancouver include Burnaby, Coquitlam, Maple Ridge, New Westminster, North Vancouver, Pitt Meadows, Port Coquitlam, Port Moody, Richmond, South Delta, Squamish, Sunshine Coast, Vancouver, West Vancouver, and Whistler. Check out the infographics of Squamish, Sunshine Coast and Whistler, HERE.
Bowen Island
Burnaby East

Burnaby North
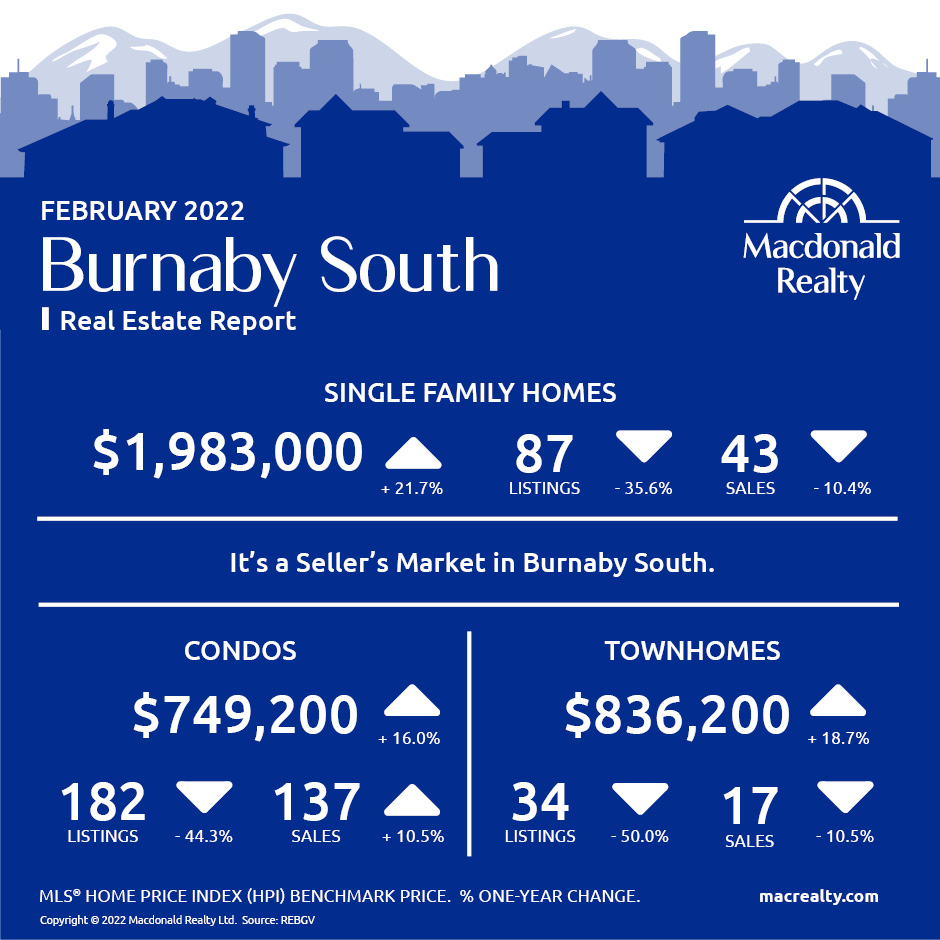
Burnaby South
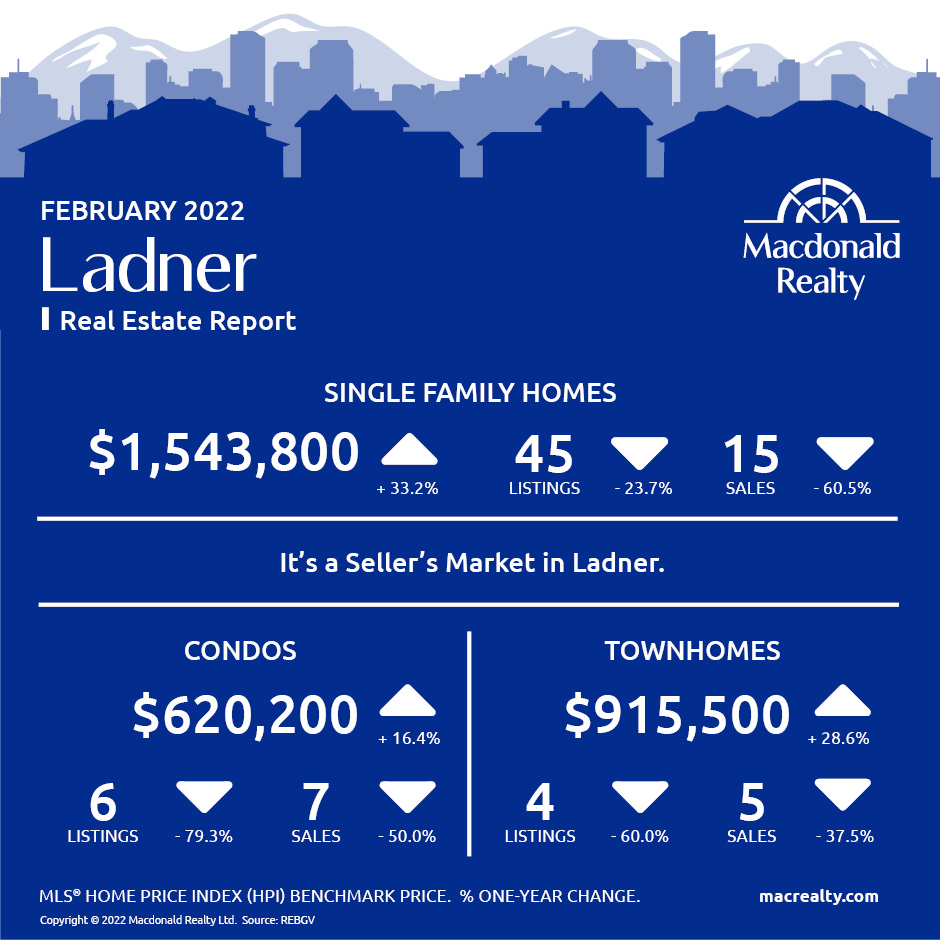
Ladner
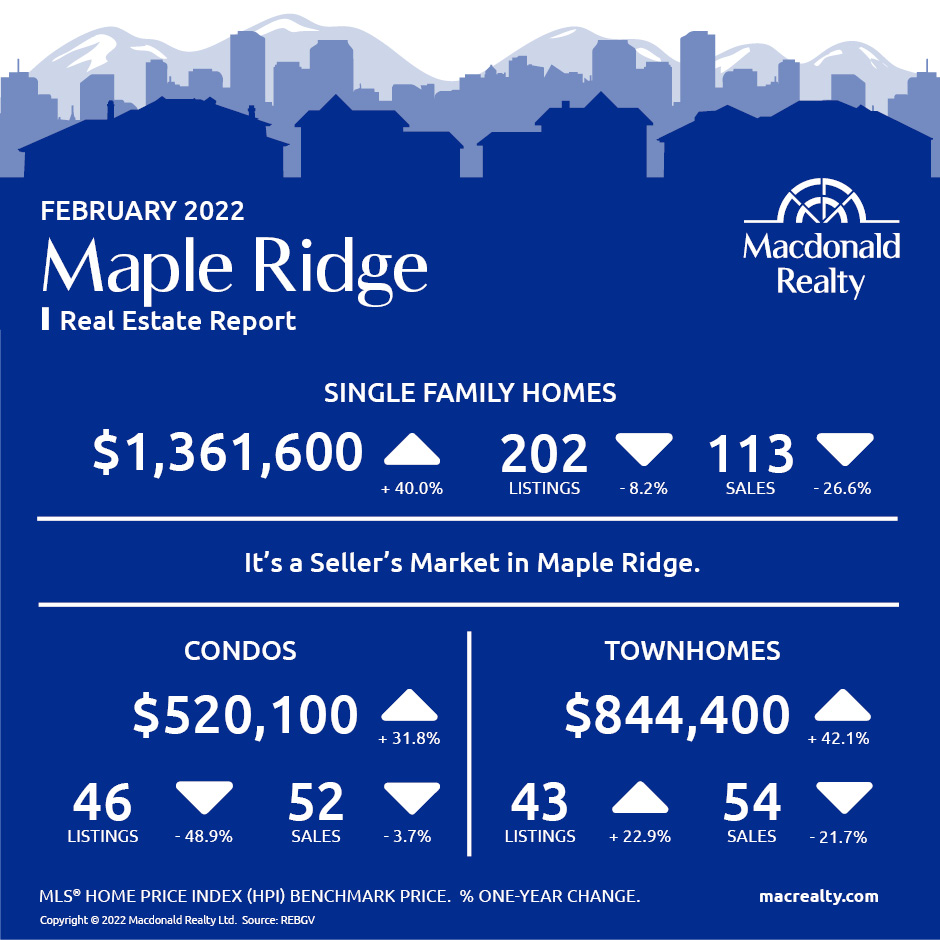
Maple Ridge
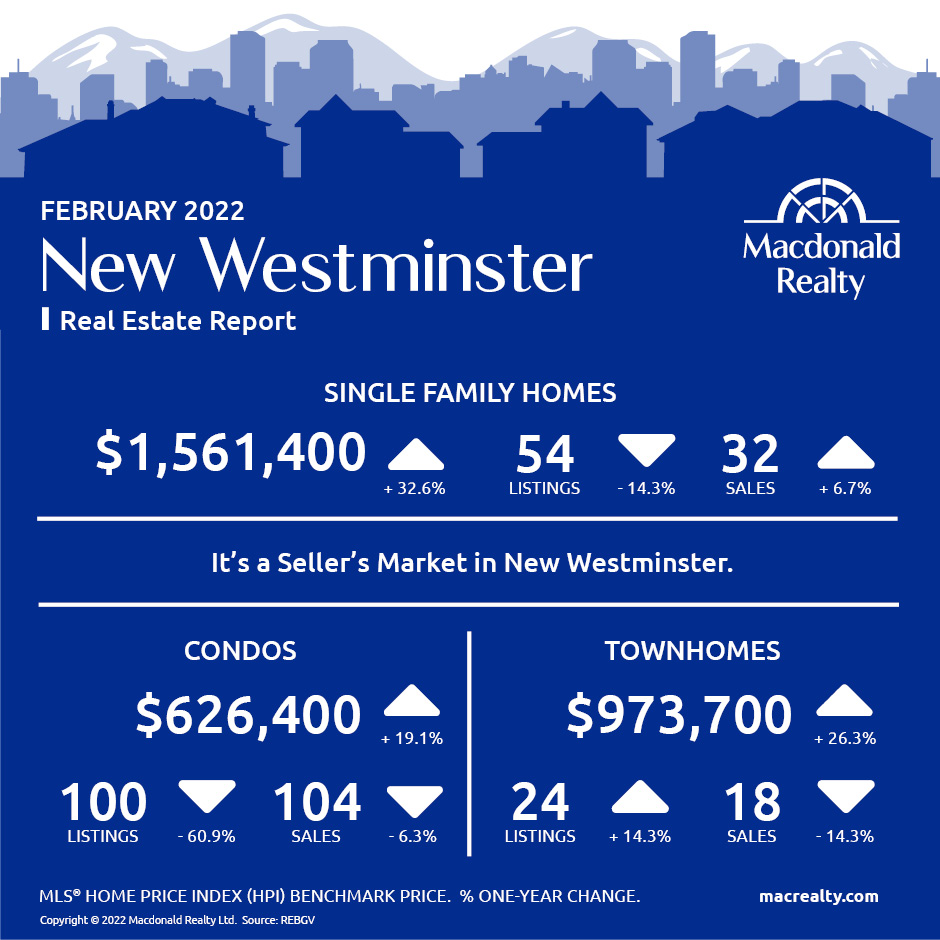
New Westminster
North Vancouver
Pitt Meadows

Coquitlam
Port Coquitlam
Port Moody
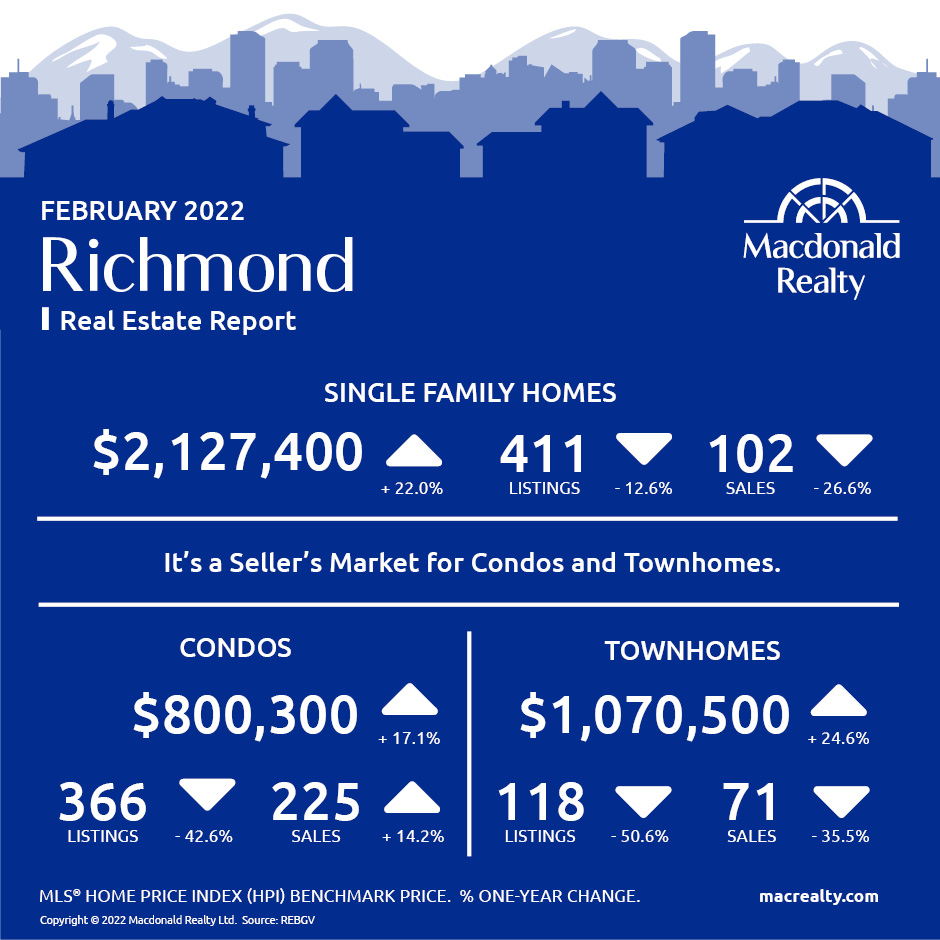
Richmond
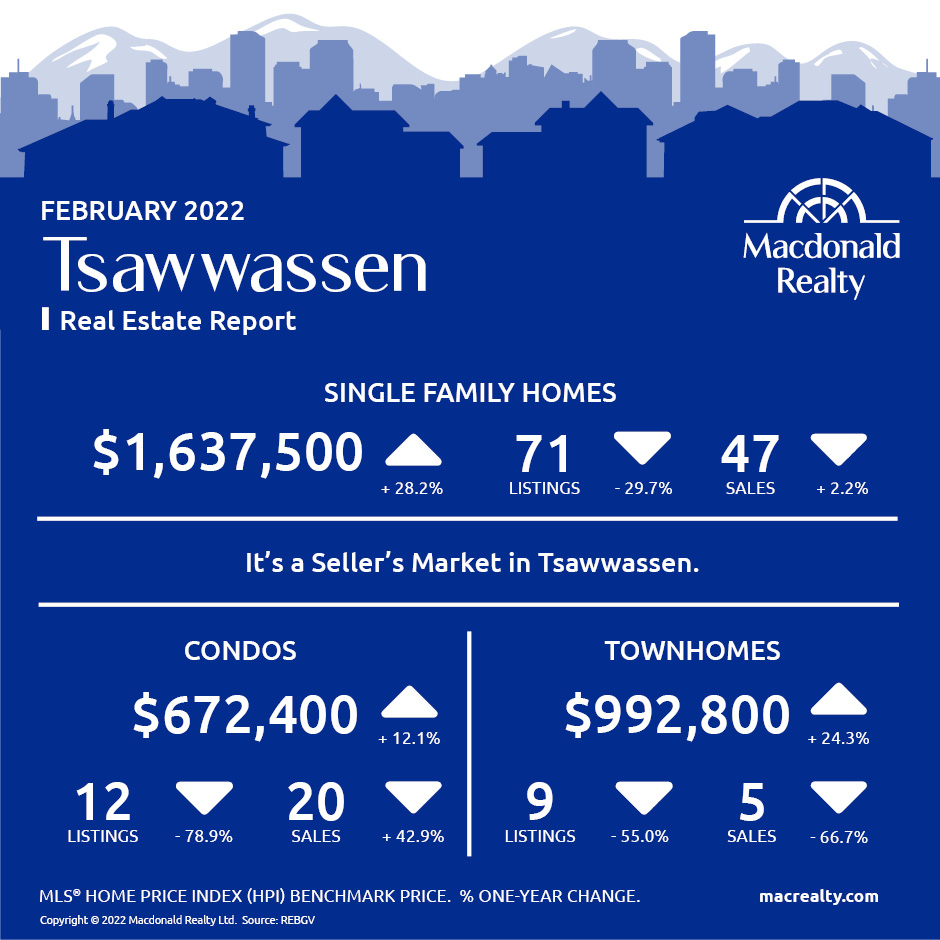
Tsawwassen
Vancouver East

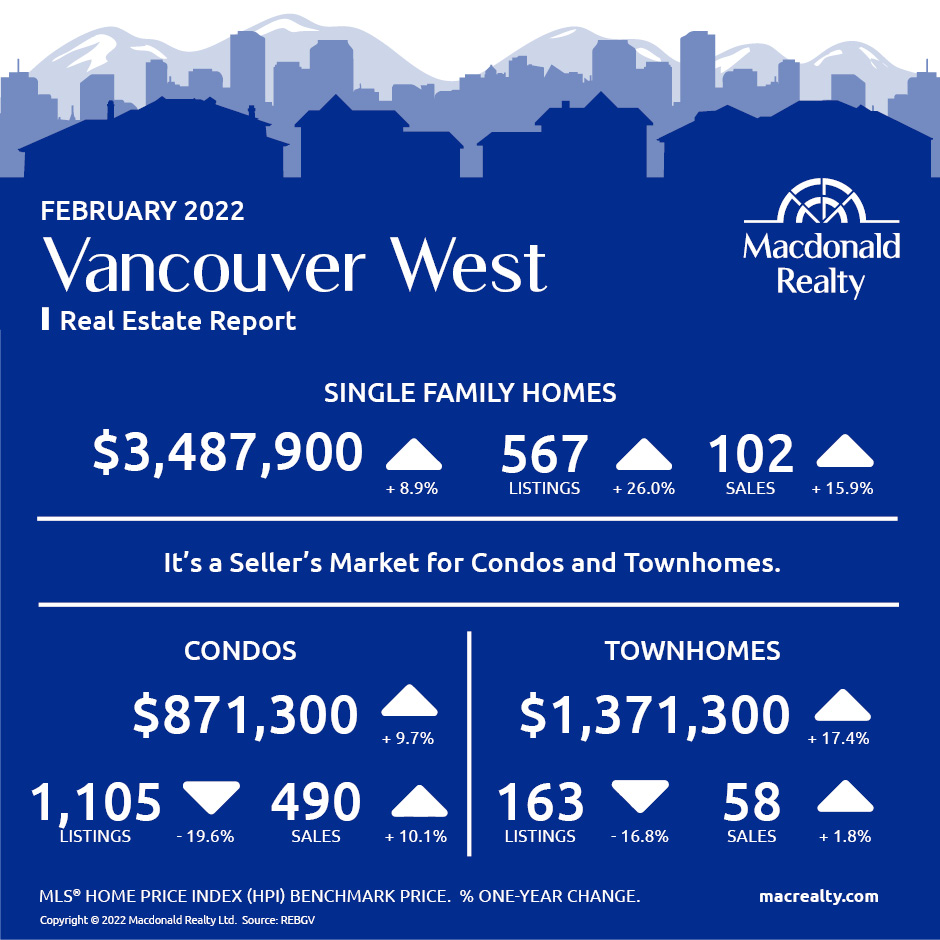
Vancouver West
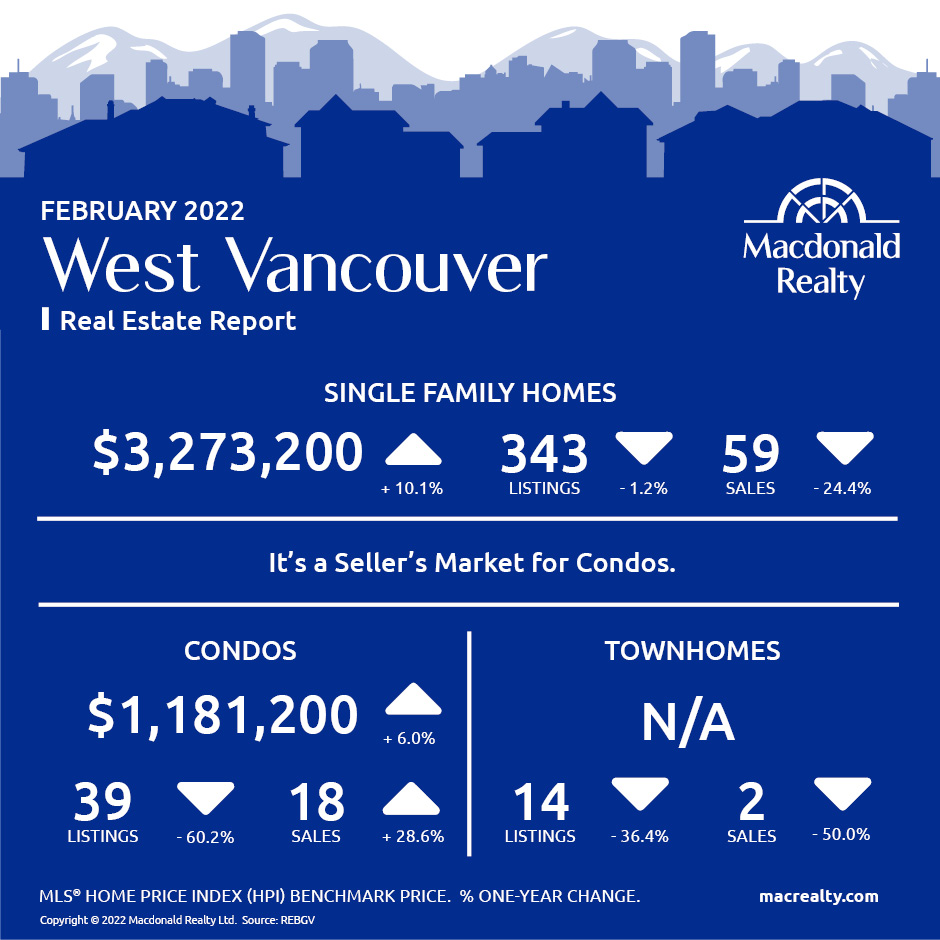
West Vancouver
Looking for more information about the real estate market in specific neighbourhoods in the Greater Vancouver?
Macdonald Realty has offices across the Greater Vancouver. Please email [email protected] or call 1-877-278-3888 to be matched with a REALTOR® working in your area.
MLS® Home Price Index (HPI) Benchmark Price
Average and median home prices are often misinterpreted, are affected by change in the mix of homes sold, and can swing dramatically from month to month (based on the types and prices of properties that sold in a given month). The MLS® HPI overcomes these shortcomings and uses the concept of a benchmark home, a notional home with common attributes of typical homes in a defined area. Visit www.housepriceindex.ca for more information.
This blog post is based on market data provided by the Real Estate Board of Greater Vancouver (REBGV) www.rebgv.org
by Macrealty Marketing Team | Feb 8, 2022 | Market Updates
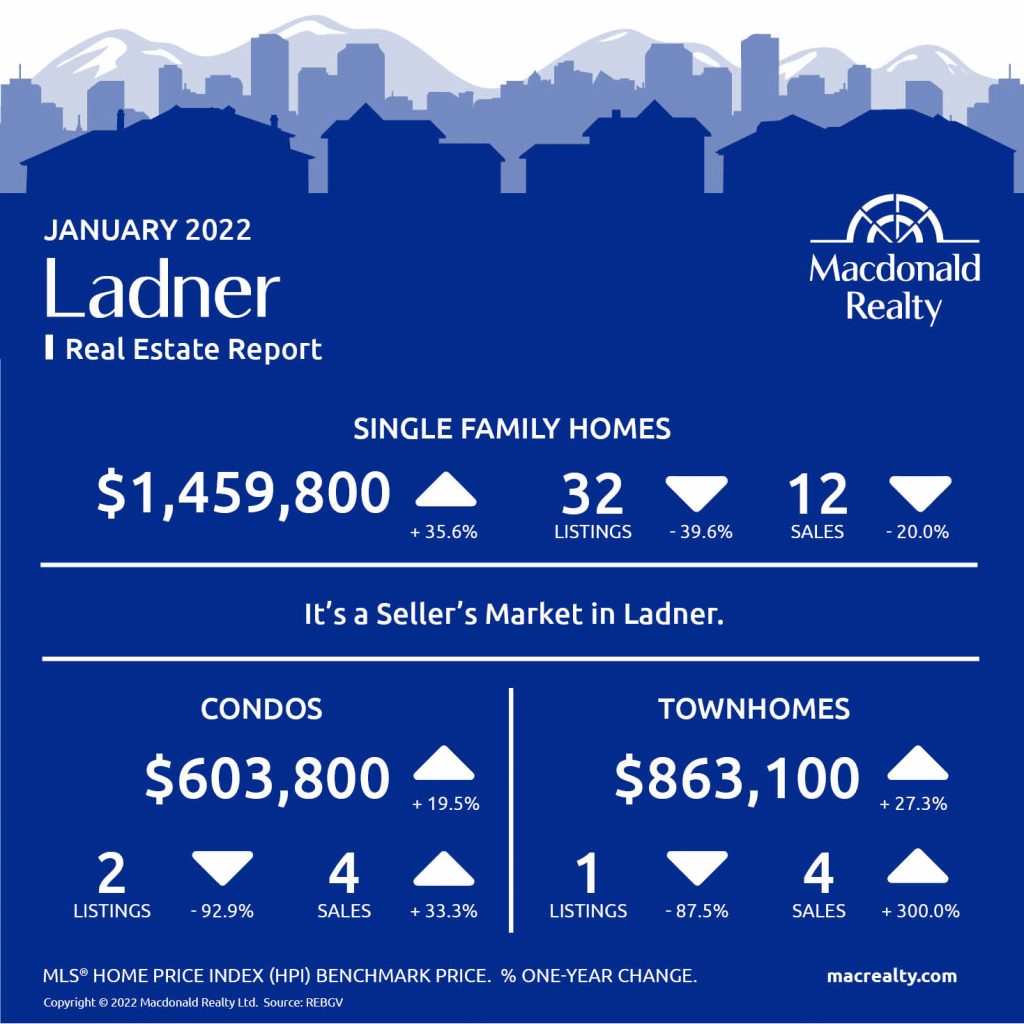
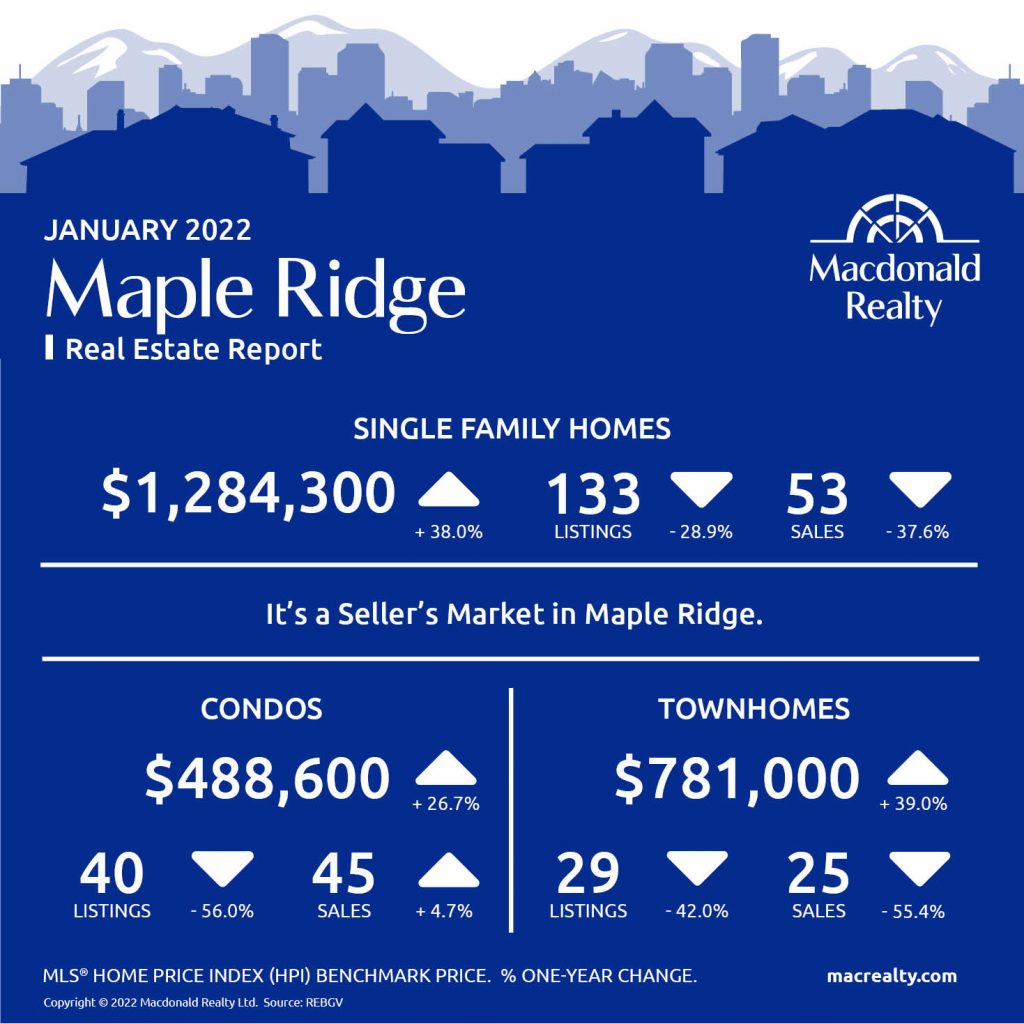
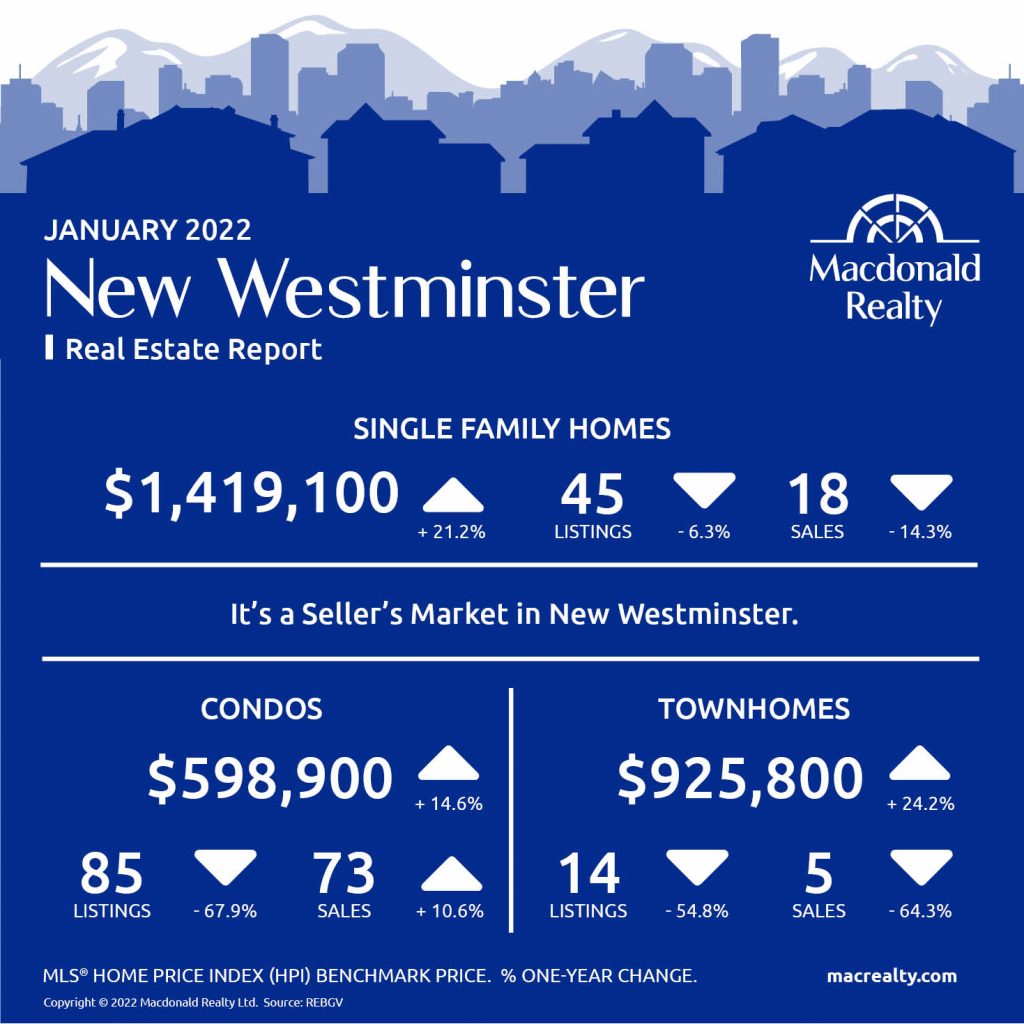
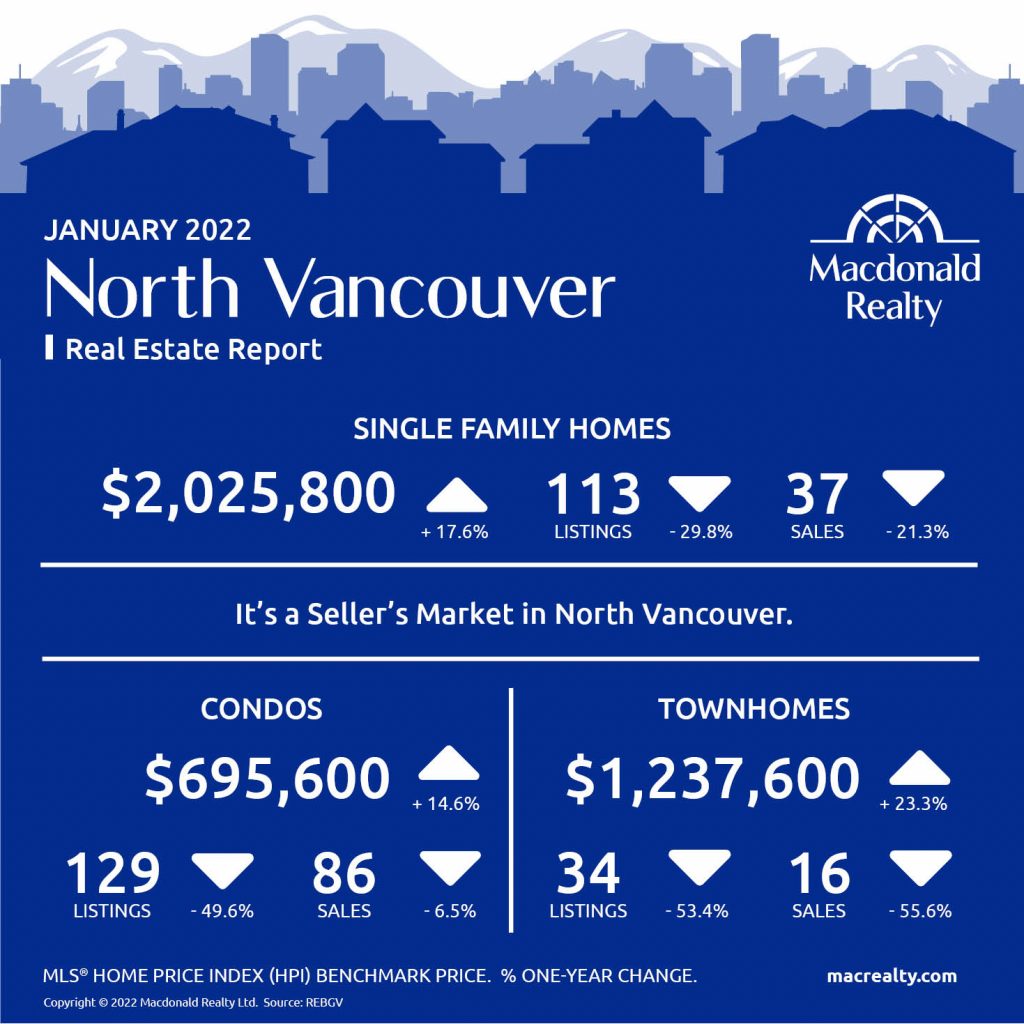
Here are the latest real estate market statistics from Macdonald Realty on the Greater Vancouver listings and sales in January 2022.
Find all the infographics by visiting the Facebook Album.
The first month of 2022 saw home sales come down from last year’s record-setting pace, while low supply continued to cause home prices to edge higher across Metro Vancouver*.
The Real Estate Board of Greater Vancouver (REBGV) reports that residential home sales in the region totalled 2,285 in January 2022, a 4.4 per cent decrease from the 2,389 sales recorded in January 2021, and a 15 per cent decrease from the 2,688 homes sold in December 2021.
Last month’s sales were 25.3 per cent above the 10-year January sales average.
There were 4,170 detached, attached and apartment properties newly listed for sale on the Multiple Listing Service® (MLS®) in Metro Vancouver in January 2022. This represents a 6.9 per cent decrease compared to the 4,480 homes listed in January 2021 and a 114.4 per cent increase compared to December 2021 when 1,945 homes were listed.
“Our listing inventory on MLS® is less than half of what would be optimal to begin the year. As a result, hopeful home buyers have limited choice in the market today. This trend is causing fierce competition for a scarce number of homes for sale, which, in turn, increases prices,” Keith Stewart, REBGV economist said.
The Board also has informed:
“As we approach spring, we’ll keep a close eye on the impact of rising interest rates on buyers’ willingness to buy and on whether more home owners will opt to become sellers in what’s traditionally the busiest season of the year,” Stewart said. “With home prices reaching new highs in recent months, the need has never been greater for government to collaborate with the building community to expedite the creation of housing supply and provide more choice for those struggling to buy a home today.”
*Areas covered by the Real Estate Board of Greater Vancouver include Burnaby, Coquitlam, Maple Ridge, New Westminster, North Vancouver, Pitt Meadows, Port Coquitlam, Port Moody, Richmond, South Delta, Squamish, Sunshine Coast, Vancouver, West Vancouver, and Whistler. Check out the infographics of Squamish, Sunshine Coast and Whistler, HERE.
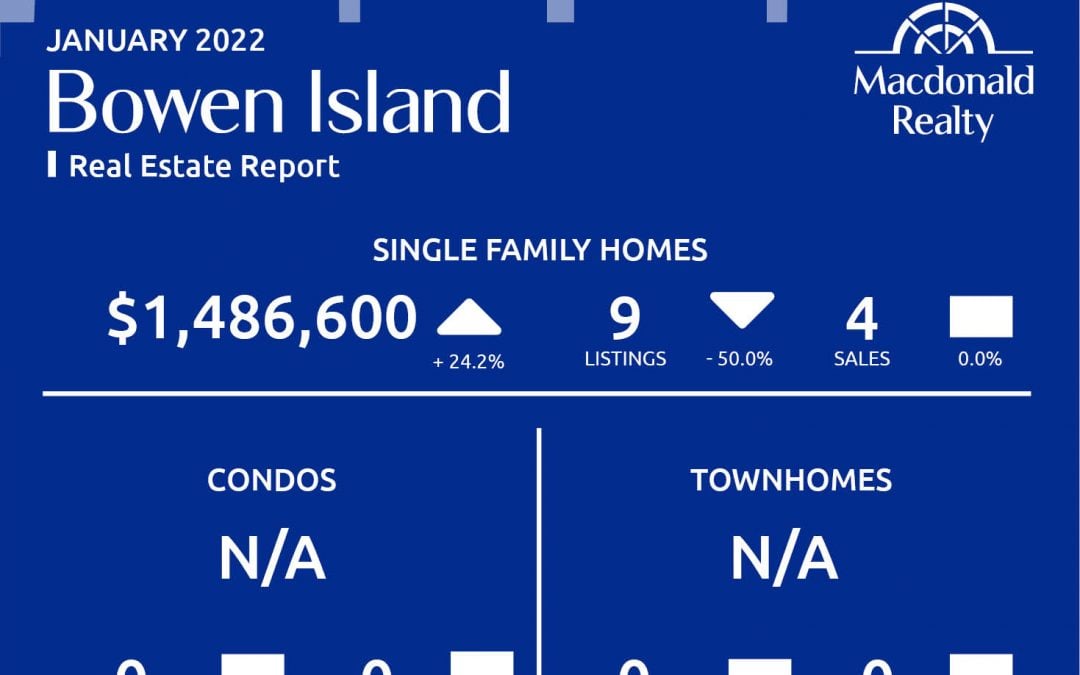
Bowen Island

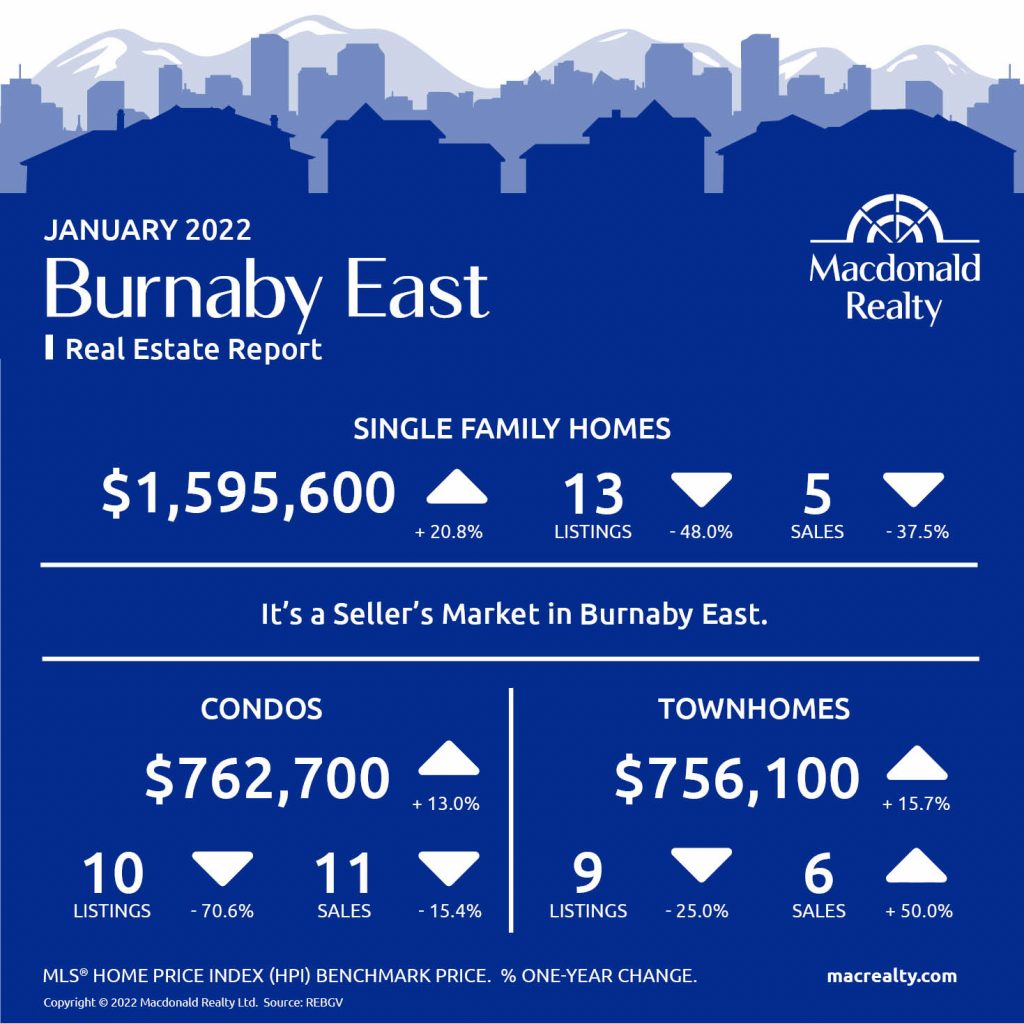
Burnaby East
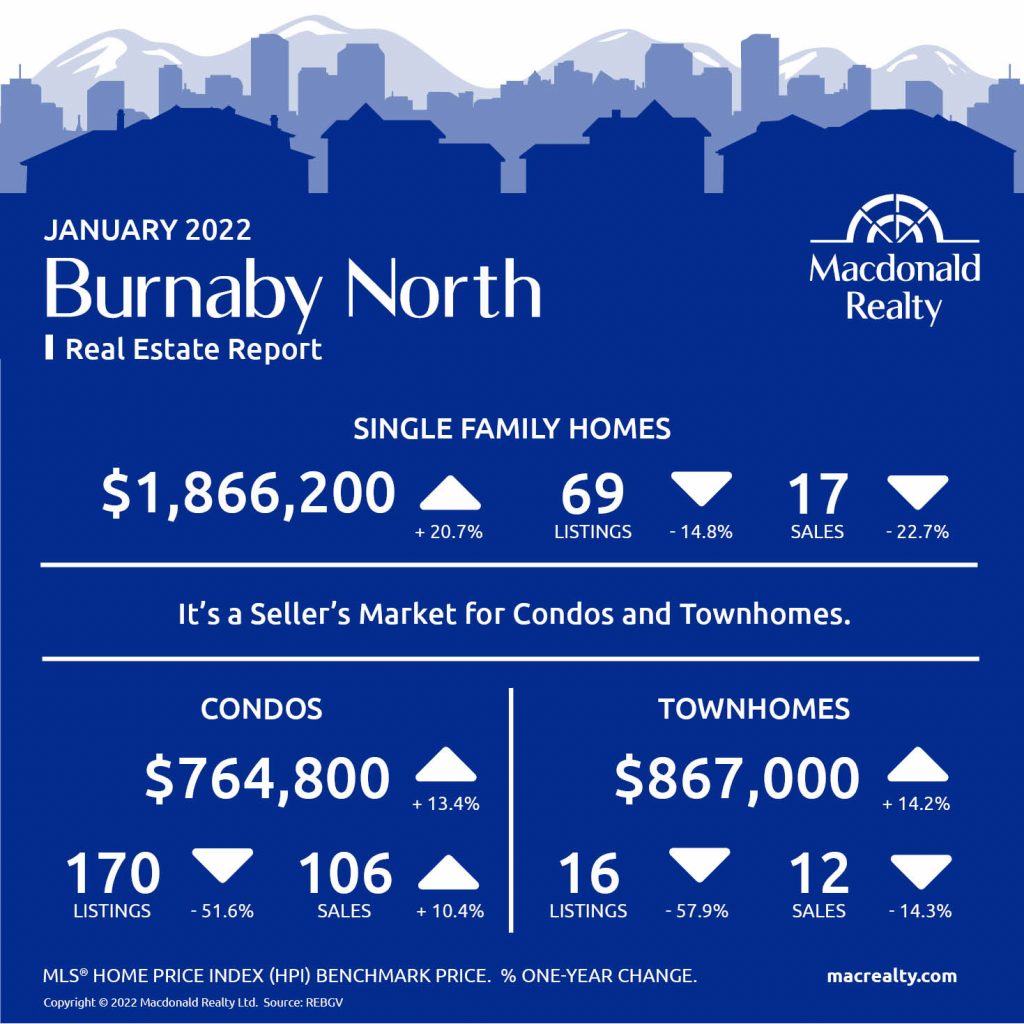
Burnaby North
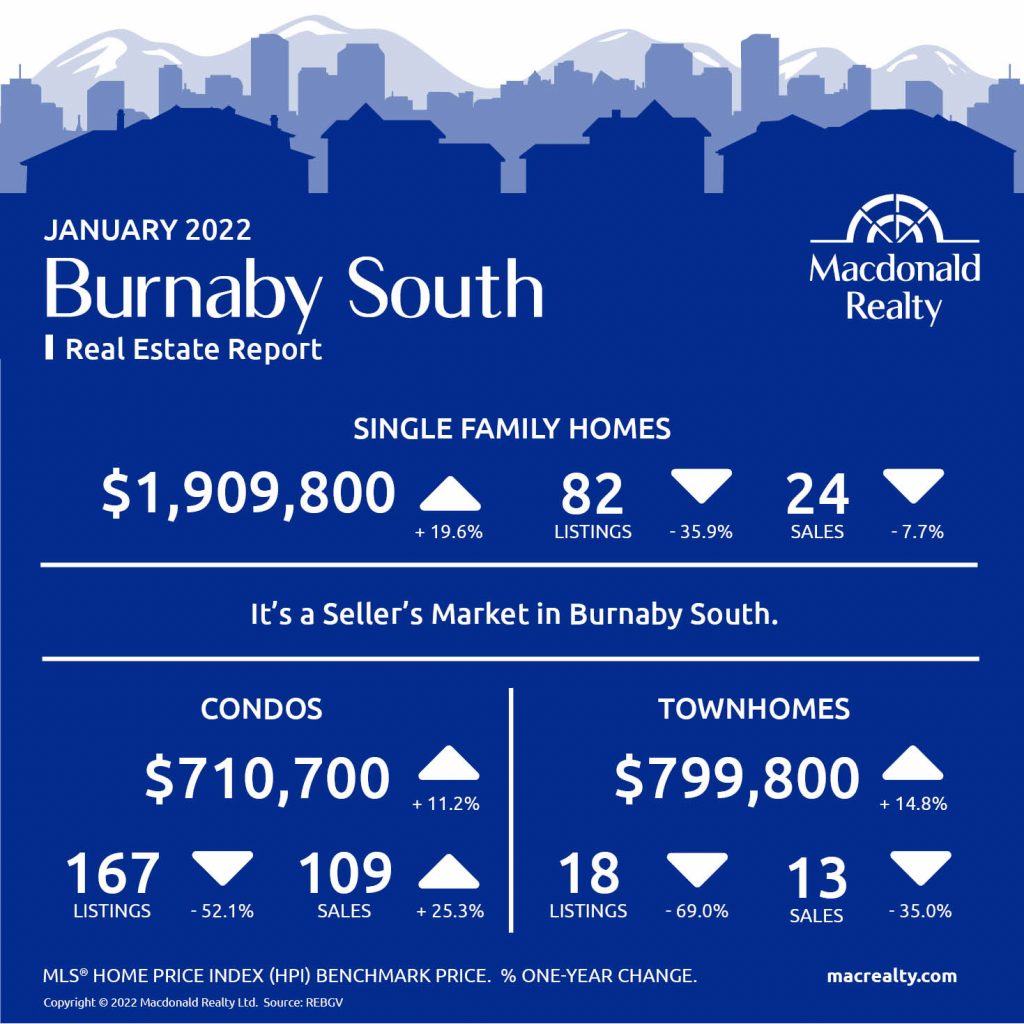
Burnaby South
Ladner
Maple Ridge
New Westminster
North Vancouver
Pitt Meadows
Coquitlam
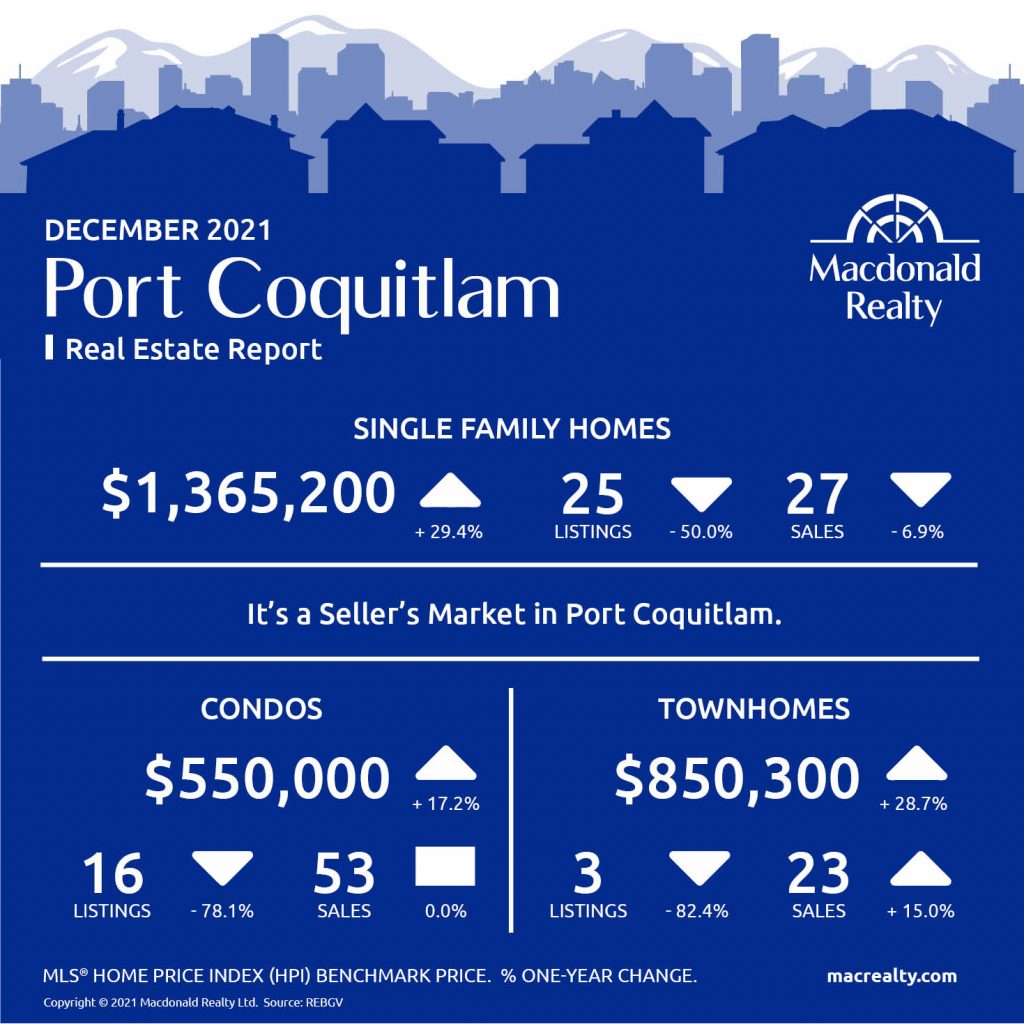
Port Coquitlam
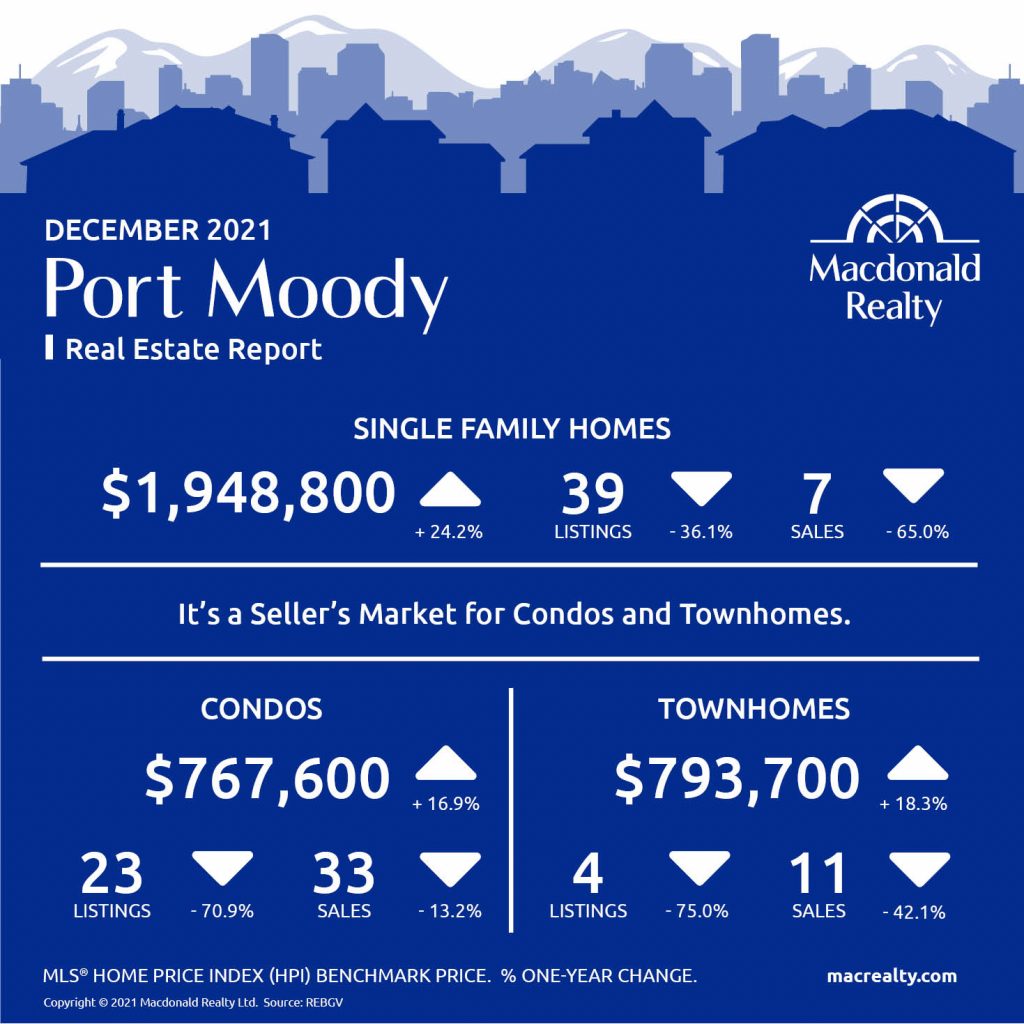
Port Moody

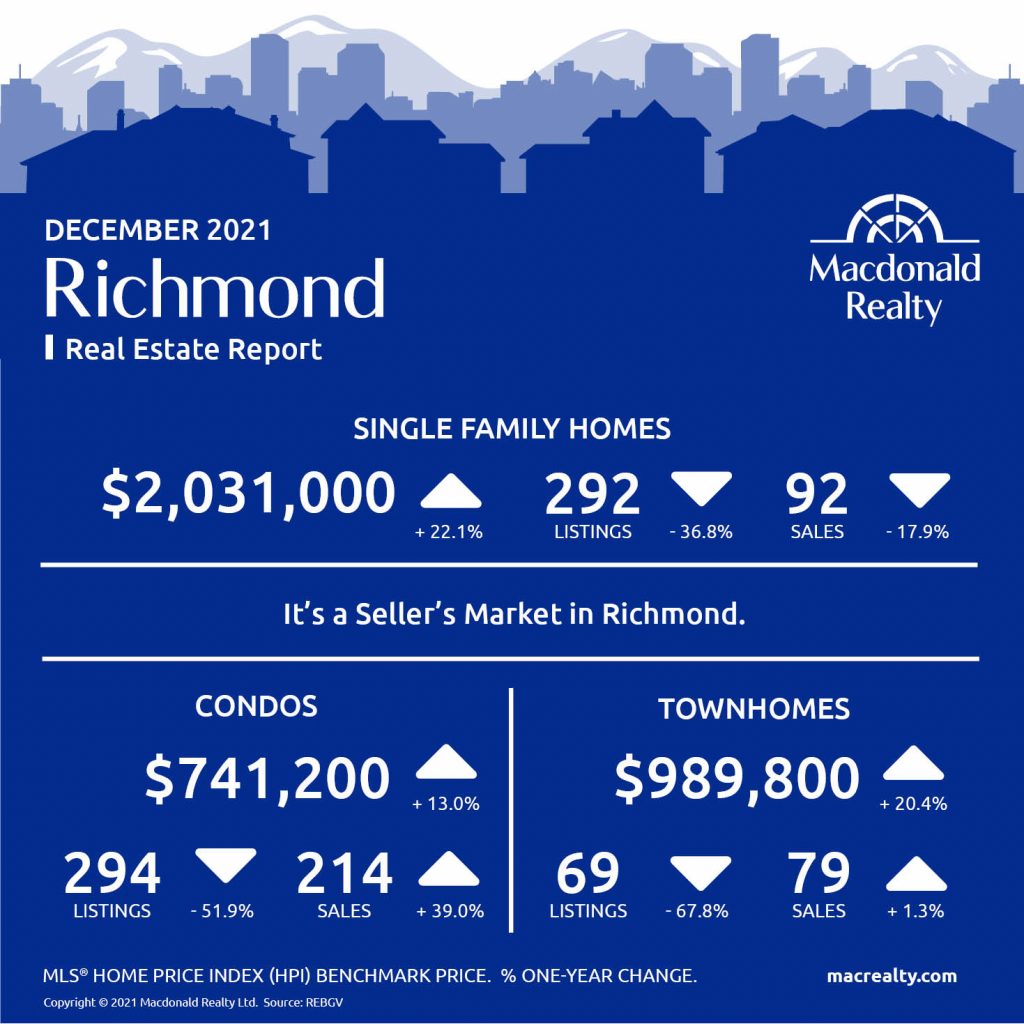
Richmond
Tsawwassen

Vancouver East

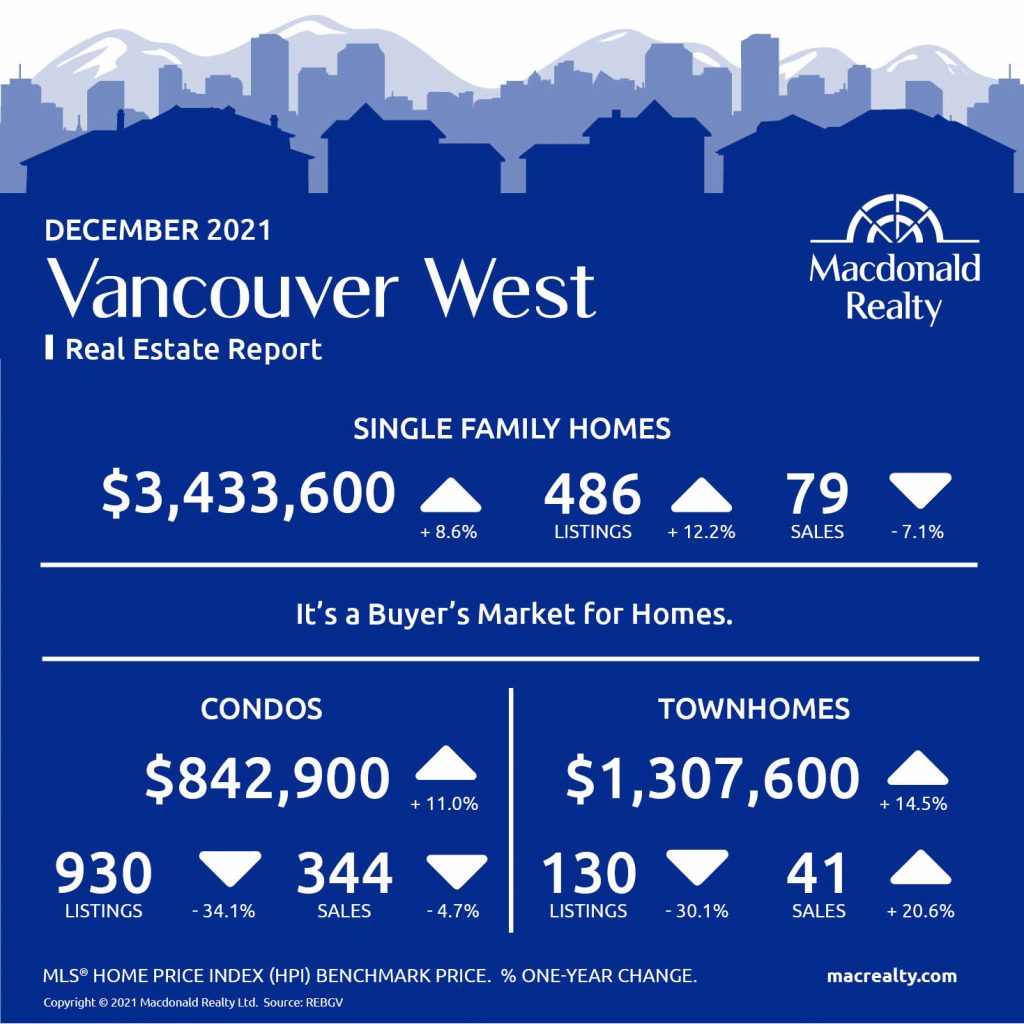
Vancouver West
West Vancouver
Looking for more information about the real estate market in specific neighbourhoods in the Greater Vancouver?
Macdonald Realty has offices across the Greater Vancouver. Please email [email protected] or call 1-877-278-3888 to be matched with a REALTOR® working in your area.
MLS® Home Price Index (HPI) Benchmark Price
Average and median home prices are often misinterpreted, are affected by change in the mix of homes sold, and can swing dramatically from month to month (based on the types and prices of properties that sold in a given month). The MLS® HPI overcomes these shortcomings and uses the concept of a benchmark home, a notional home with common attributes of typical homes in a defined area. Visit www.housepriceindex.ca for more information.
This blog post is based on market data provided by the Real Estate Board of Greater Vancouver (REBGV) www.rebgv.org
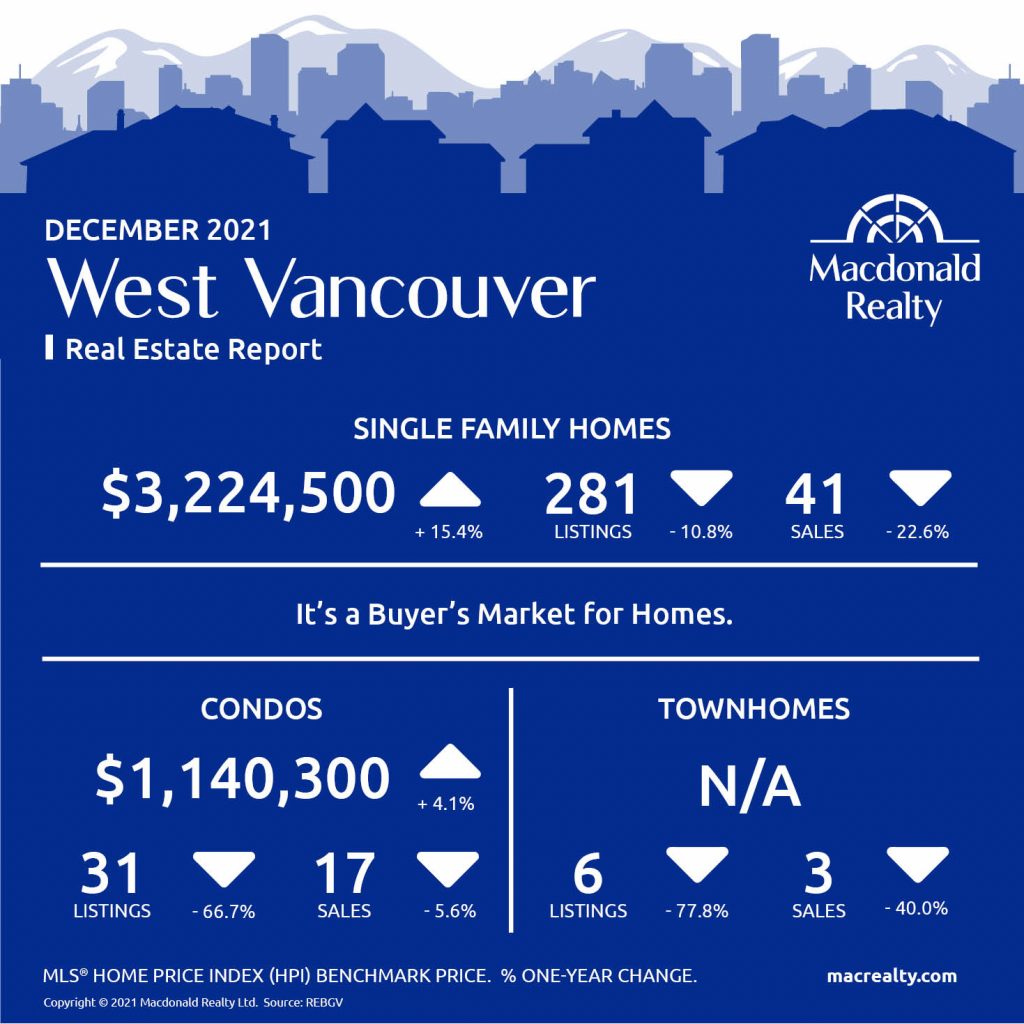
by Macrealty Marketing Team | Jan 10, 2022 | Market Updates
Here are the latest real estate market statistics from Macdonald Realty on the Greater Vancouver listings and sales in December 2021.
Find all the infographics by visiting the Facebook Album.
Metro Vancouver* home sales reached an all-time high in 2021 as housing needs remained a top priority for residents in the second year of the COVID-19 pandemic.
“Home has been a focus for residents throughout the pandemic. With low interest rates, increased household savings, more flexible work arrangements, and higher home prices than ever before, Metro Vancouverites, in record numbers, are assessing their housing needs and options,” Keith Stewart, REBGV economist said.
The Board also has informed:
“While steady, home listing activity didn’t keep pace with the record demand we saw throughout 2021. This imbalance caused residential home prices to rise over the past 12 months,” Stewart said.
*Areas covered by the Real Estate Board of Greater Vancouver include Burnaby, Coquitlam, Maple Ridge, New Westminster, North Vancouver, Pitt Meadows, Port Coquitlam, Port Moody, Richmond, South Delta, Squamish, Sunshine Coast, Vancouver, West Vancouver, and Whistler. Check out the infographics of Squamish, Sunshine Coast and Whistler, HERE.
Bowen Island
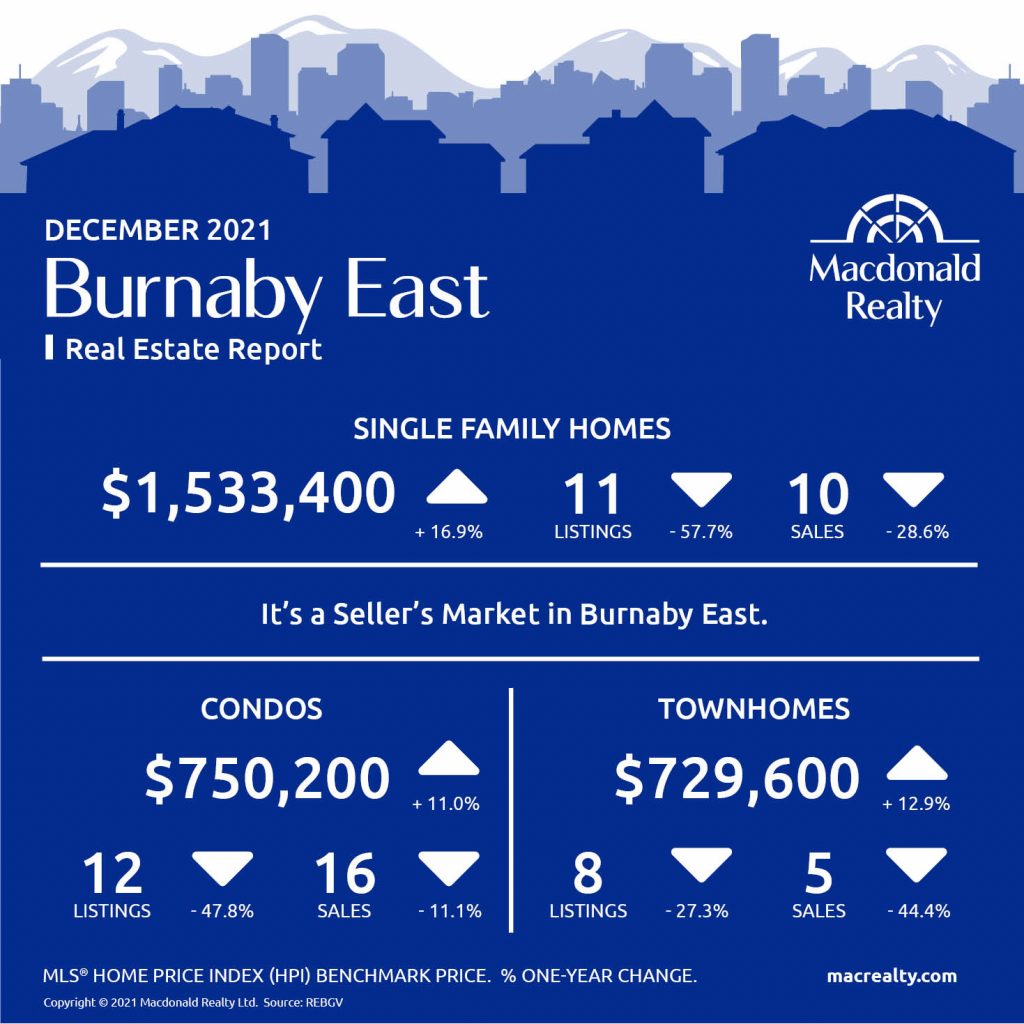
Burnaby East
Burnaby North

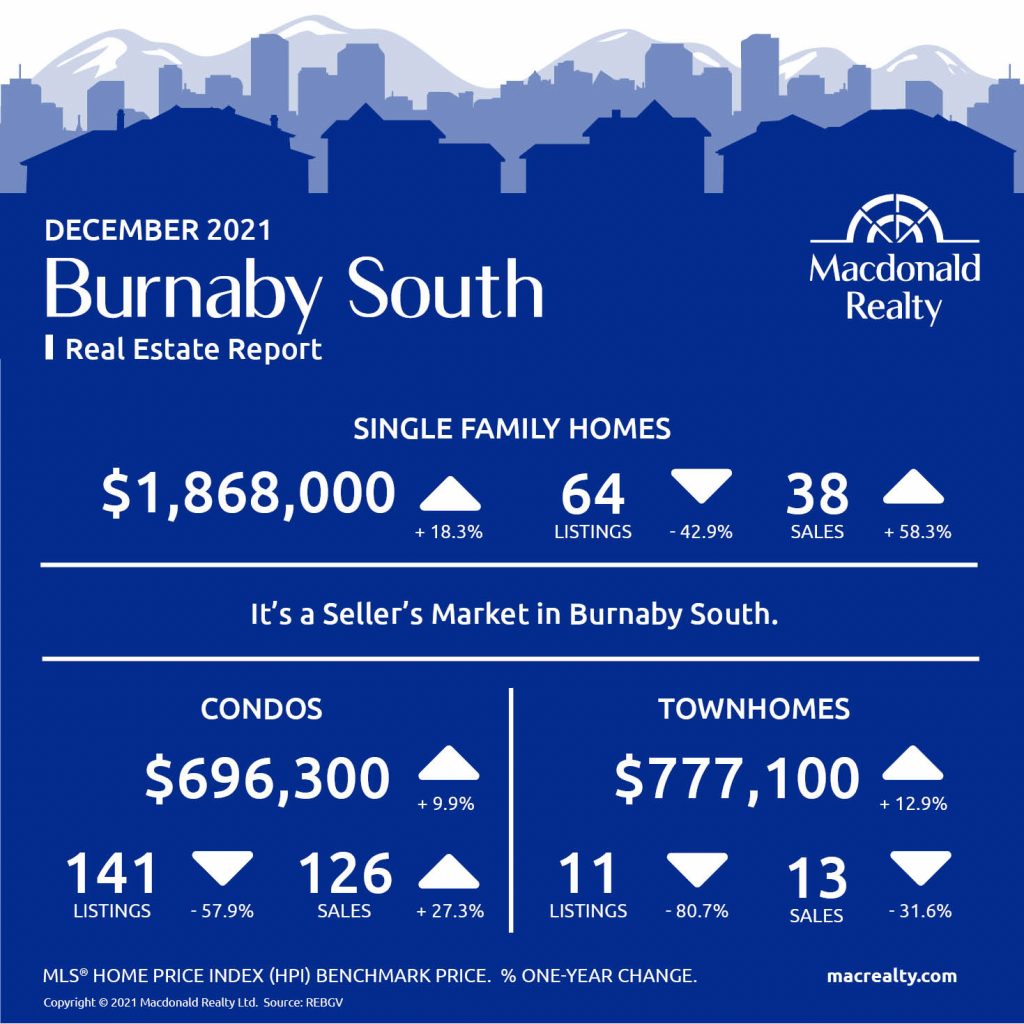
Burnaby South
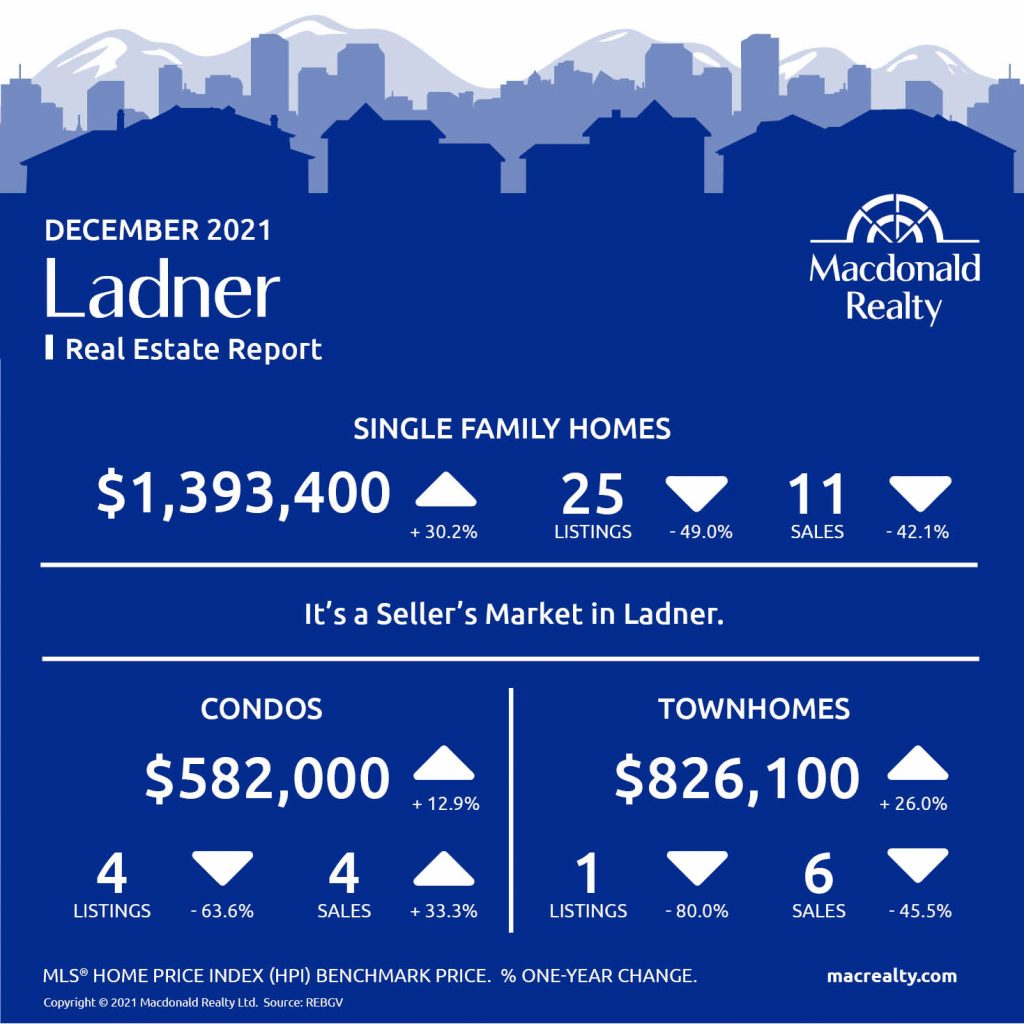
Ladner
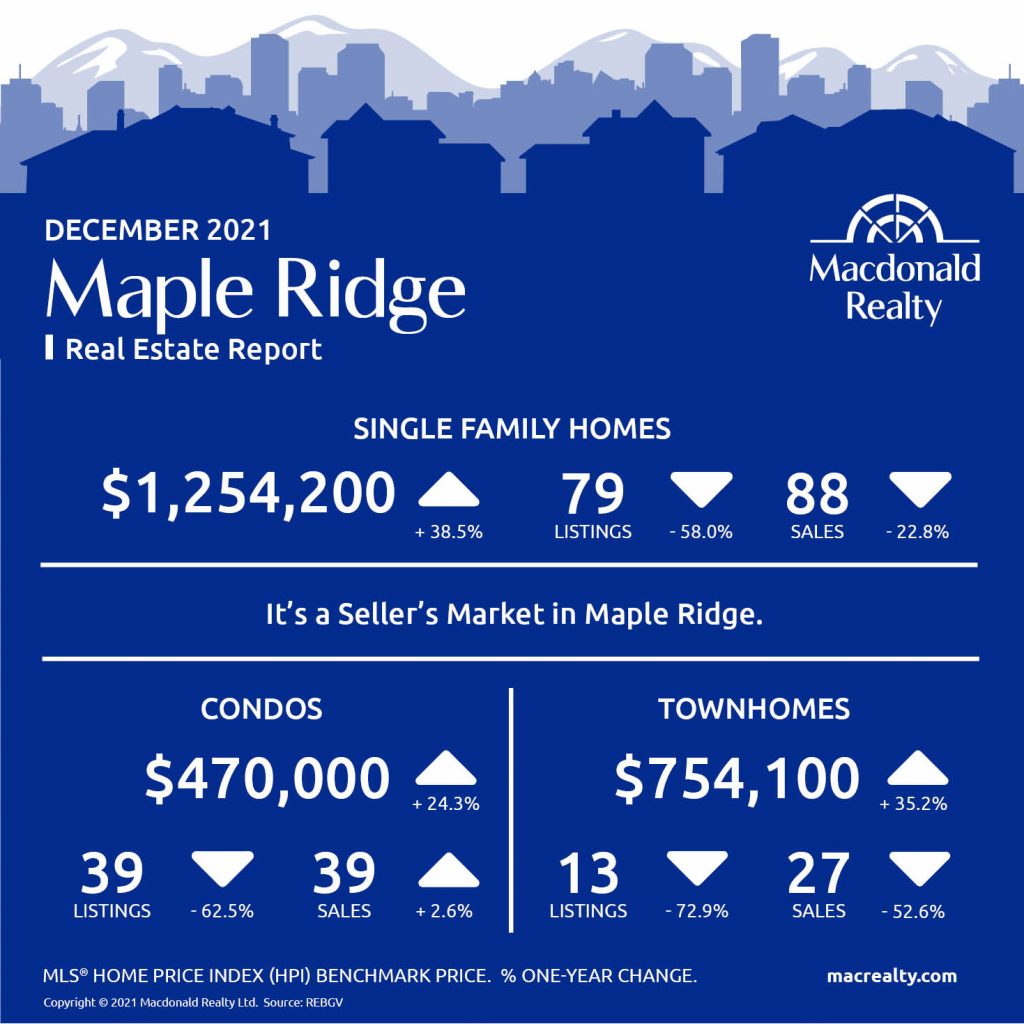
Maple Ridge
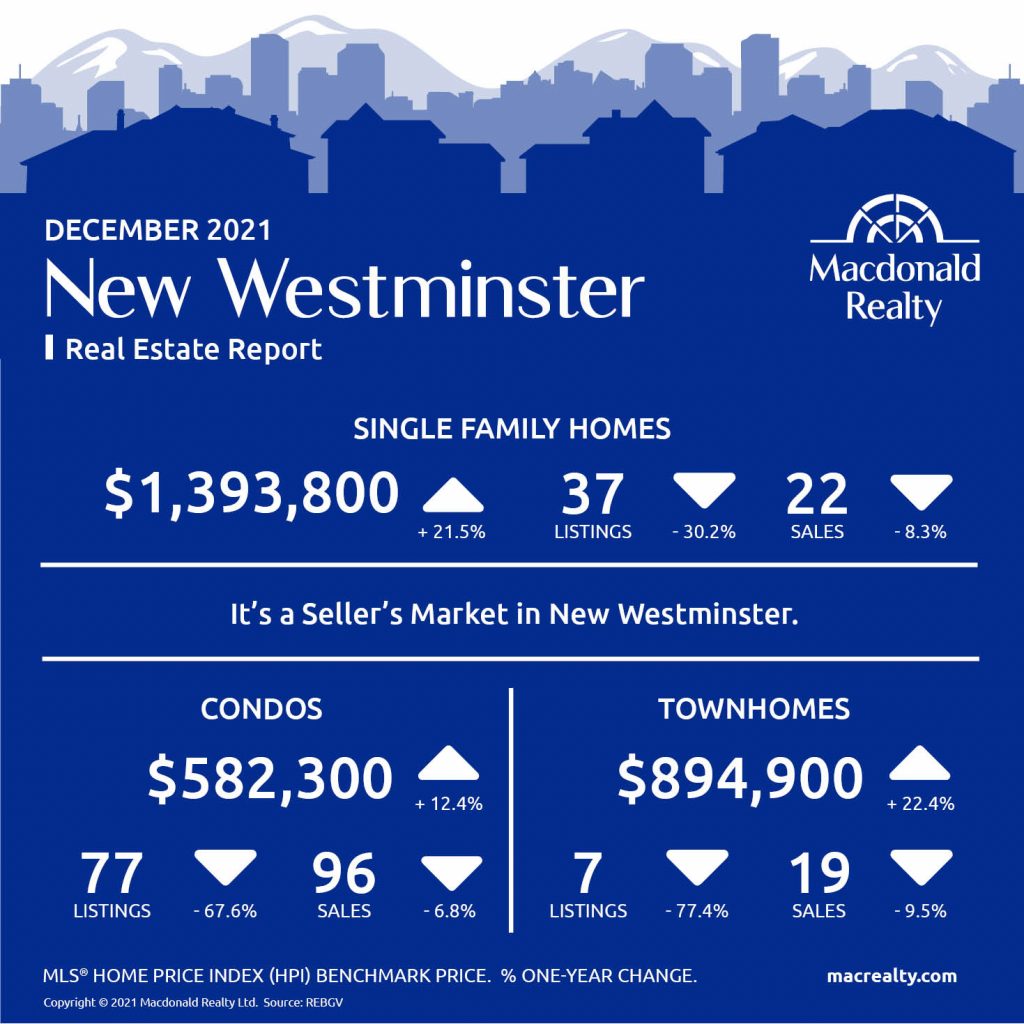
New Westminster
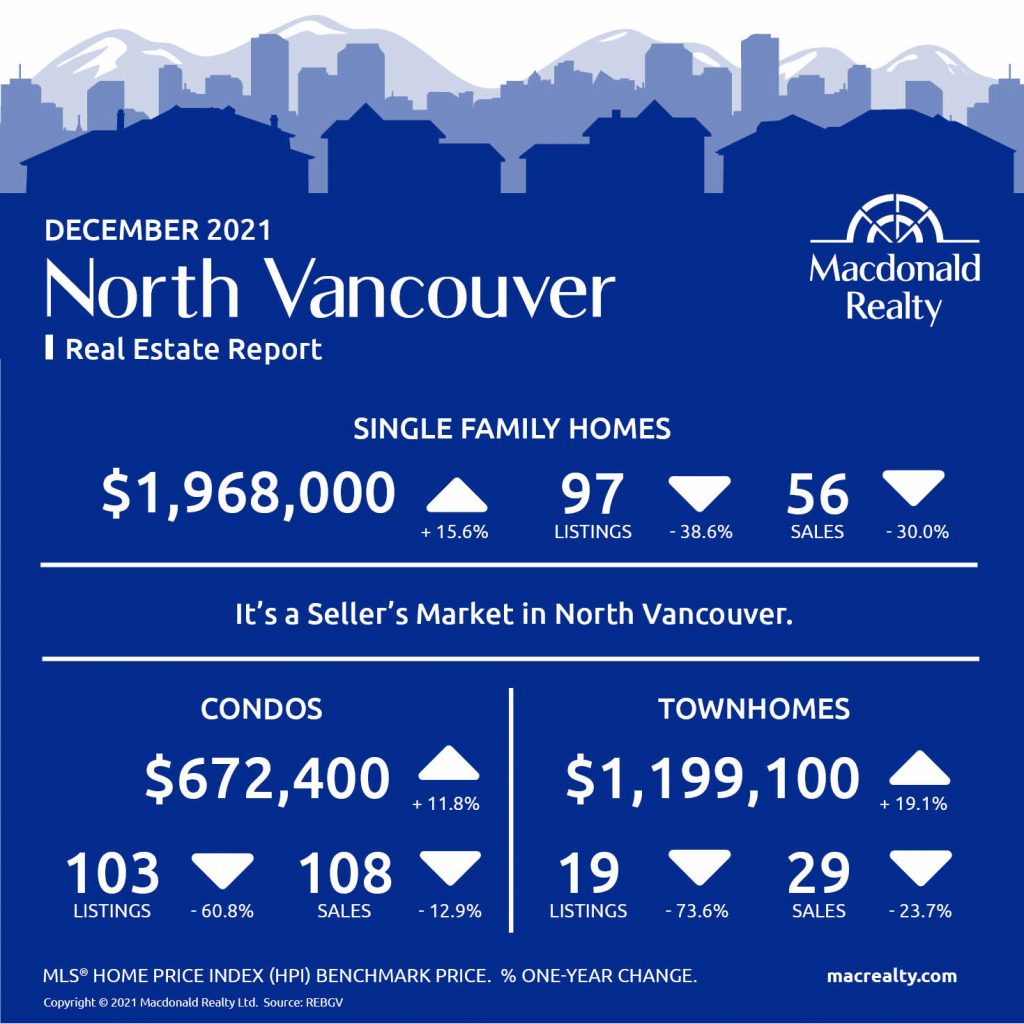
North Vancouver
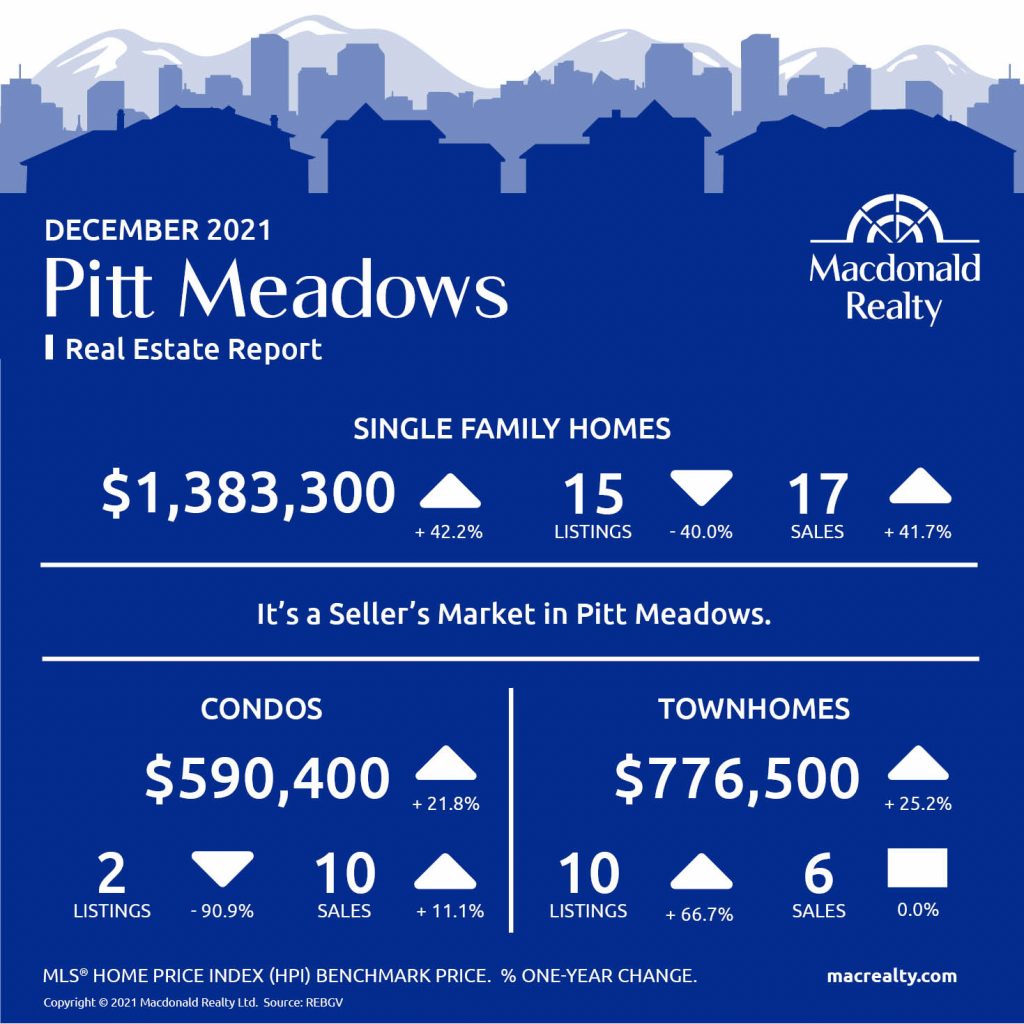
Pitt Meadows
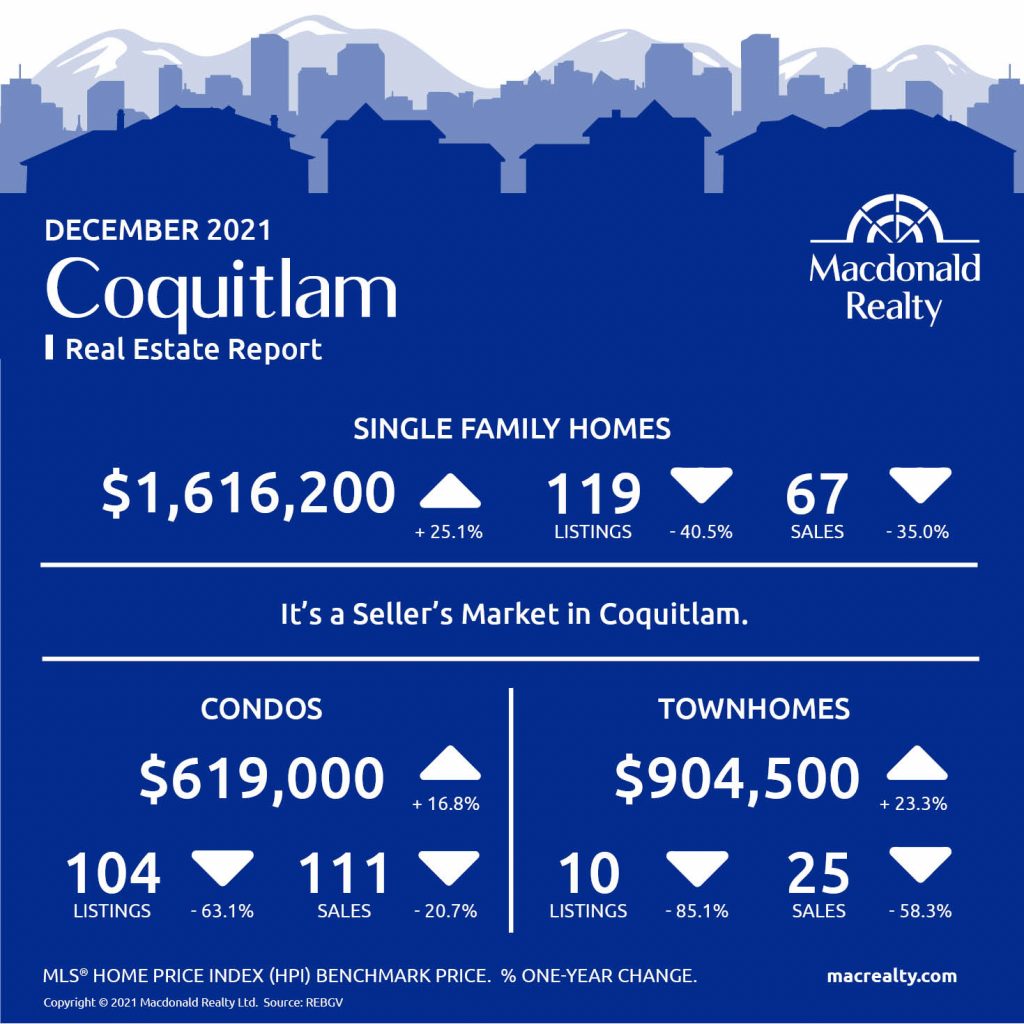
Coquitlam
Port Coquitlam
Port Moody
Richmond
Tsawwassen

Vancouver East

Vancouver West
West Vancouver
Looking for more information about the real estate market in specific neighbourhoods in the Greater Vancouver?
Macdonald Realty has offices across the Greater Vancouver. Please email [email protected] or call 1-877-278-3888 to be matched with a REALTOR® working in your area.
MLS® Home Price Index (HPI) Benchmark Price
Average and median home prices are often misinterpreted, are affected by change in the mix of homes sold, and can swing dramatically from month to month (based on the types and prices of properties that sold in a given month). The MLS® HPI overcomes these shortcomings and uses the concept of a benchmark home, a notional home with common attributes of typical homes in a defined area. Visit www.housepriceindex.ca for more information.
This blog post is based on market data provided by the Real Estate Board of Greater Vancouver (REBGV) www.rebgv.org

