
by Macrealty Marketing Team | Dec 7, 2021 | Market Updates
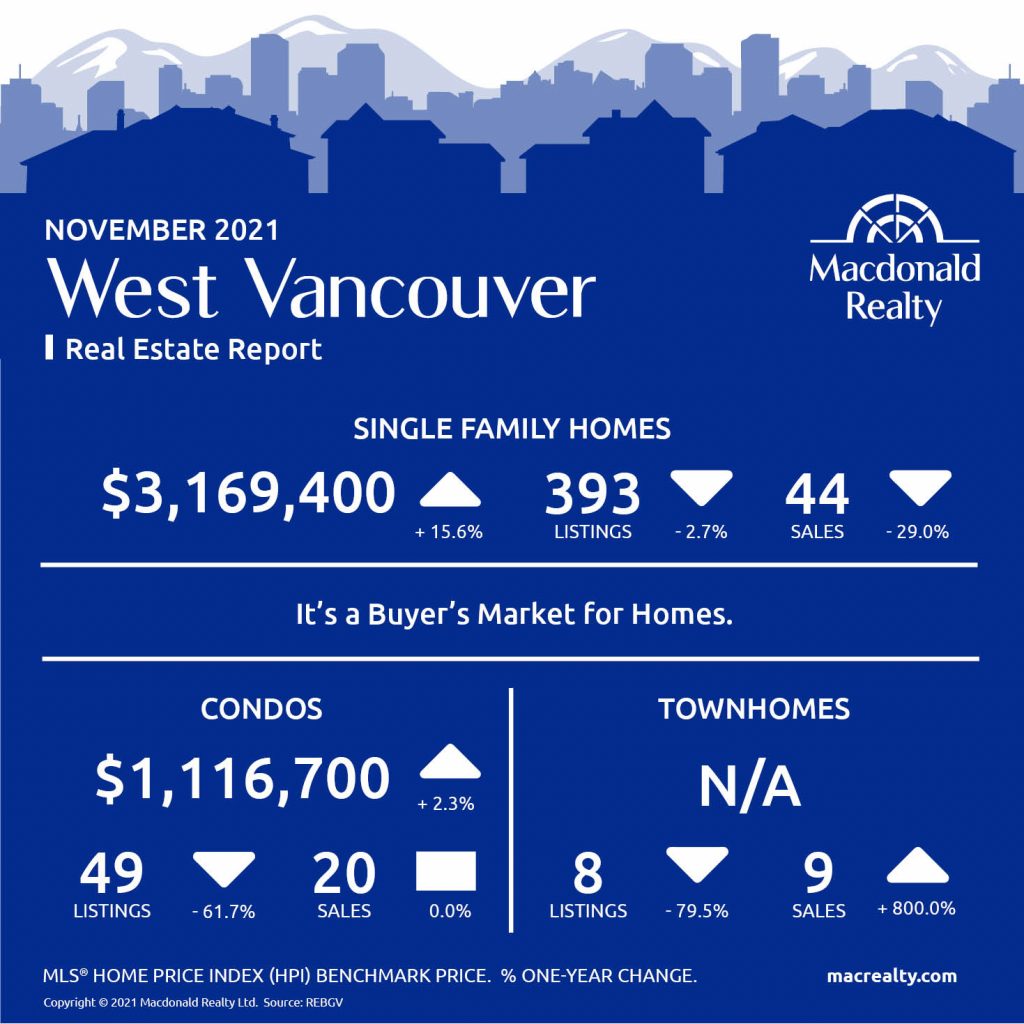
Here are the latest real estate market statistics from Macdonald Realty on the Greater Vancouver listings and sales in November 2021.
Find all the infographics by visiting the Facebook Album.
As released by the Board, home sale activity remains elevated across Metro Vancouver’s* housing market while the pace of homes being listed for sale continues to follow long-term averages.
“We expect home sale totals to end the year at or near an all-time record in our region,” Keith Stewart, REBGV economist said. “We’ve had elevated home sale activity throughout 2021 despite persistently low levels of homes available for sale. With a new year around the corner, it’s critical that this supply crunch remains the focus for addressing the housing affordability challenges in our region.”
The Board also has informed:
“The imbalance between supply and demand, coupled with some buyers wanting to use rate holds on lower rate fixed-term mortgages, is keeping upward pressure on home prices in this traditionally quieter time of year for the market.”
*Areas covered by the Real Estate Board of Greater Vancouver include Burnaby, Coquitlam, Maple Ridge, New Westminster, North Vancouver, Pitt Meadows, Port Coquitlam, Port Moody, Richmond, South Delta, Squamish, Sunshine Coast, Vancouver, West Vancouver, and Whistler. Check out the infographics of Squamish, Sunshine Coast and Whistler, HERE.
Bowen Island

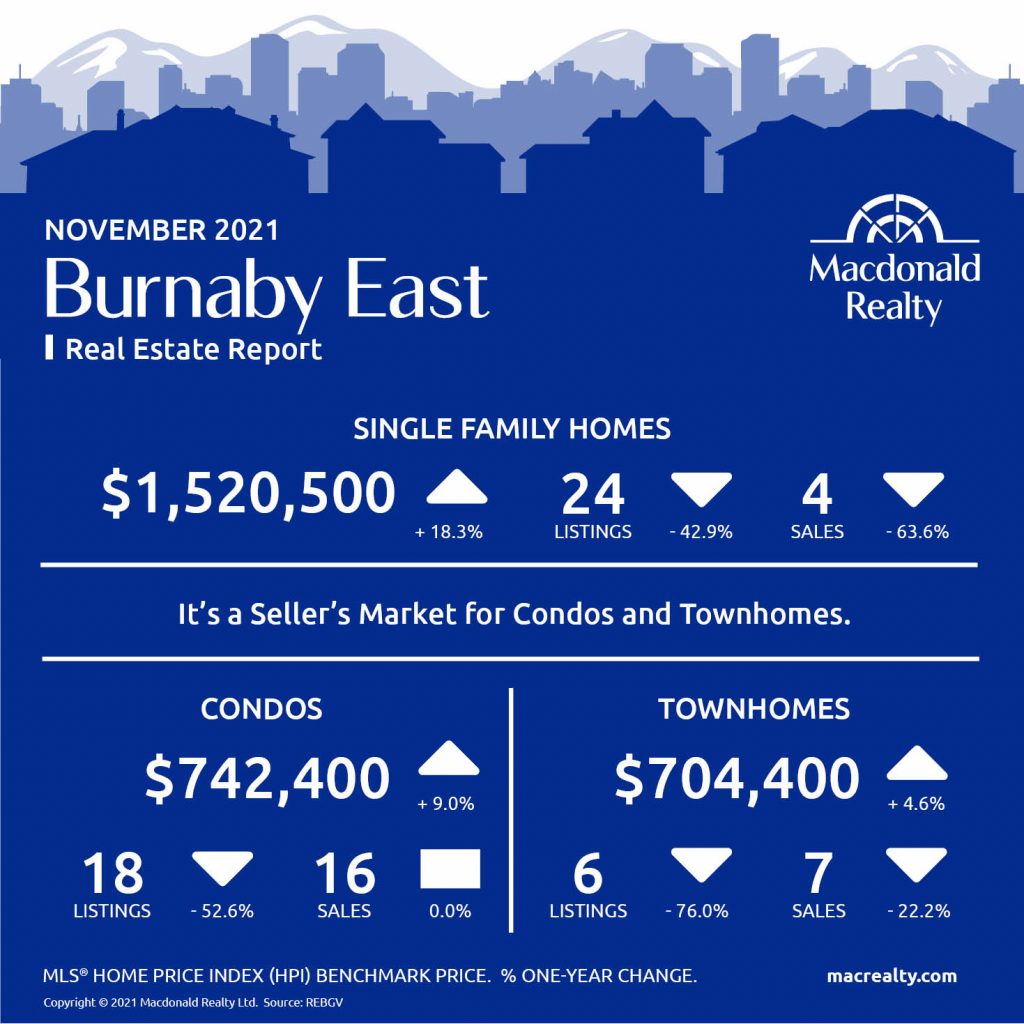
Burnaby East
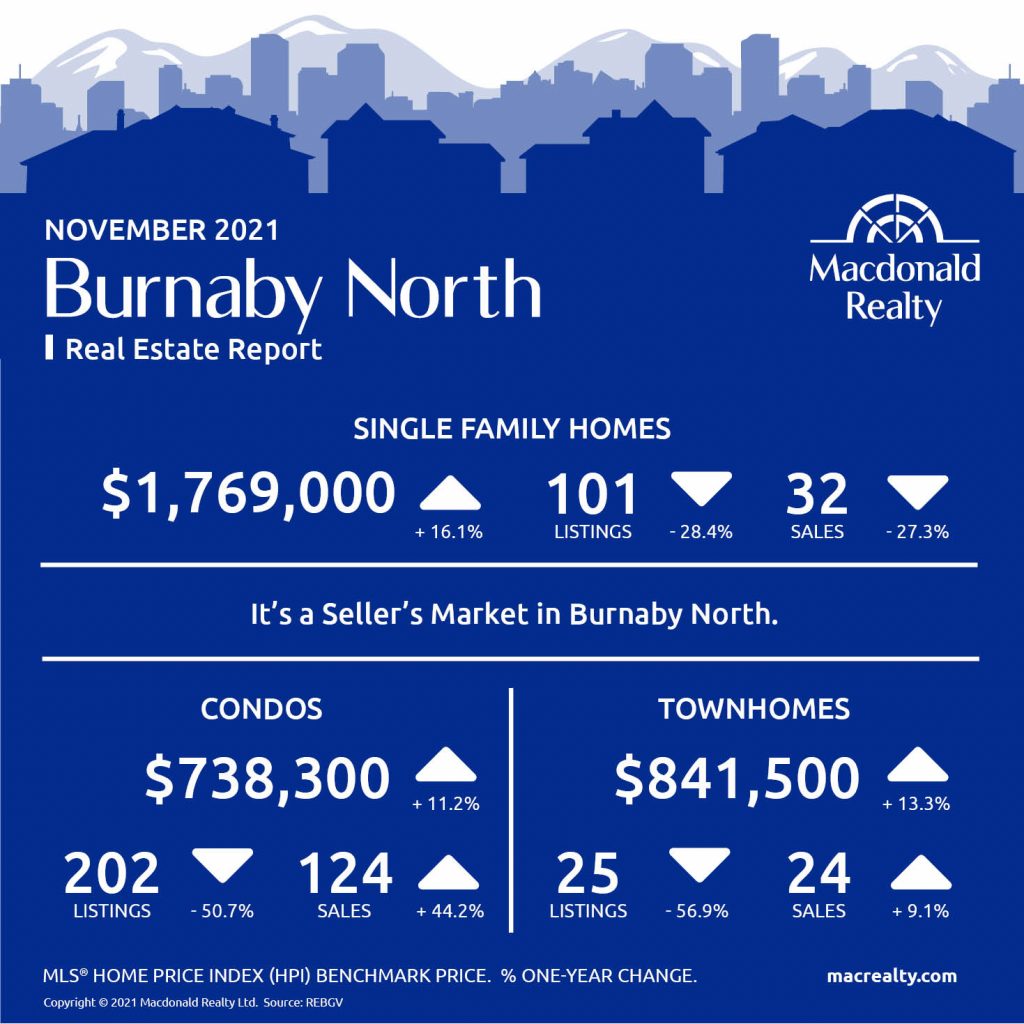
Burnaby North
Burnaby South

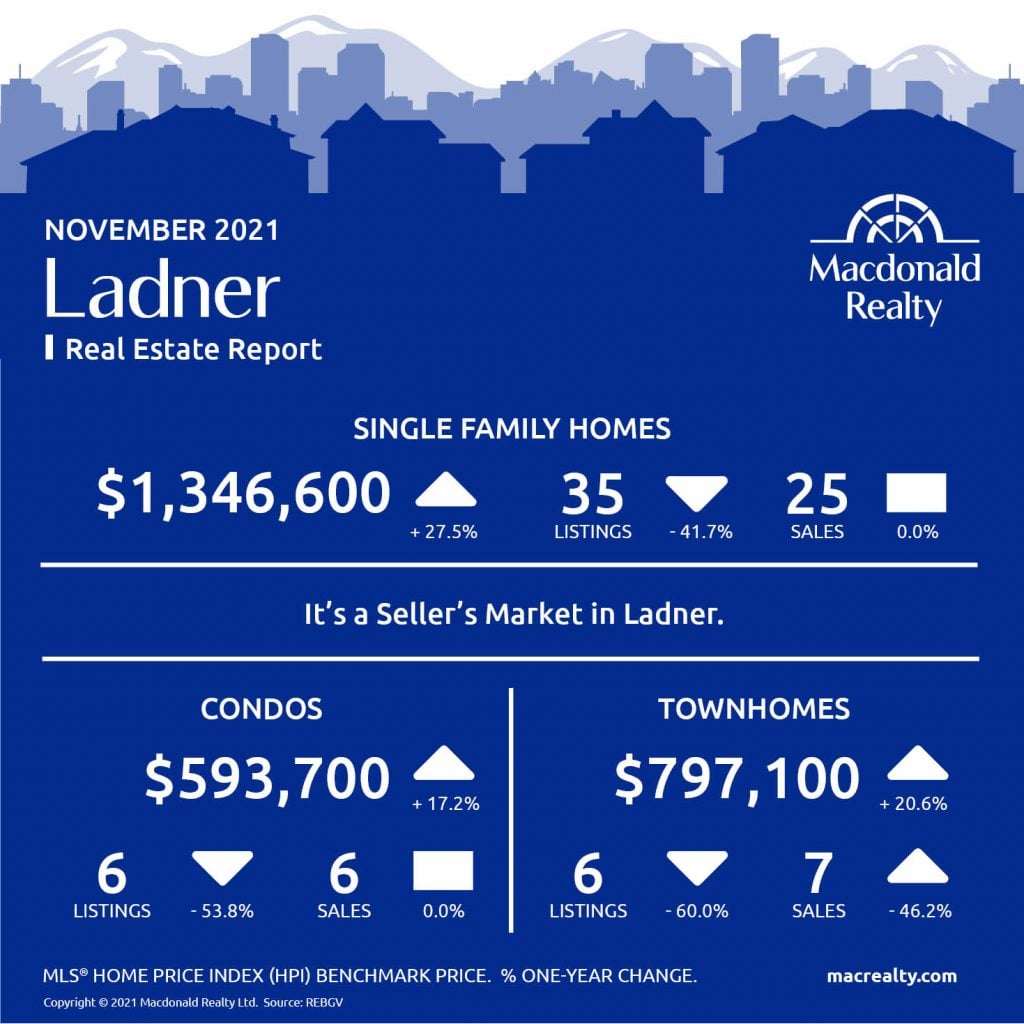
Ladner
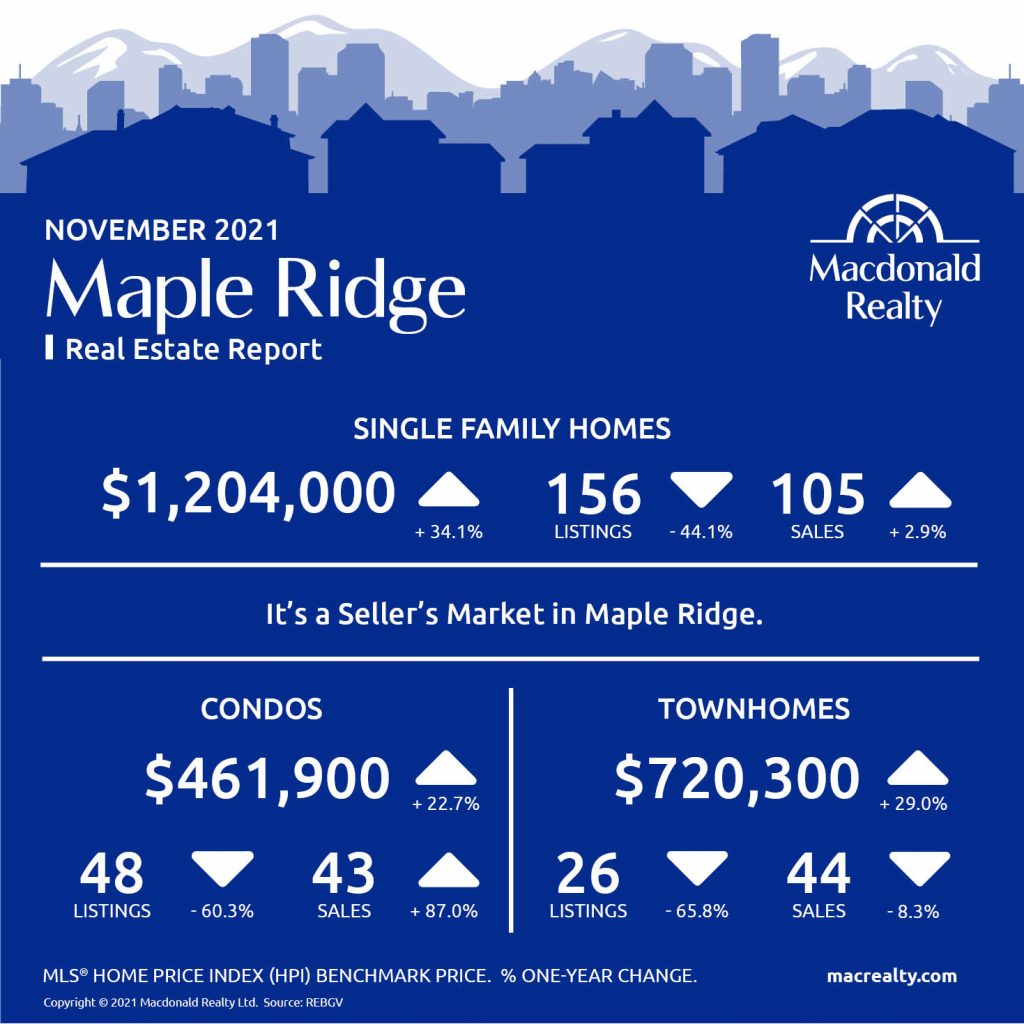
Maple Ridge
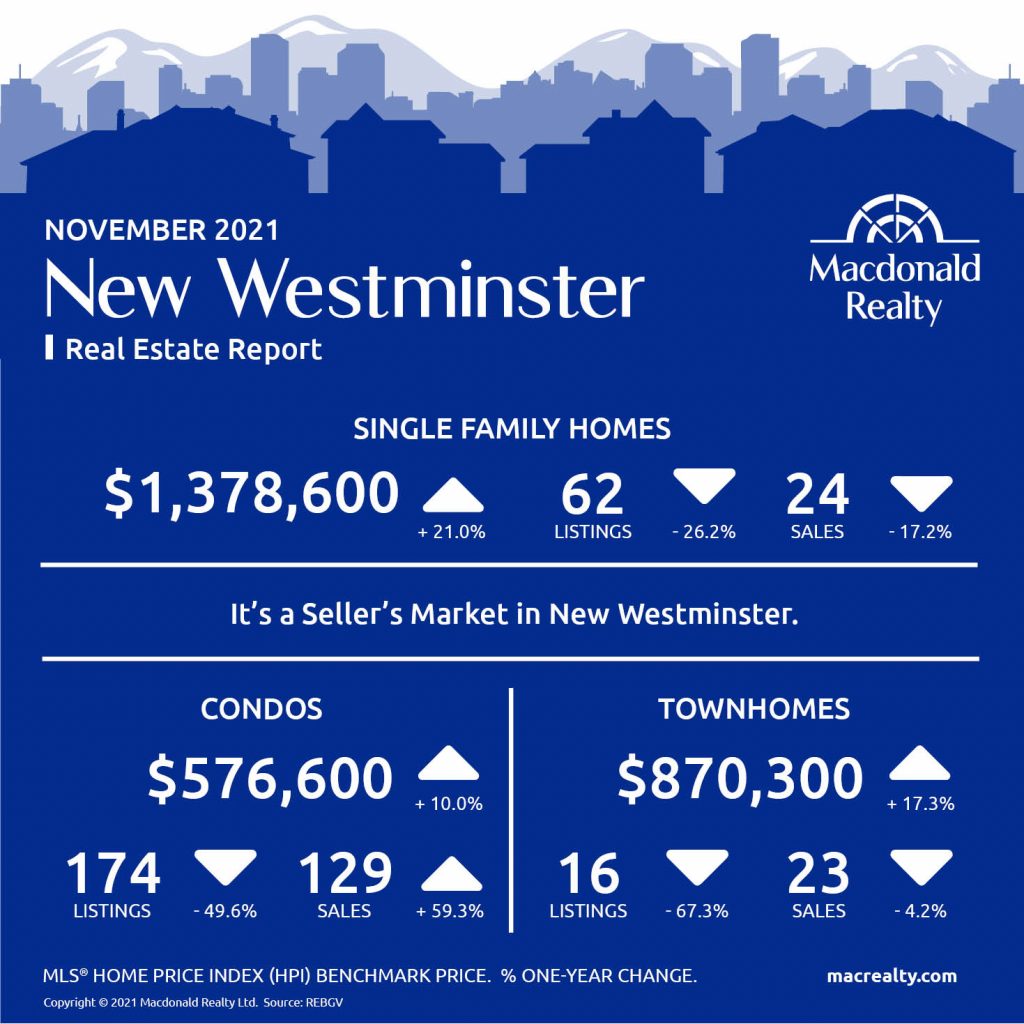
New Westminster
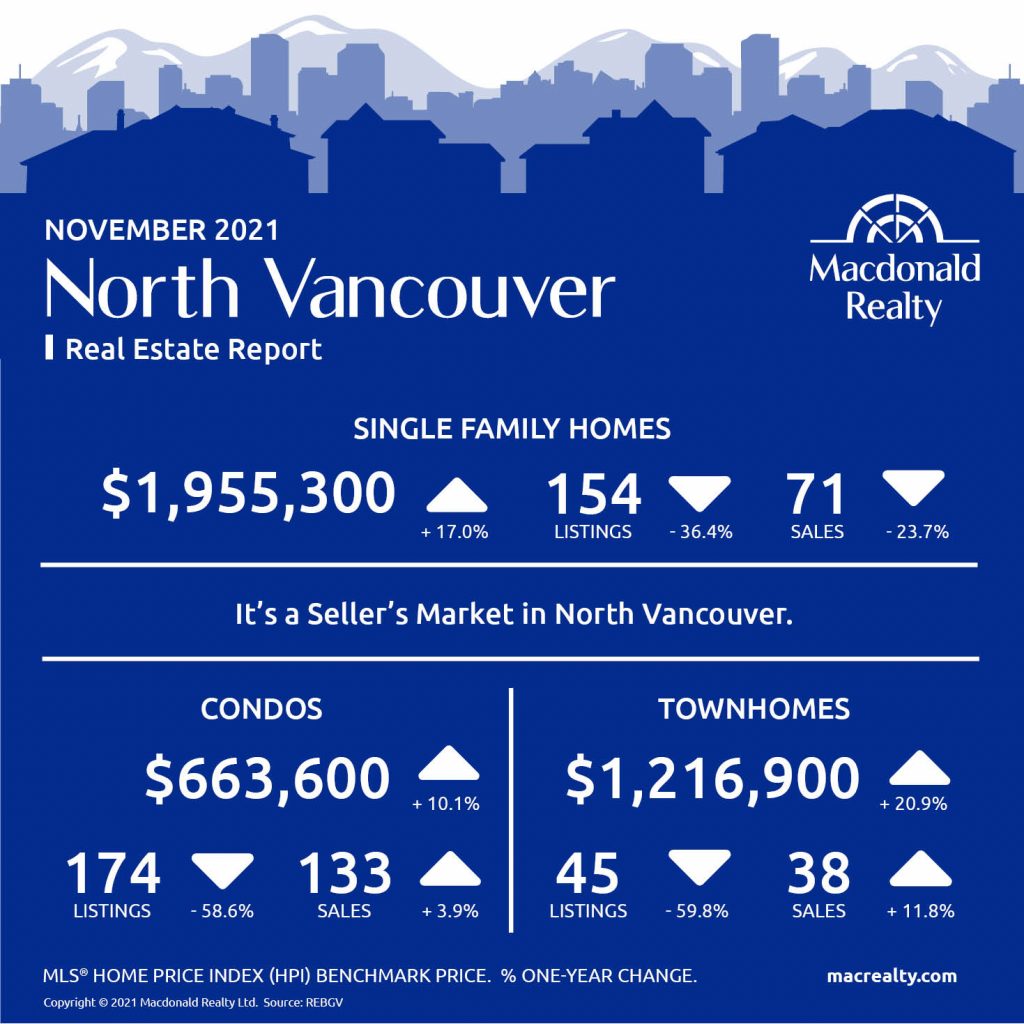
North Vancouver
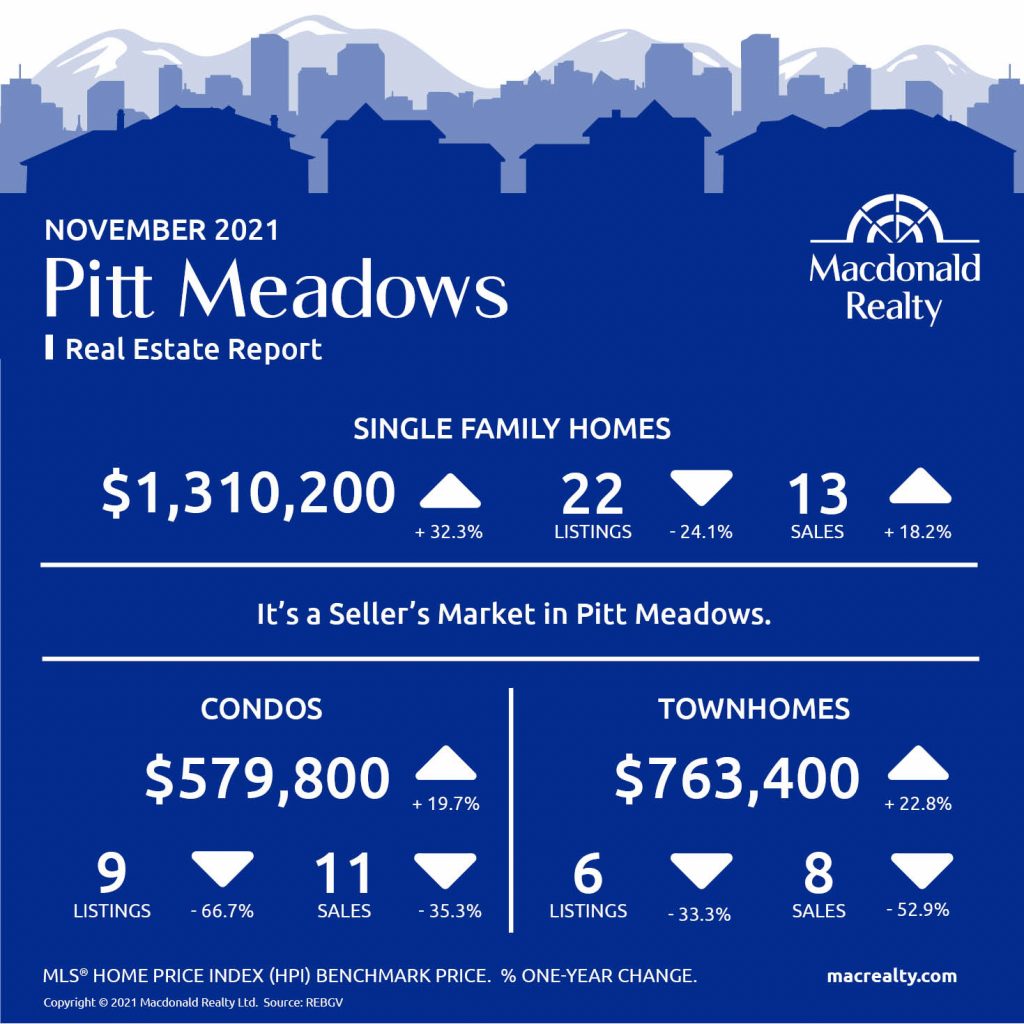
Pitt Meadows
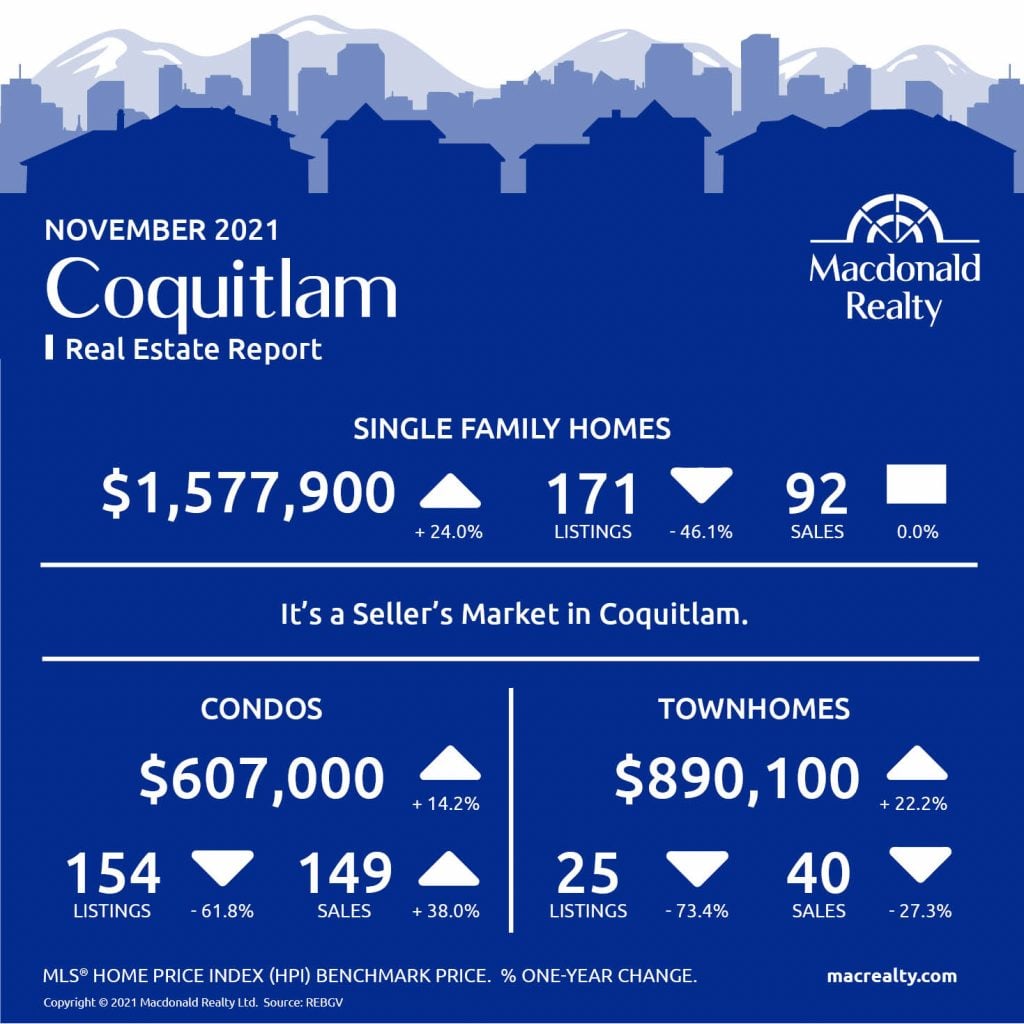
Coquitlam
Port Coquitlam

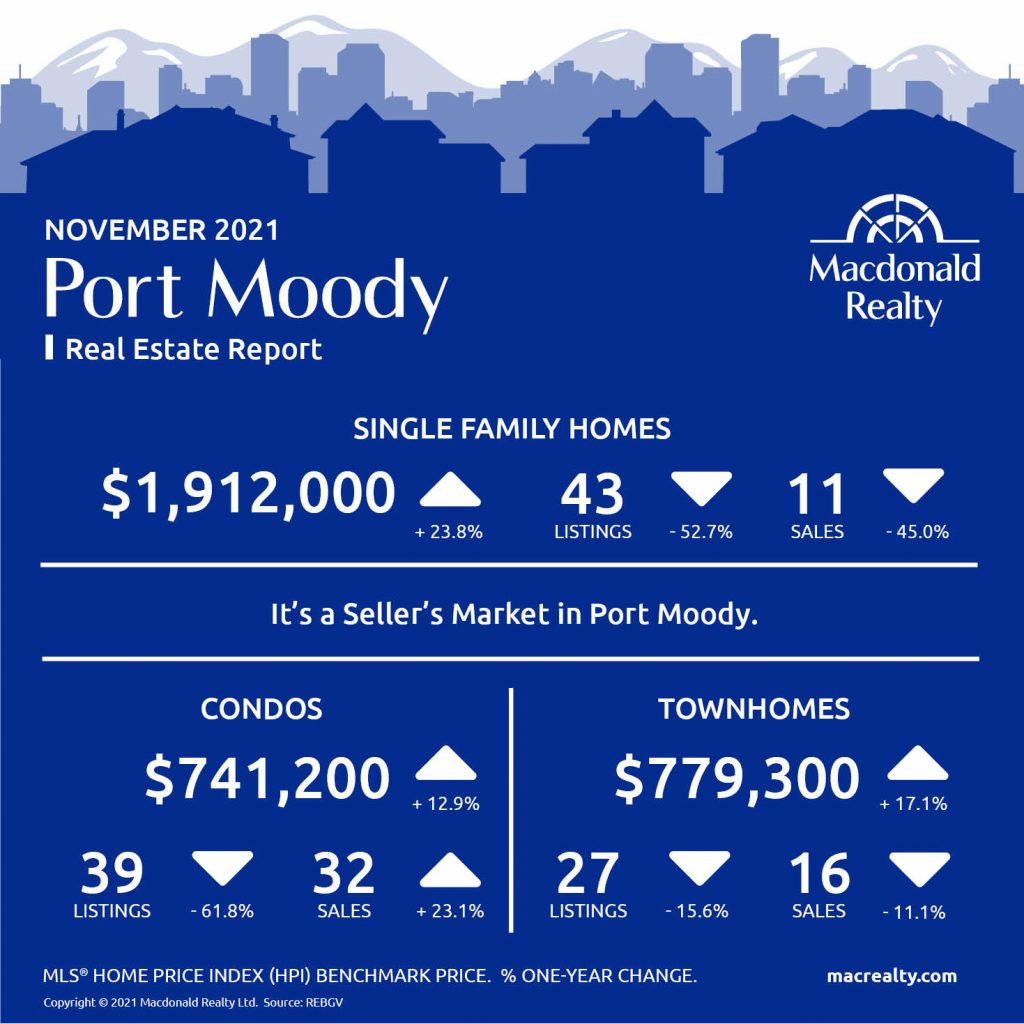
Port Moody
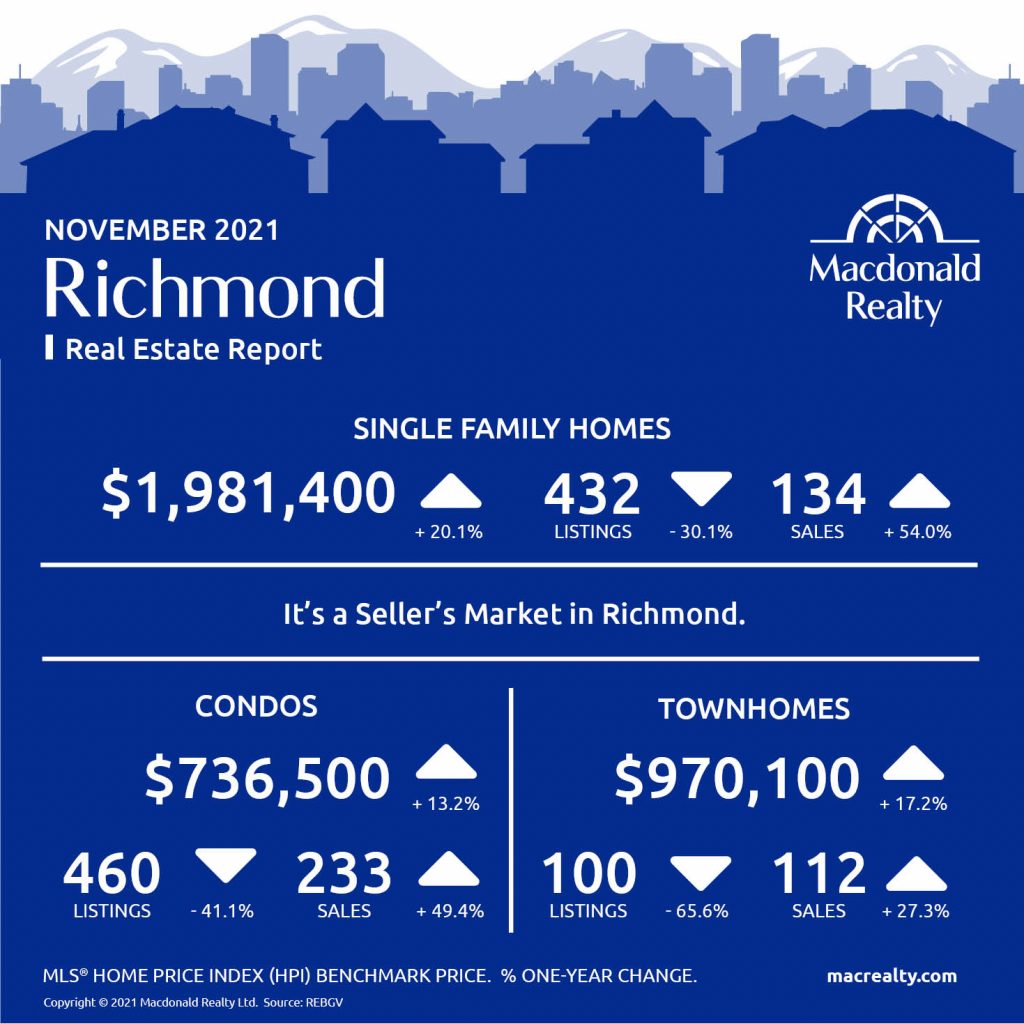
Richmond
Tsawwassen

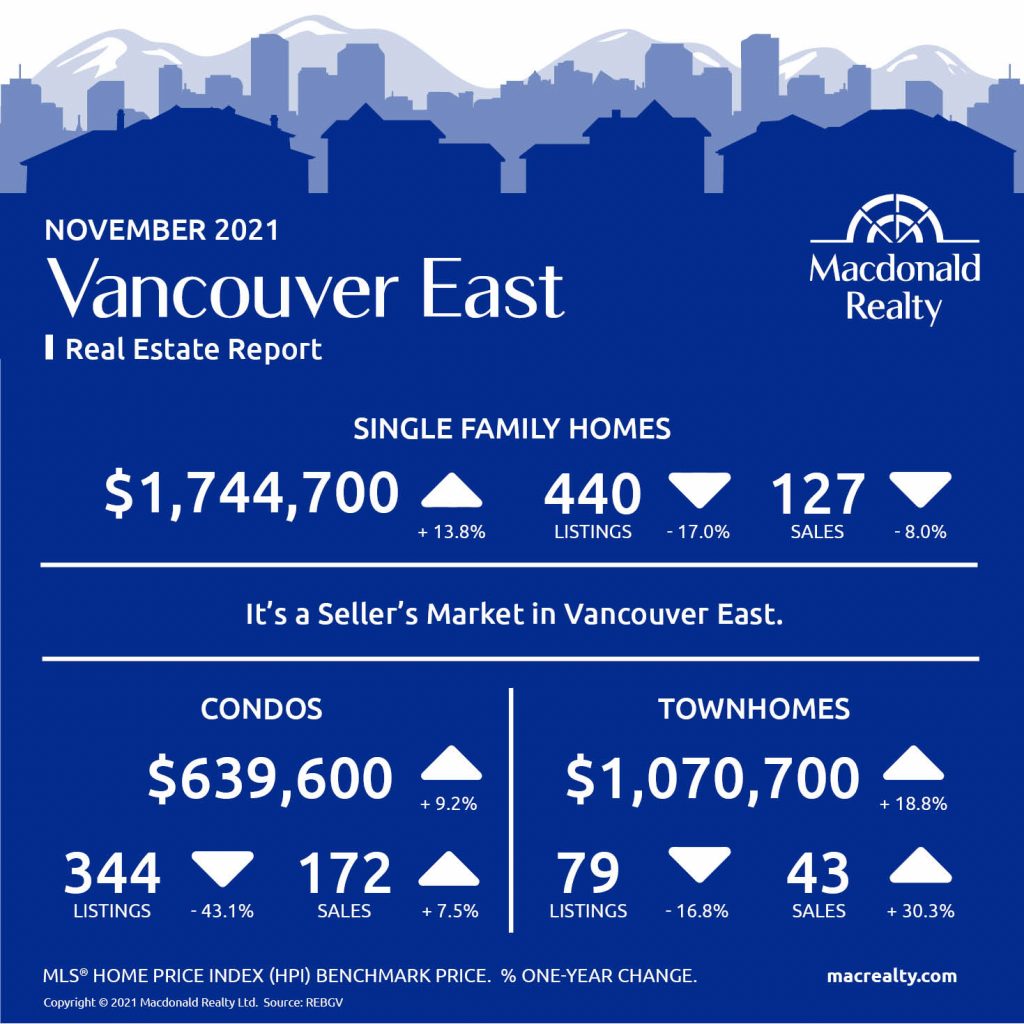
Vancouver East
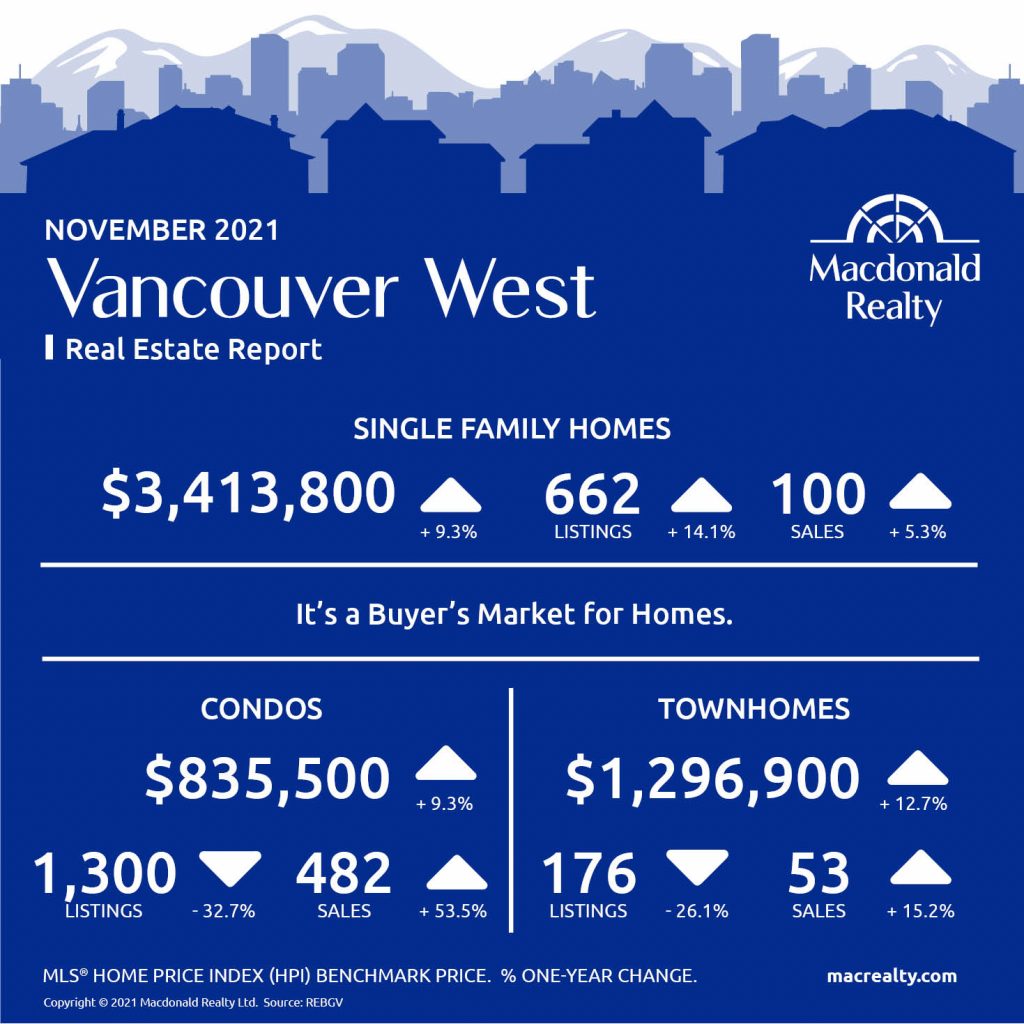
Vancouver West
West Vancouver
Looking for more information about the real estate market in specific neighbourhoods in the Greater Vancouver?
Macdonald Realty has offices across the Greater Vancouver. Please email [email protected] or call 1-877-278-3888 to be matched with a REALTOR® working in your area.
MLS® Home Price Index (HPI) Benchmark Price
Average and median home prices are often misinterpreted, are affected by change in the mix of homes sold, and can swing dramatically from month to month (based on the types and prices of properties that sold in a given month). The MLS® HPI overcomes these shortcomings and uses the concept of a benchmark home, a notional home with common attributes of typical homes in a defined area. Visit www.housepriceindex.ca for more information.
This blog post is based on market data provided by the Real Estate Board of Greater Vancouver (REBGV) www.rebgv.org

by Macrealty Marketing Team | Nov 5, 2021 | Market Updates
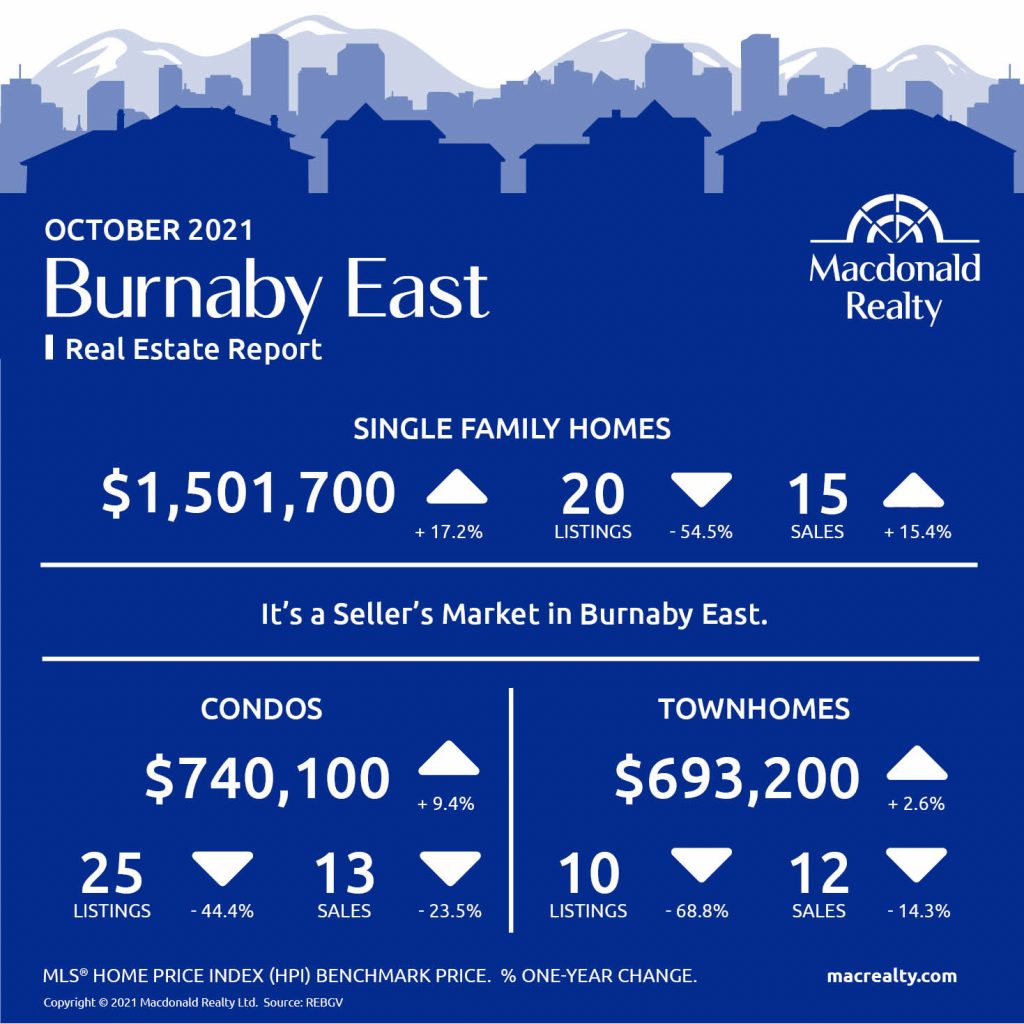
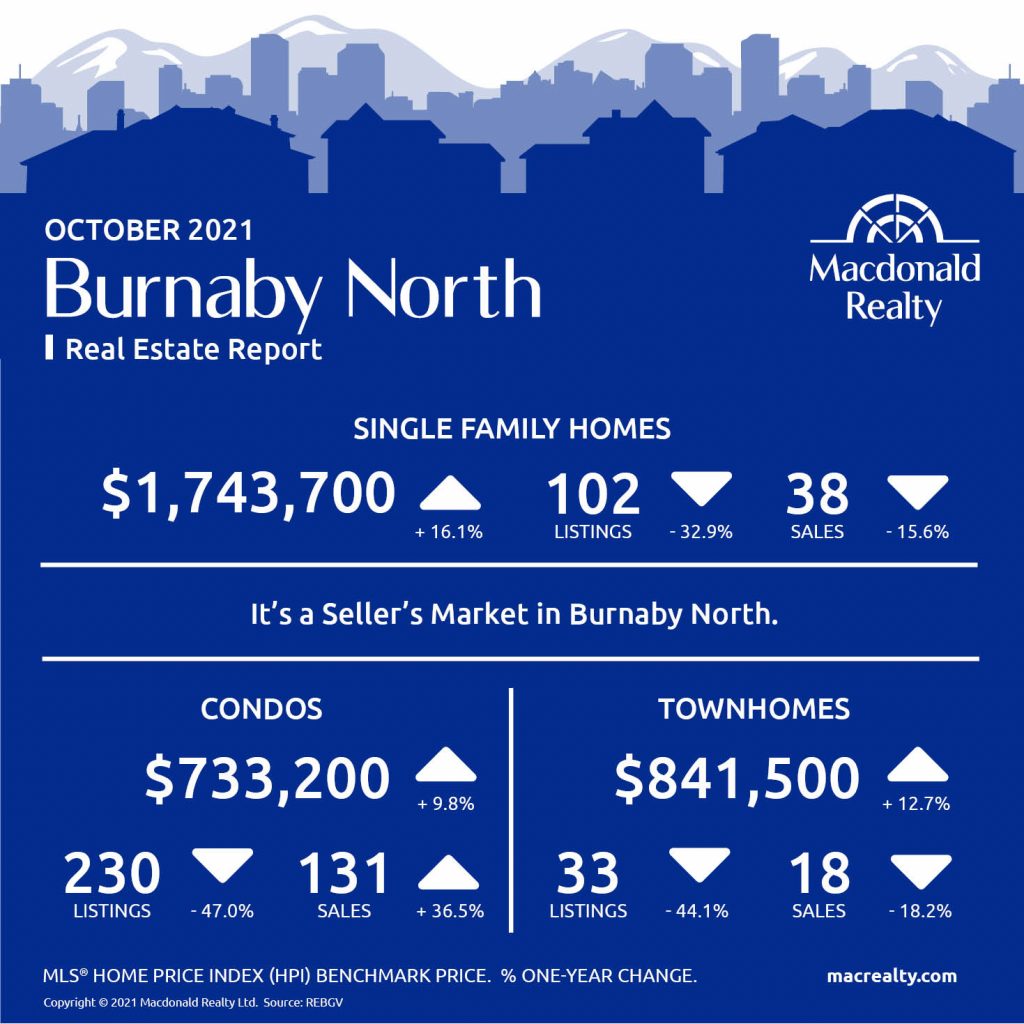
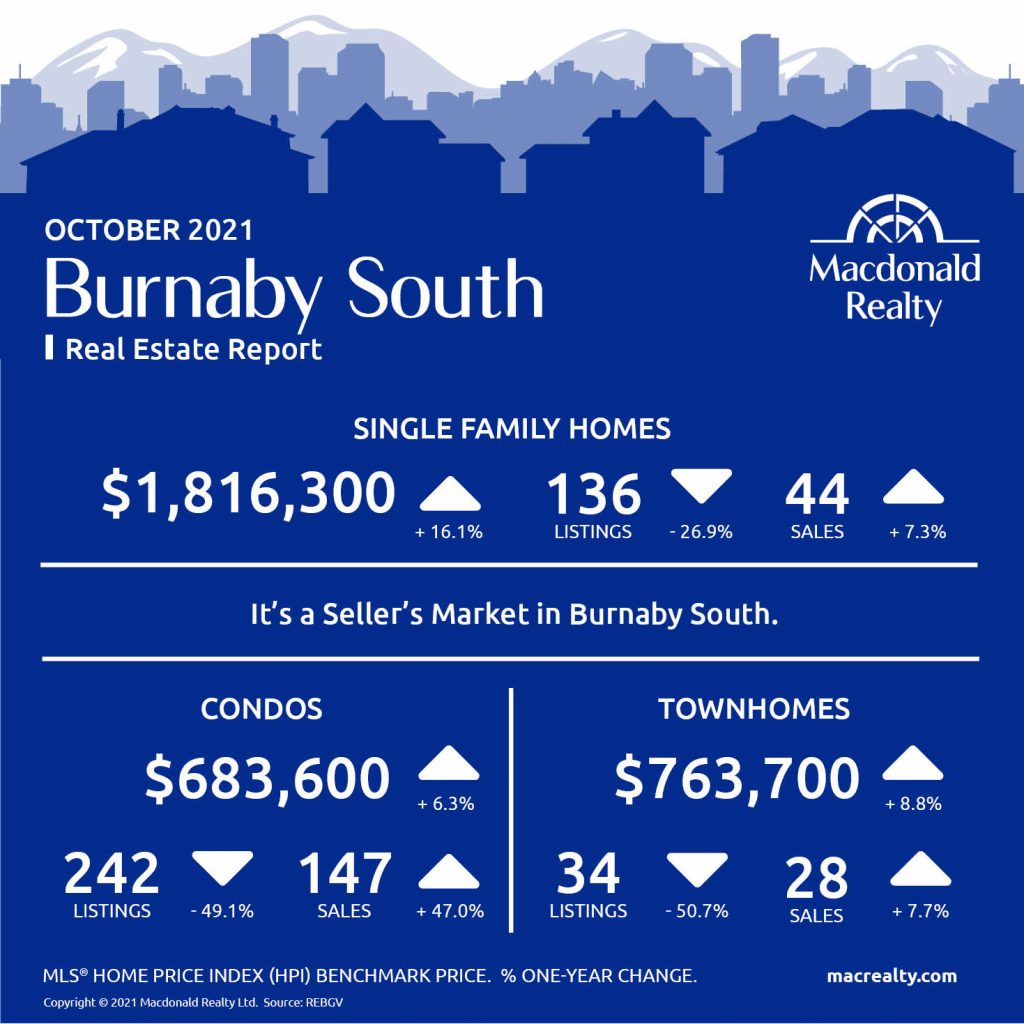
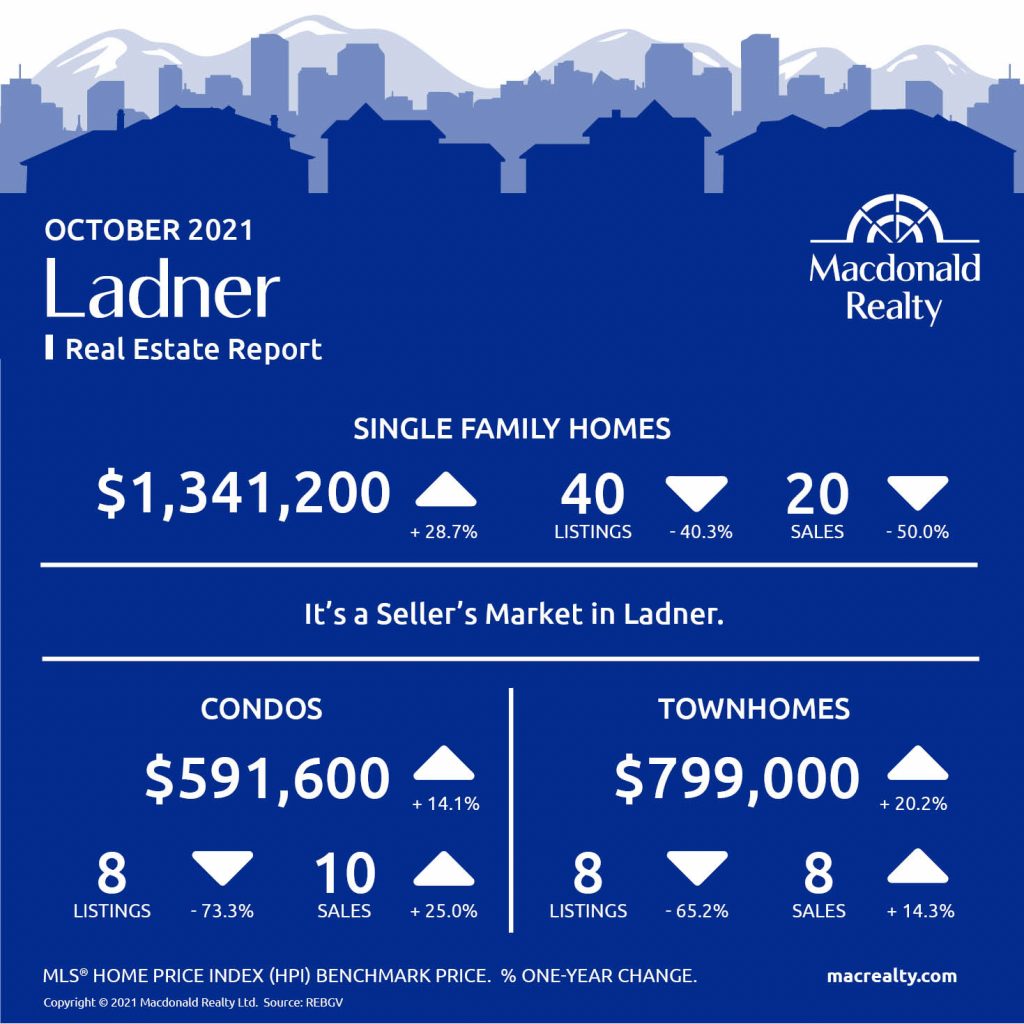
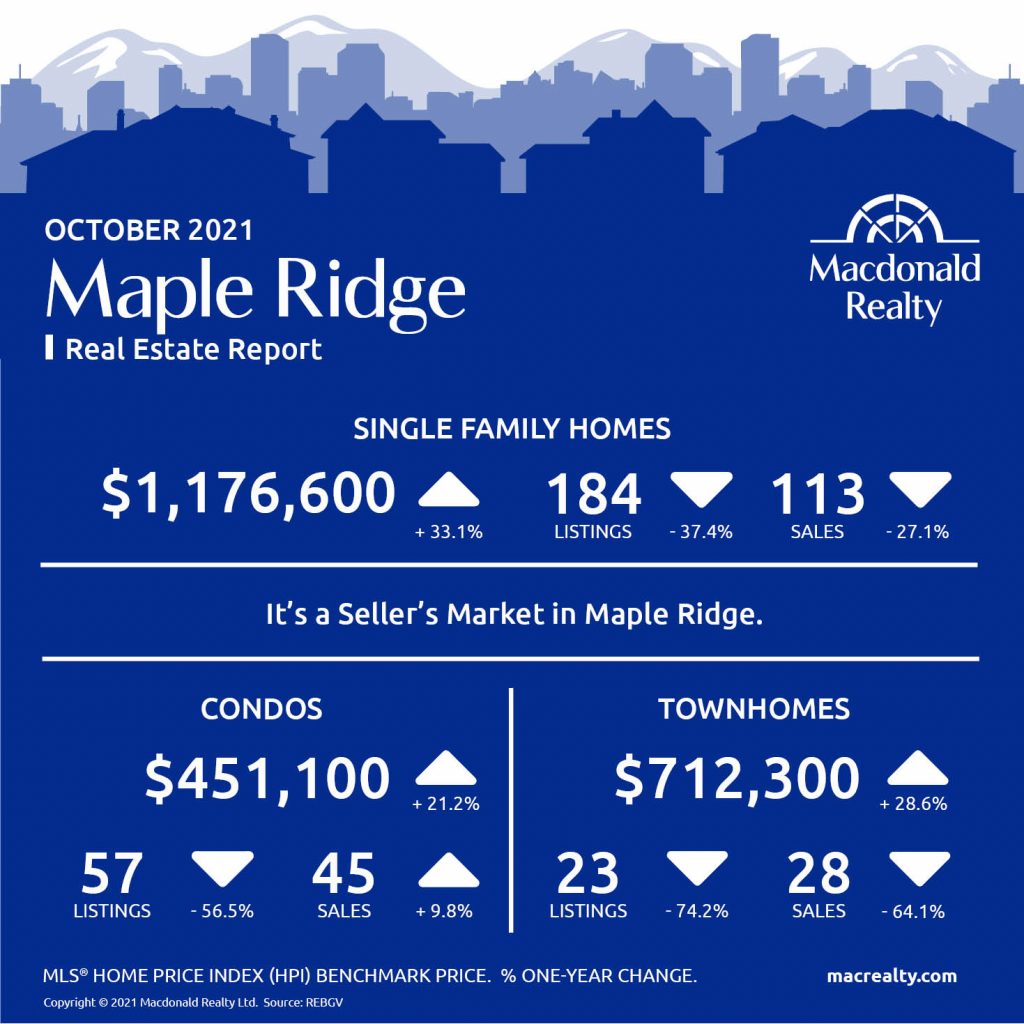
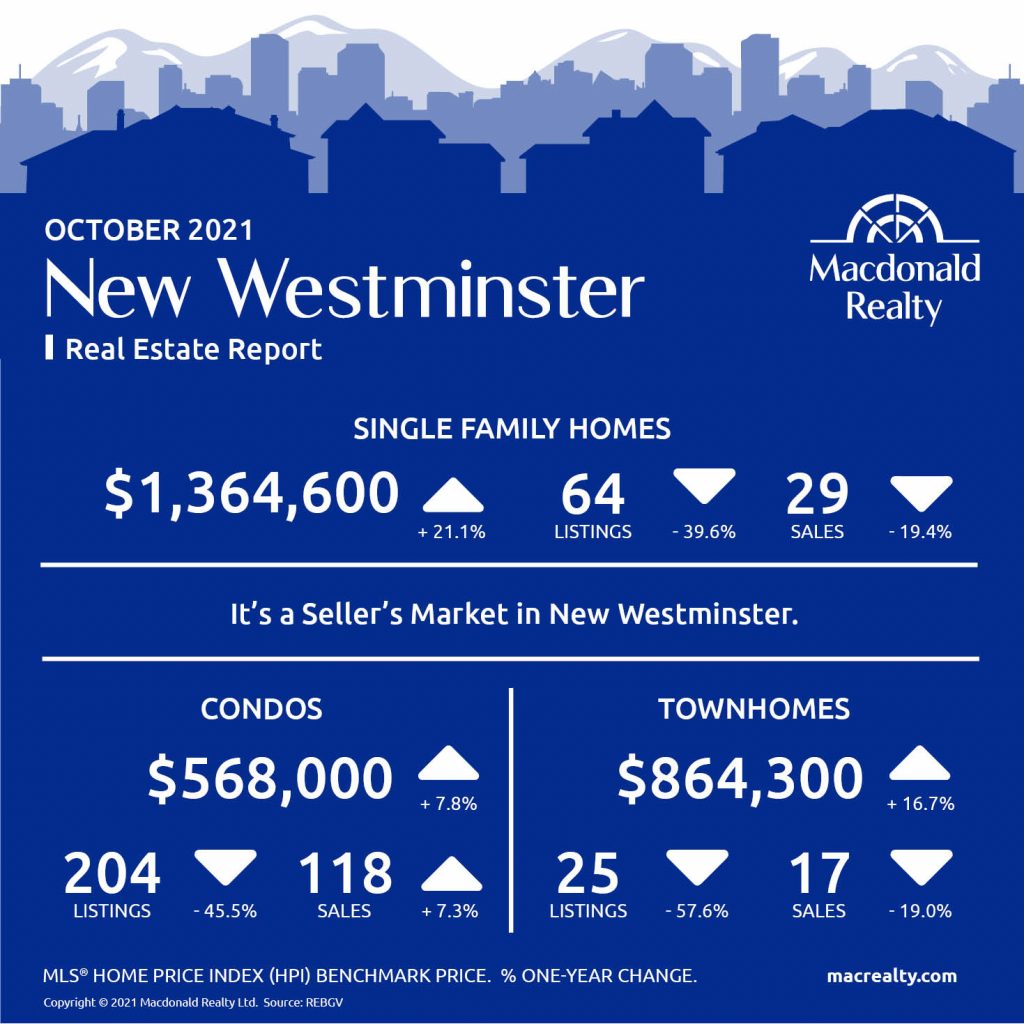
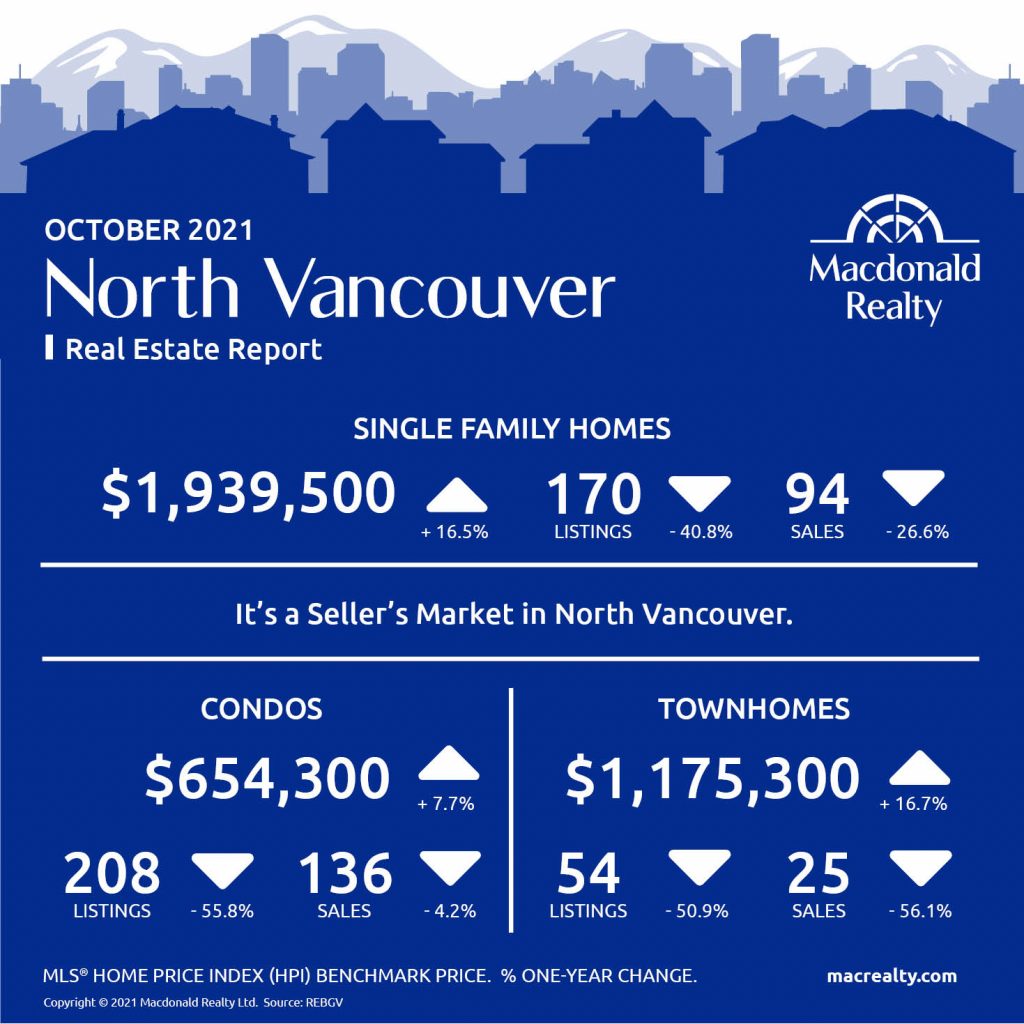
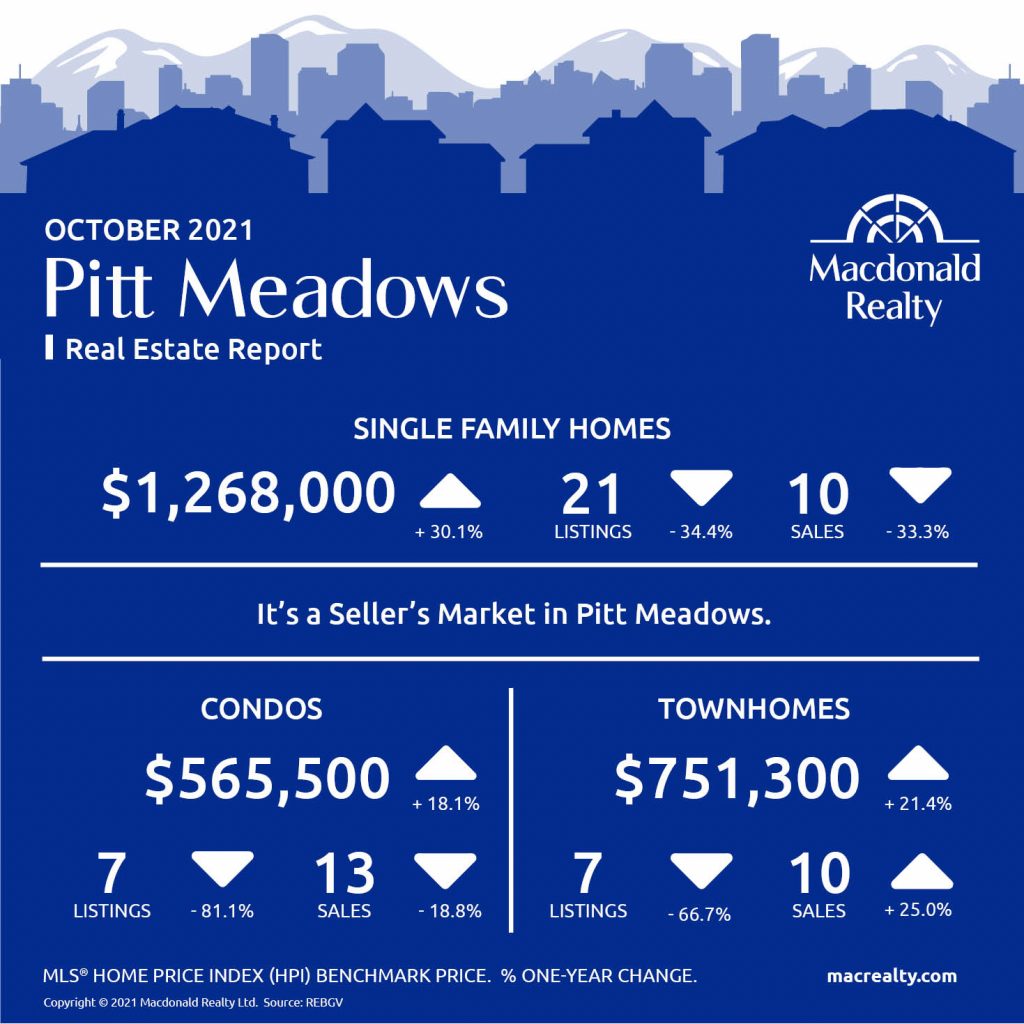
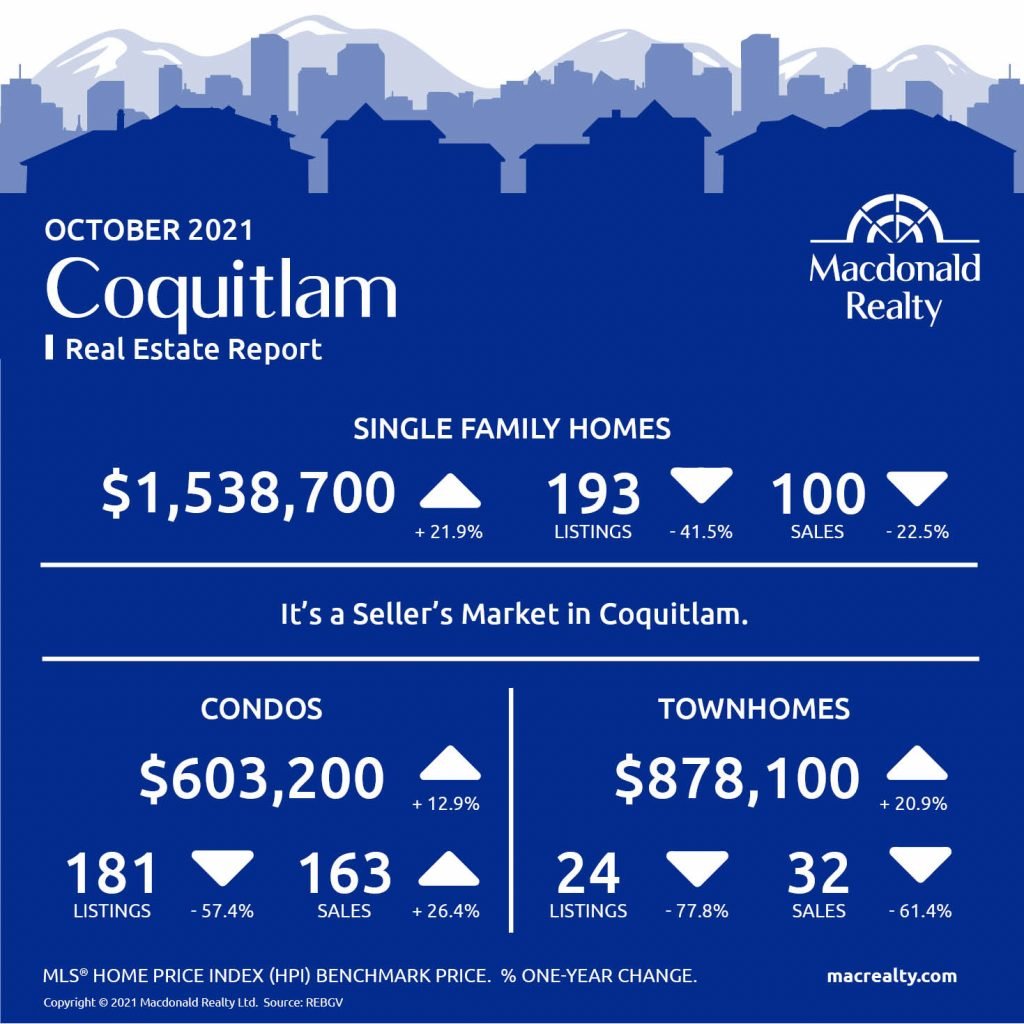
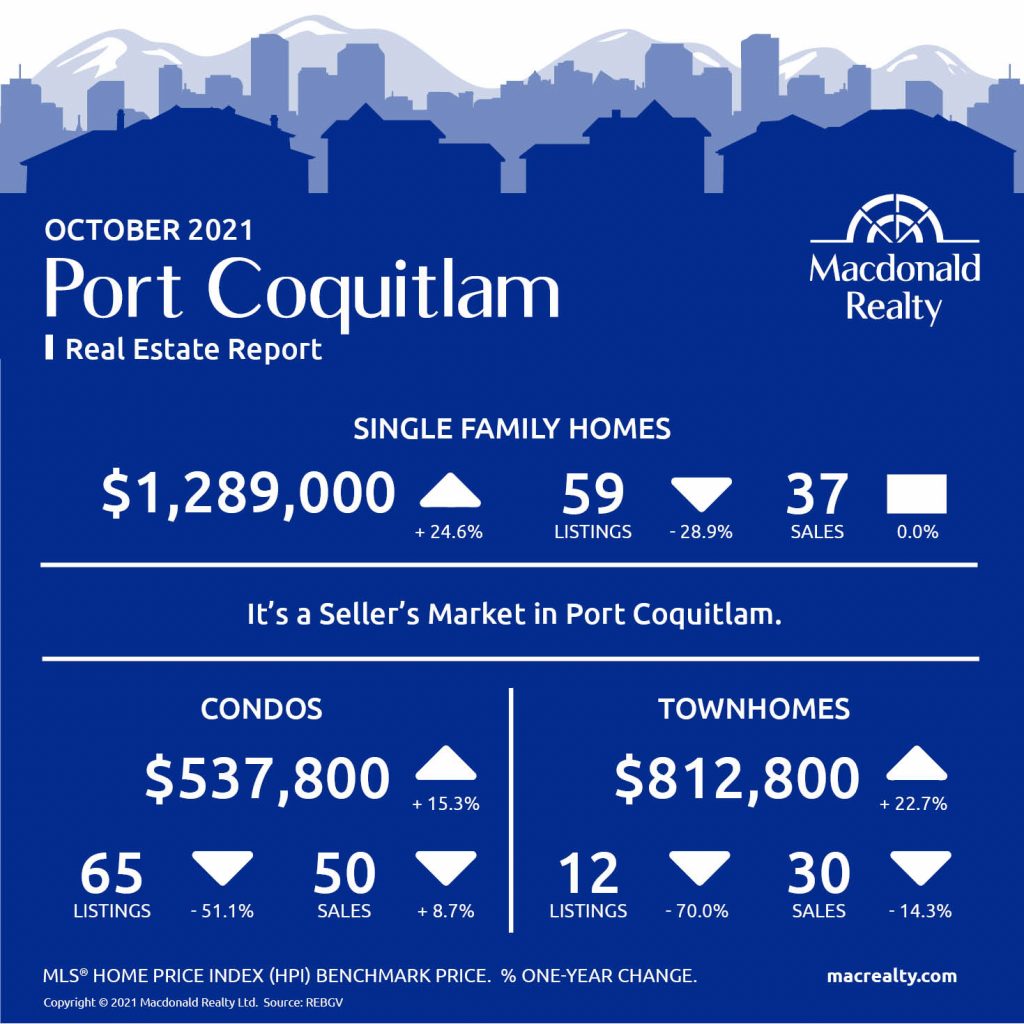
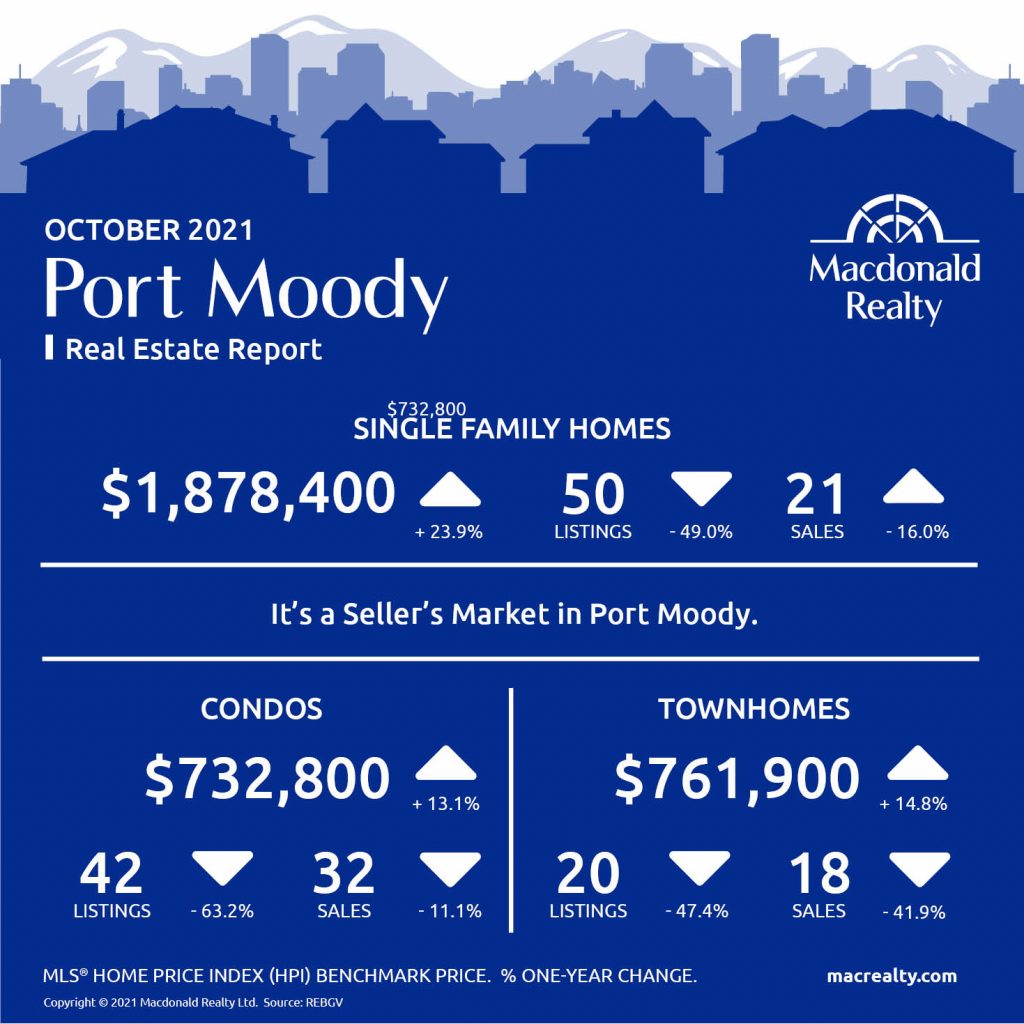
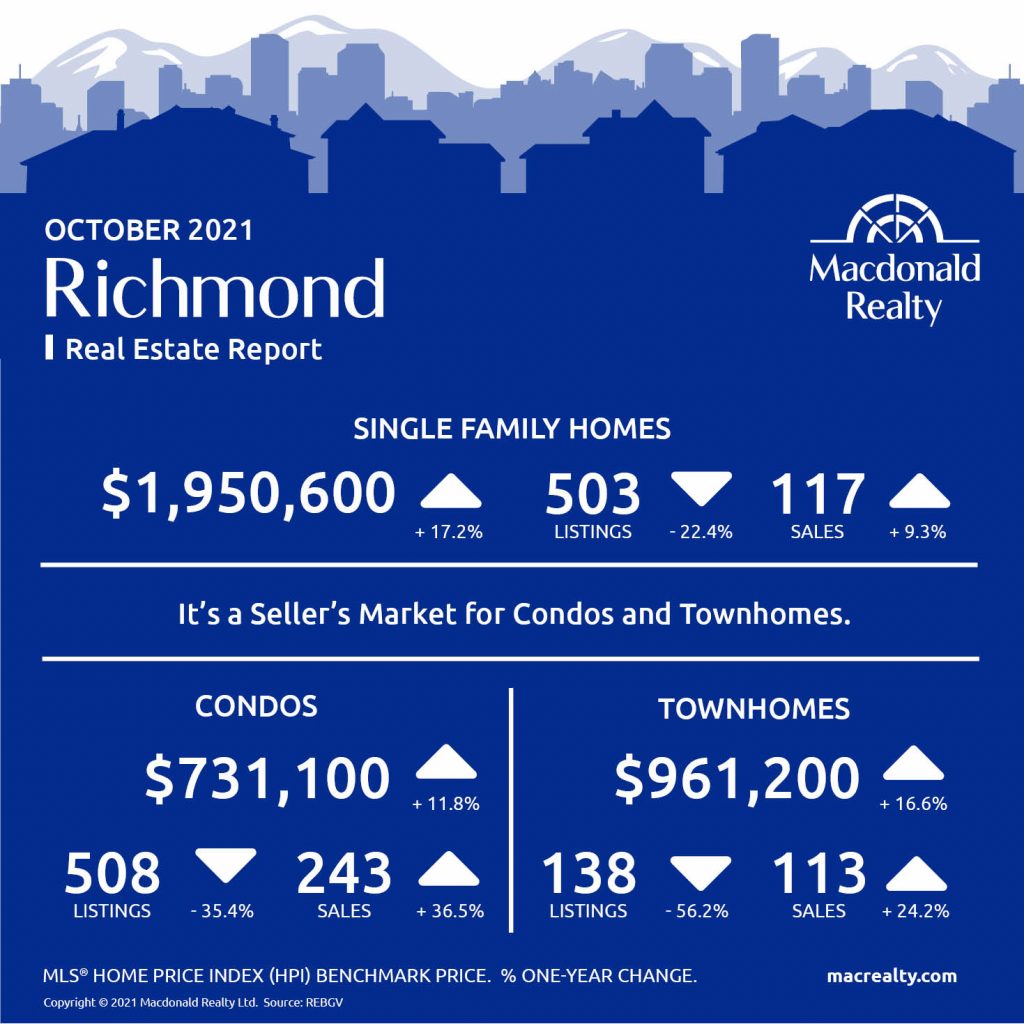
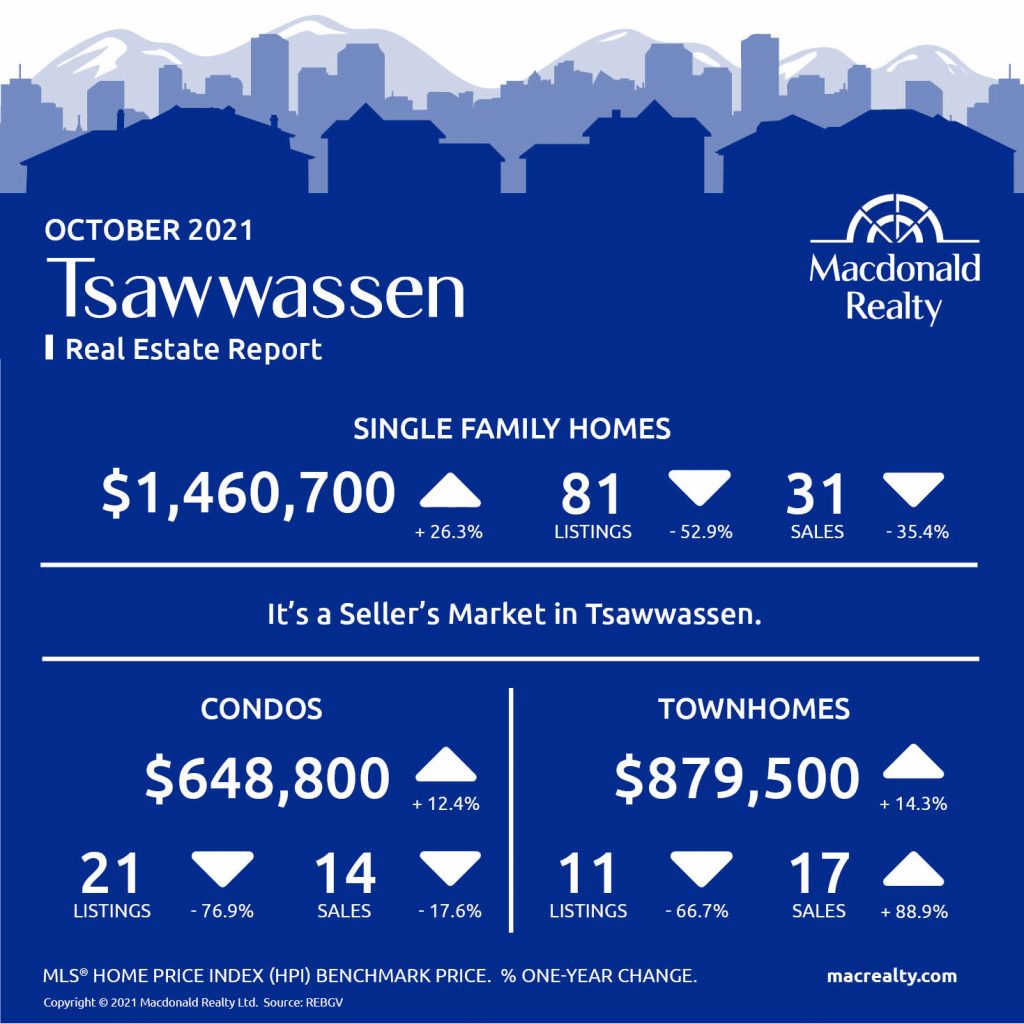
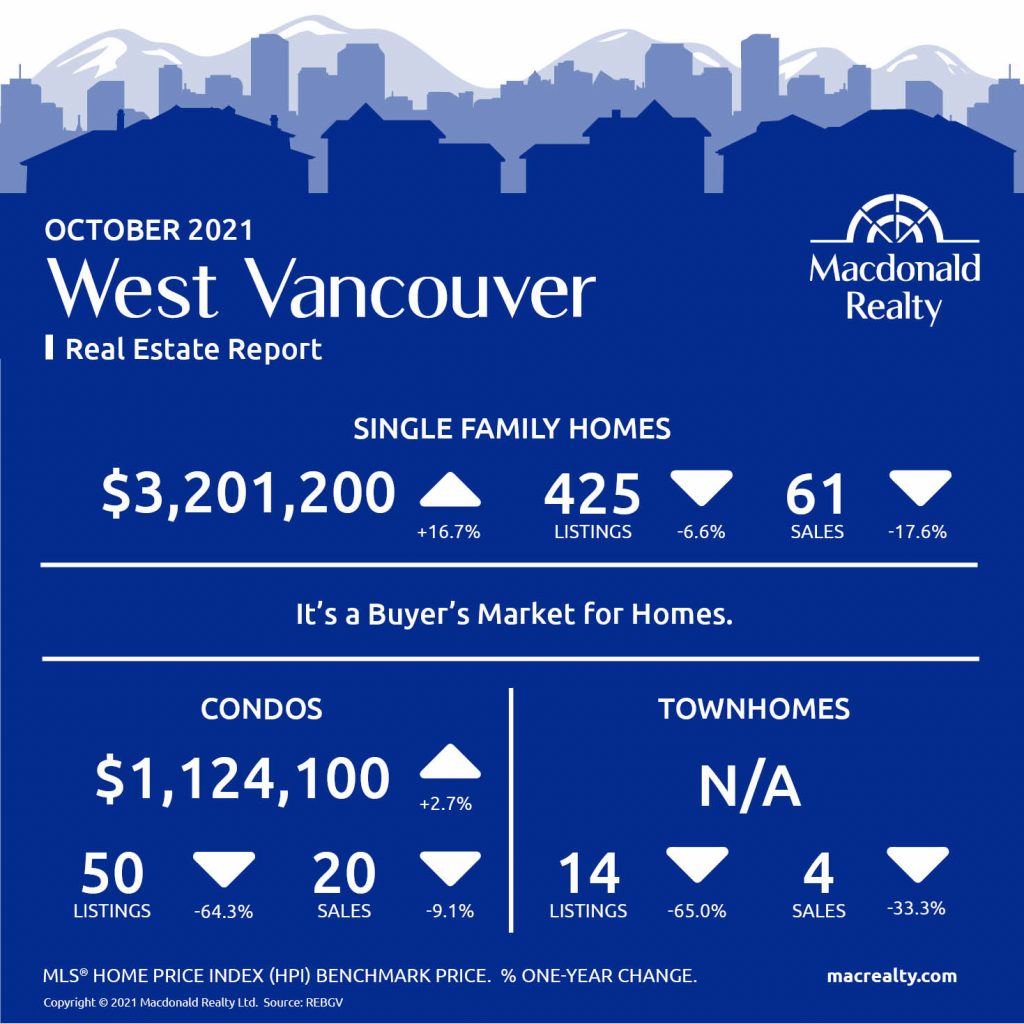
Here are the latest real estate market statistics from Macdonald Realty on the Greater Vancouver listings and sales in October 2021.
Find all the infographics by visiting the Facebook Album.
As released by the Board, Home sale activity remains elevated across Metro Vancouver’s* housing market while the pace of homes being listed for sale continues to follow long-term averages.
“The summer trend of above-average home sales and historically typical new listings activity continued in Metro Vancouver last month. Although this is keeping the overall supply of homes for sale low, we’re not seeing the same upward intensity on home prices today as we did in the spring,” Keith Stewart, REBGV economist said. “Home price trends will, however, vary depending on property type and neighborhood, so it’s important to take a hyperlocal look at your location and property category of choice before making a home buying or selling decision.”
The Board also has informed:
“The total inventory of homes for sale remains insufficient to meet the demand in today’s market. This scarcity limits peoples’ purchasing options and ultimately adds upward pressure on home prices,” Stewart said. “With the federal election now behind us, we hope to see governments at all levels work with the construction industry to streamline the creation of a more abundant and diverse supply of housing options.”
*Areas covered by the Real Estate Board of Greater Vancouver include Burnaby, Coquitlam, Maple Ridge, New Westminster, North Vancouver, Pitt Meadows, Port Coquitlam, Port Moody, Richmond, South Delta, Squamish, Sunshine Coast, Vancouver, West Vancouver, and Whistler. Check out the infographics of Squamish, Sunshine Coast and Whistler, HERE.
Bowen Island

Burnaby East
Burnaby North
Burnaby South
Ladner
Maple Ridge
New Westminster
North Vancouver
Pitt Meadows
Coquitlam
Port Coquitlam
Port Moody
Richmond
Tsawwassen
Vancouver East

Vancouver West

West Vancouver
Looking for more information about the real estate market in specific neighbourhoods in the Greater Vancouver?
Macdonald Realty has offices across the Greater Vancouver. Please email [email protected] or call 1-877-278-3888 to be matched with a REALTOR® working in your area.
MLS® Home Price Index (HPI) Benchmark Price
Average and median home prices are often misinterpreted, are affected by change in the mix of homes sold, and can swing dramatically from month to month (based on the types and prices of properties that sold in a given month). The MLS® HPI overcomes these shortcomings and uses the concept of a benchmark home, a notional home with common attributes of typical homes in a defined area. Visit www.housepriceindex.ca for more information.
This blog post is based on market data provided by the Real Estate Board of Greater Vancouver (REBGV) www.rebgv.org
by Macrealty Marketing Team | Oct 7, 2021 | Market Updates
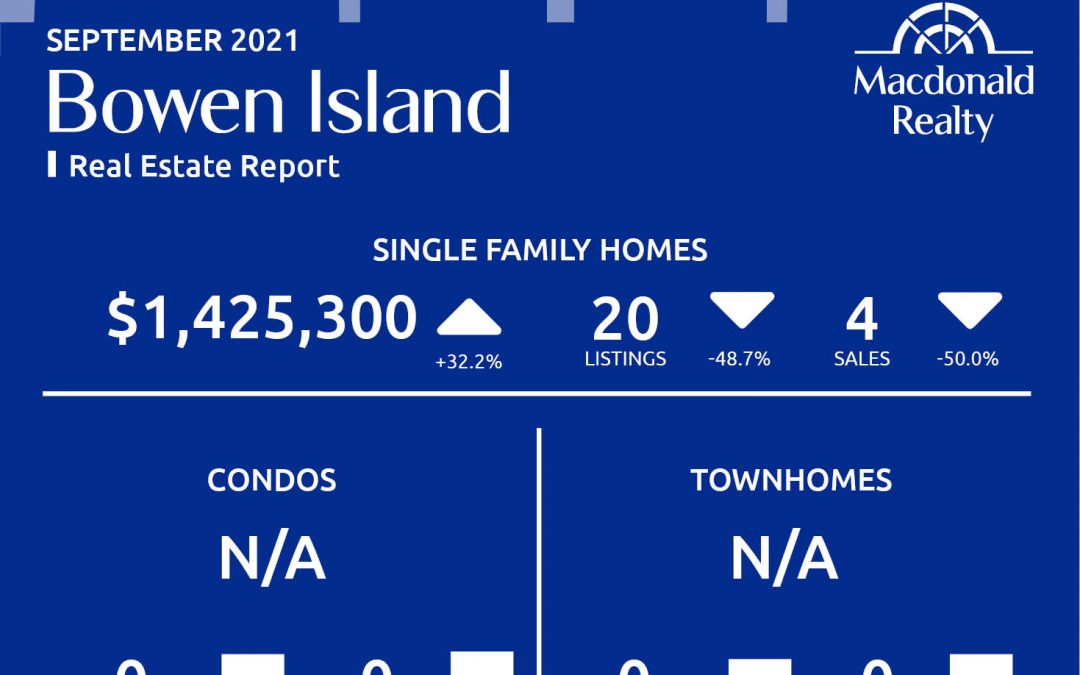
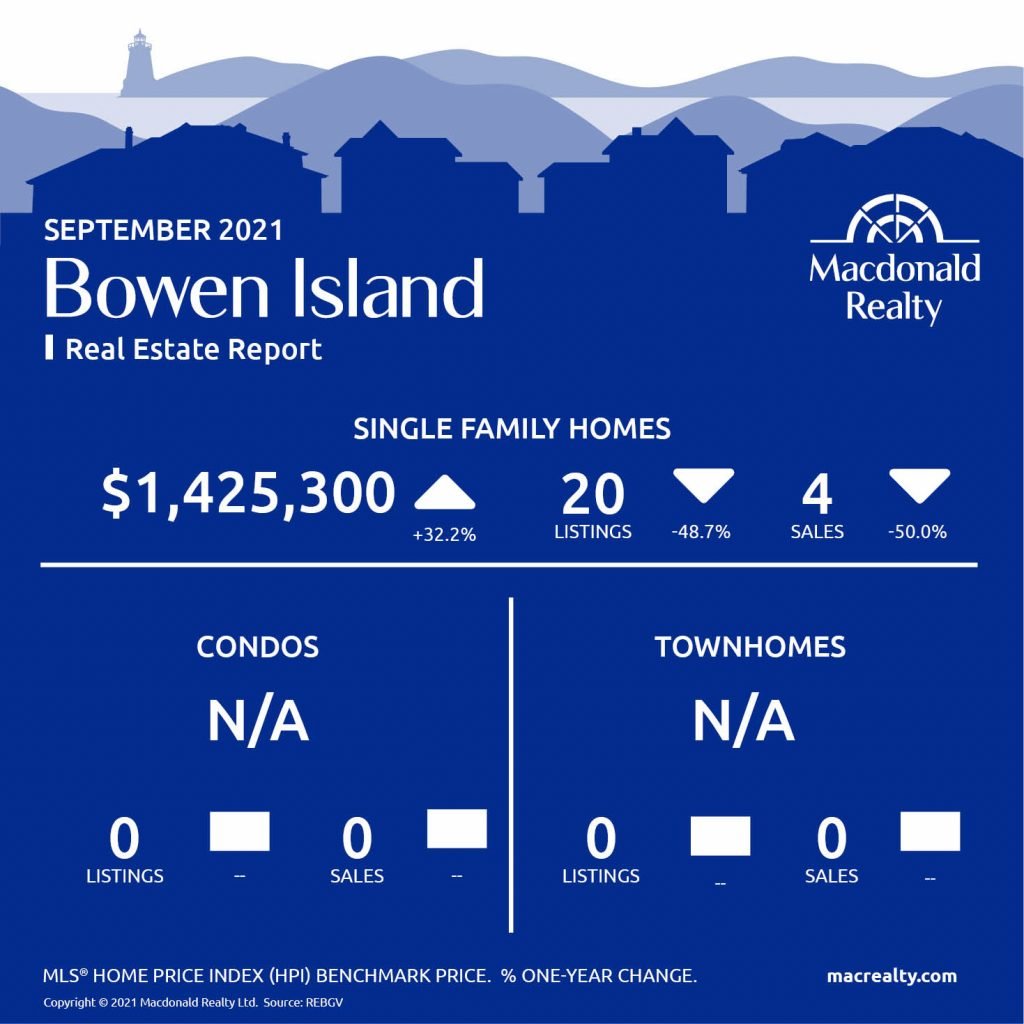
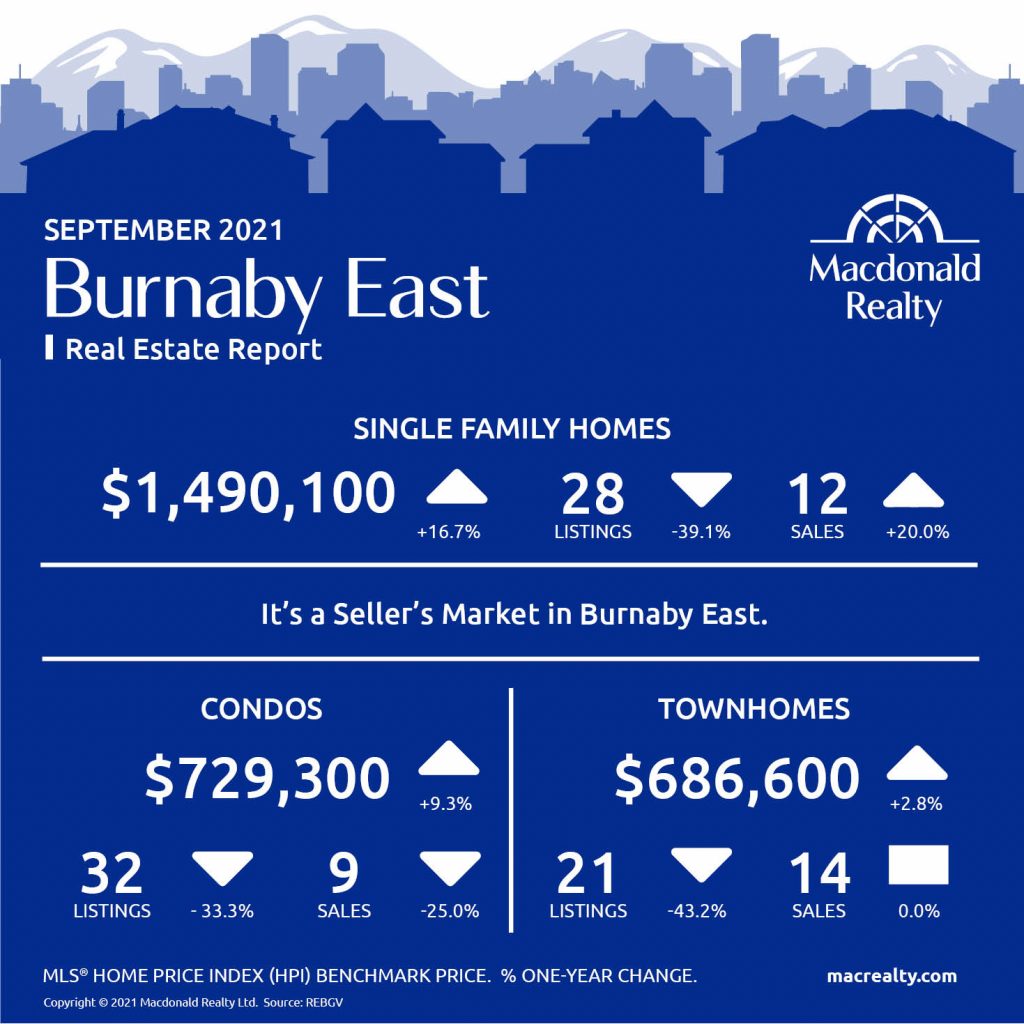
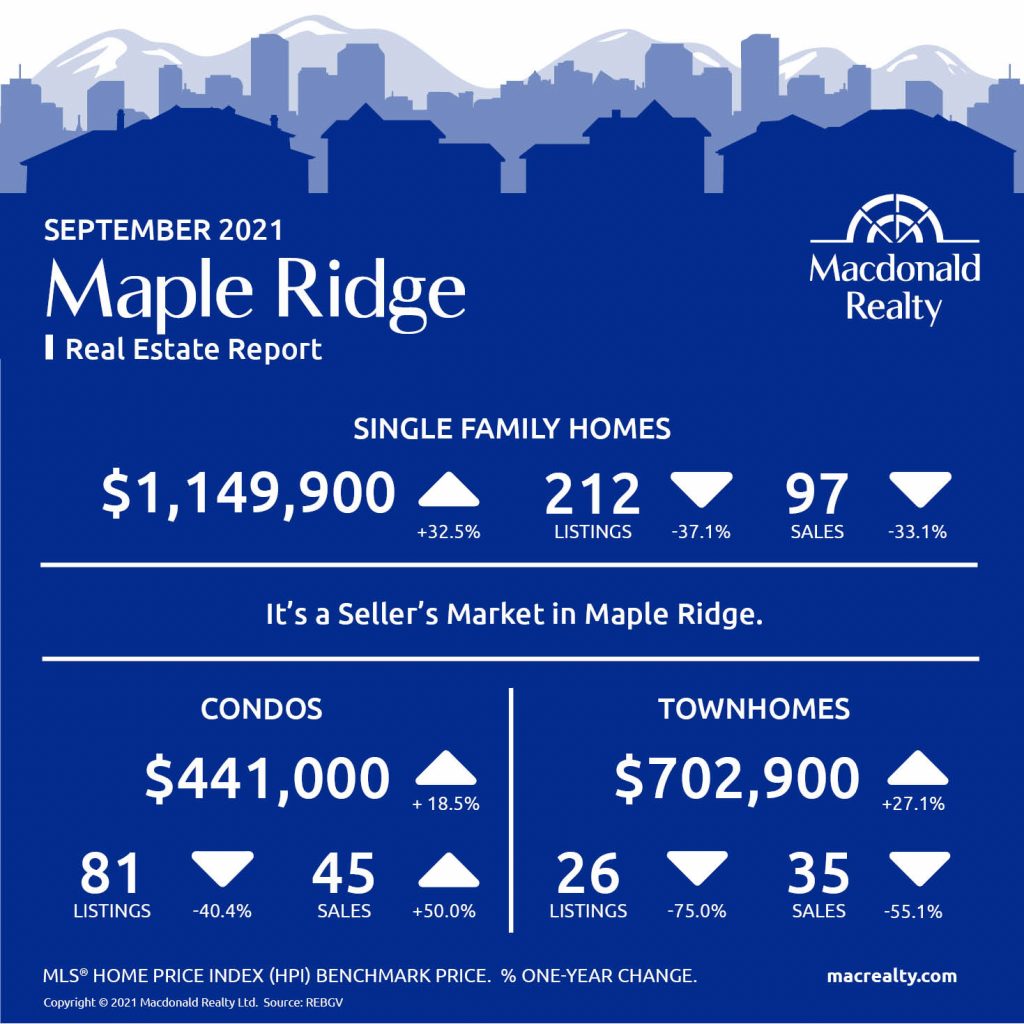
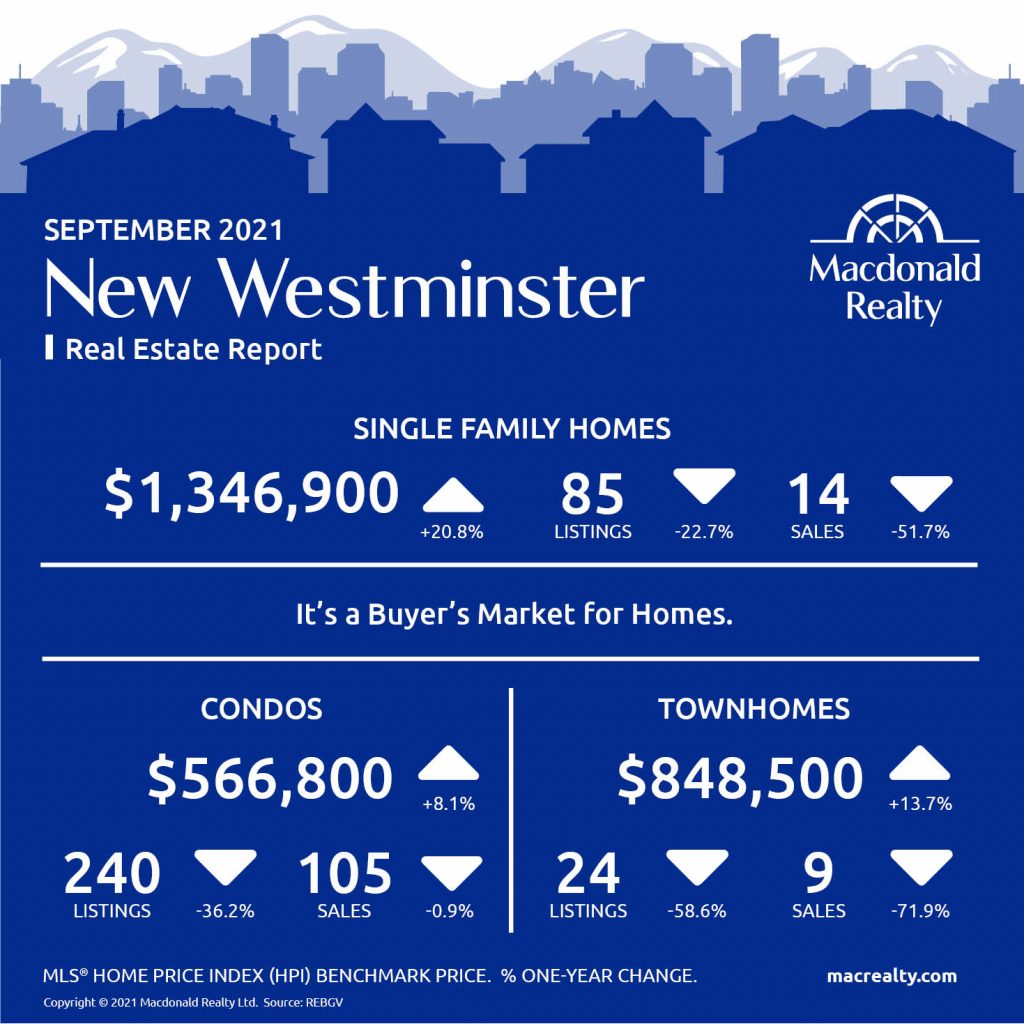
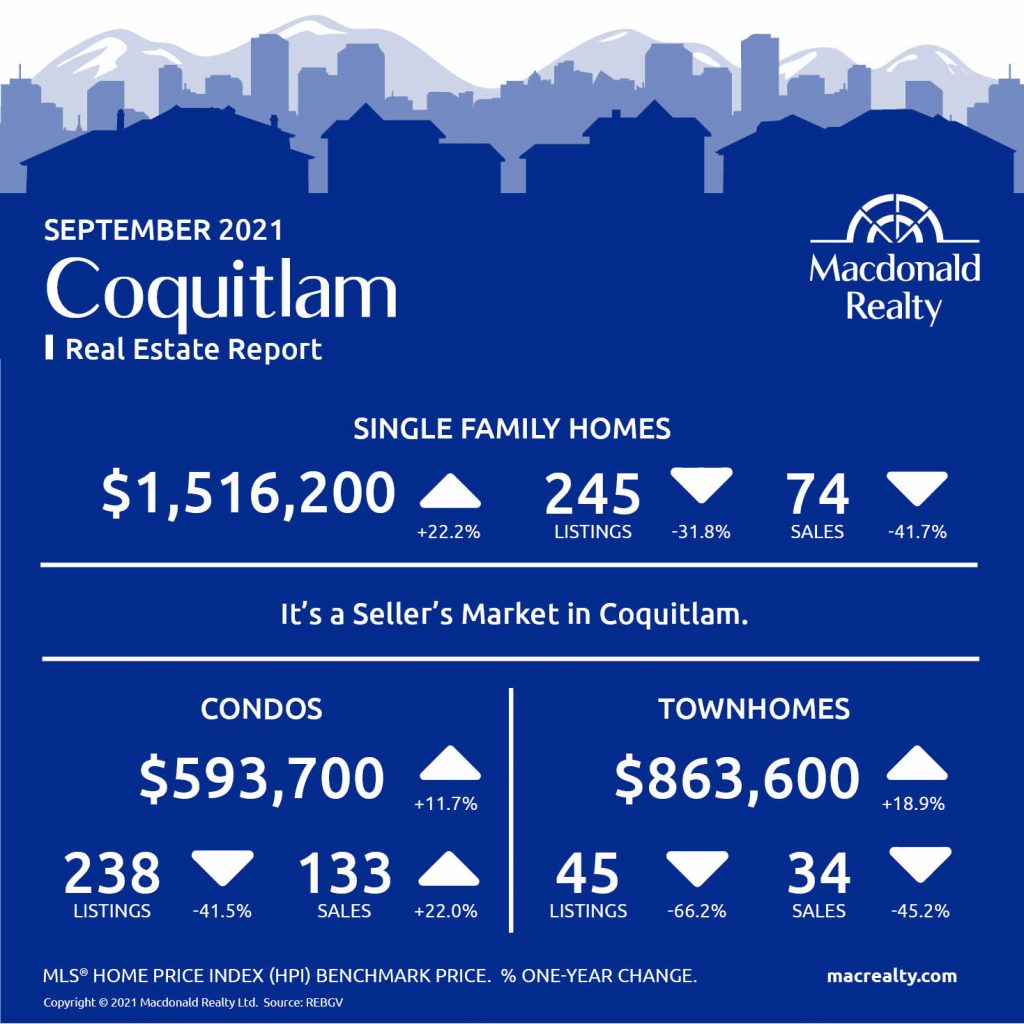
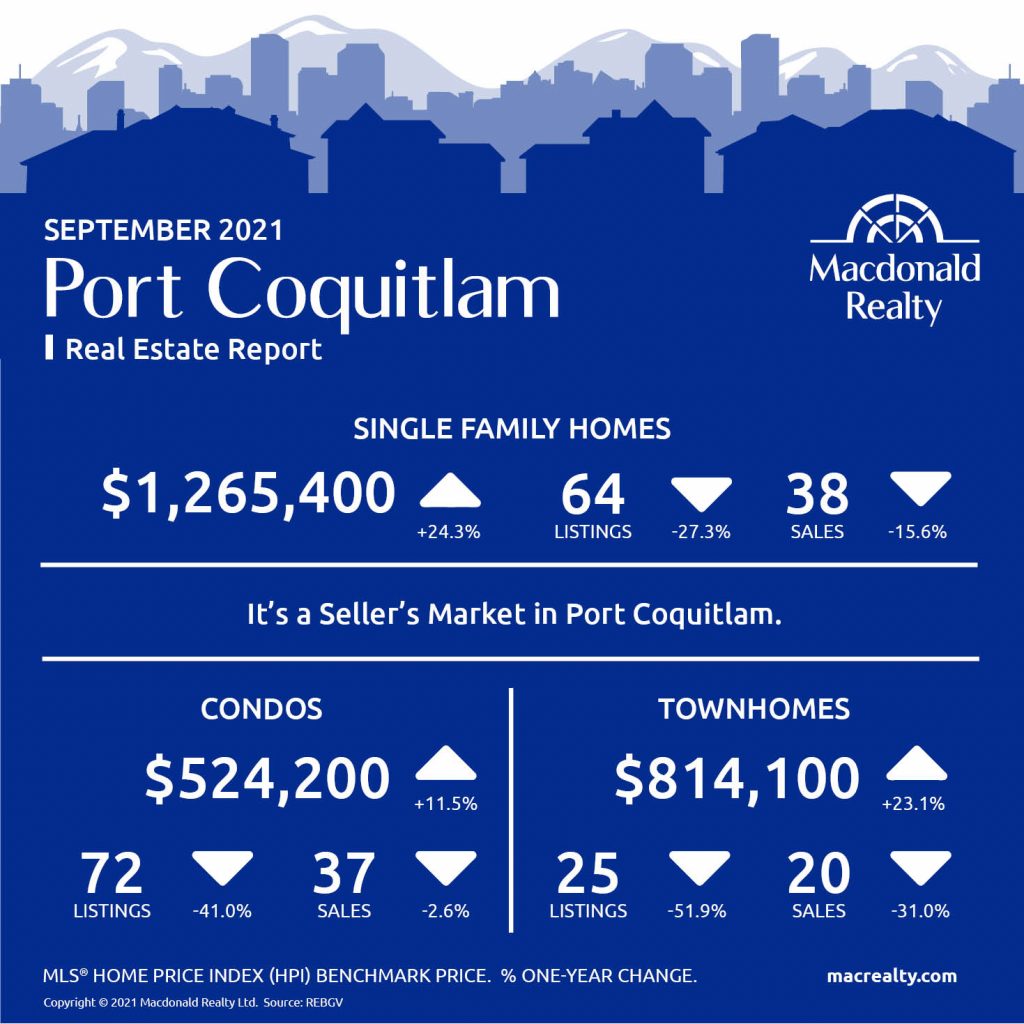
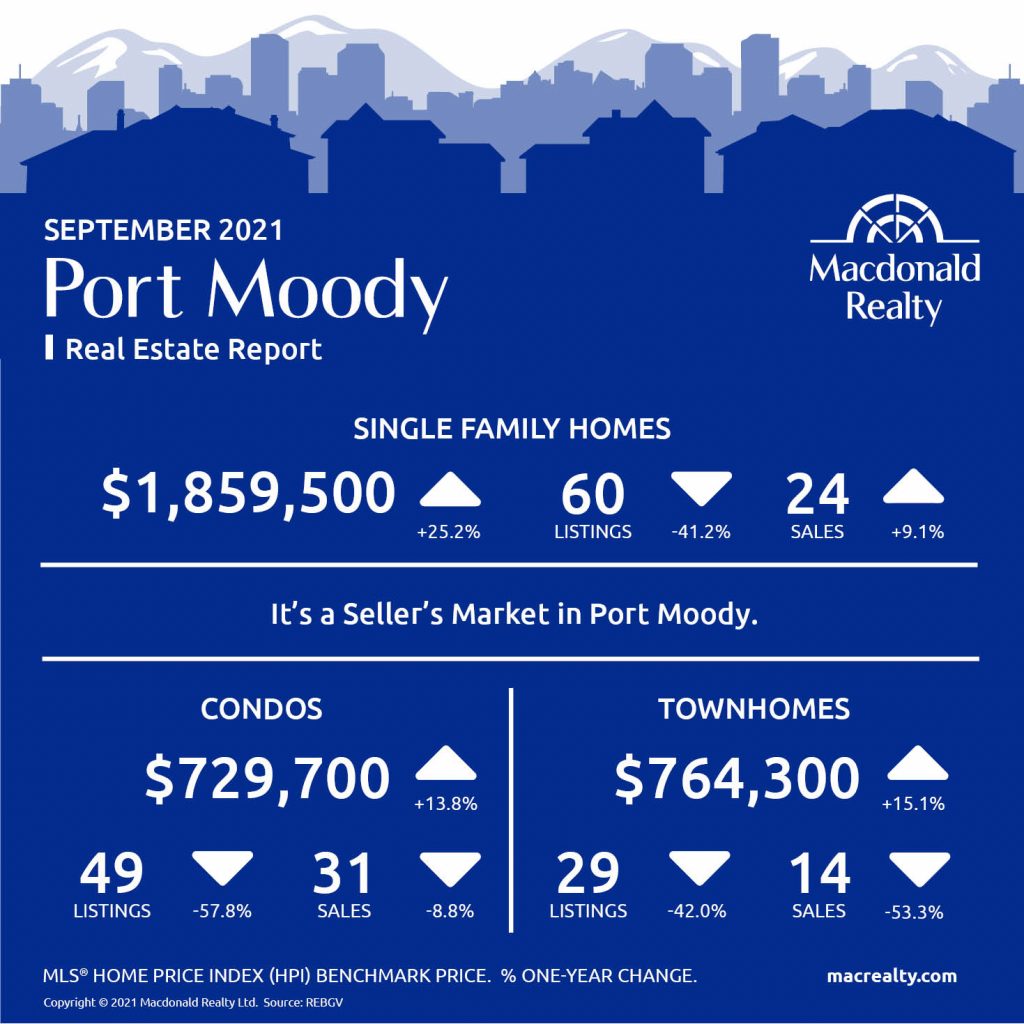
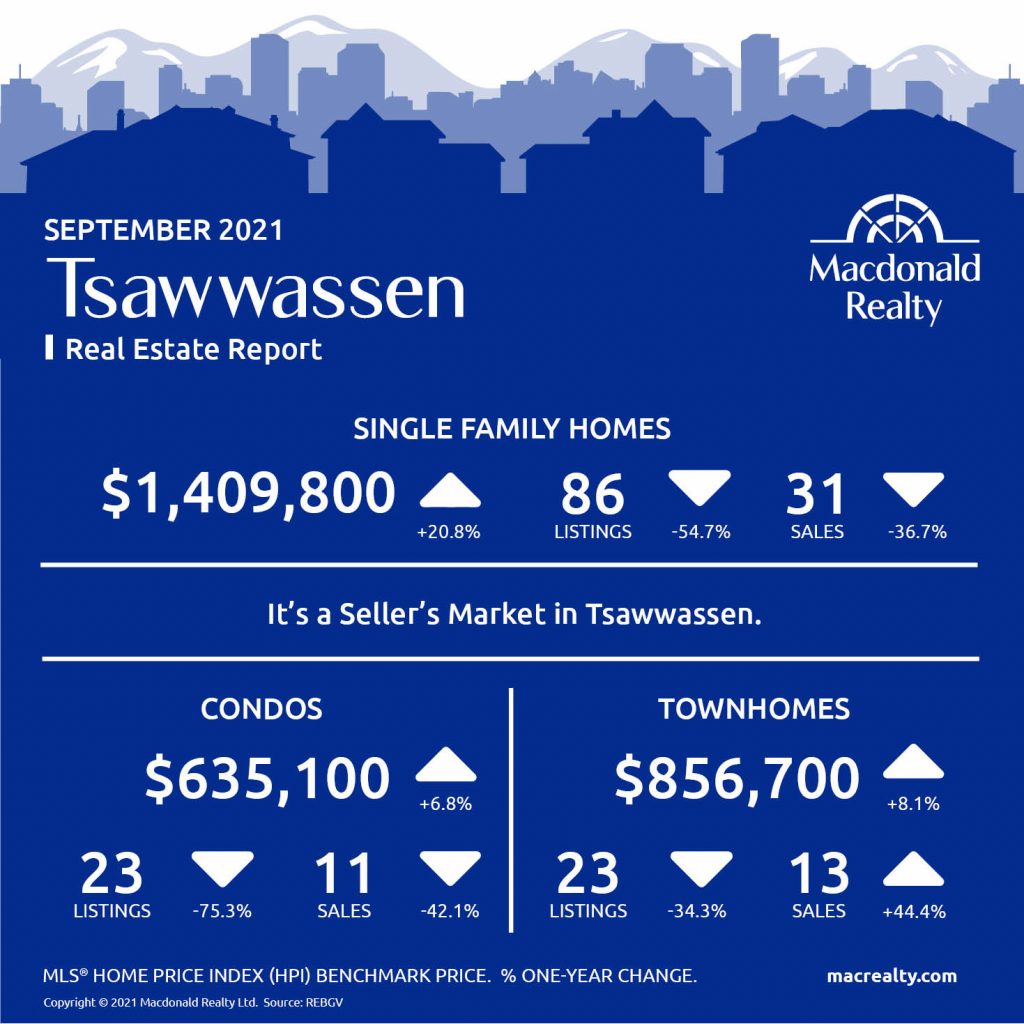
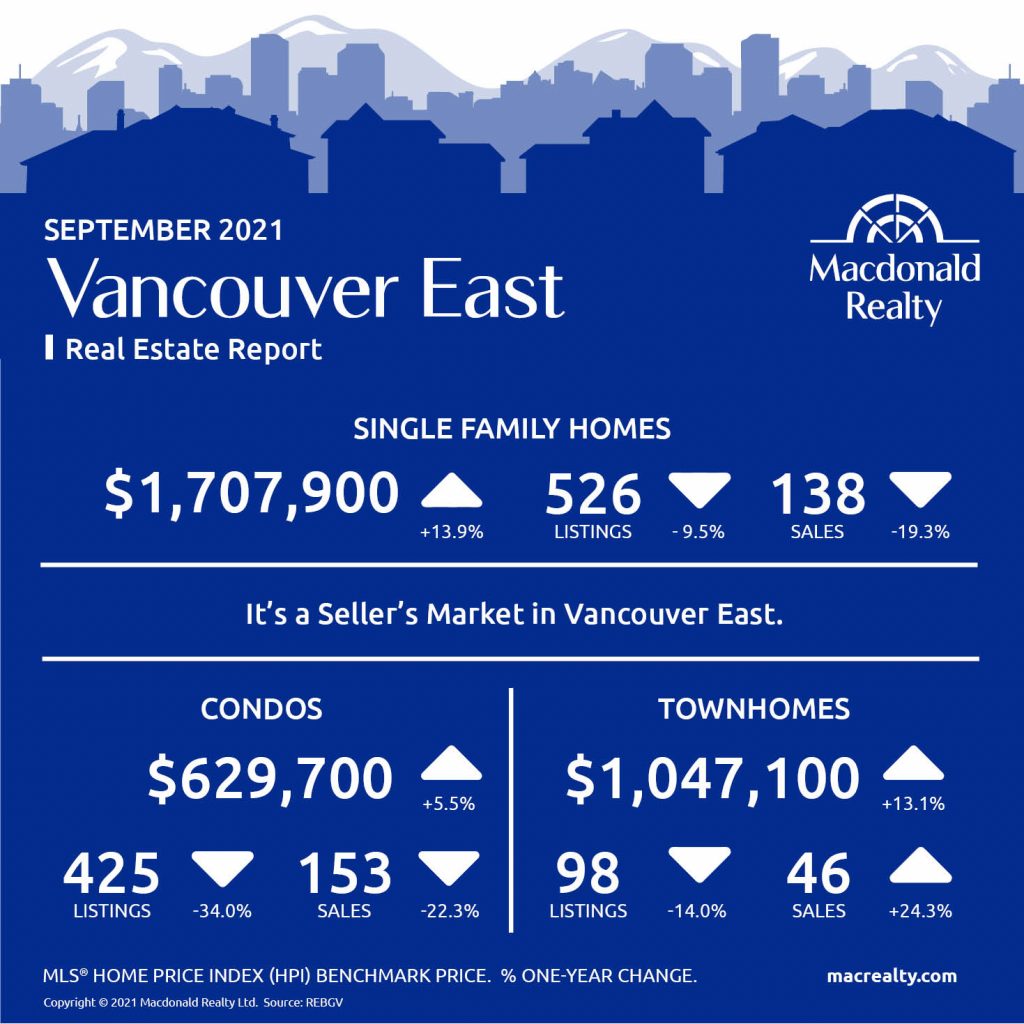
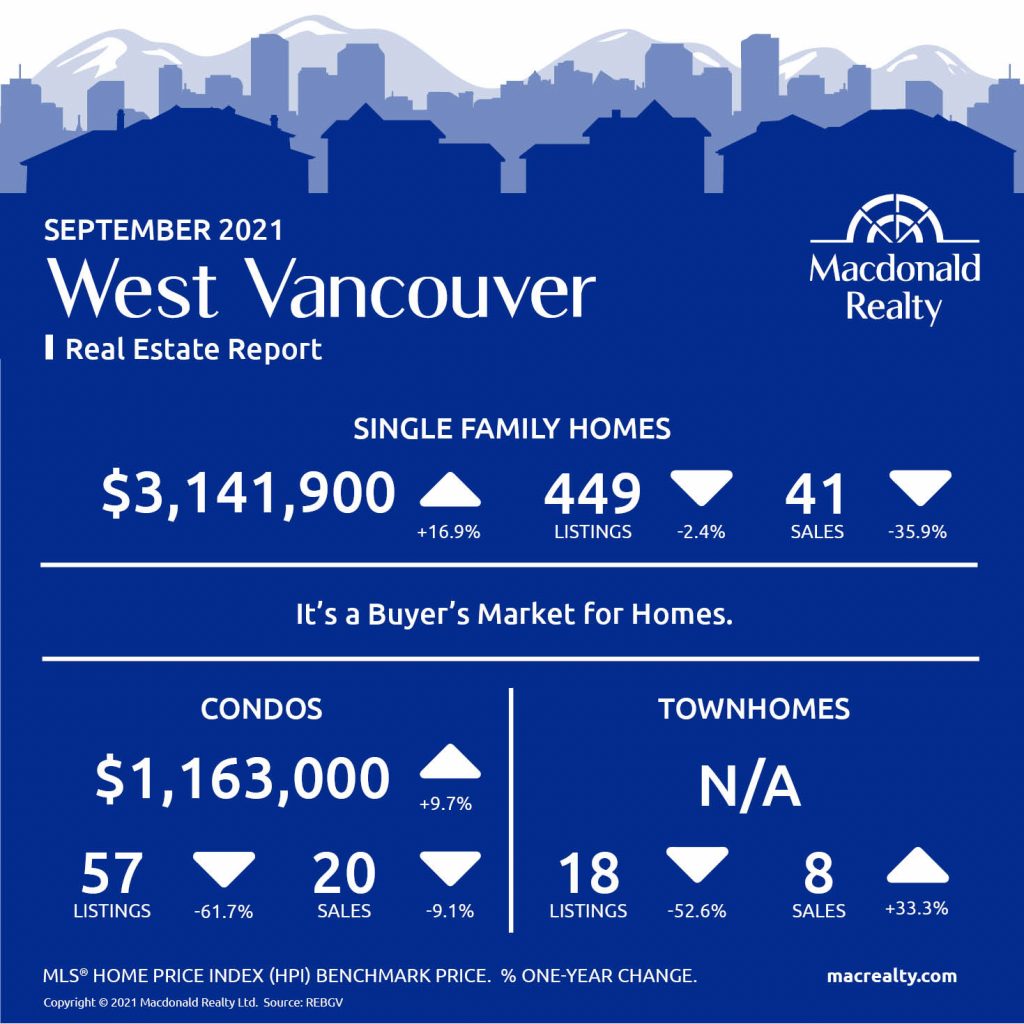
Here are the latest real estate market statistics from Macdonald Realty on the Greater Vancouver listings and sales in September 2021.
Find all the infographics by visiting the Facebook Album.
As released by the Board, home sale activity remains elevated across Metro Vancouver’s* housing market while the pace of homes being listed for sale continues to follow long-term averages.
“The summer trend of above-average home sales and historically typical new listings activity continued in Metro Vancouver last month. Although this is keeping the overall supply of homes for sale low, we’re not seeing the same upward intensity on home prices today as we did in the spring. Home price trends will, however, vary depending on property type and neighborhood, so it’s important to take a hyperlocal look at your location and property category of choice before making a home buying or selling decision,” said Keith Stewart, REBGV economist.
The Board also has informed:
“The total inventory of homes for sale remains insufficient to meet the demand in today’s market. This scarcity limits peoples’ purchasing options and ultimately adds upward pressure on home prices,” Stewart said. “With the federal election now behind us, we hope to see governments at all levels work with the construction industry to streamline the creation of a more abundant and diverse supply of housing options.”
*Areas covered by the Real Estate Board of Greater Vancouver include Burnaby, Coquitlam, Maple Ridge, New Westminster, North Vancouver, Pitt Meadows, Port Coquitlam, Port Moody, Richmond, South Delta, Squamish, Sunshine Coast, Vancouver, West Vancouver, and Whistler. Check out the infographics of Squamish, Sunshine Coast and Whistler, HERE.
Bowen Island
Burnaby East
Burnaby North

Burnaby South

Ladner

Maple Ridge
New Westminster
North Vancouver

Pitt Meadows

Coquitlam
Port Coquitlam
Port Moody
Richmond

Tsawwassen
Vancouver East
Vancouver West

West Vancouver
Looking for more information about the real estate market in specific neighbourhoods in the Greater Vancouver?
Macdonald Realty has offices across the Greater Vancouver. Please email [email protected] or call 1-877-278-3888 to be matched with a REALTOR® working in your area.
MLS® Home Price Index (HPI) Benchmark Price
Average and median home prices are often misinterpreted, are affected by change in the mix of homes sold, and can swing dramatically from month to month (based on the types and prices of properties that sold in a given month). The MLS® HPI overcomes these shortcomings and uses the concept of a benchmark home, a notional home with common attributes of typical homes in a defined area. Visit www.housepriceindex.ca for more information.
This blog post is based on market data provided by the Real Estate Board of Greater Vancouver (REBGV) www.rebgv.org

by Macrealty Marketing Team | Sep 7, 2021 | Market Updates
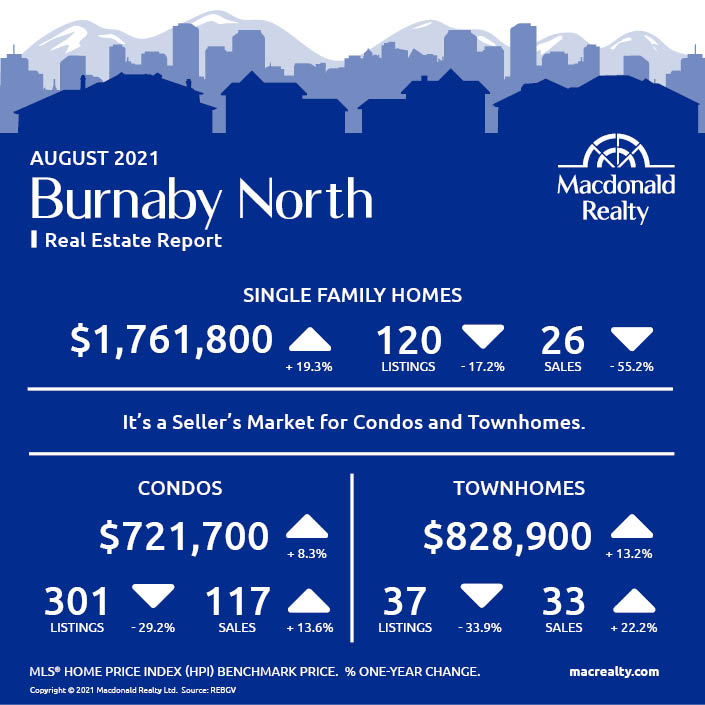
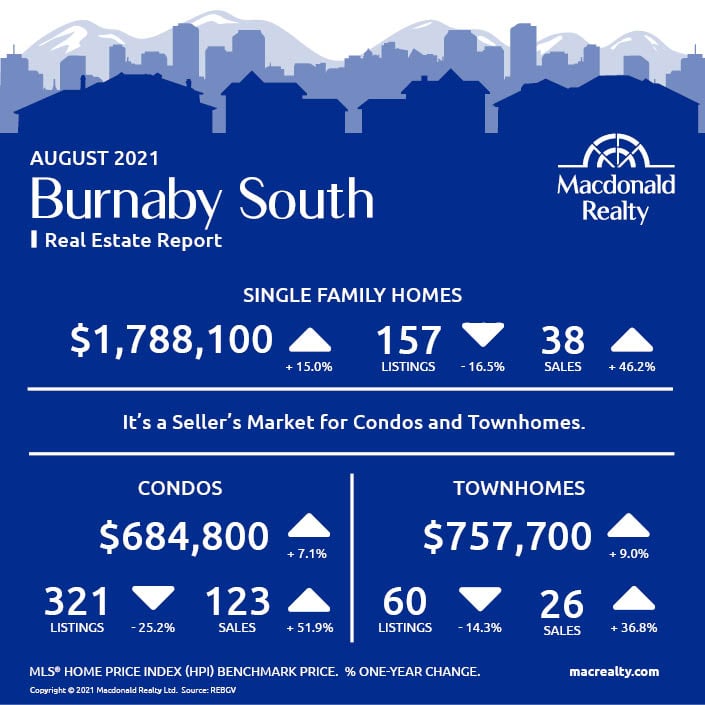
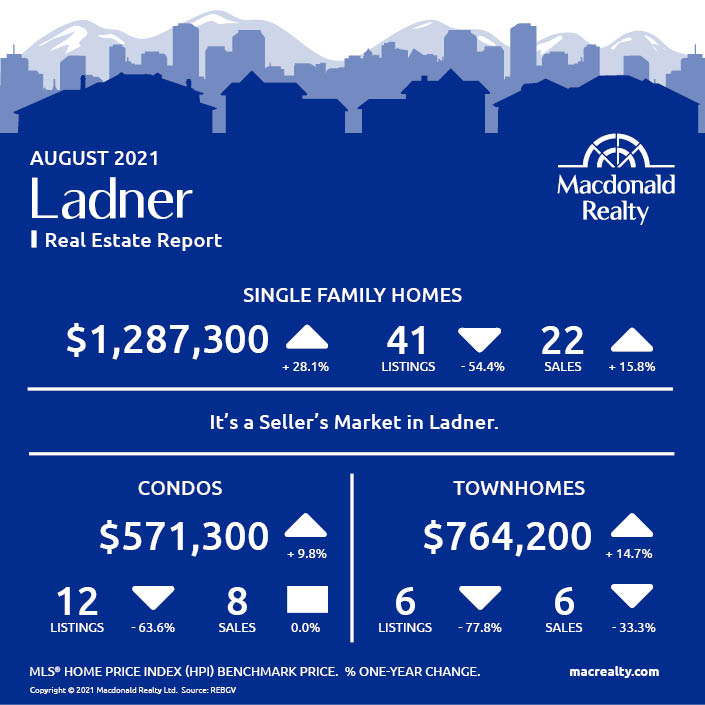
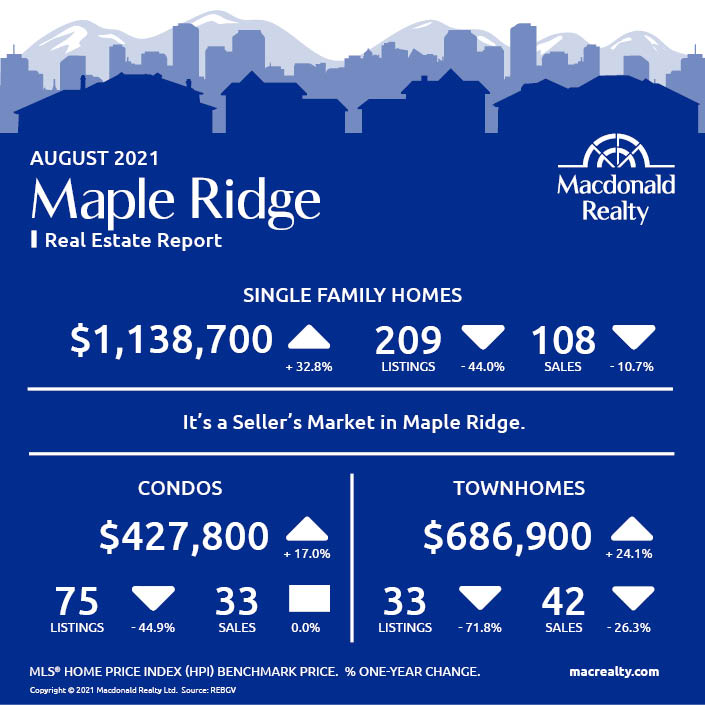
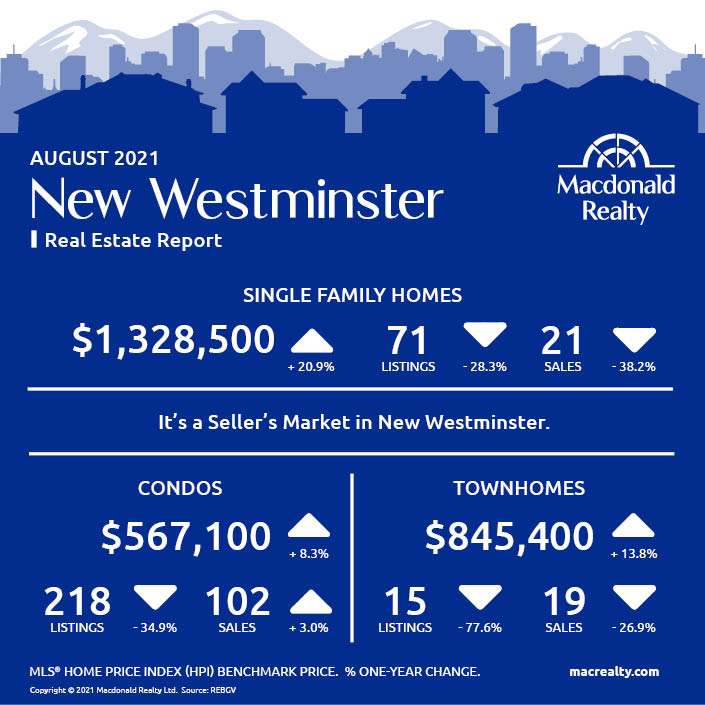
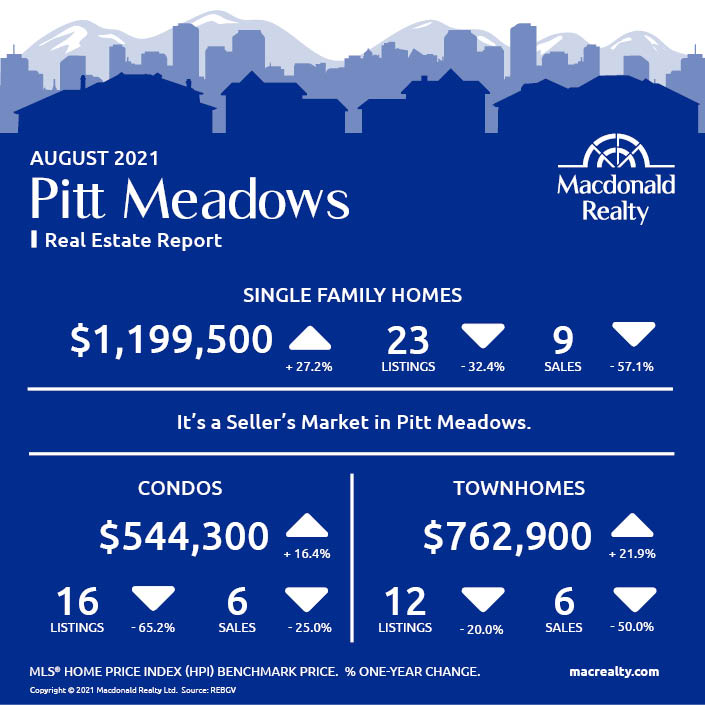
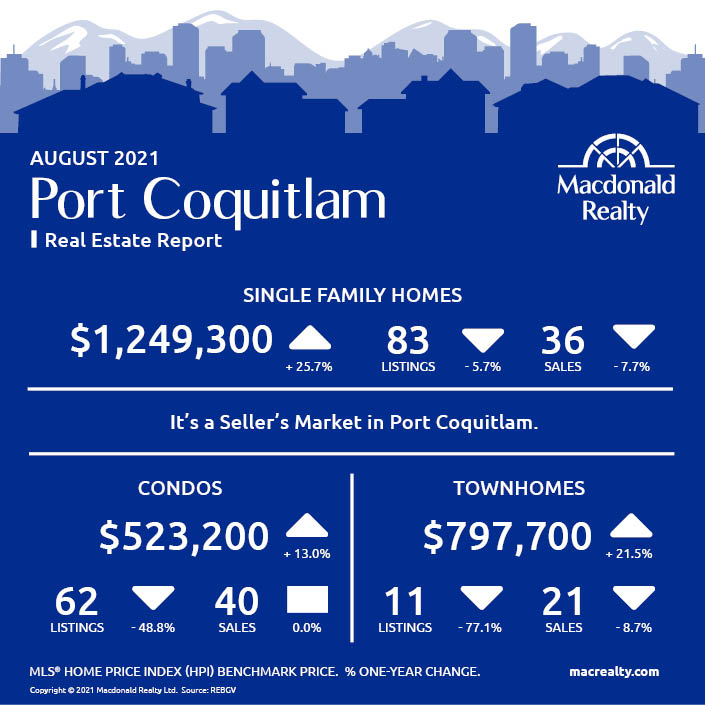
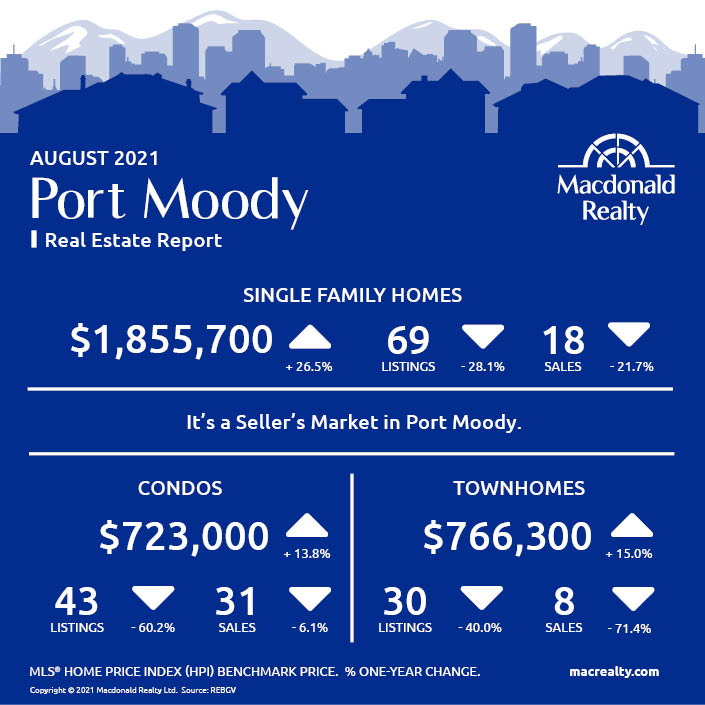
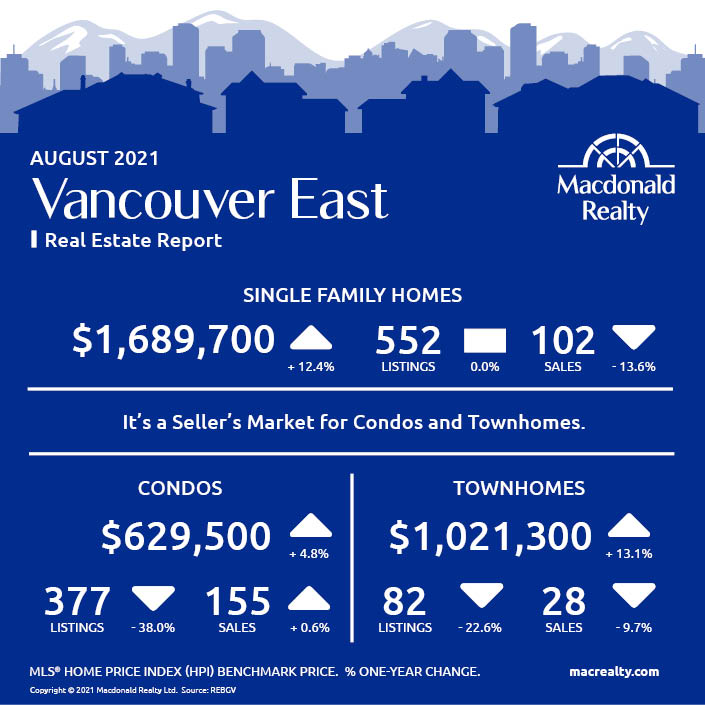
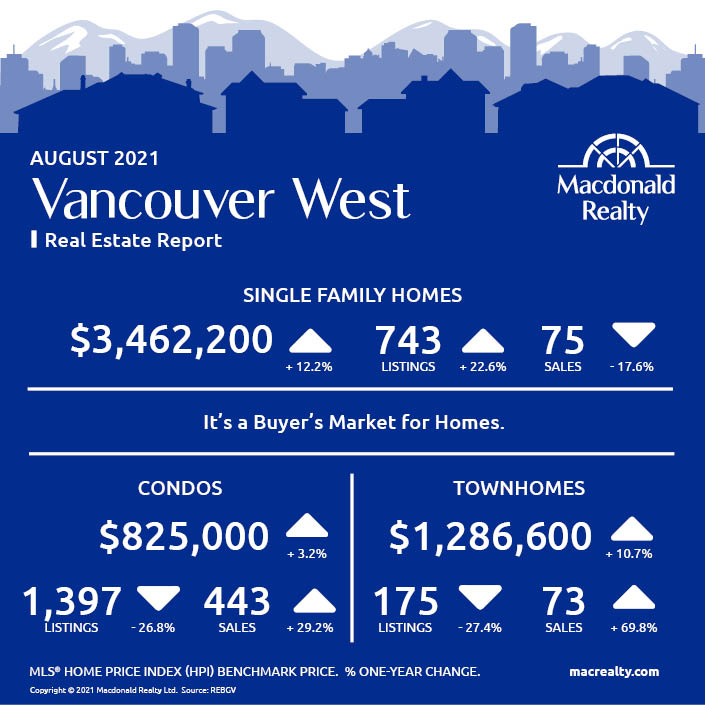
Here are the latest real estate market statistics from Macdonald Realty on the Greater Vancouver listings and sales in August 2021.
Find all the infographics by visiting the Facebook Album.
As released by the Board, while home buyers have remained active in Metro Vancouver* throughout the summer, the supply of homes for sale has declined steadily since June.
“August was busier than expected, and listings activity isn’t keeping up with the pace of demand. This is leaving the market under supplied.” said Keith Stewart, REBGV economist.
The Board also has informed:
“Housing supply is the biggest factor impacting the market right now. To help relieve pressure on prices and improve peoples’ home buying options, the market needs a more abundant supply of homes for sale.” Stewart said. “Housing affordability has been a key issue in the federal election. We encourage the political parties to focus on policy solutions that will help streamline the creation of more diverse housing options for hopeful home buyers today and into the future.”
*Areas covered by the Real Estate Board of Greater Vancouver include Burnaby, Coquitlam, Maple Ridge, New Westminster, North Vancouver, Pitt Meadows, Port Coquitlam, Port Moody, Richmond, South Delta, Squamish, Sunshine Coast, Vancouver, West Vancouver, and Whistler. Check out the infographics of Squamish, Sunshine Coast and Whitler, HERE.
Bowen Island

Burnaby East

Burnaby North
Burnaby South
Ladner
Maple Ridge
New Westminster
North Vancouver

Pitt Meadows
Coquitlam

Port Coquitlam
Port Moody
Richmond

Tsawwassen

Vancouver East
Vancouver West
West Vancouver
Looking for more information about the real estate market in specific neighbourhoods in the Greater Vancouver?
Macdonald Realty has offices across the Greater Vancouver. Please email [email protected] or call 1-877-278-3888 to be matched with a REALTOR® working in your area.
MLS® Home Price Index (HPI) Benchmark Price
Average and median home prices are often misinterpreted, are affected by change in the mix of homes sold, and can swing dramatically from month to month (based on the types and prices of properties that sold in a given month). The MLS® HPI overcomes these shortcomings and uses the concept of a benchmark home, a notional home with common attributes of typical homes in a defined area. Visit www.housepriceindex.ca for more information.
This blog post is based on market data provided by the Real Estate Board of Greater Vancouver (REBGV) www.rebgv.org
by Macrealty Marketing Team | Aug 6, 2021 | Market Updates
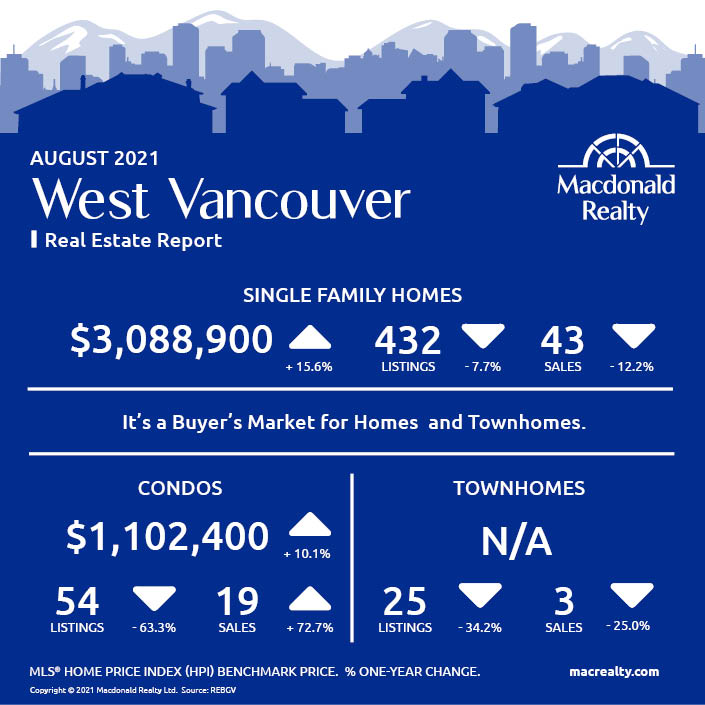
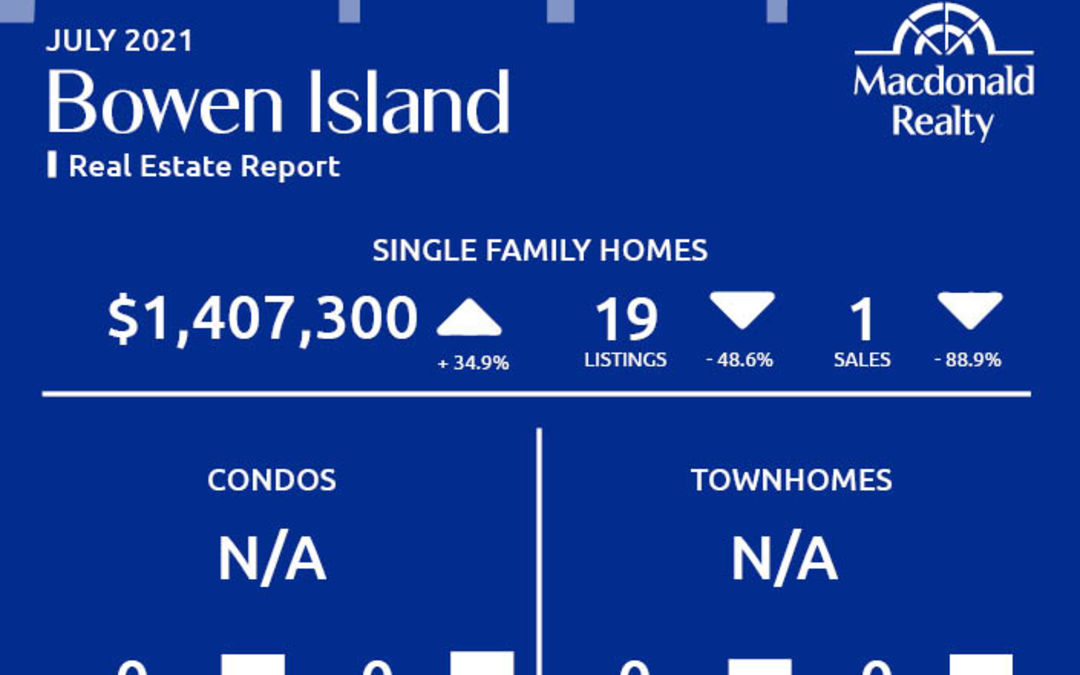
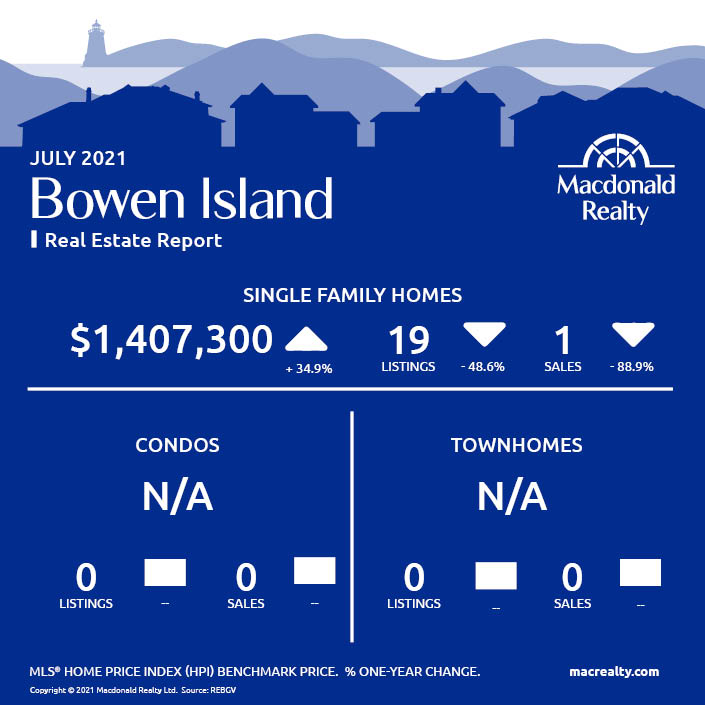
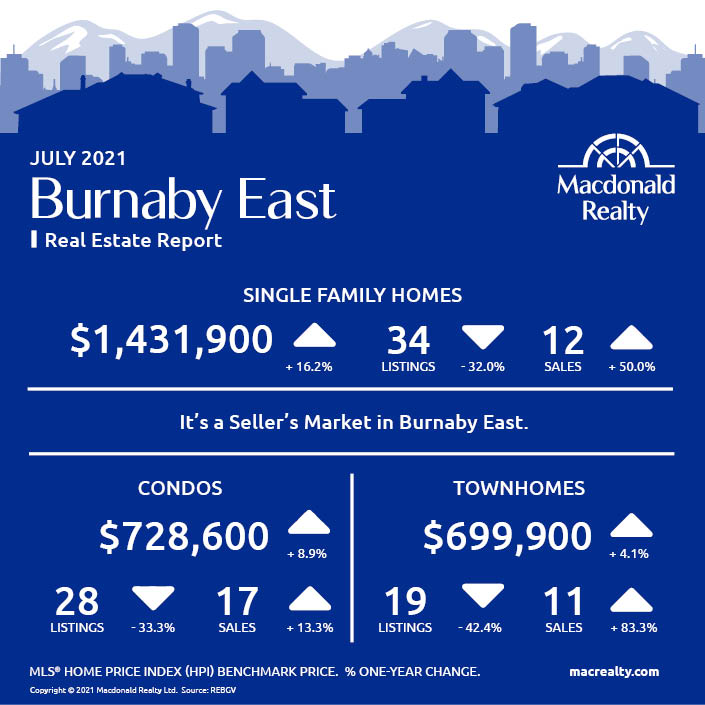
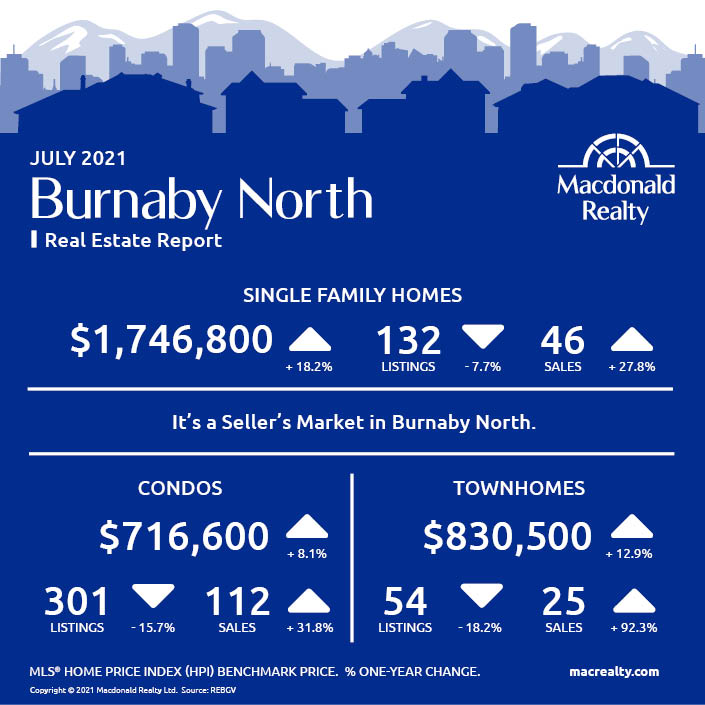
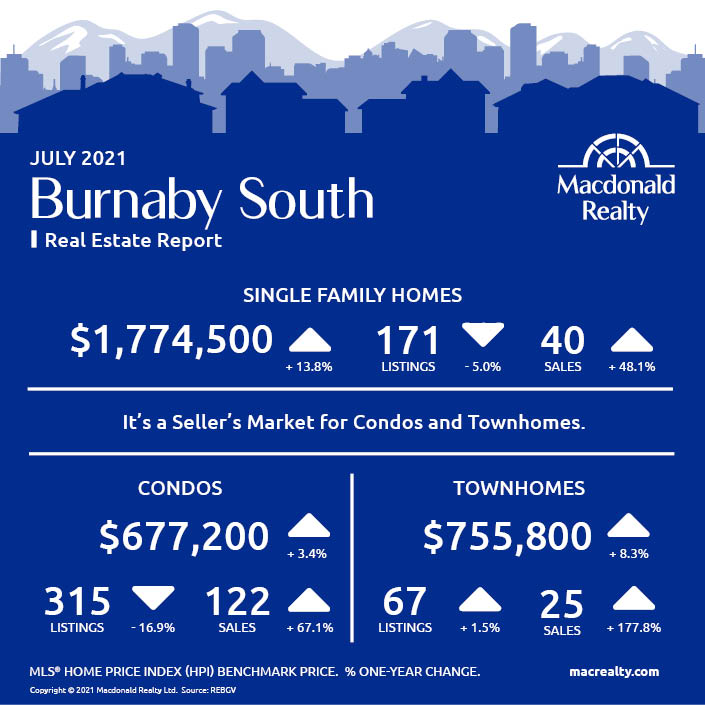
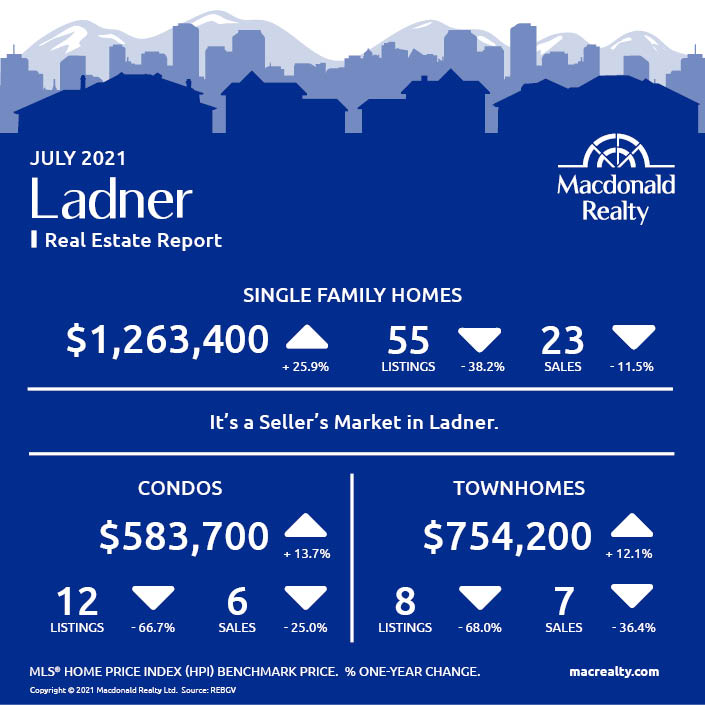
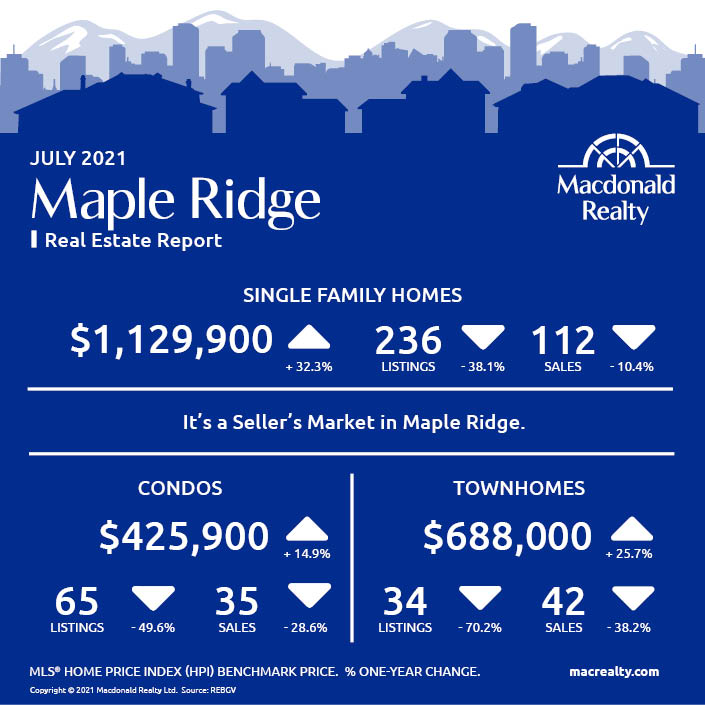
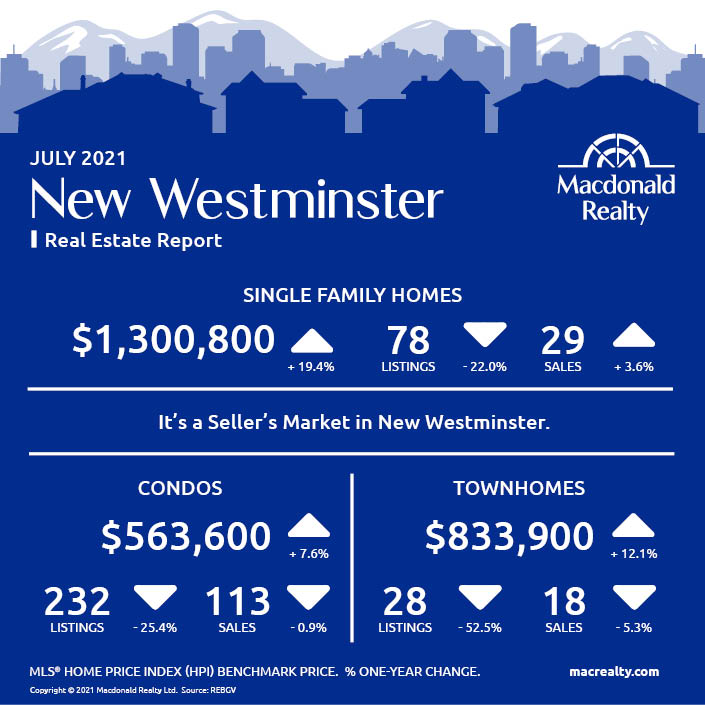
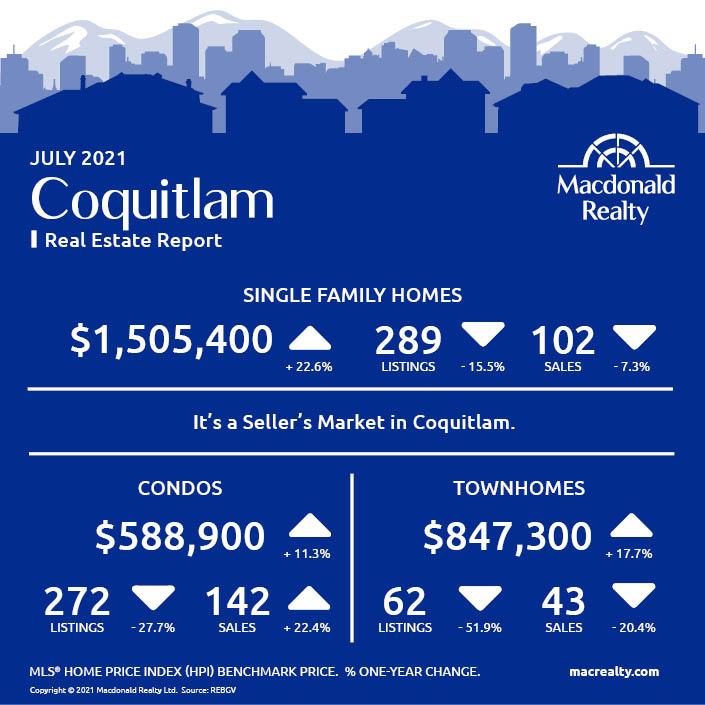
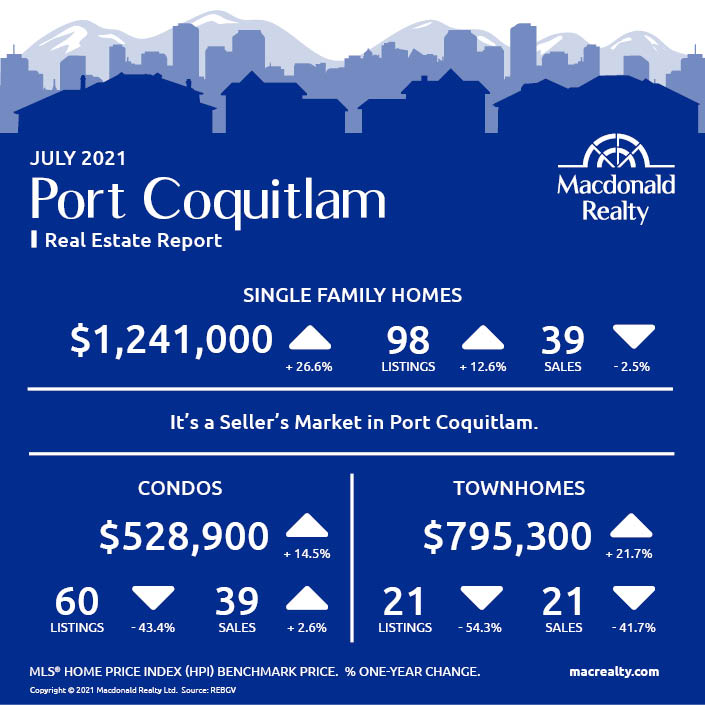
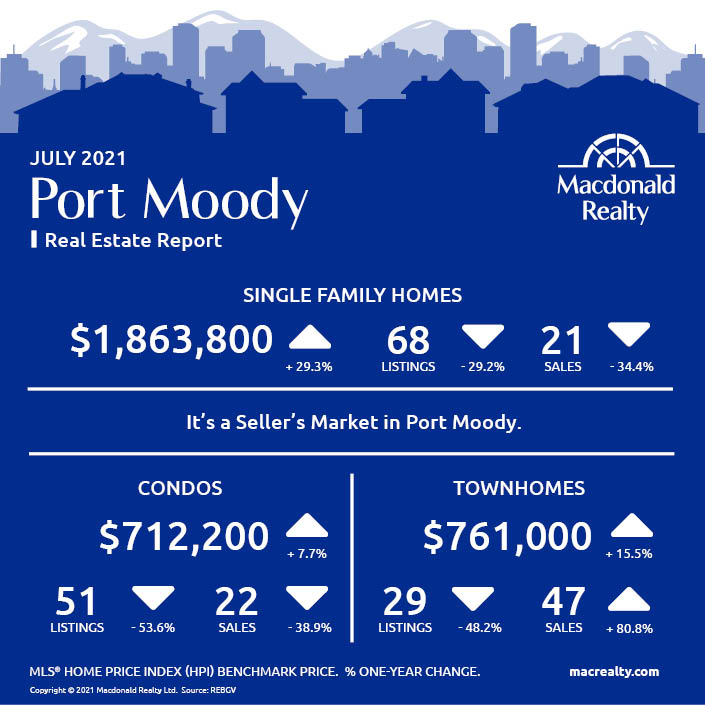
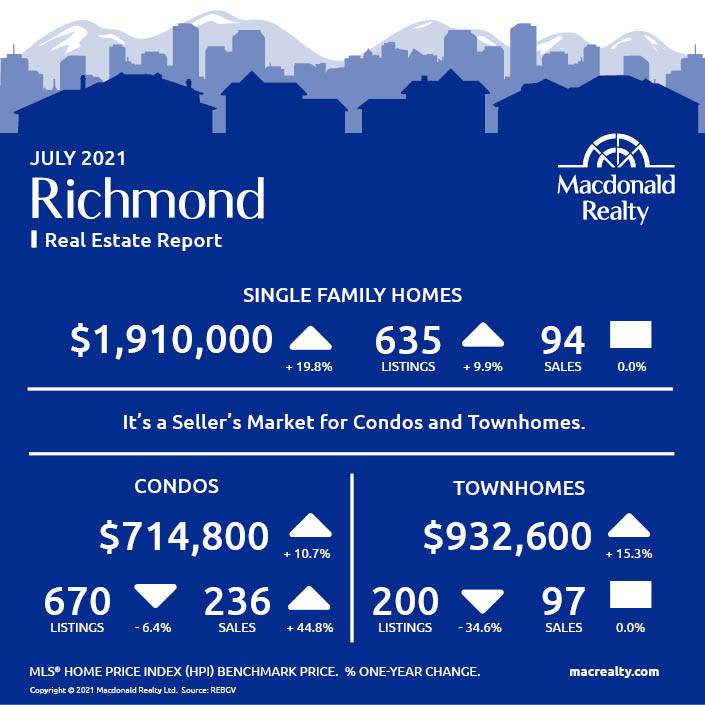
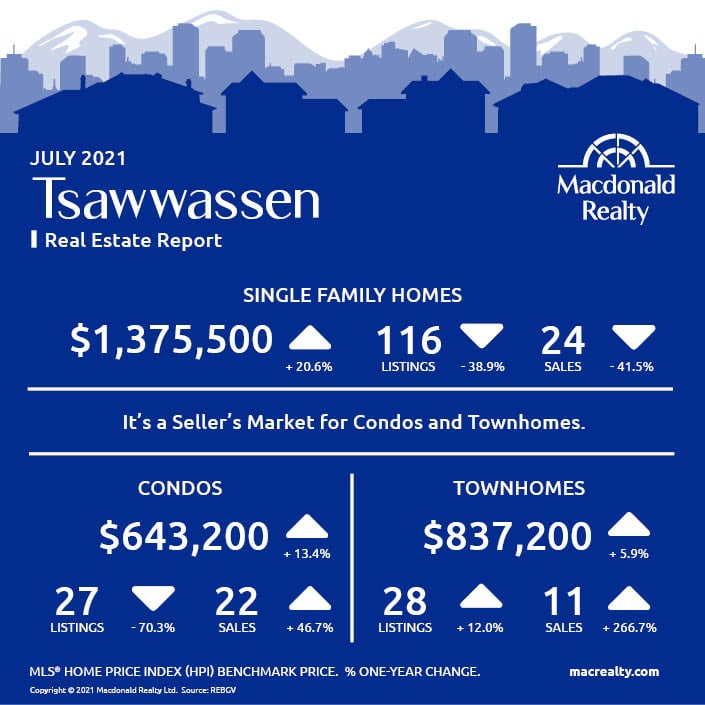
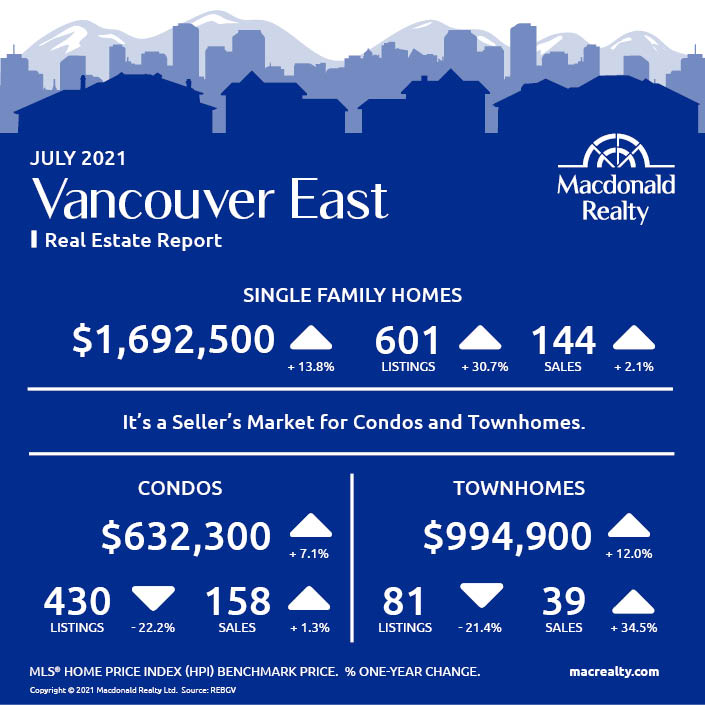
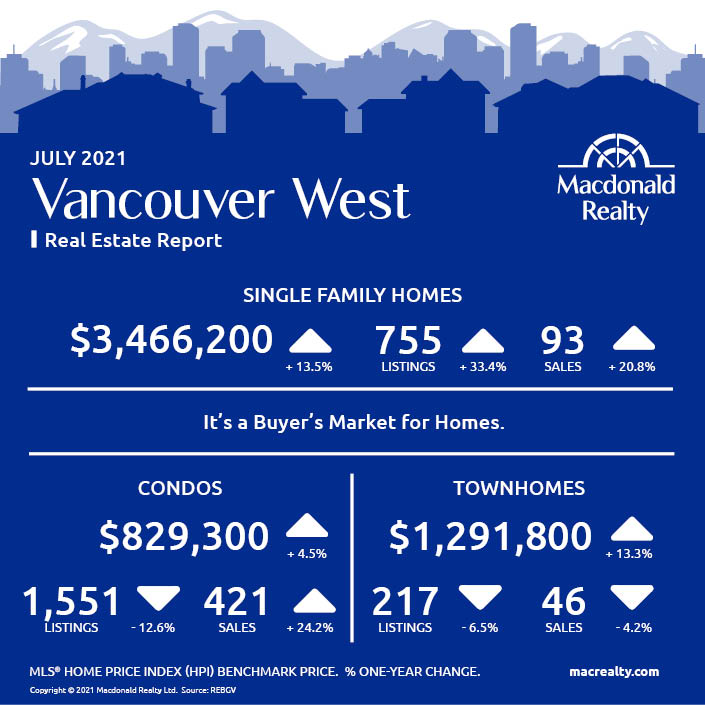
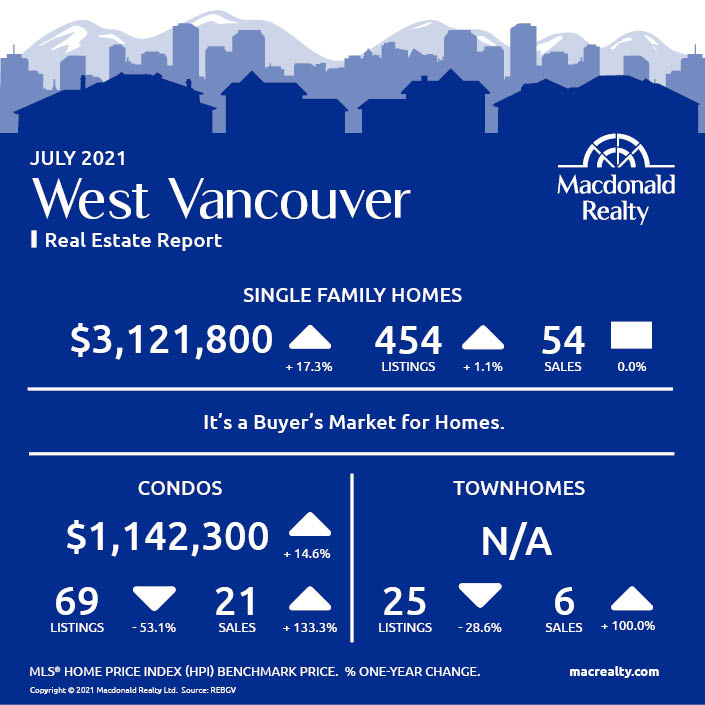
Here are the latest real estate market statistics from Macdonald Realty on the Greater Vancouver listings and sales in July 2021.
Find all the infographics by visiting the Facebook Album.
Metro Vancouver’s* housing market saw more moderate sales, listings and pricing trends in July compared to the heightened activity experienced throughout much of the pandemic.
“Moderation was the name of the game in July,” said REBGV’s economist Keith Stewart. “Home sales and listings fell in line with typical seasonal patterns as summer got going in earnest in July. On top of moderating market activity, price growth has leveled off in most areas and home types.”
As released by the Board:
“Low housing supply remains a fundamental factor in Metro Vancouver’s housing market,” Stewart said. “Home sales remain above average and we’re starting to see price increases relent as well. Going forward, the supply of homes for sale will be among the most critical factors to watch. This will determine the next direction for house price trends.”
*Areas covered by the Real Estate Board of Greater Vancouver include: Burnaby, Coquitlam, Maple Ridge, New Westminster, North Vancouver, Pitt Meadows, Port Coquitlam, Port Moody, Richmond, South Delta, Squamish, Sunshine Coast, Vancouver, West Vancouver, and Whistler. Check out the infographics of Squamish, Sunshine Coast and Whitler, HERE.
Bowen Island
Burnaby East
Burnaby North
Burnaby South
Ladner
Maple Ridge
New Westminster
North Vancouver

Pitt Meadows

Coquitlam
Port Coquitlam
Port Moody
Richmond
Tsawwassen
Vancouver East
Vancouver West
West Vancouver
Looking for more information about the real estate market in specific neighbourhoods in the Greater Vancouver?
Macdonald Realty has offices across the Greater Vancouver. Please email [email protected] or call 1-877-278-3888 to be matched with a REALTOR® working in your area.
MLS® Home Price Index (HPI) Benchmark Price
Average and median home prices are often misinterpreted, are affected by change in the mix of homes sold, and can swing dramatically from month to month (based on the types and prices of properties that sold in a given month). The MLS® HPI overcomes these shortcomings and uses the concept of a benchmark home, a notional home with common attributes of typical homes in a defined area. Visit www.housepriceindex.ca for more information.
This blog post is based on market data provided by the Real Estate Board of Greater Vancouver (REBGV) www.rebgv.org

