by Macrealty Marketing Team | Jul 8, 2021 | Market Updates
Here are the latest real estate market statistics from Macdonald Realty on the Greater Vancouver listings and sales in June 2021.
Find all the infographics by visiting the Facebook Album.
While still elevated, home sale and listing activity in Metro Vancouver* has eased back from the record-setting pace seen in March and April of this year.
The Real Estate Board of Greater Vancouver (REBGV) reports that residential home sales in the region totalled 3,762 in June 2021, a 54 per cent increase from the 2,443 sales recorded in June 2020, and an 11.9 per cent decrease from the 4,268 homes sold in May 2021. Last month’s sales were 18.4 per cent above the 10-year June sales average.
“Metro Vancouver’s housing market continues to experience strong seller’s market conditions, although the intensity of demand has eased from what we saw throughout most of the spring,” Keith Stewart, REBGV economist said. “The past two months have shown a market that’s shifting toward more historically typical conditions.”
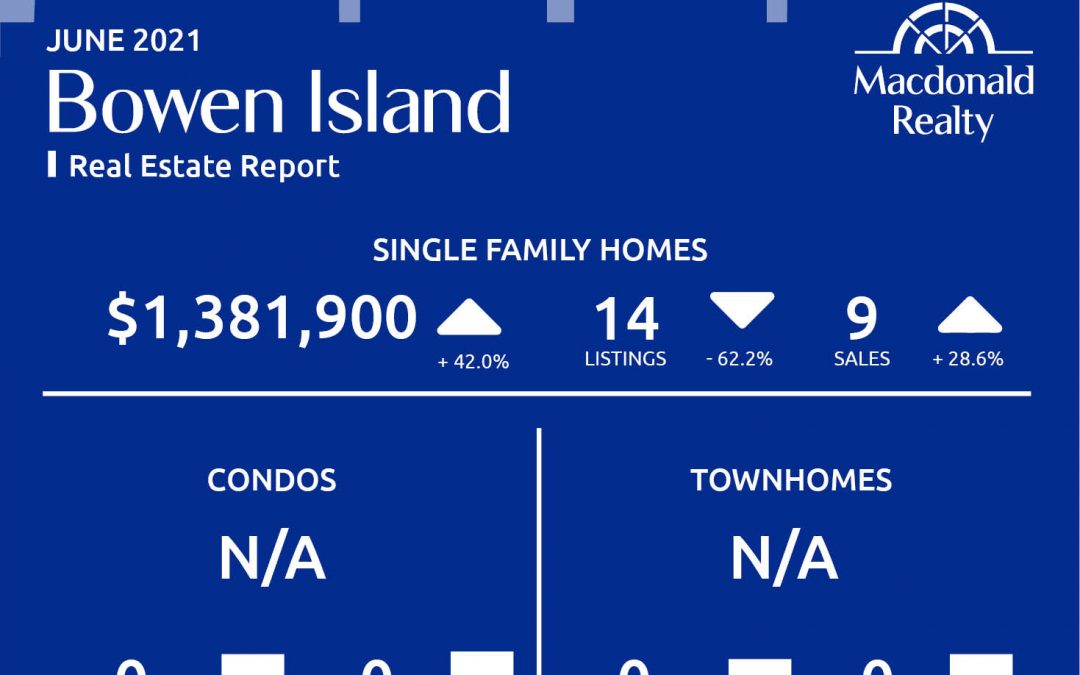
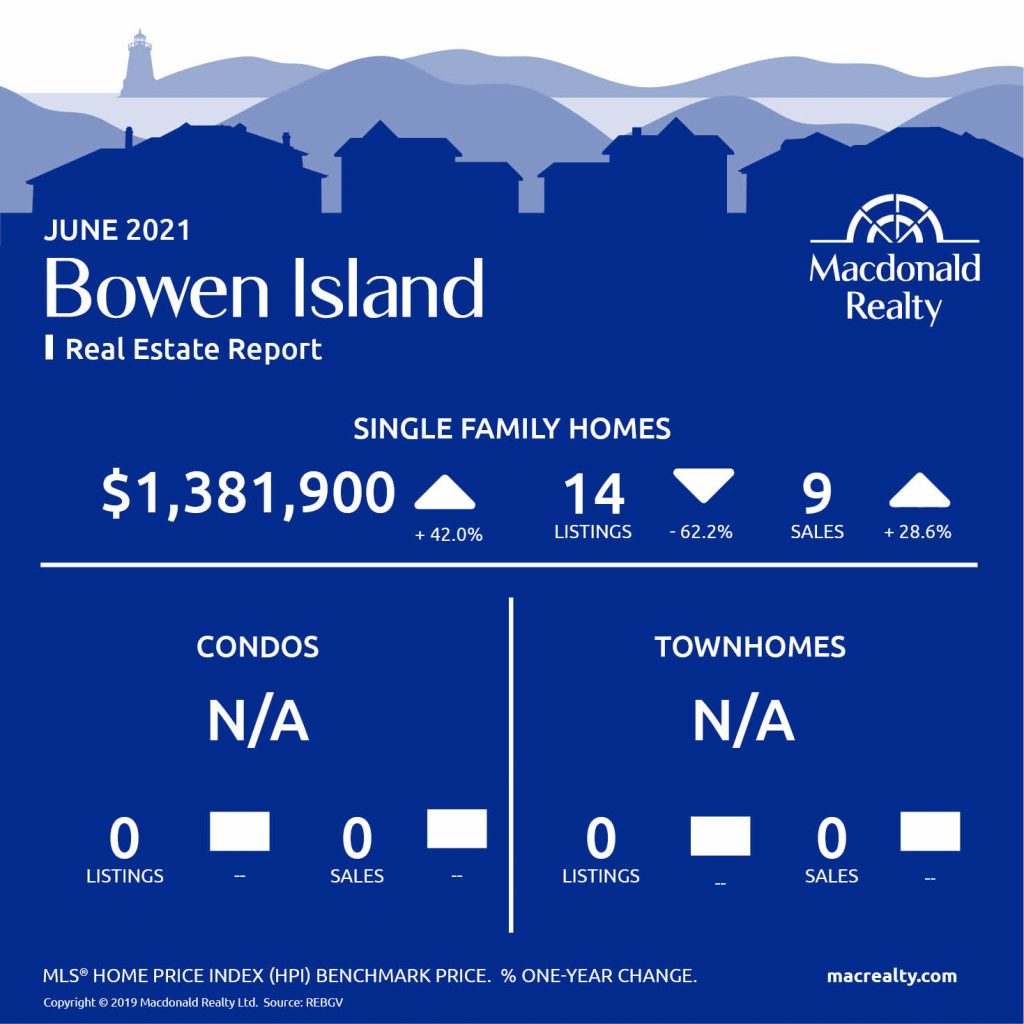
Bowen Island
Burnaby East

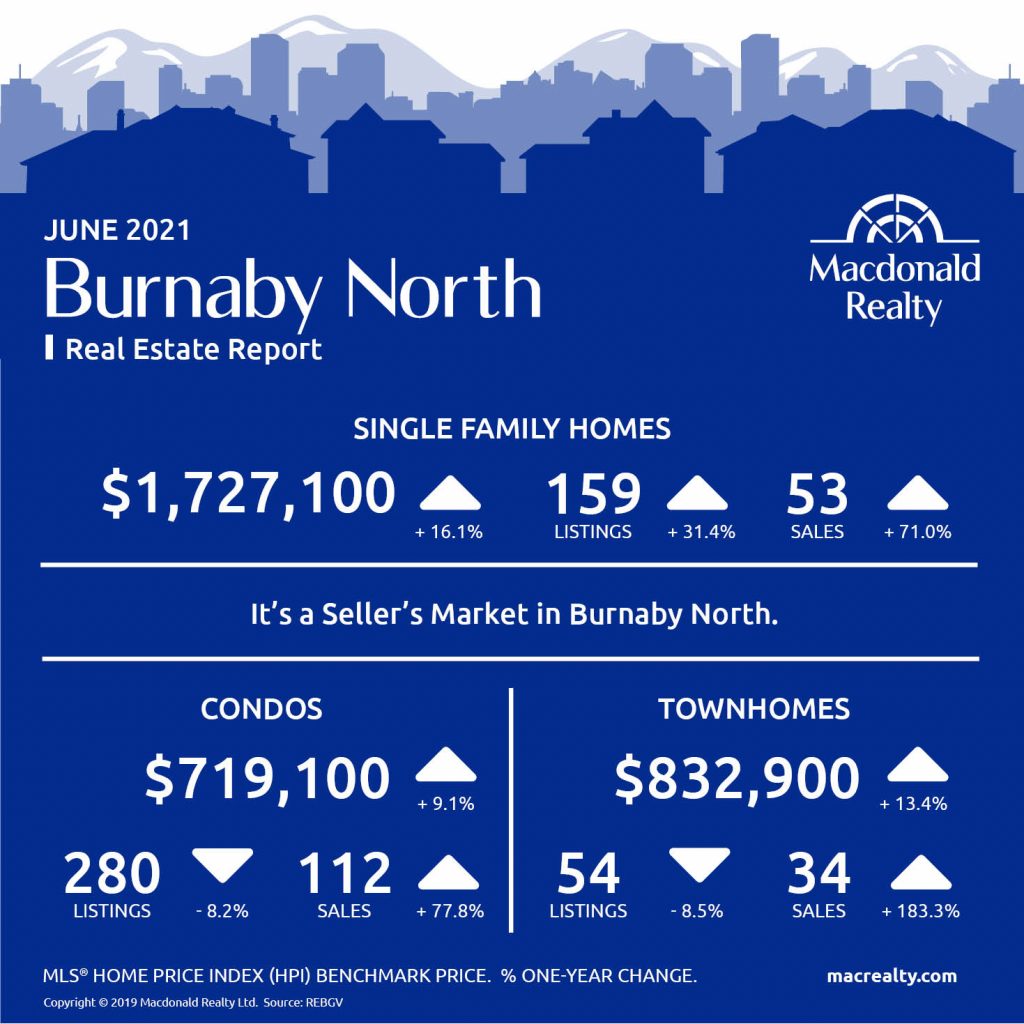
Burnaby North
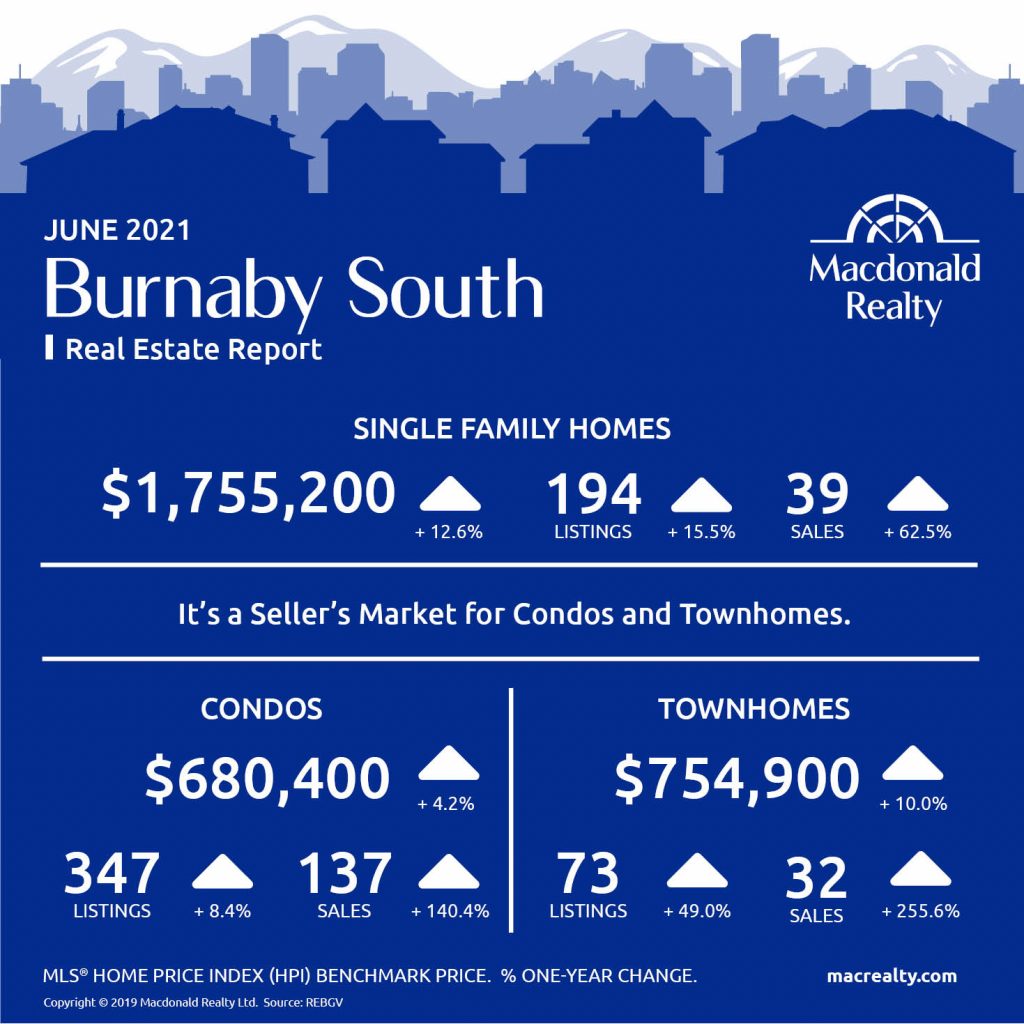
Burnaby South
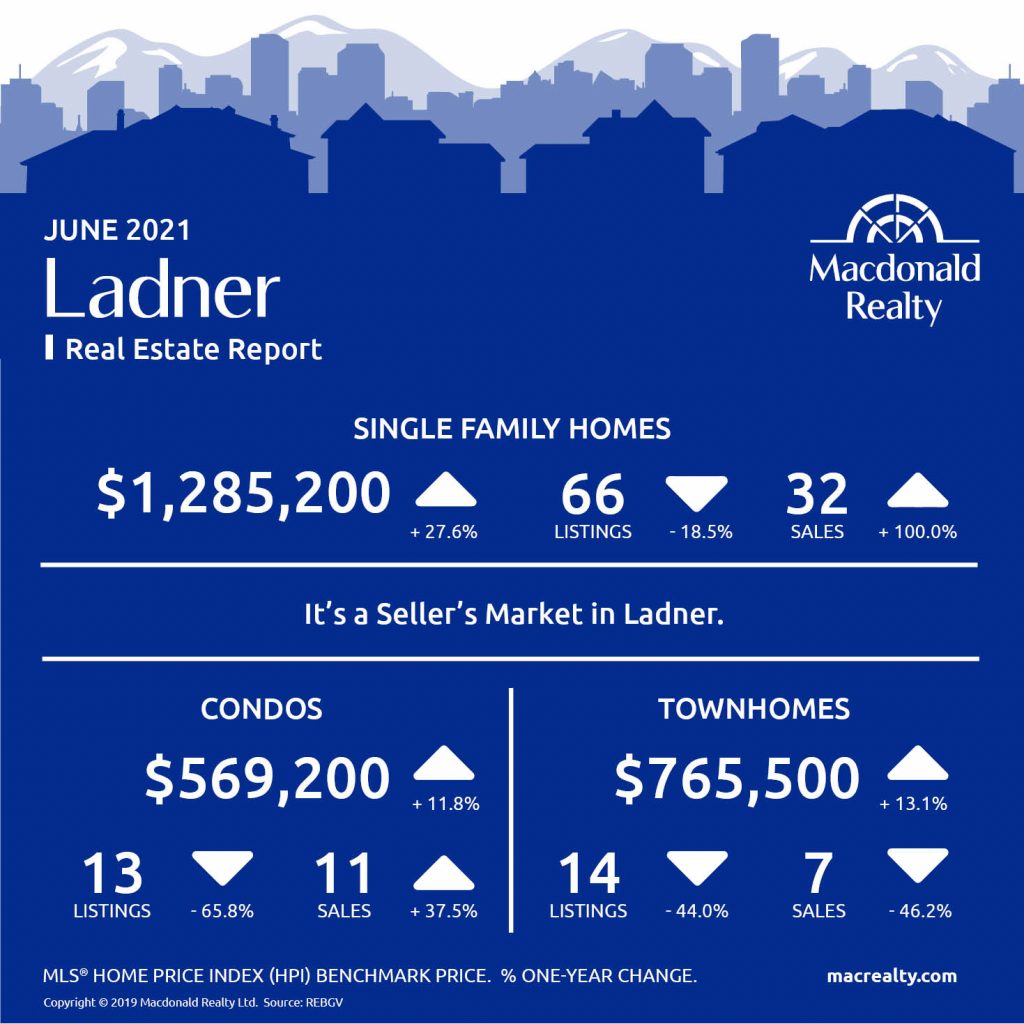
Ladner
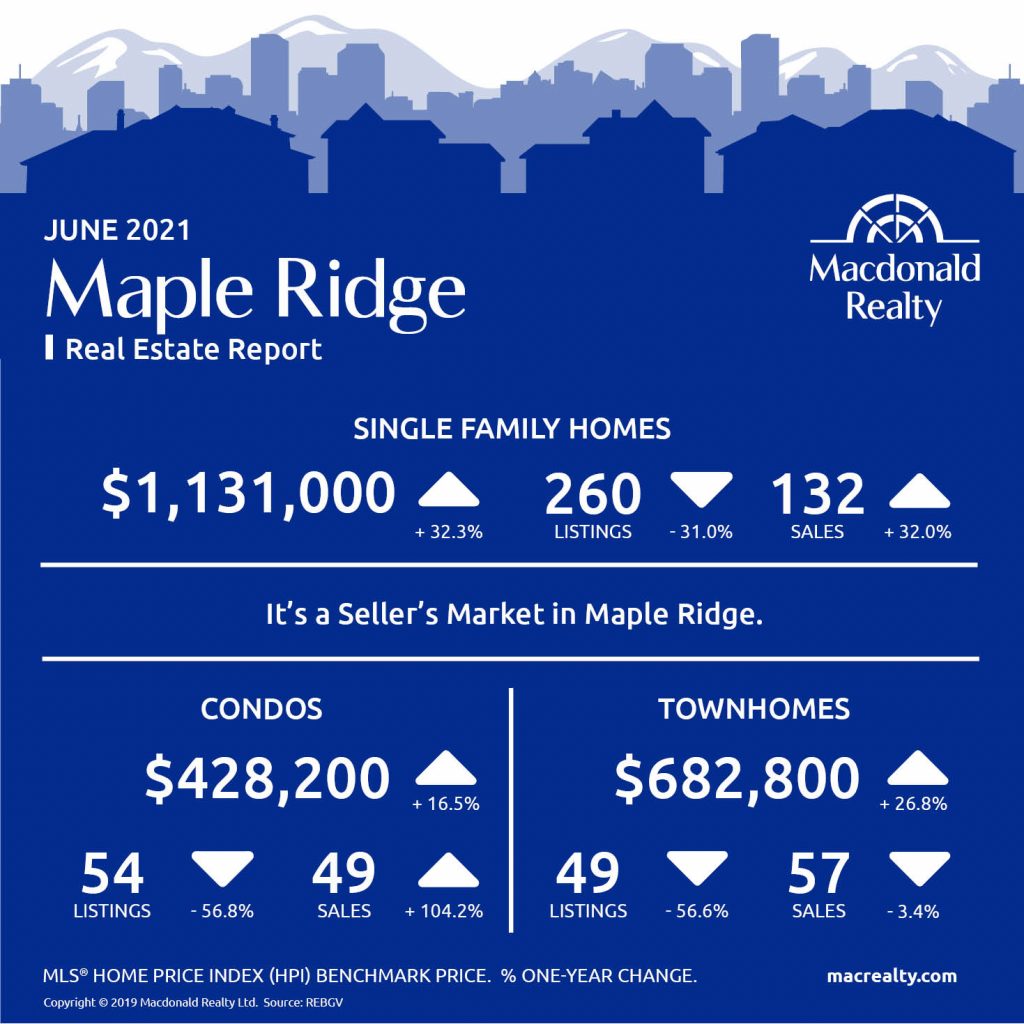
Maple Ridge
New Westminster

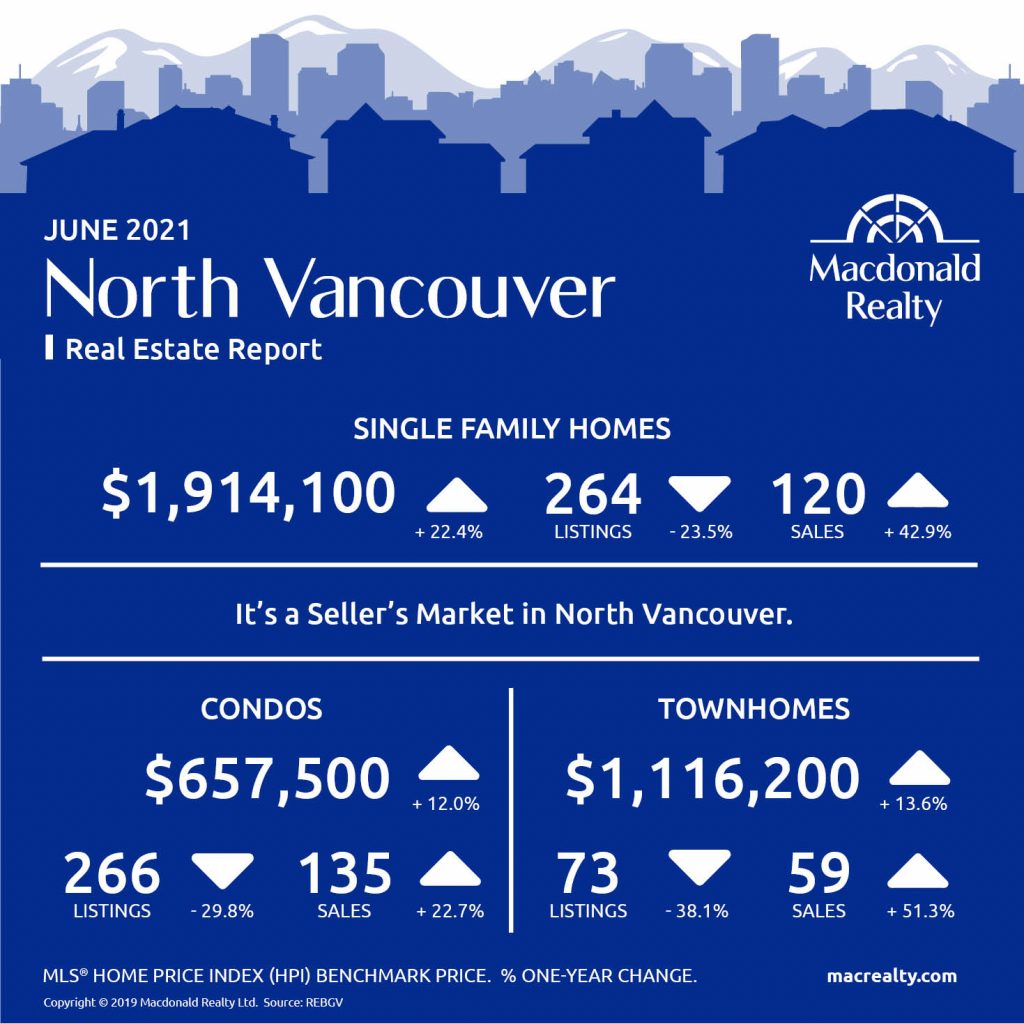
North Vancouver
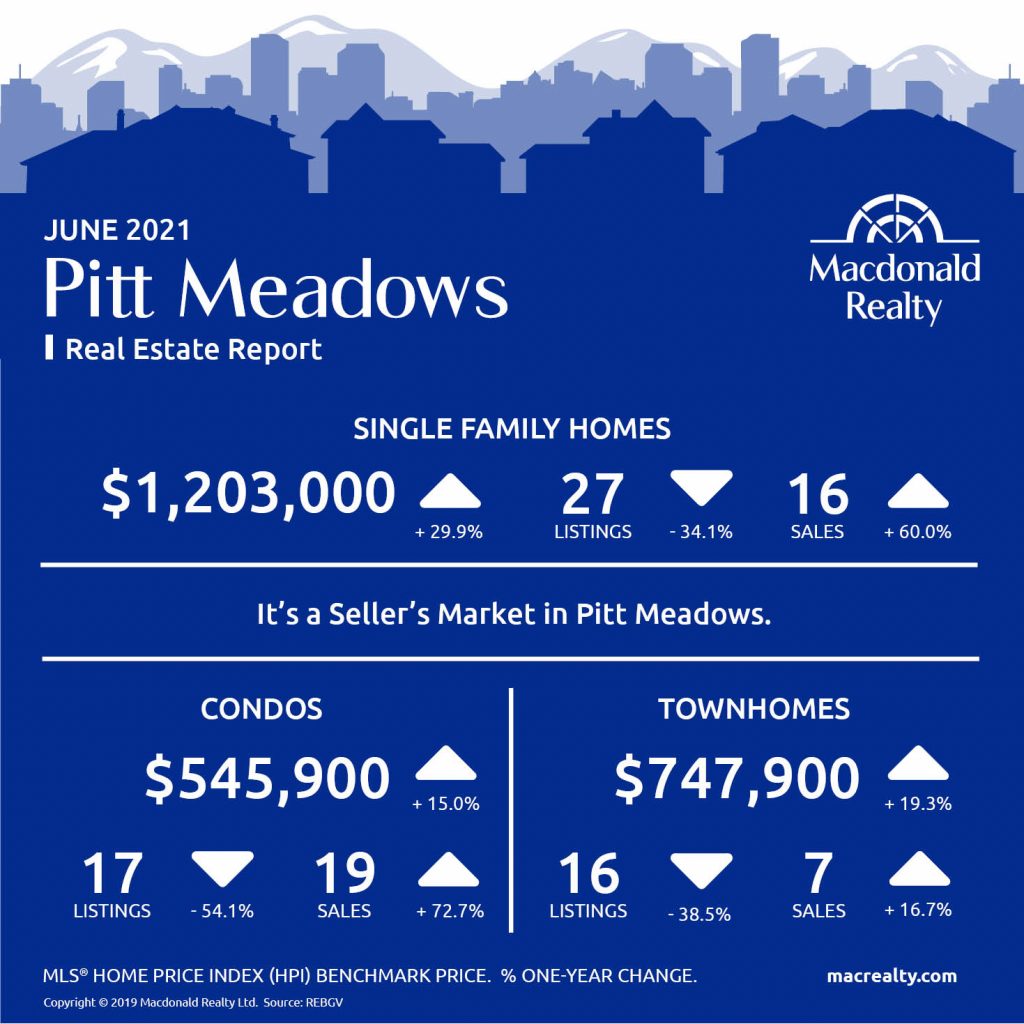
Pitt Meadows
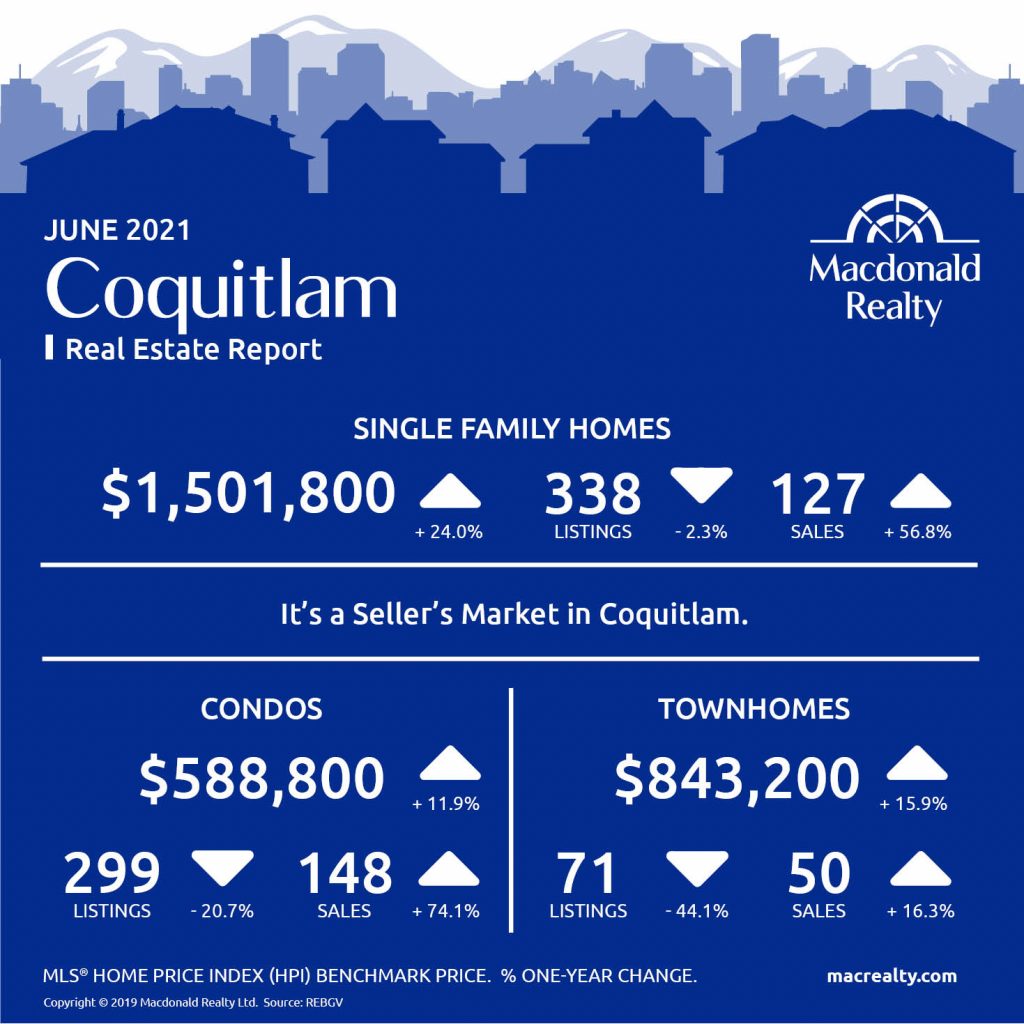
Coquitlam
Port Coquitlam
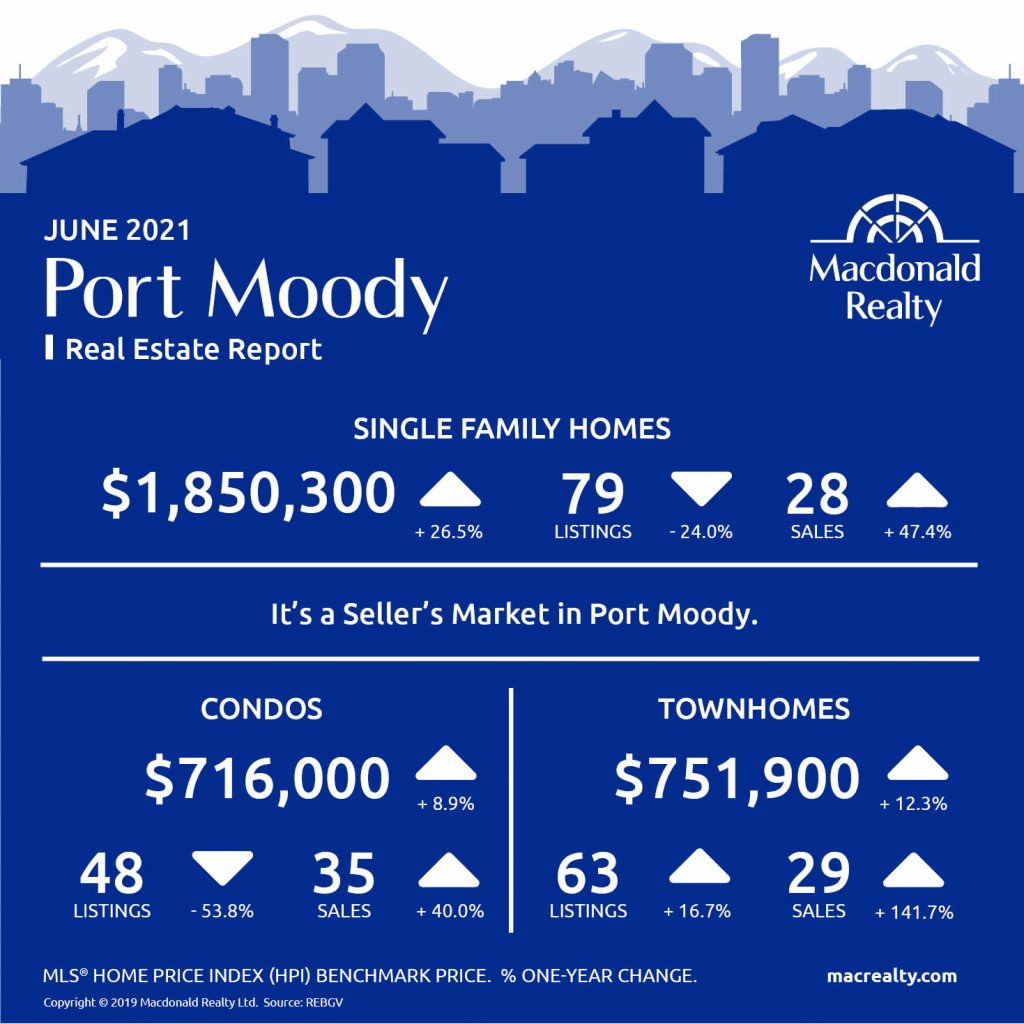
Port Moody
Richmond

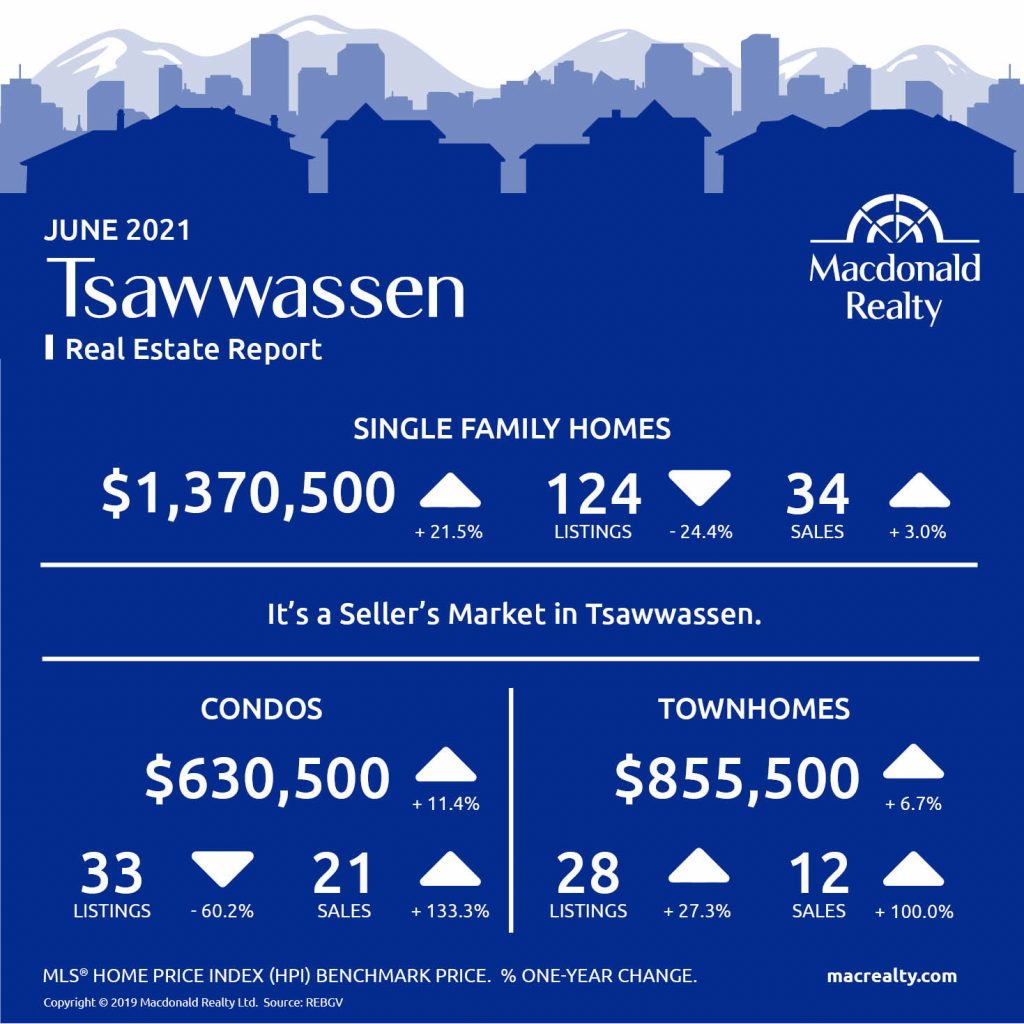
Tsawwassen
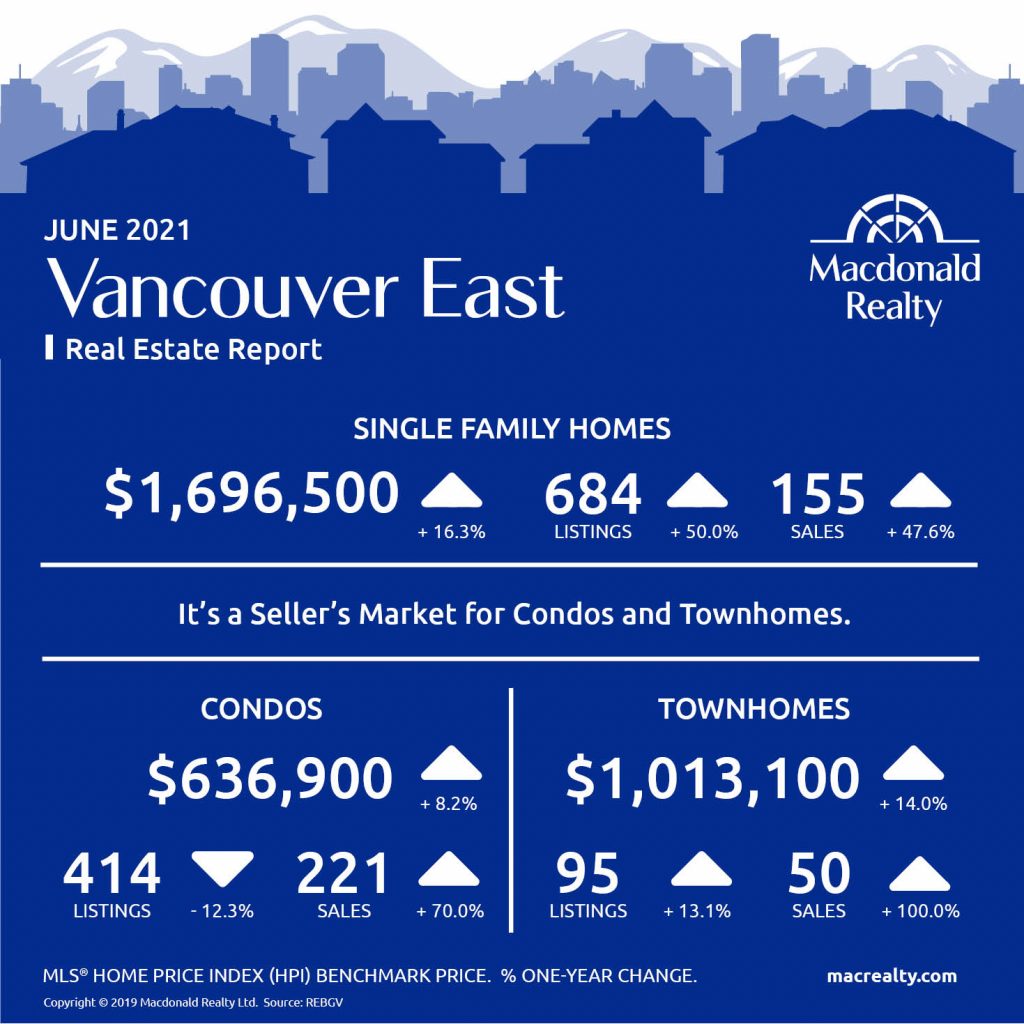
Vancouver East
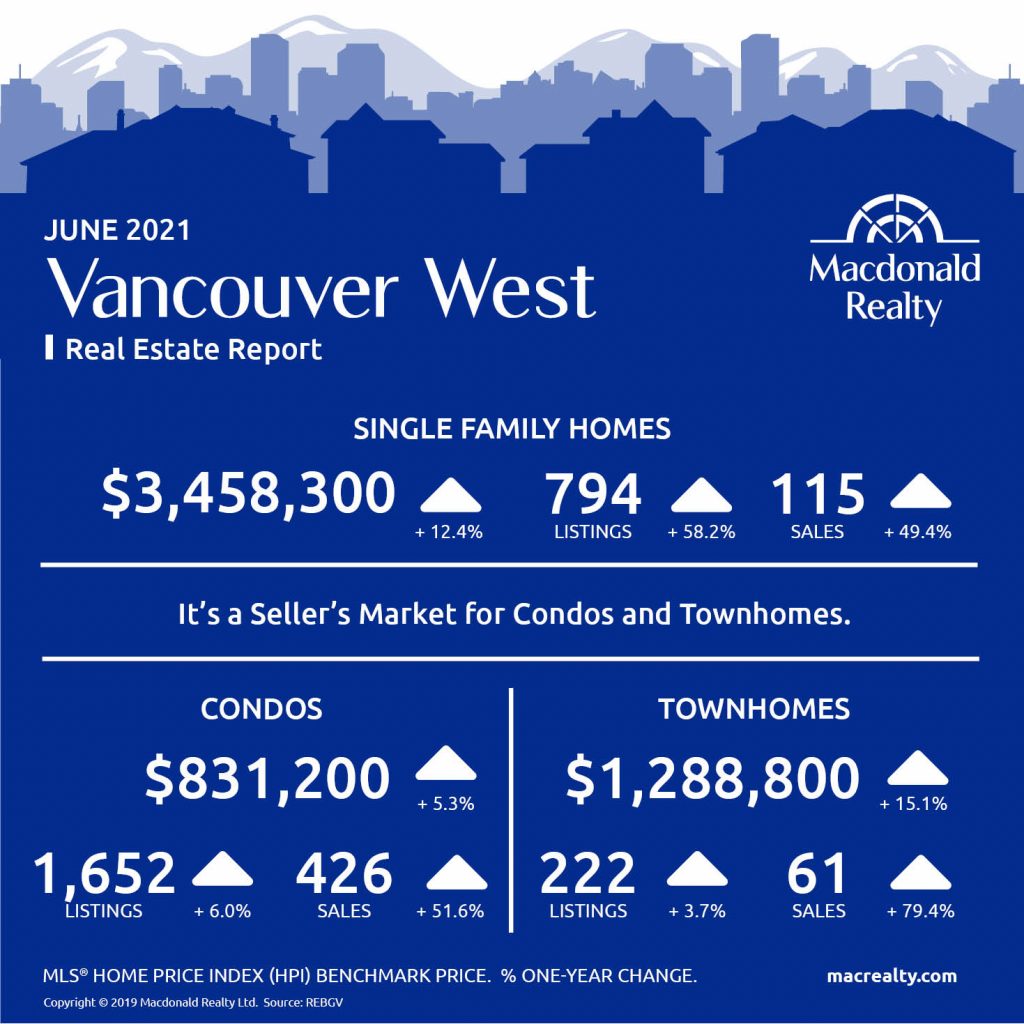
Vancouver West
West Vancouver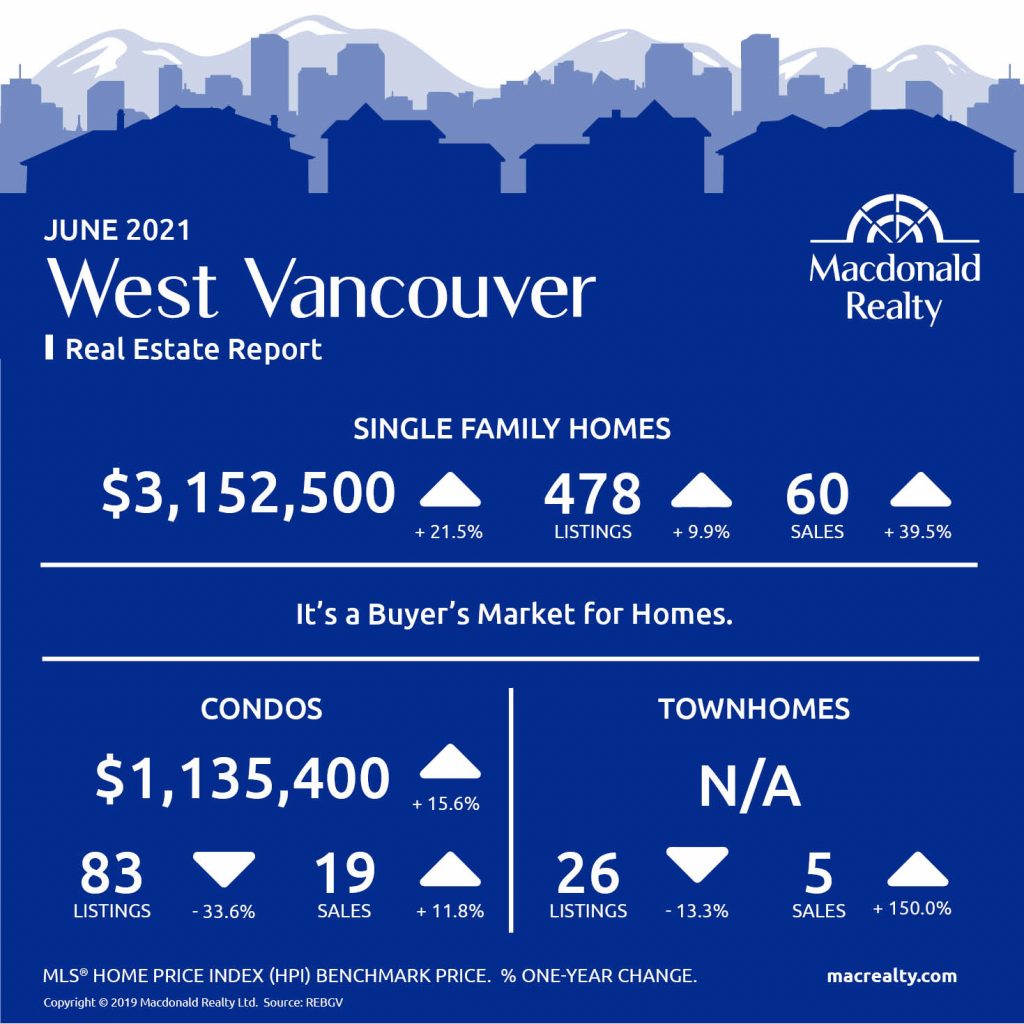
Looking for more information about the real estate market in specific neighbourhoods in the Greater Vancouver?
Macdonald Realty has offices across the Greater Vancouver. Please email [email protected] or call 1-877-278-3888 to be matched with a REALTOR® working in your area.
MLS® Home Price Index (HPI) Benchmark Price
Average and median home prices are often misinterpreted, are affected by change in the mix of homes sold, and can swing dramatically from month to month (based on the types and prices of properties that sold in a given month). The MLS® HPI overcomes these shortcomings and uses the concept of a benchmark home, a notional home with common attributes of typical homes in a defined area. Visit www.housepriceindex.ca for more information.
This blog post is based on market data provided by the Real Estate Board of Greater Vancouver (REBGV) www.rebgv.org

by Macrealty Marketing Team | Jun 7, 2021 | Market Updates
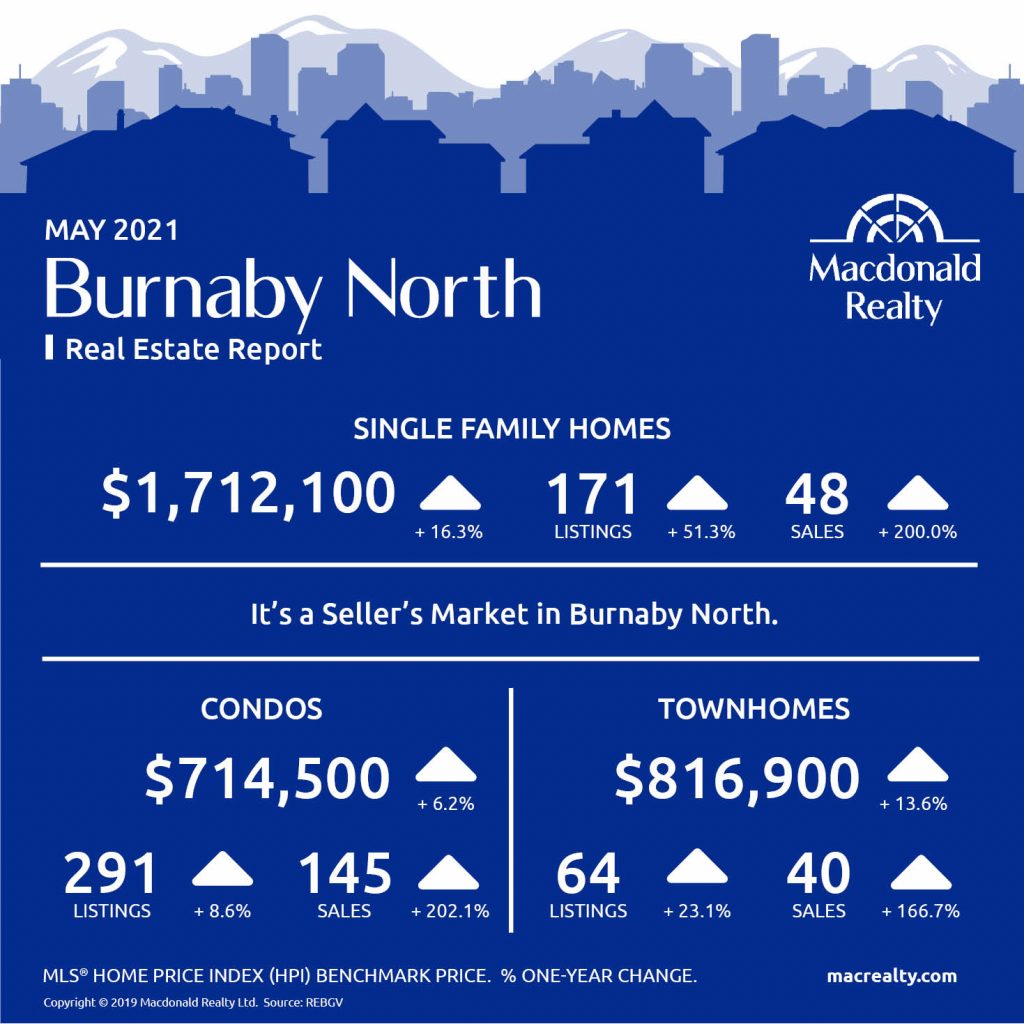
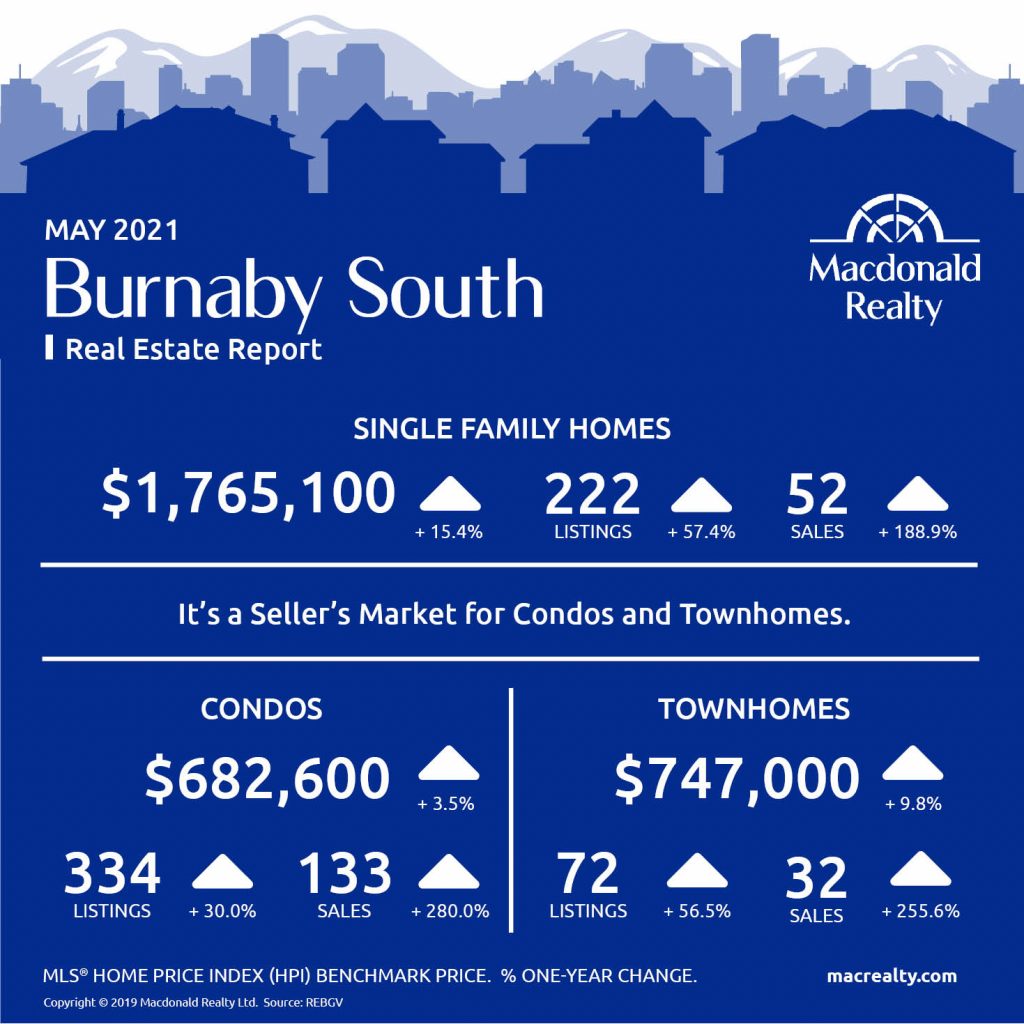
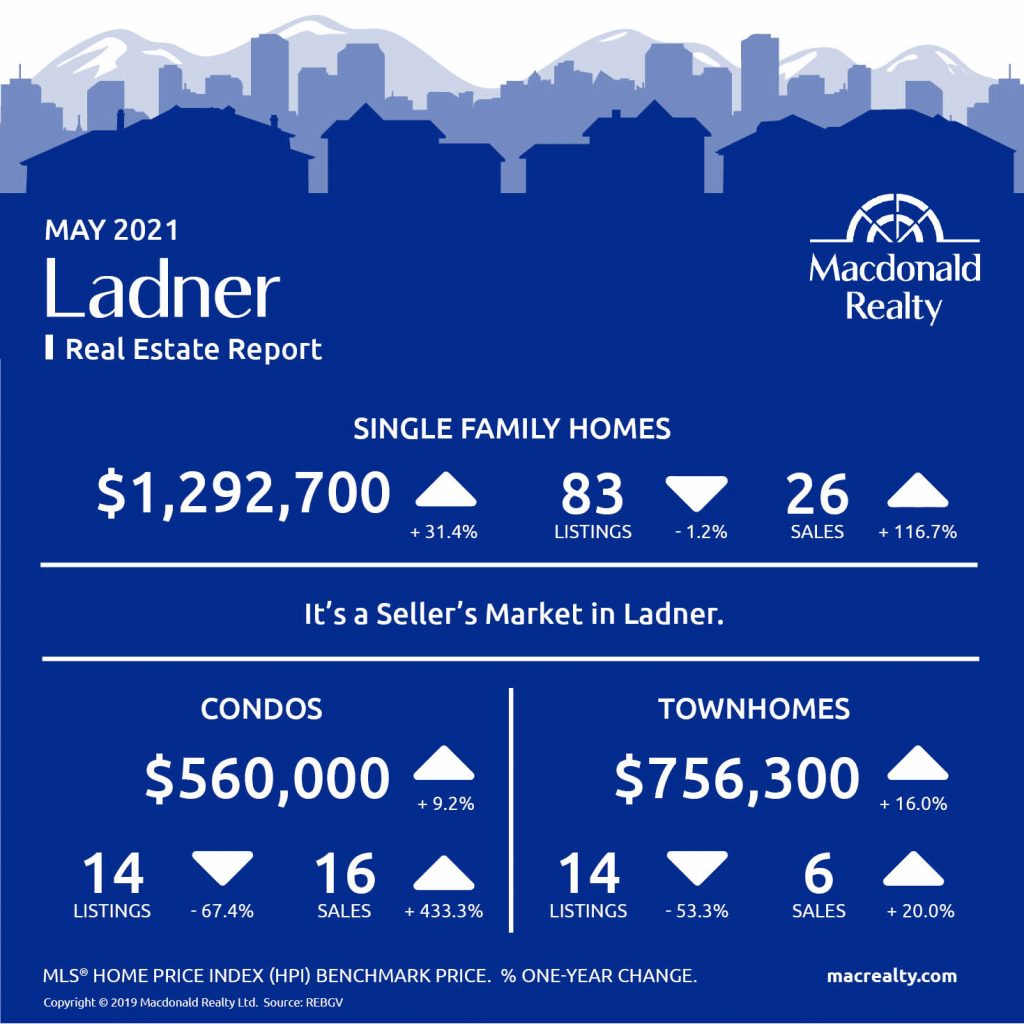
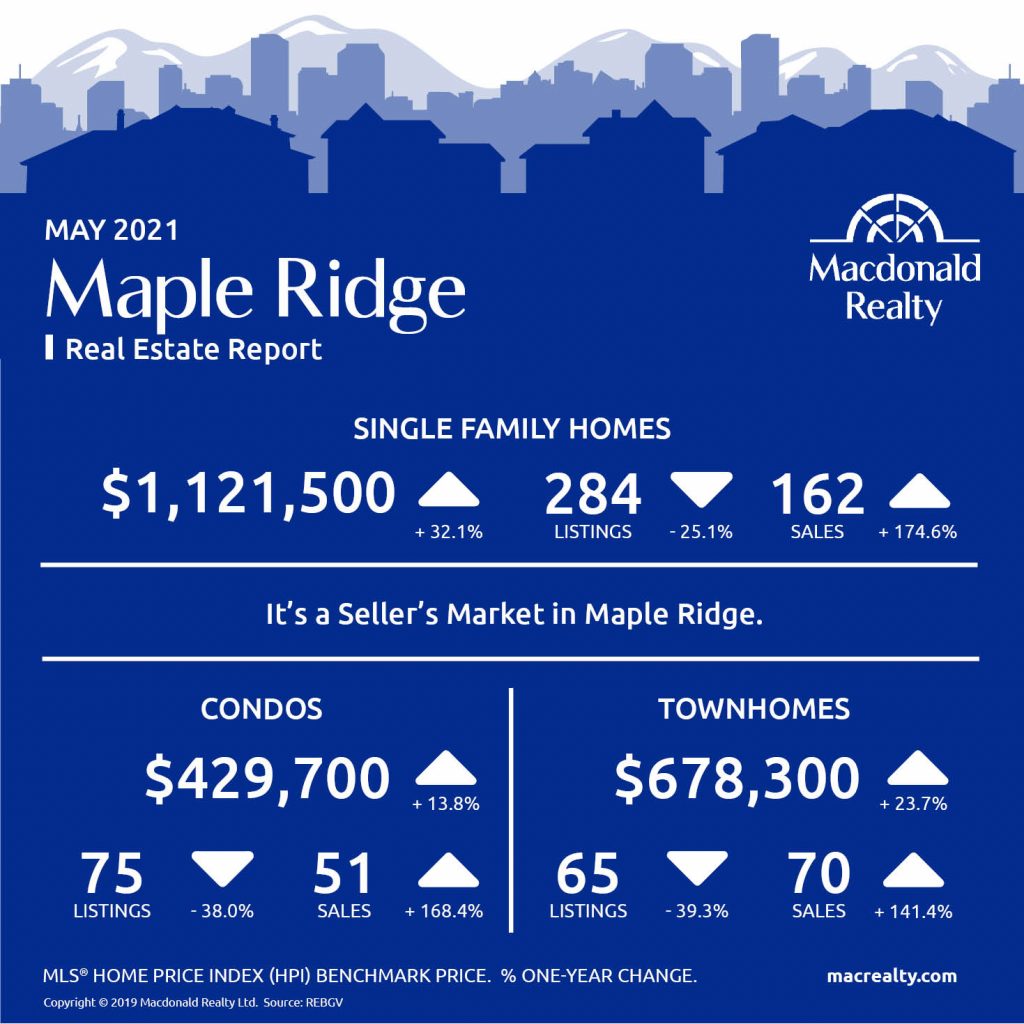
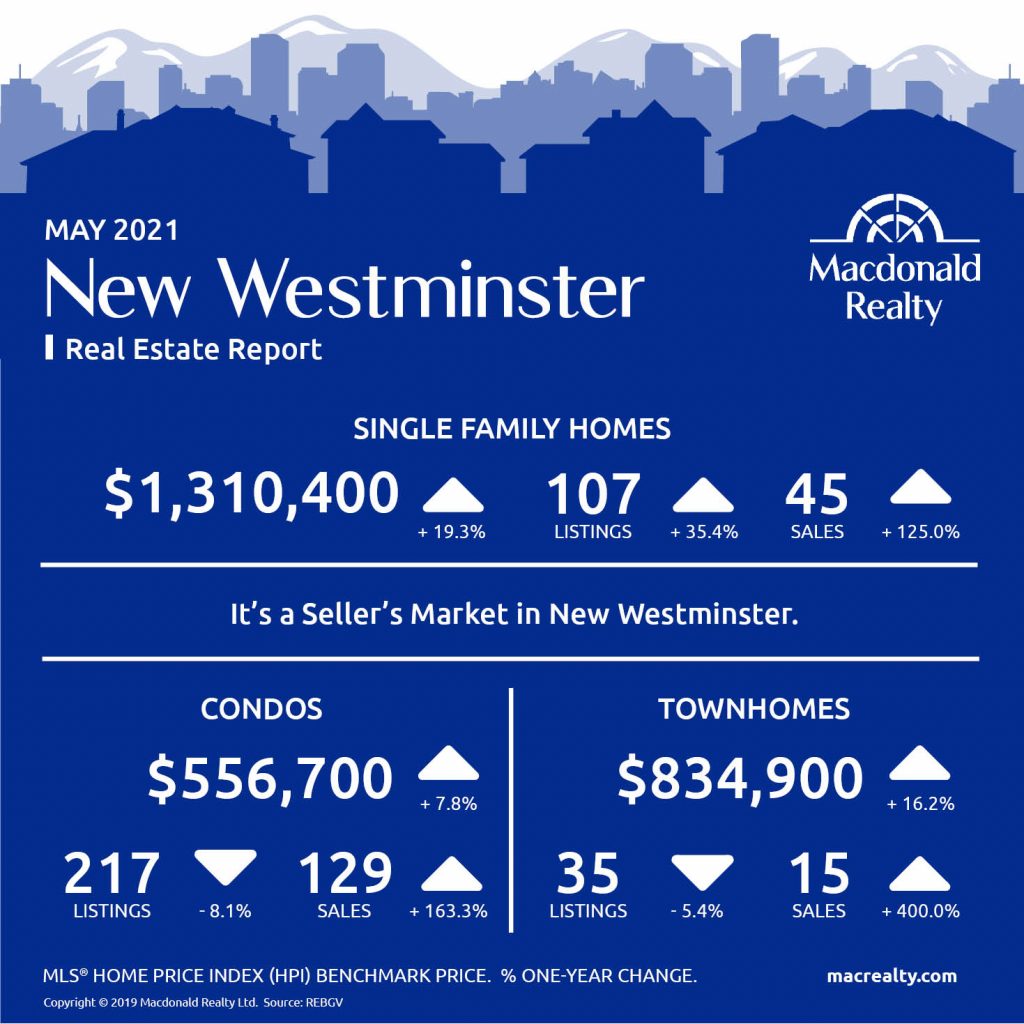
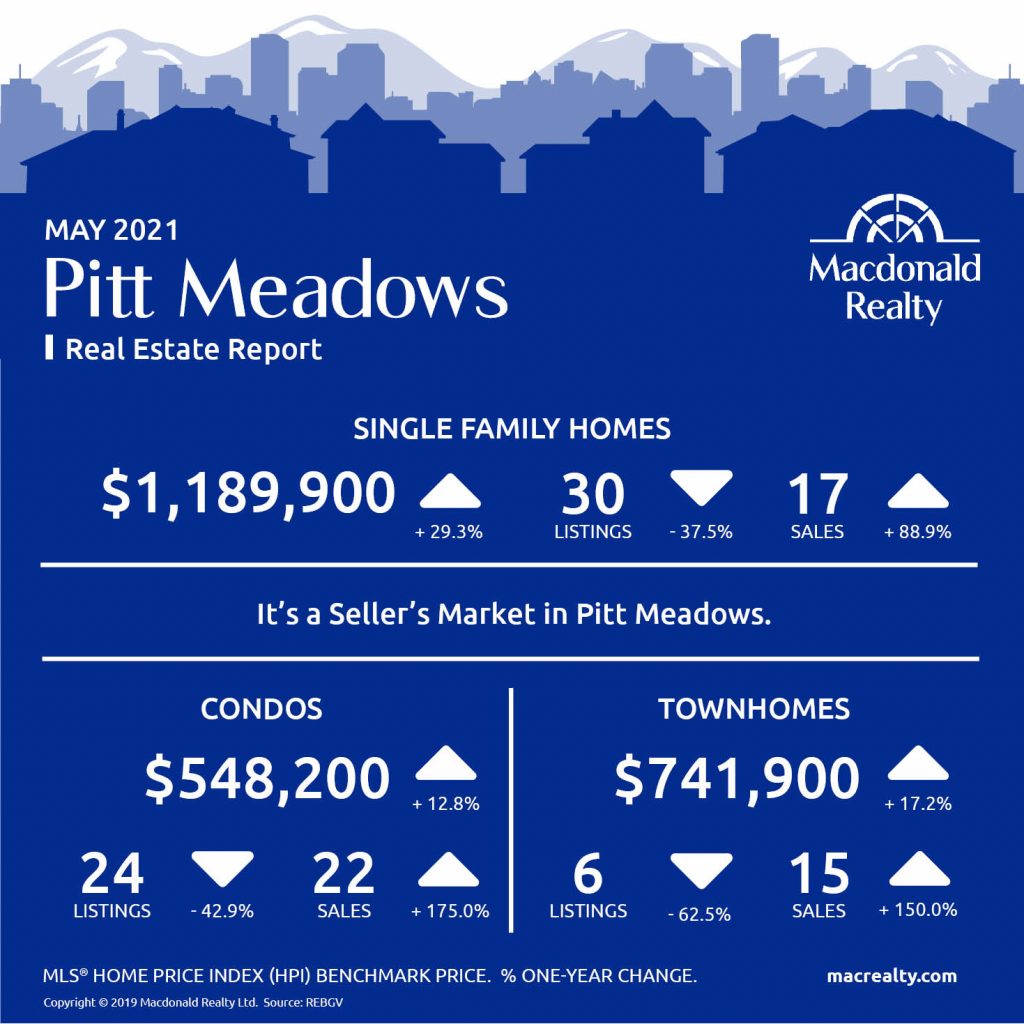
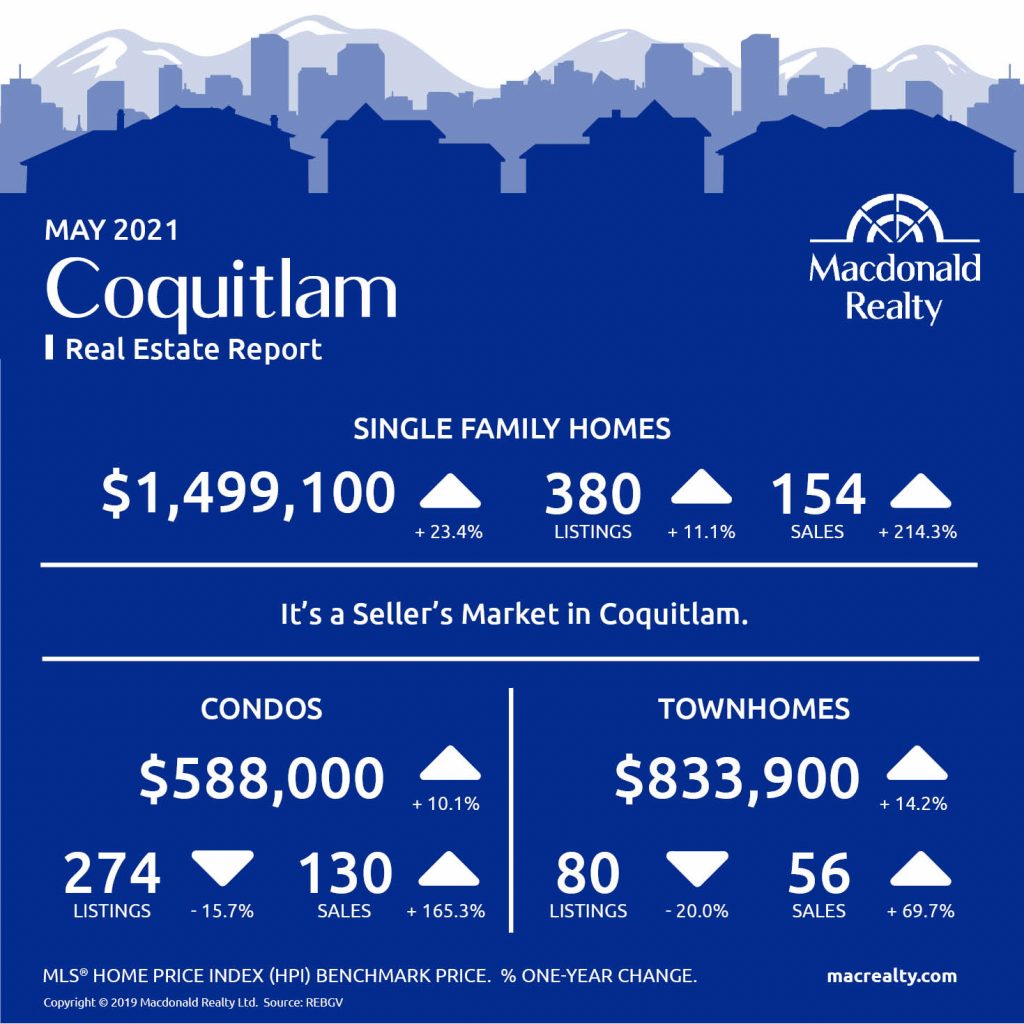
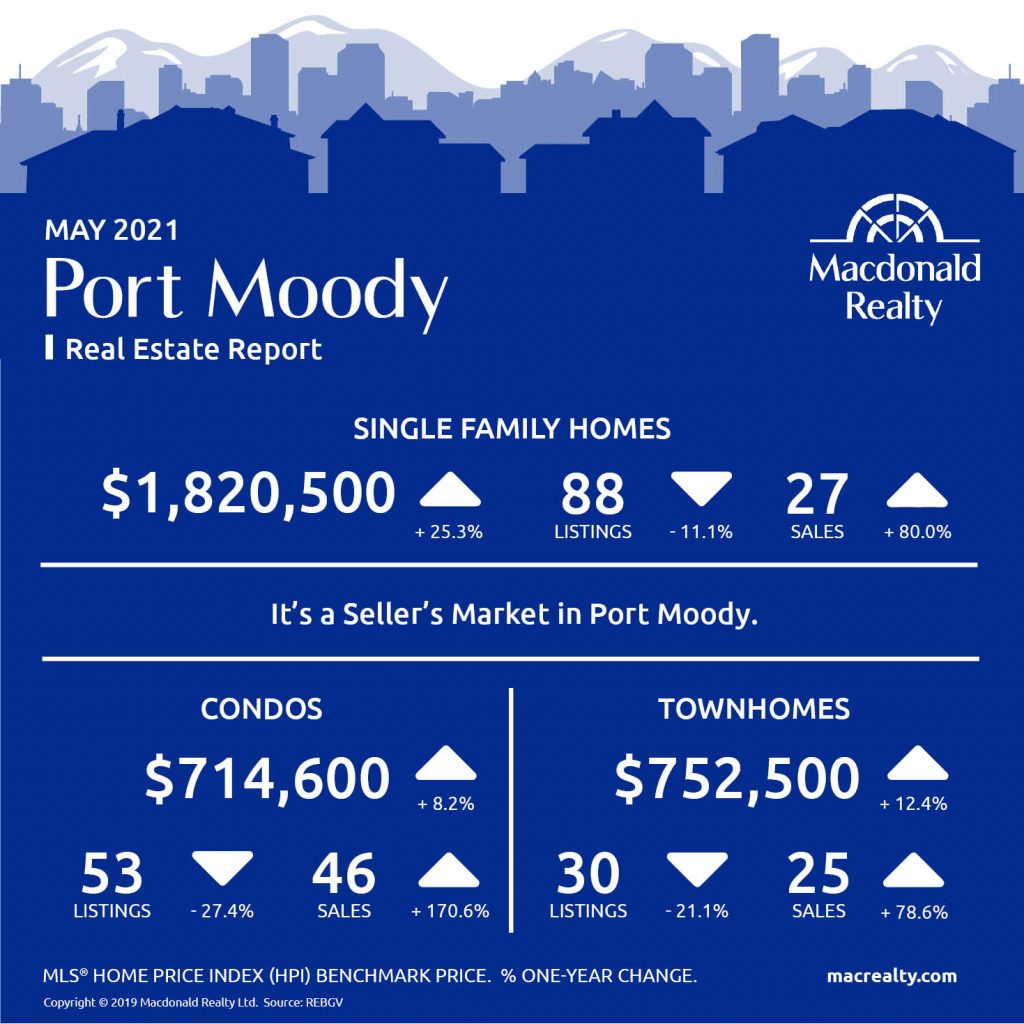
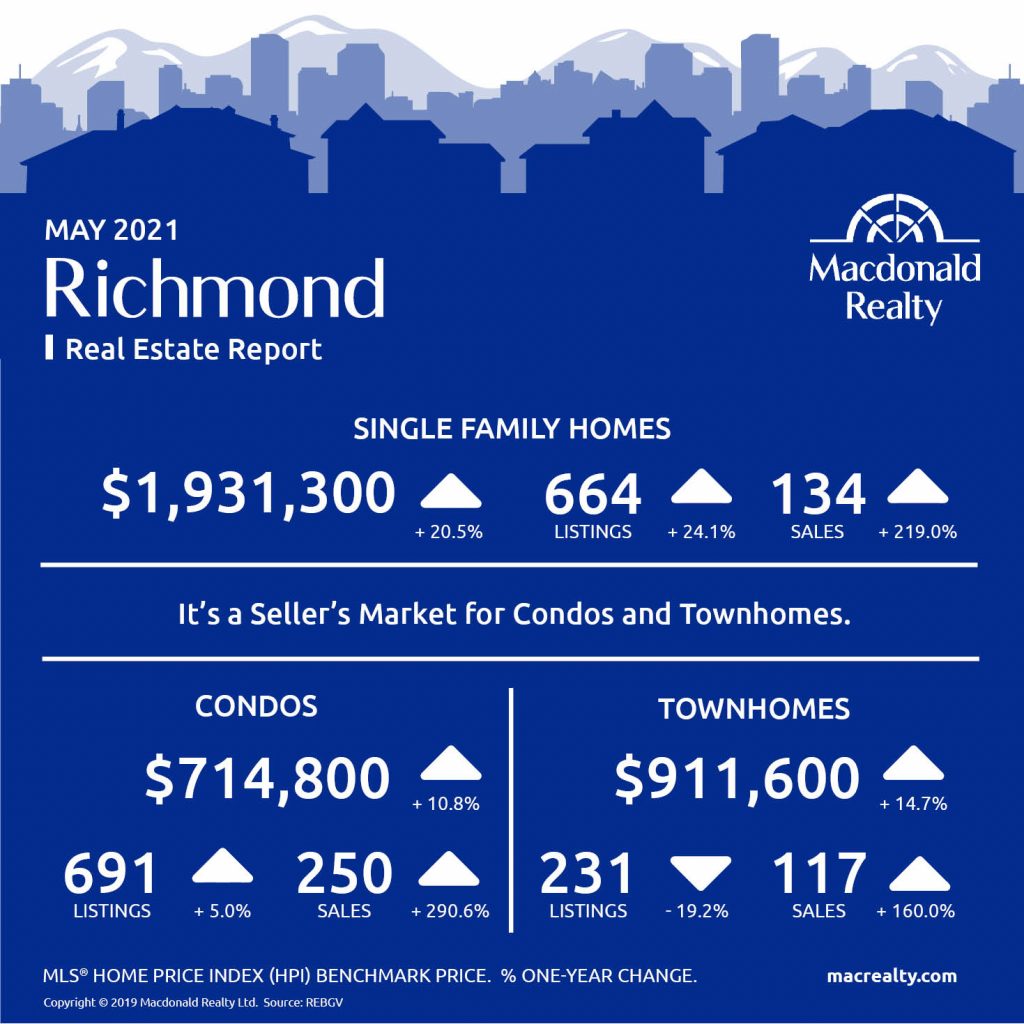
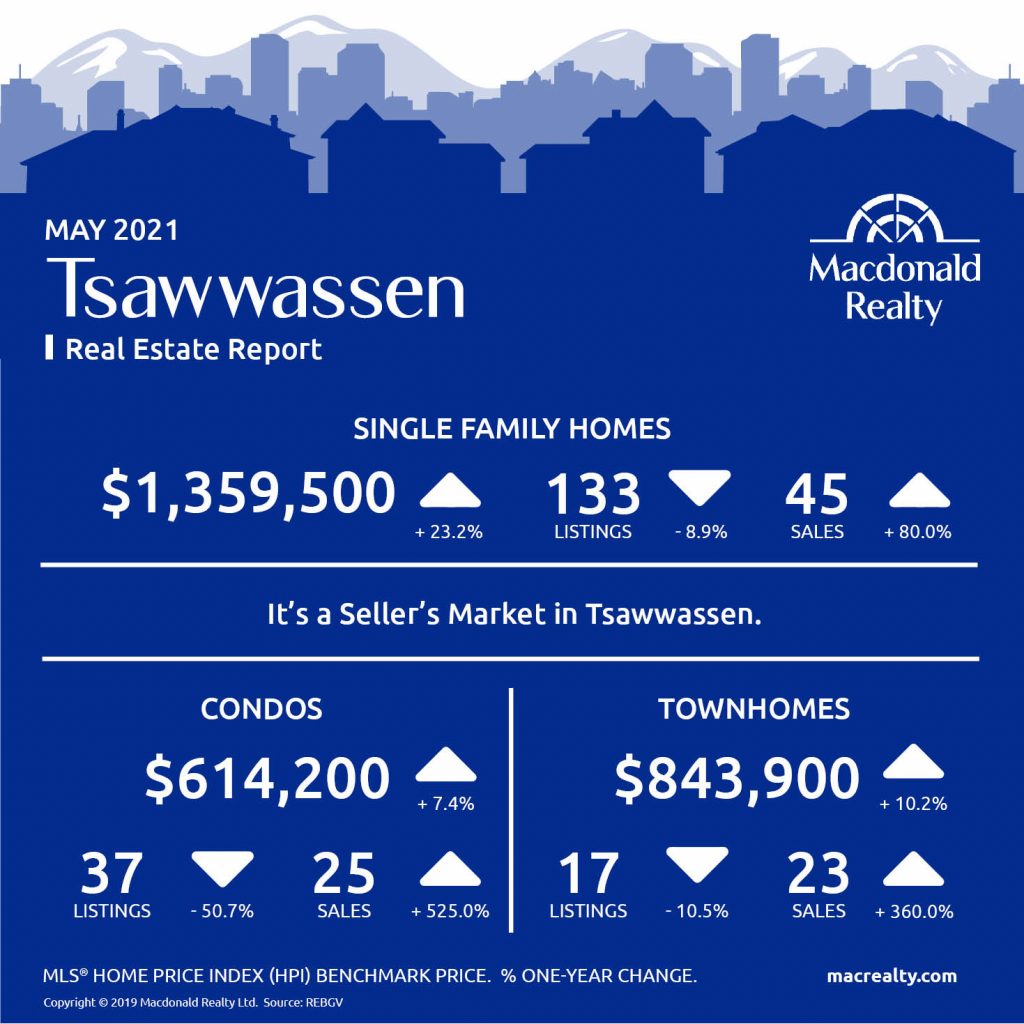
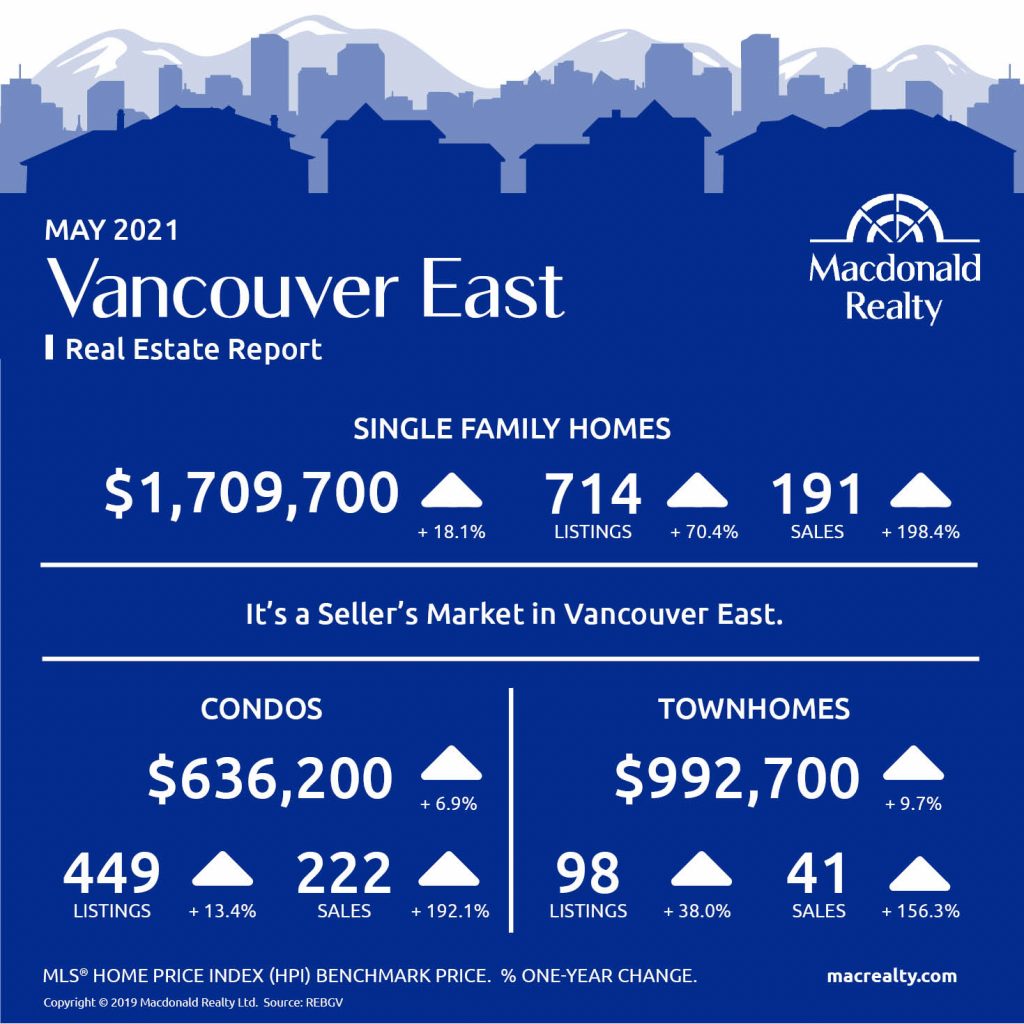
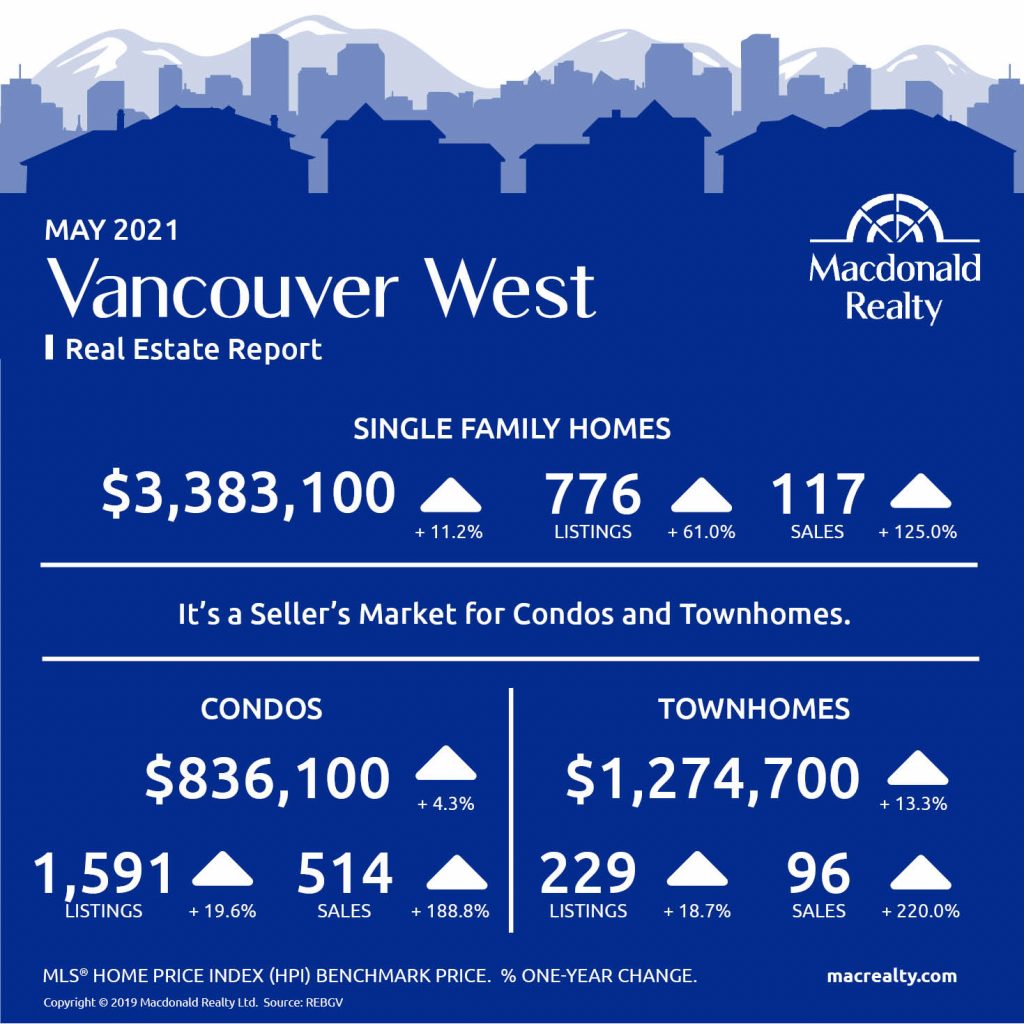
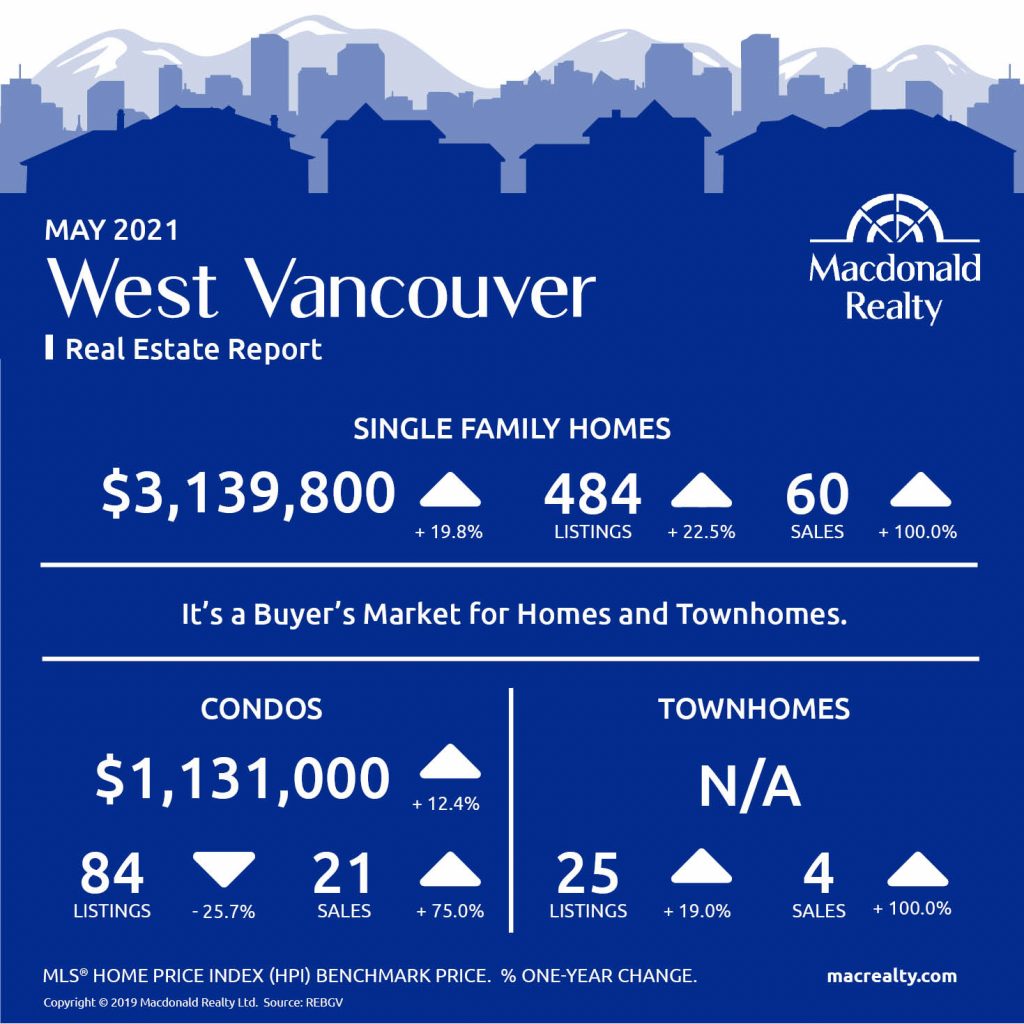
Here are the latest real estate market statistics from Macdonald Realty on the Greater Vancouver listings and sales in MAY 2021.
Find all the infographics by visiting the Facebook Album.
The Real Estate Board of Greater Vancouver (REBGV) reports that residential home sales in the region totalled 4,268 in May 2021, a 187.4 per cent increase from the 1,485 sales recorded in May 2020, and a 13 per cent decrease from the 4,908 homes sold in April 2021.
Last month’s sales were 27.7 per cent above the 10-year May sales average.
“While home sale and listing activity remained above our long-term averages in May, conditions moved back from the record-setting pace experienced throughout Metro Vancouver in March and April of this year,” Keith Stewart, REBGV economist said. “With a little less intensity in the market today than we saw earlier in the spring, home sellers need to ensure they’re working with their REALTOR® to price their homes based on current market conditions.”
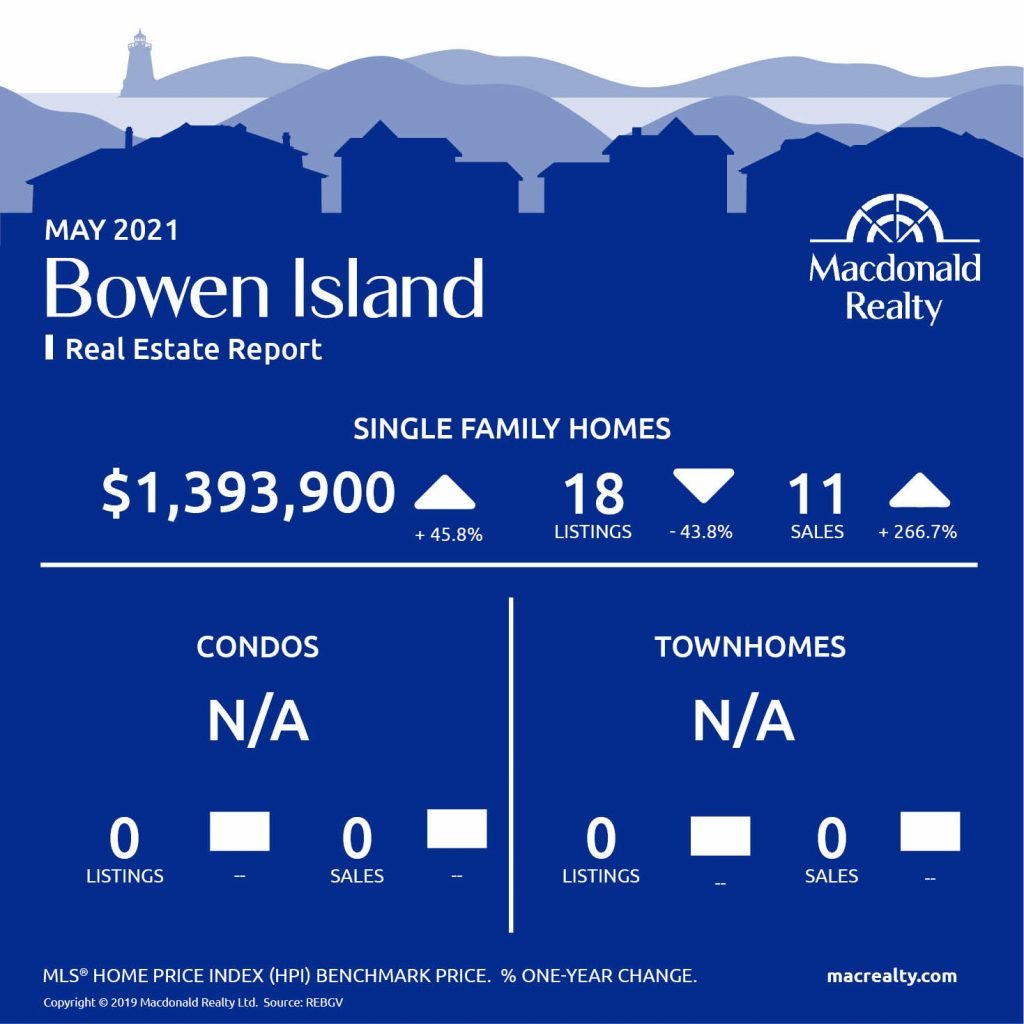
Bowen Island
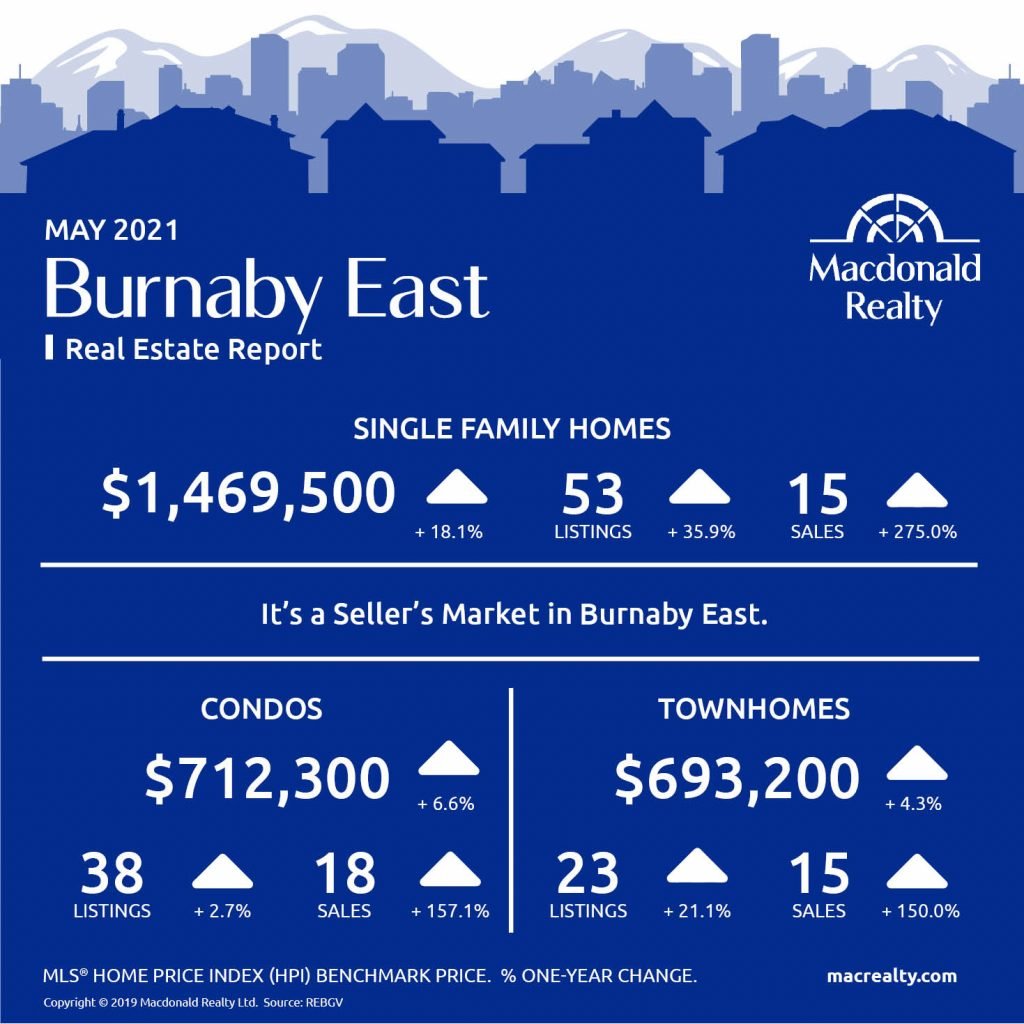
Burnaby East
Burnaby North
Burnaby South
Ladner
Maple Ridge
New Westminster
North Vancouver

Pitt Meadows
Coquitlam
Port Coquitlam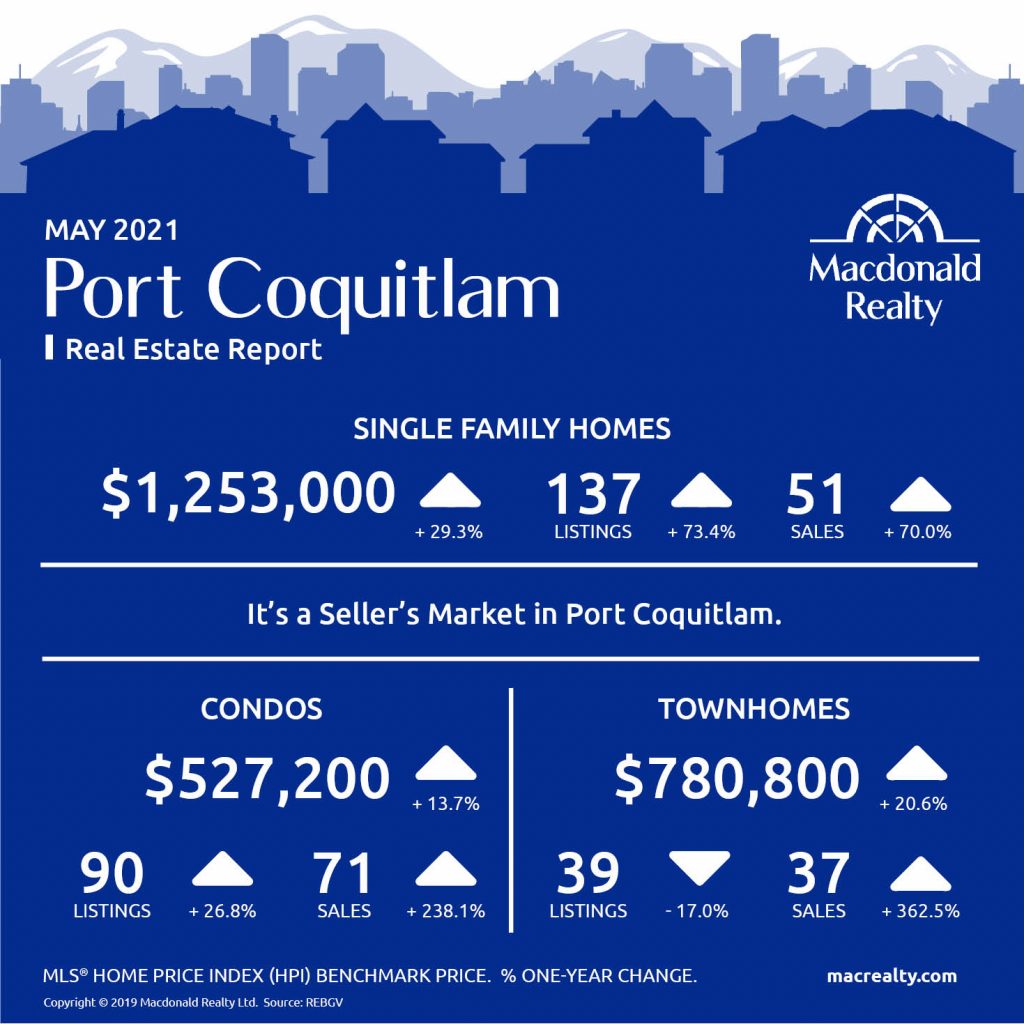
Port Moody
Richmond
Tsawwassen
Vancouver East
Vancouver West
West Vancouver
Looking for more information about the real estate market in specific neighbourhoods in the Greater Vancouver?
Macdonald Realty has offices across the Greater Vancouver. Please email [email protected] or call 1-877-278-3888 to be matched with a REALTOR® working in your area.
MLS® Home Price Index (HPI) Benchmark Price
Average and median home prices are often misinterpreted, are affected by change in the mix of homes sold, and can swing dramatically from month to month (based on the types and prices of properties that sold in a given month). The MLS® HPI overcomes these shortcomings and uses the concept of a benchmark home, a notional home with common attributes of typical homes in a defined area. Visit www.housepriceindex.ca for more information.
This blog post is based on market data provided by the Real Estate Board of Greater Vancouver (REBGV) www.rebgv.org

by Macrealty Marketing Team | May 6, 2021 | Market Updates
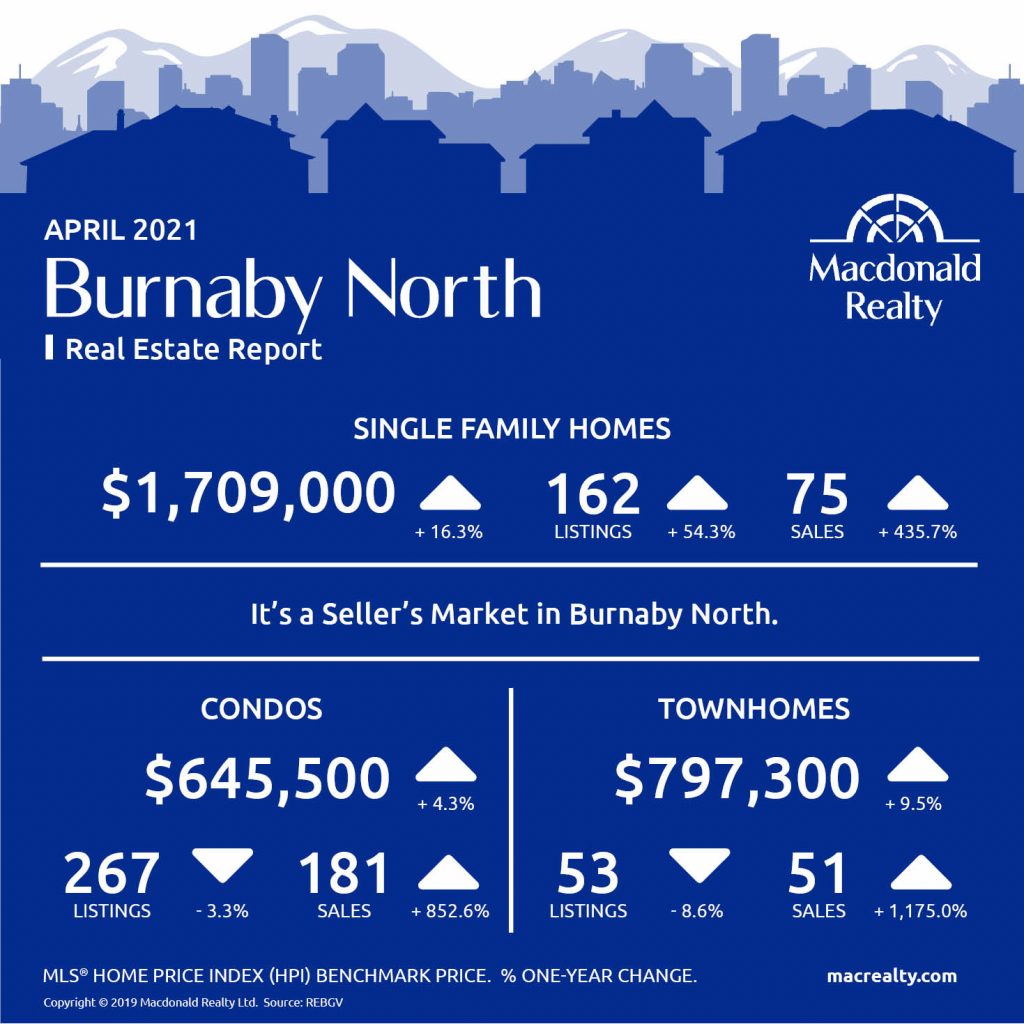
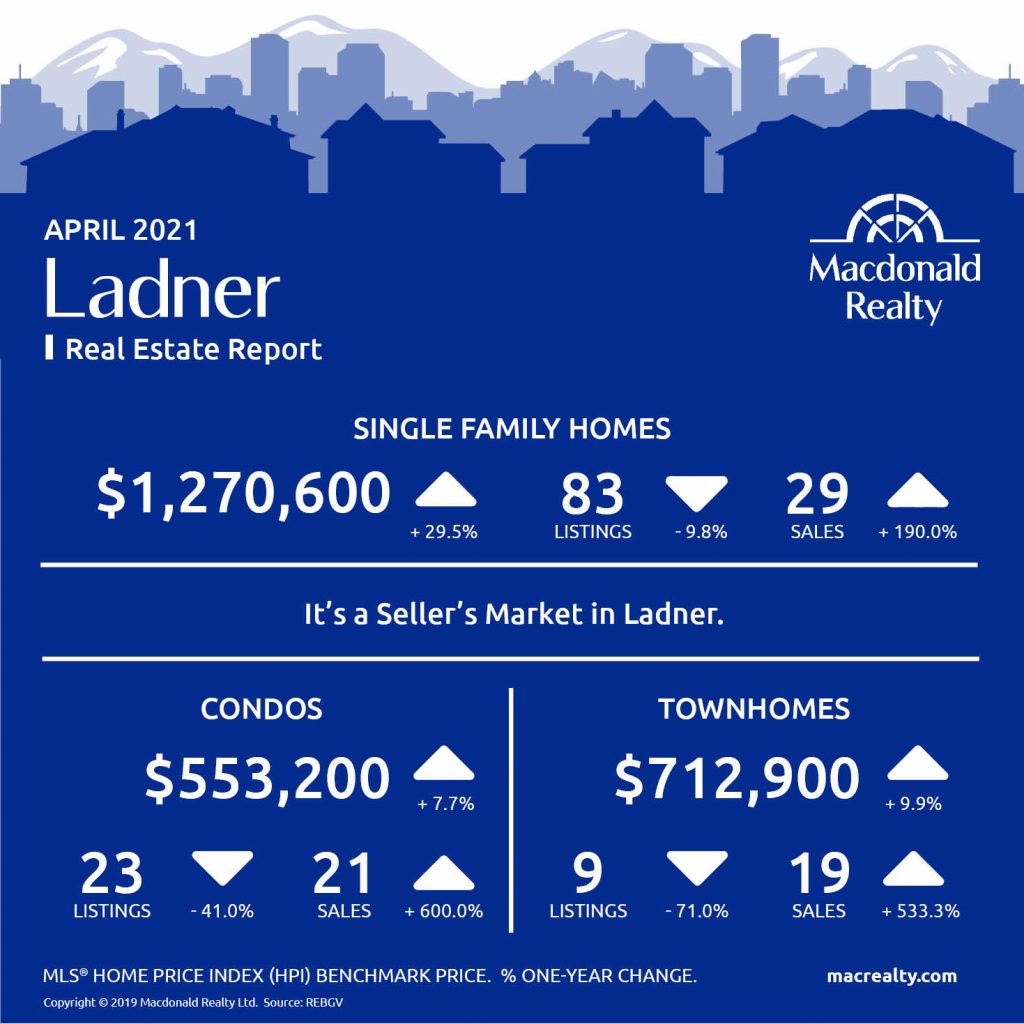
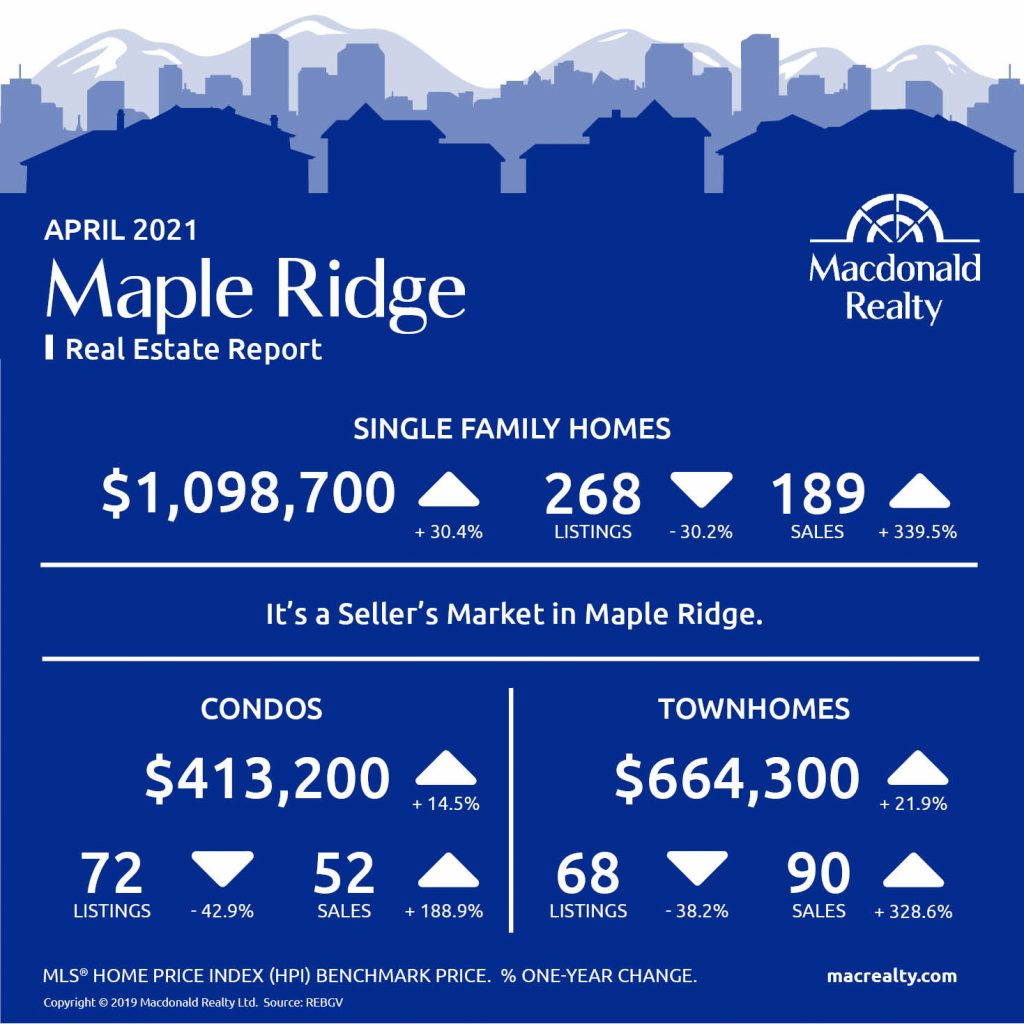
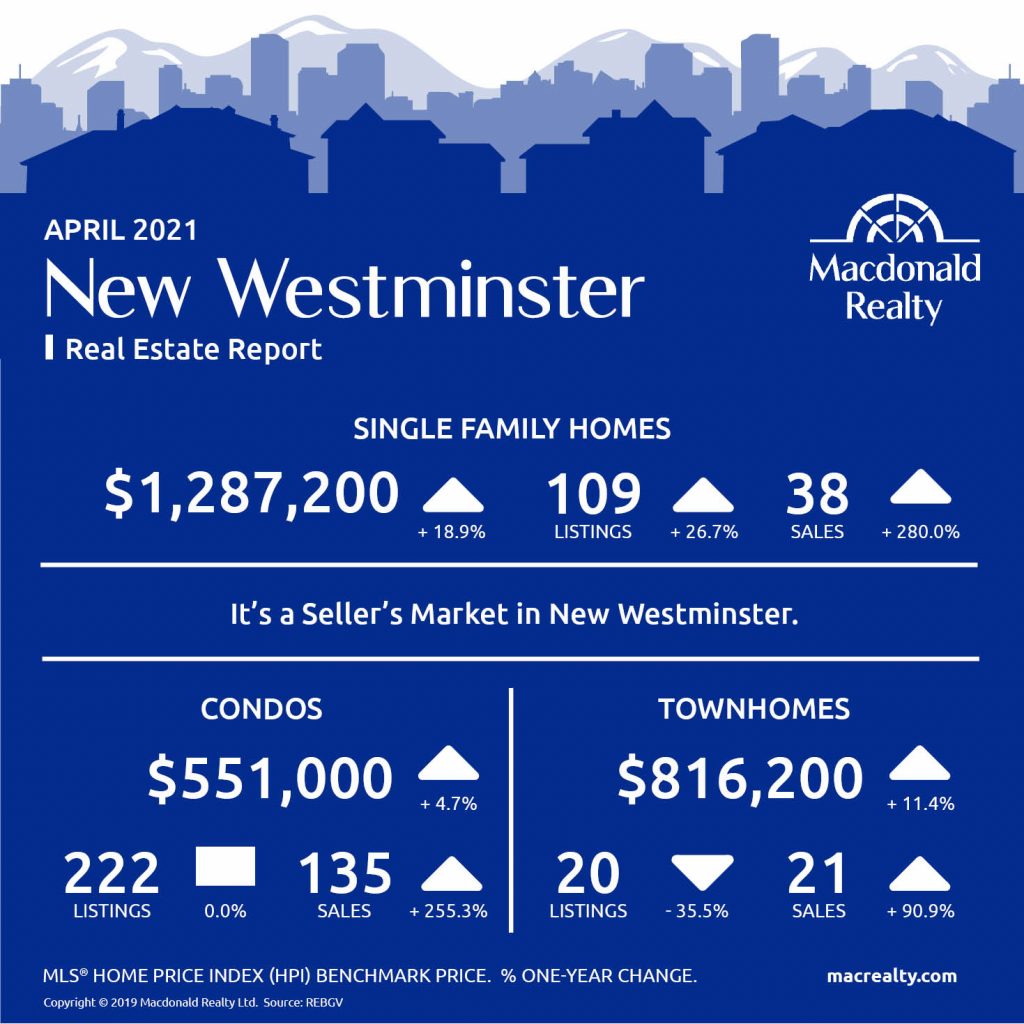
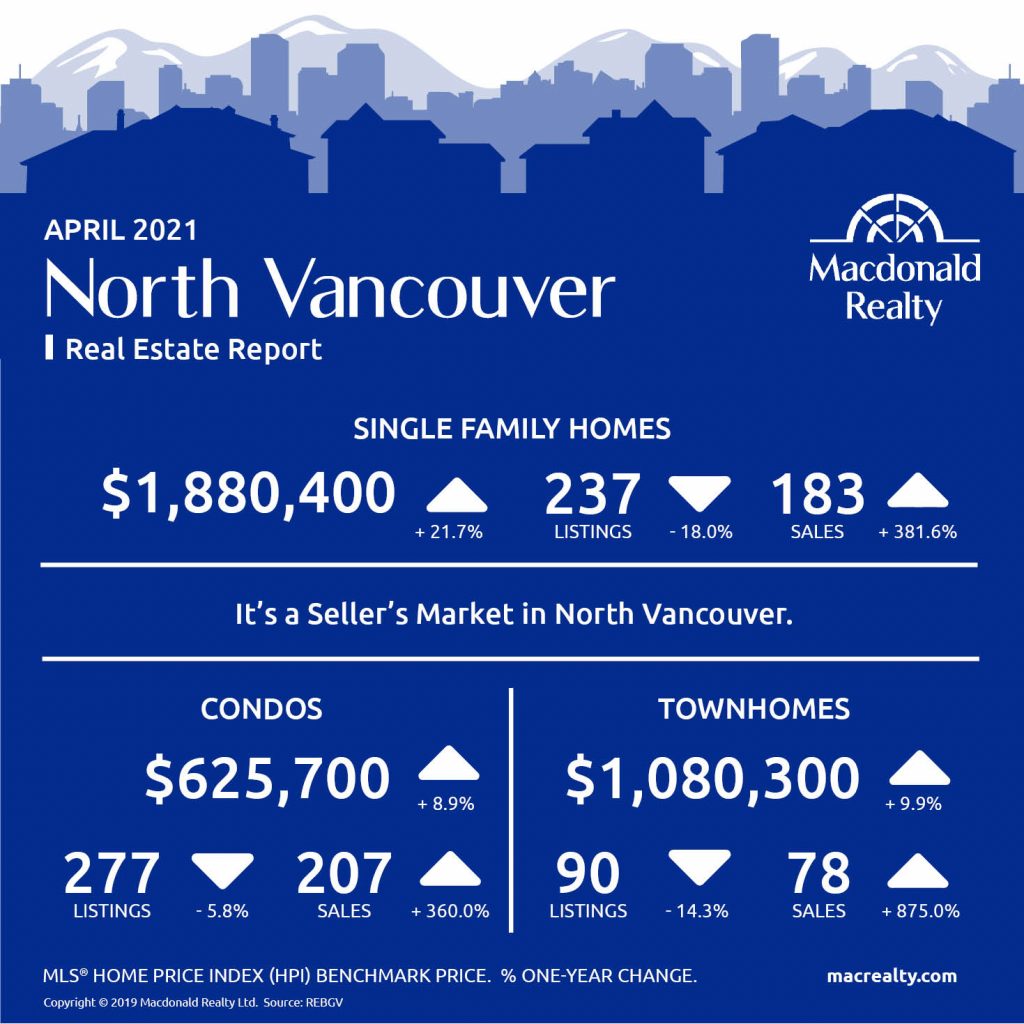
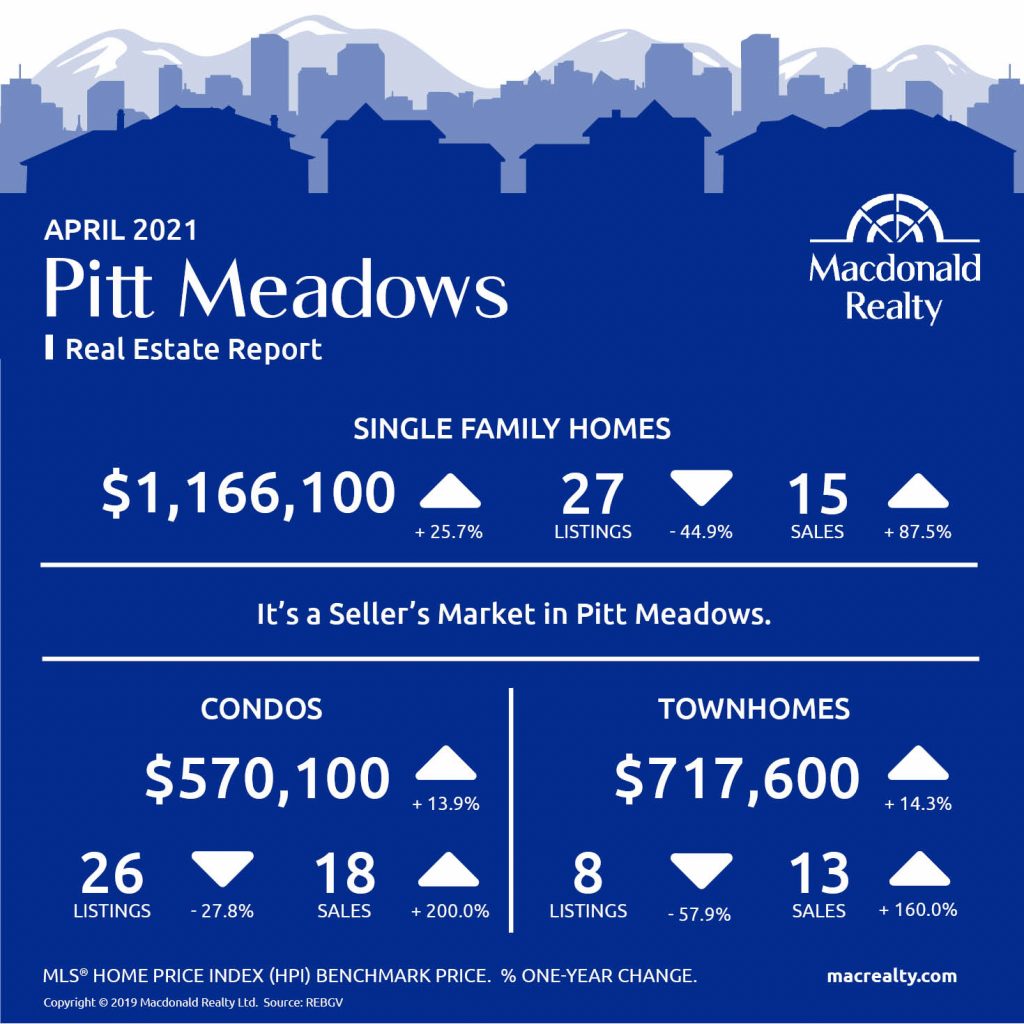
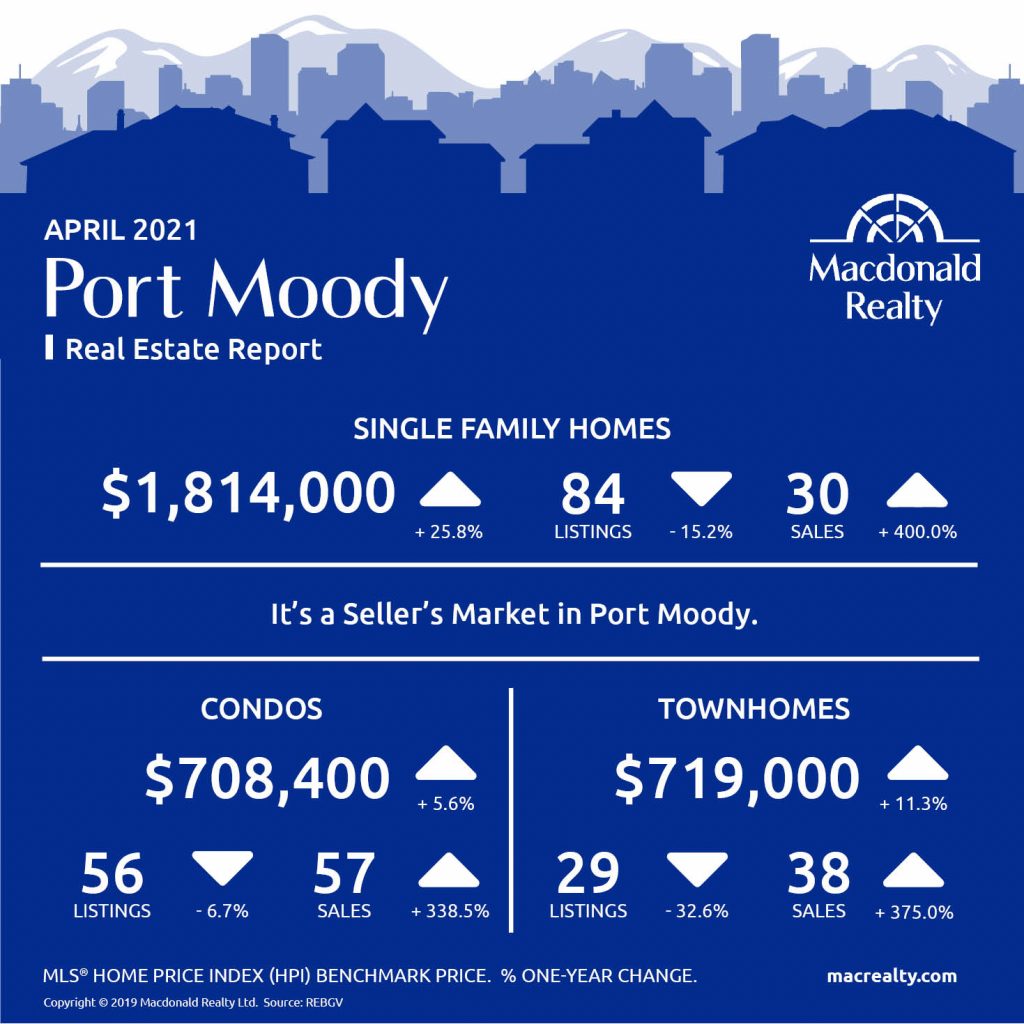
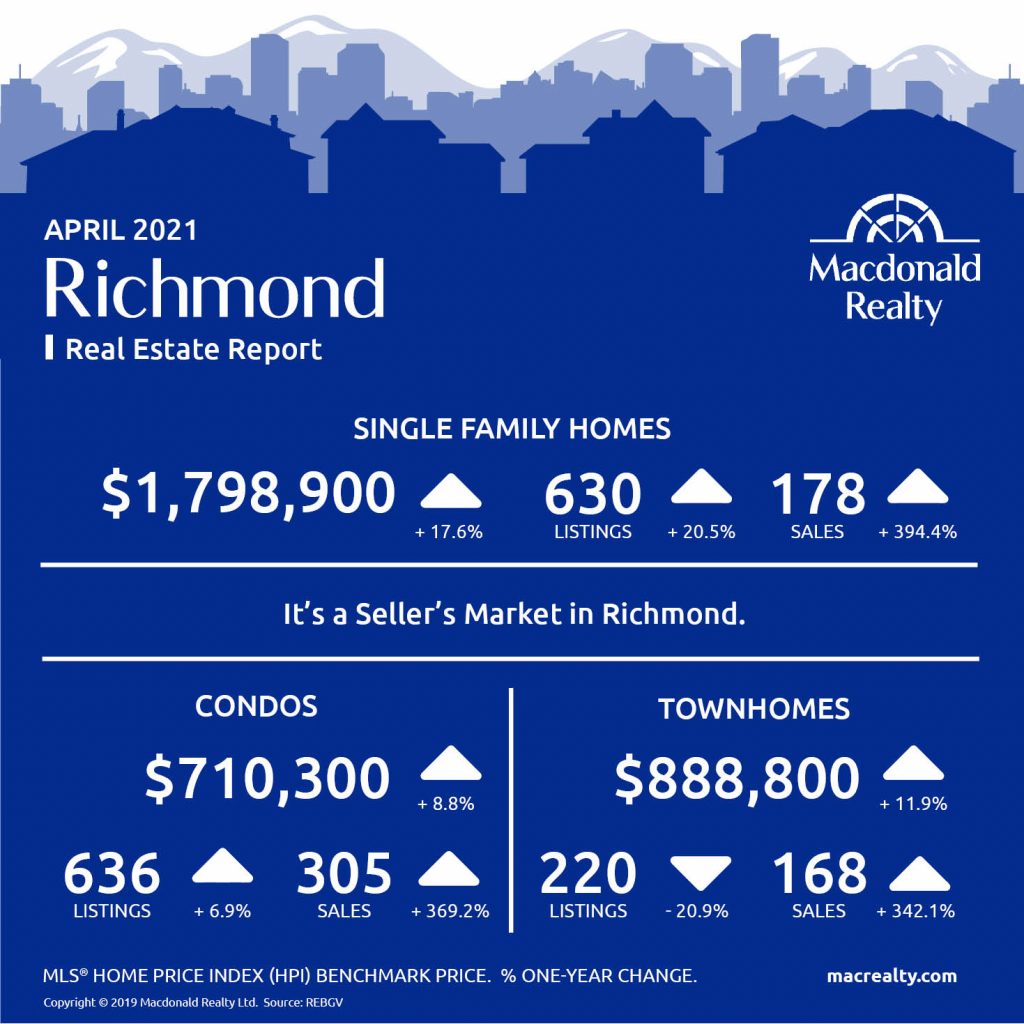
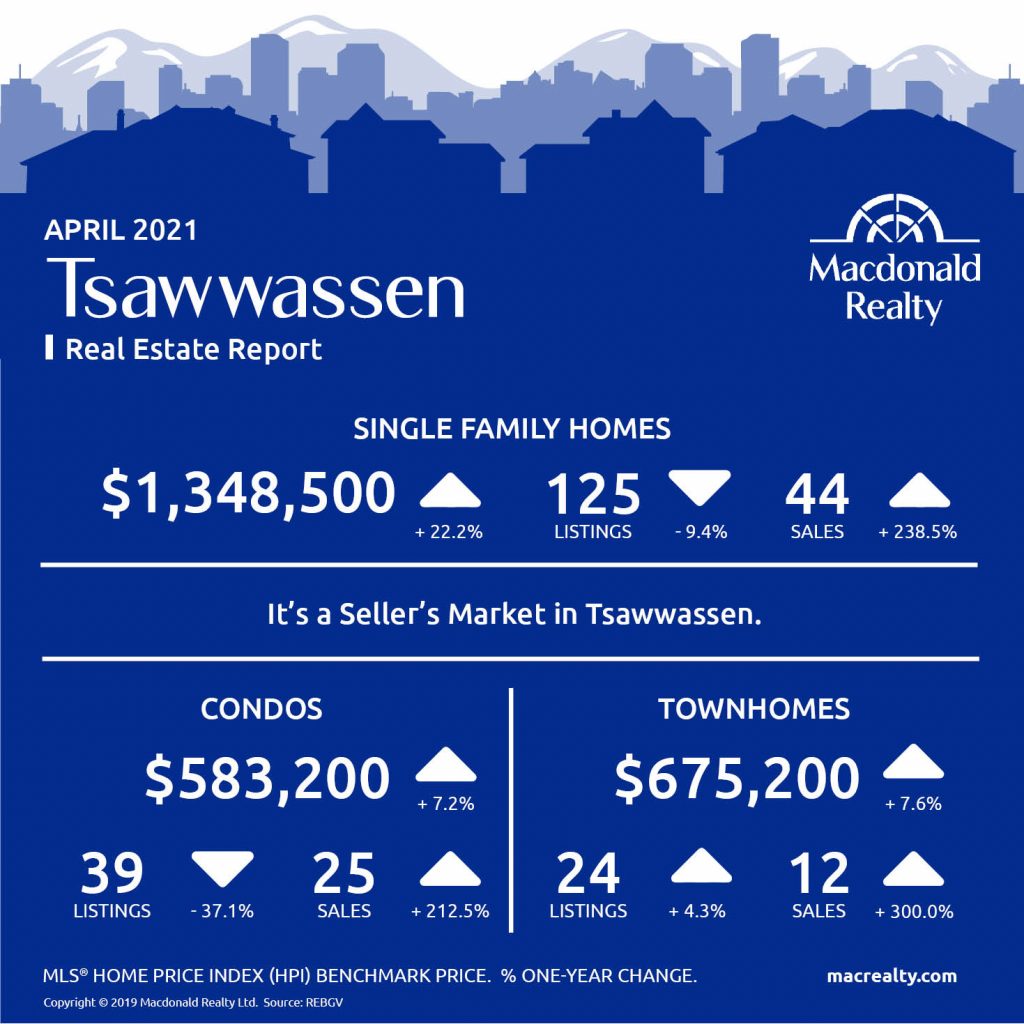
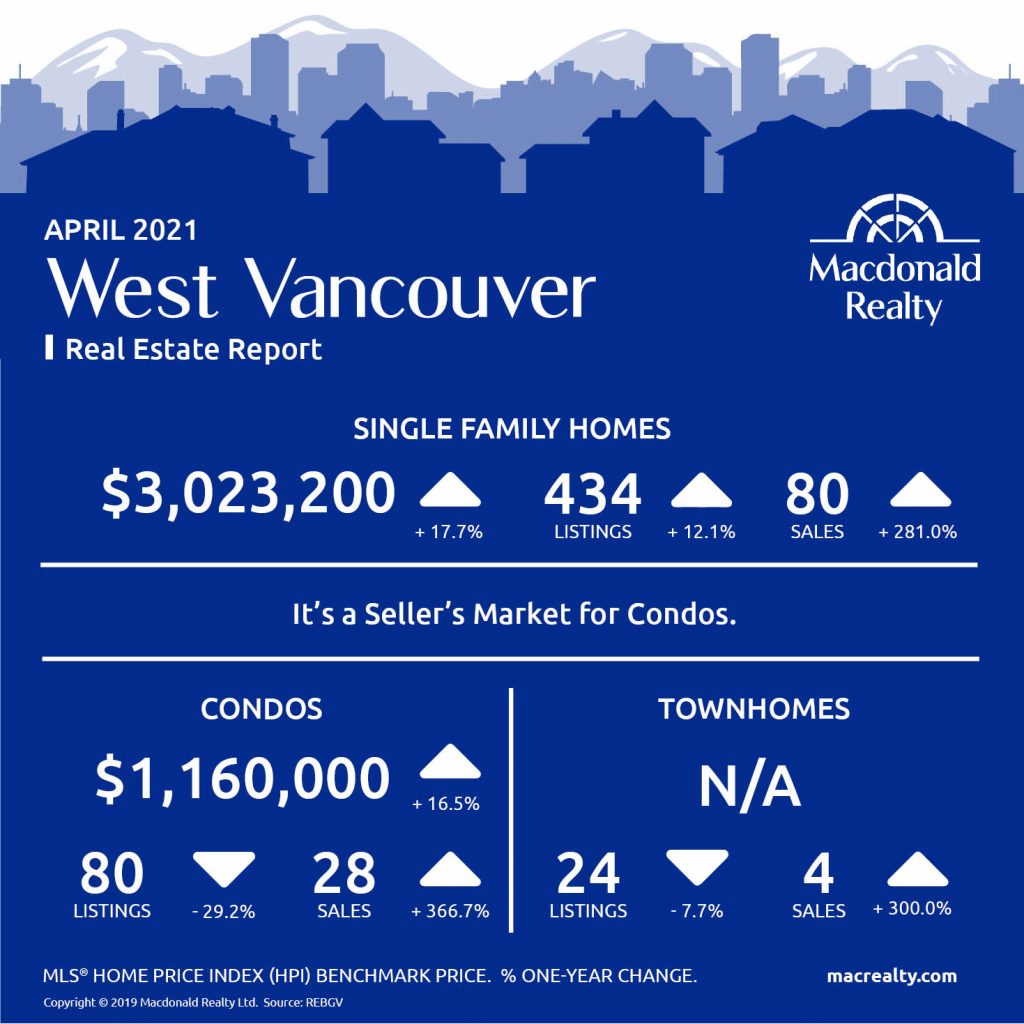
Here are the latest real estate market statistics from Macdonald Realty on the Greater Vancouver listings and sales in April 2021.
Find all the infographics by visiting the Facebook Album.
According to The Real Estate Board of Greater Vancouver (REBGV) “home sellers have become increasingly active in Metro Vancouver’s* housing market this spring in response to heightened demand and rising home values that have materialized during the pandemic.
The Board reports that residential home sales in the region totalled 4,908 in April 2021, a 342.6% increase from the 1,109 sales recorded in April 2020, and a 14% decrease from the 5,708 homes sold in March 2021.
“Last month’s sales were 56.2% above the 10-year April sales average and are the highest total on record for the month.” – said the REBGV.
“Our housing market has changed considerably from one year ago when COVID-19 concerns brought activity to a near standstill,” Keith Stewart, REBGV’s economist said. “This was followed by a well-documented spike in home buyer demand across the region. So far this spring, we’ve seen a corresponding supply response from home sellers.”
Bowen Island

Burnaby East

Burnaby North
Burnaby South

Ladner
Maple Ridge
New Westminster
North Vancouver
Pitt Meadows
Coquitlam

Port Coquitlam

Port Moody
Richmond
Tsawwassen
Vancouver East

Vancouver West

West Vancouver
Looking for more information about the real estate market in specific neighbourhoods in the Greater Vancouver?
Macdonald Realty has offices across the Greater Vancouver. Please email [email protected] or call 1-877-278-3888 to be matched with a REALTOR® working in your area.
MLS® Home Price Index (HPI) Benchmark Price
Average and median home prices are often misinterpreted, are affected by change in the mix of homes sold, and can swing dramatically from month to month (based on the types and prices of properties that sold in a given month). The MLS® HPI overcomes these shortcomings and uses the concept of a benchmark home, a notional home with common attributes of typical homes in a defined area. Visit www.housepriceindex.ca for more information.
This blog post is based on market data provided by the Real Estate Board of Greater Vancouver (REBGV) www.rebgv.org
by Macrealty Marketing Team | Apr 7, 2021 | Market Updates
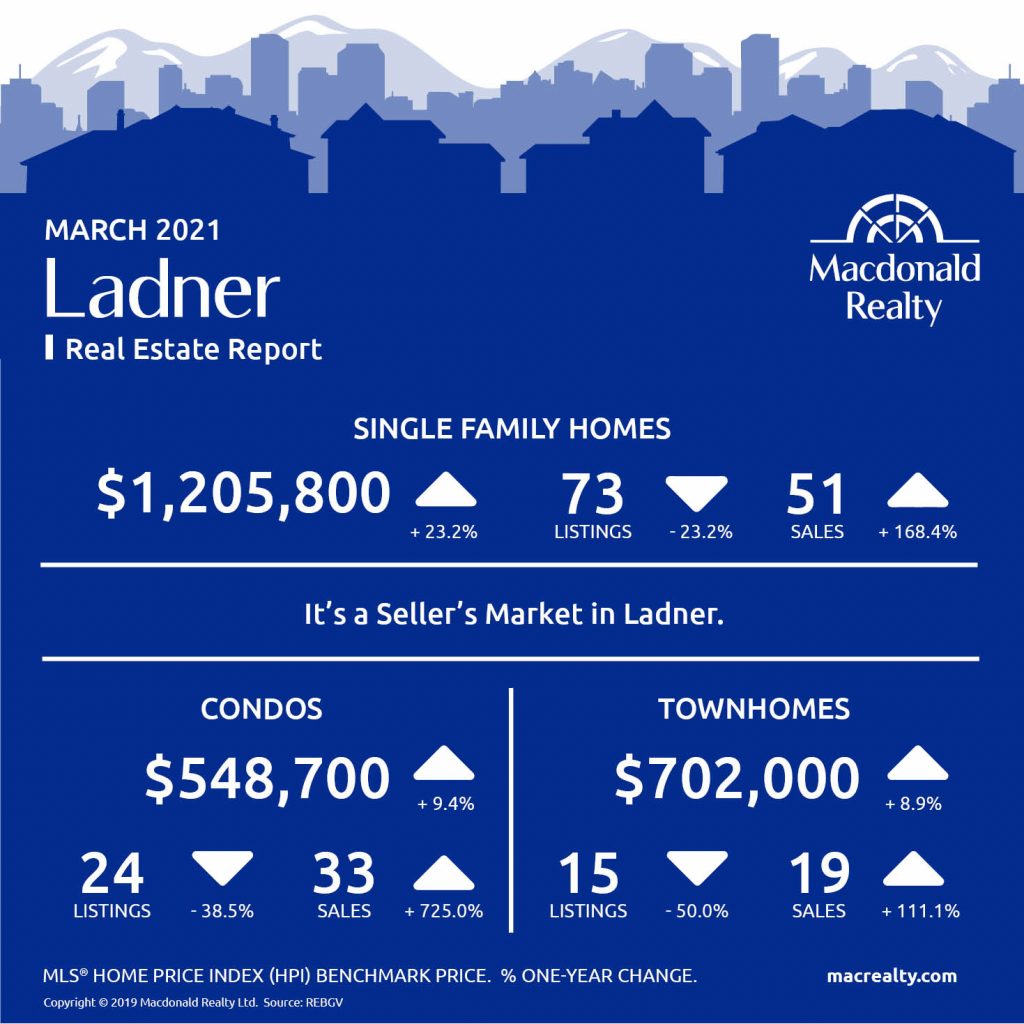
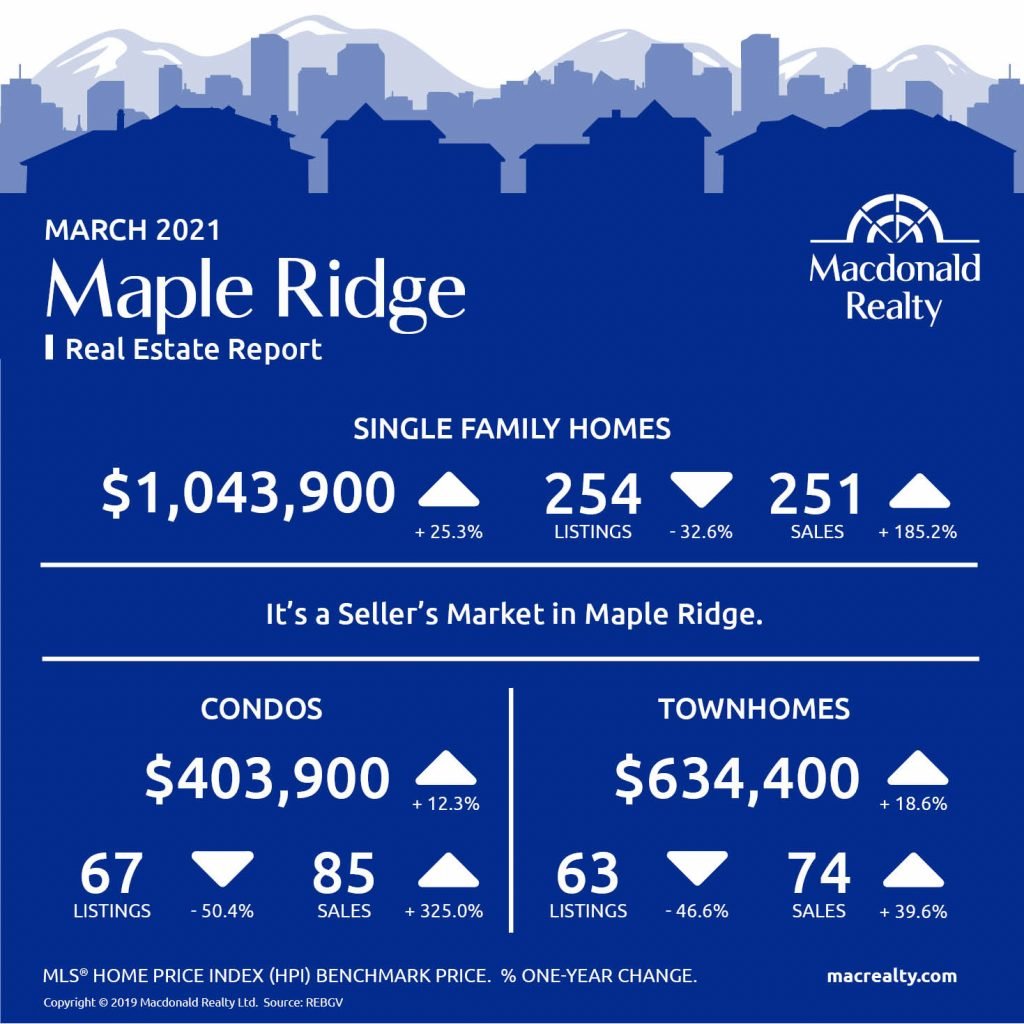
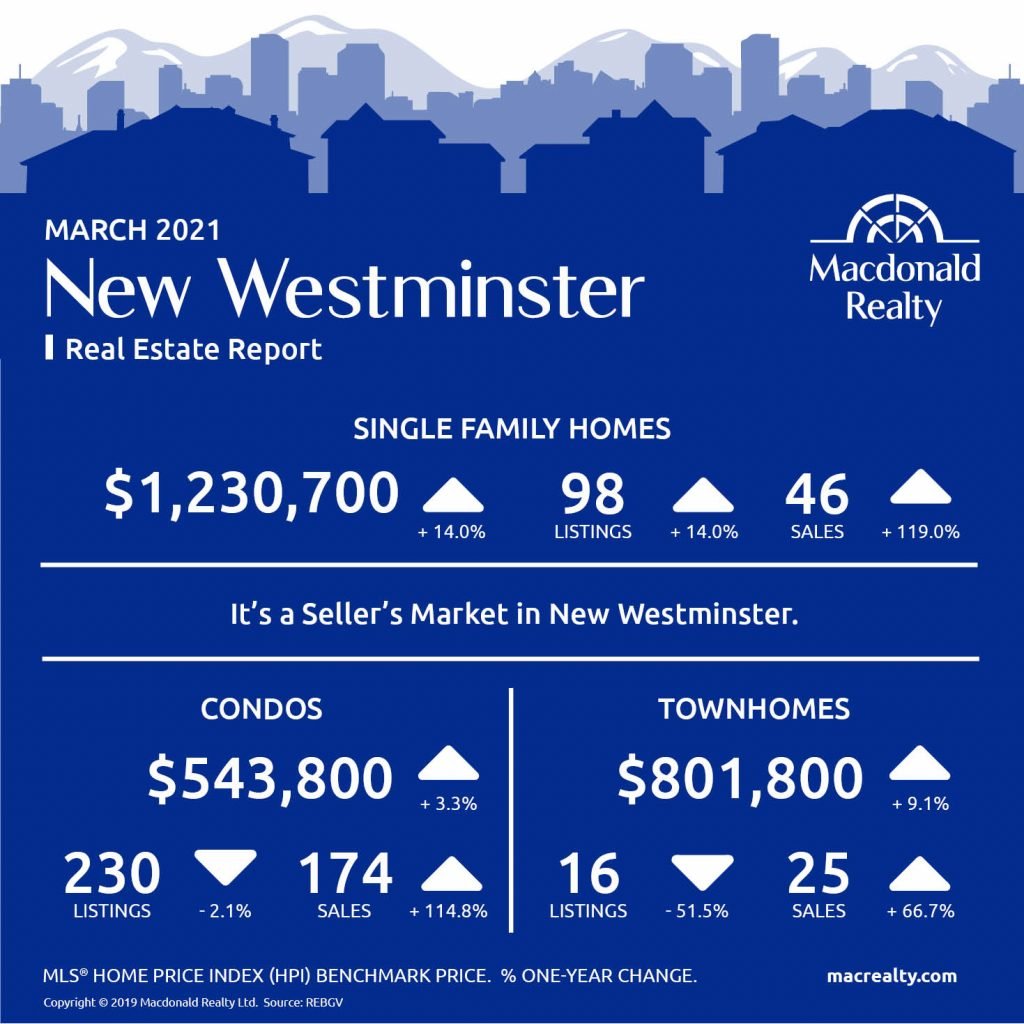
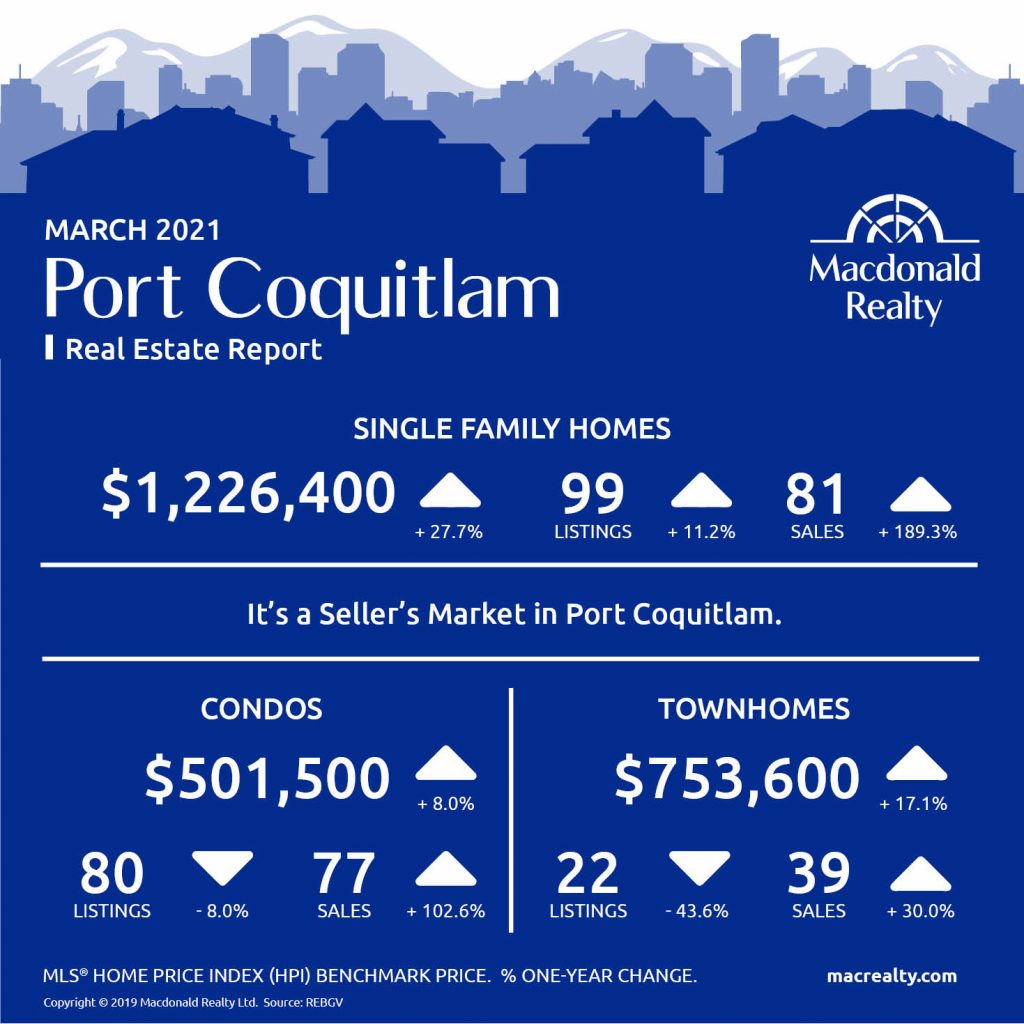
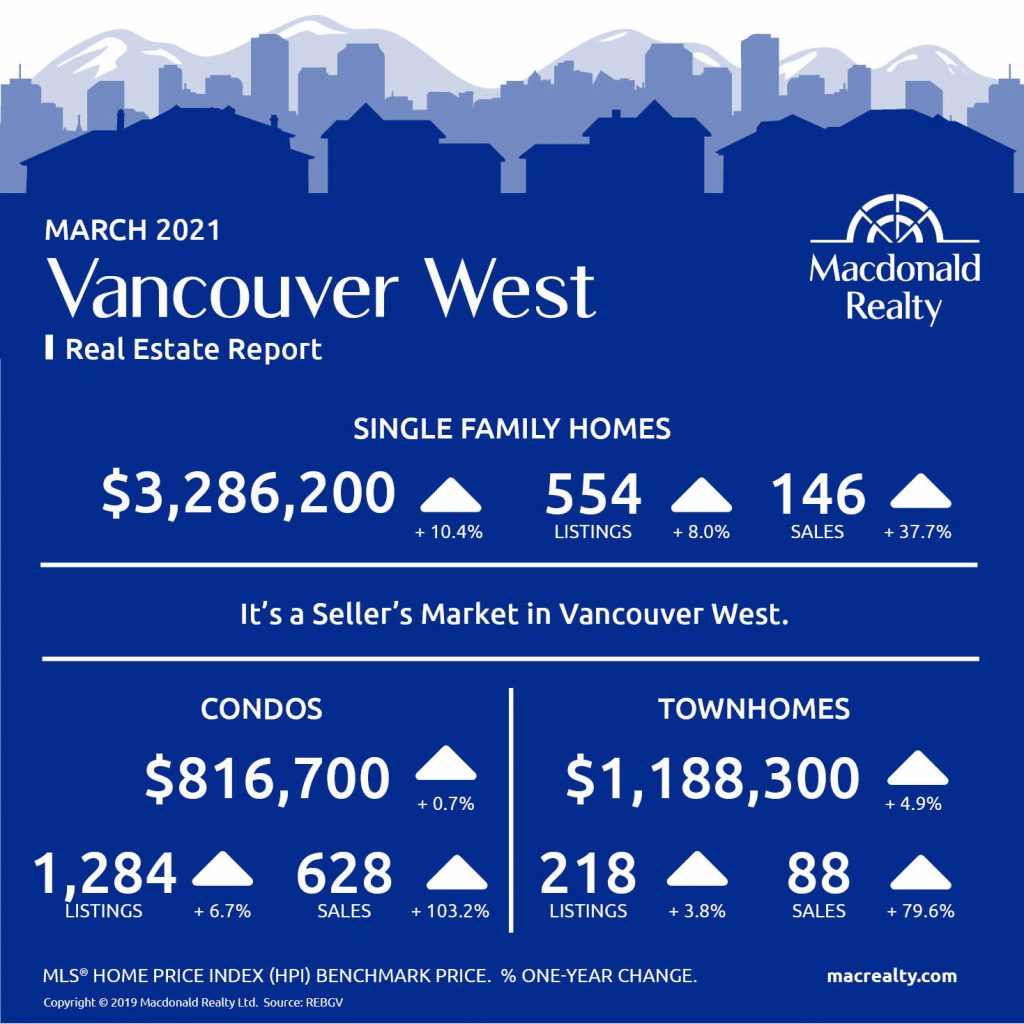
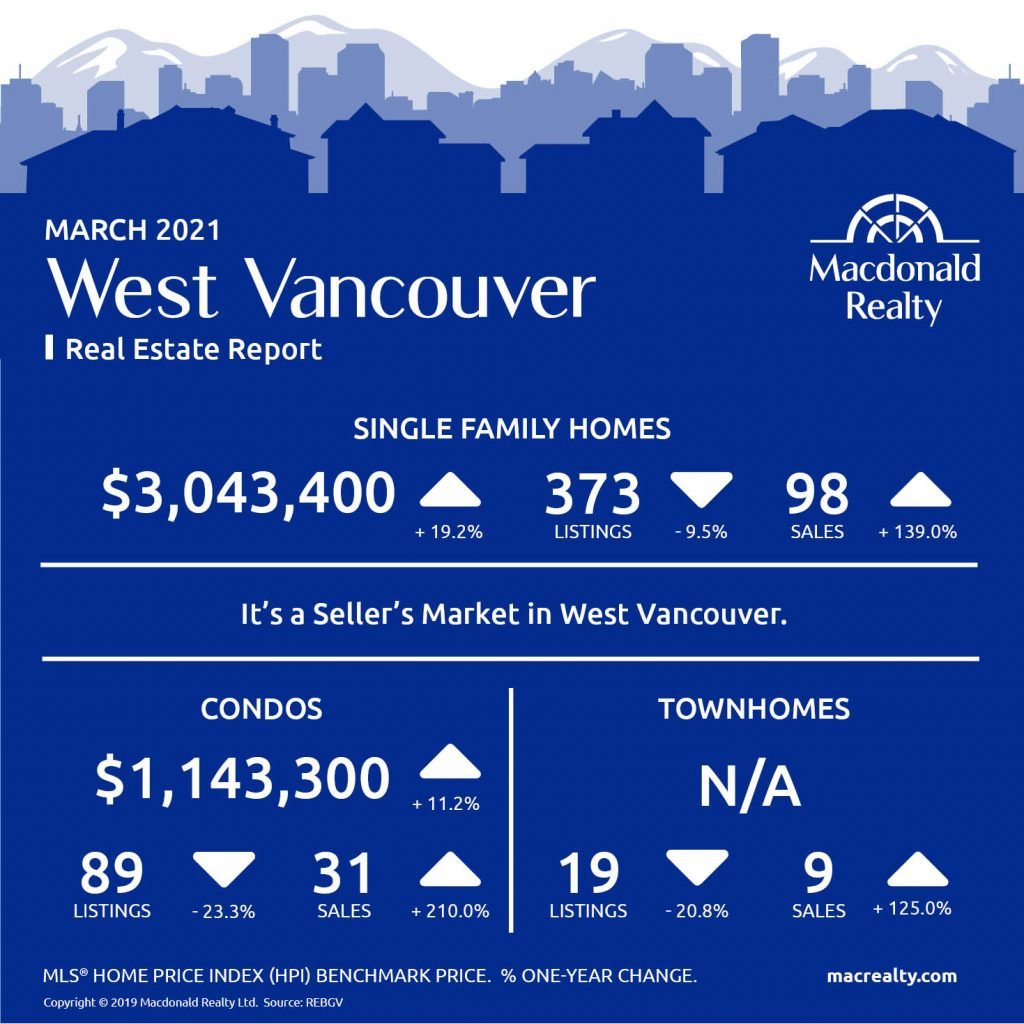
Here are the latest real estate market statistics from Macdonald Realty on the Greater Vancouver listings and sales in March 2021.
Find all the infographics by visiting the Facebook Album.
The Real Estate Board of Greater Vancouver (REBGV) reports that residential home sales in the region totalled 5,708 in March 2021, a 126.1 per cent increase from the 2,524 sales recorded in March 2020, and a 53.2 per cent increase from the 3,727 homes sold in February 2021.
Last month’s sales were 72.2 per cent above the 10-year March sales average and is the highest monthly sales total ever recorded in the region.
“In March, residents bought and listed homes across our region at levels not seen before,” Taylor Biggar, REBGV Chair said. “This surge in activity is increasing upward pressure on prices. We’re beginning to see double-digit price gains for single-family homes and townhomes over the last 12 months.”
As released by the Board “The total number of homes currently listed for sale on the MLS® system in Metro Vancouver is 9,145, a 4.8 per cent decrease compared to March 2020 (9,606) and a 9.4 per cent increase compared to February 2021 (8,358). This is 18.6 per cent below the 10-year March total listings average.
“While we did see a record number of listings enter the market last month, the demand in today’s market isn’t allowing that new supply to accumulate. As a result, the overall inventory of homes for sale decreased compared to last year,” said Biggar.
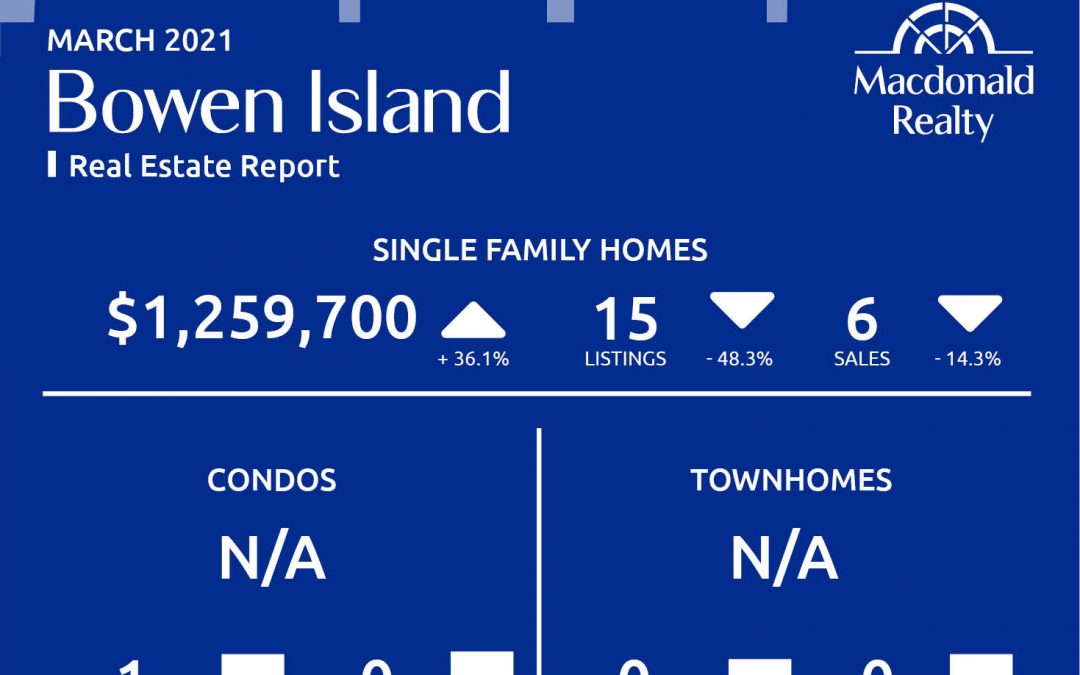
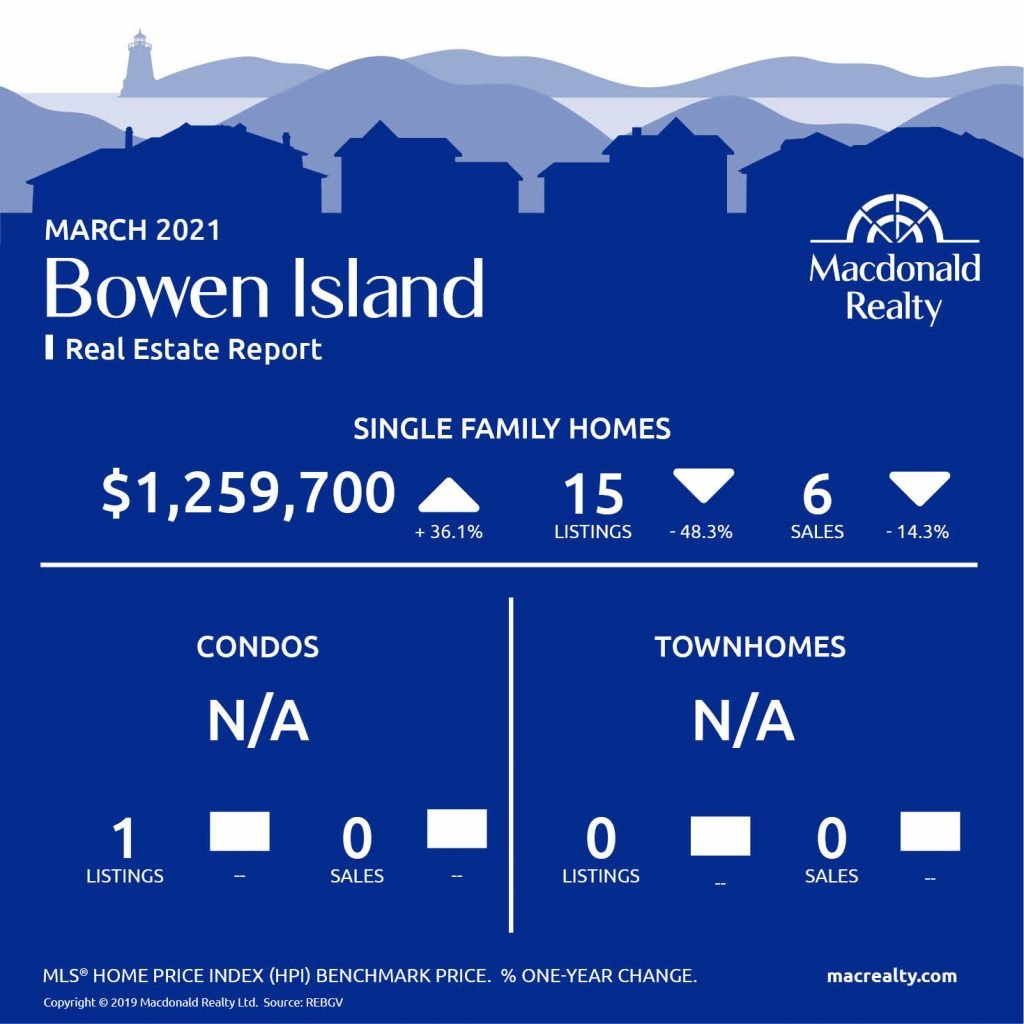
Bowen Island
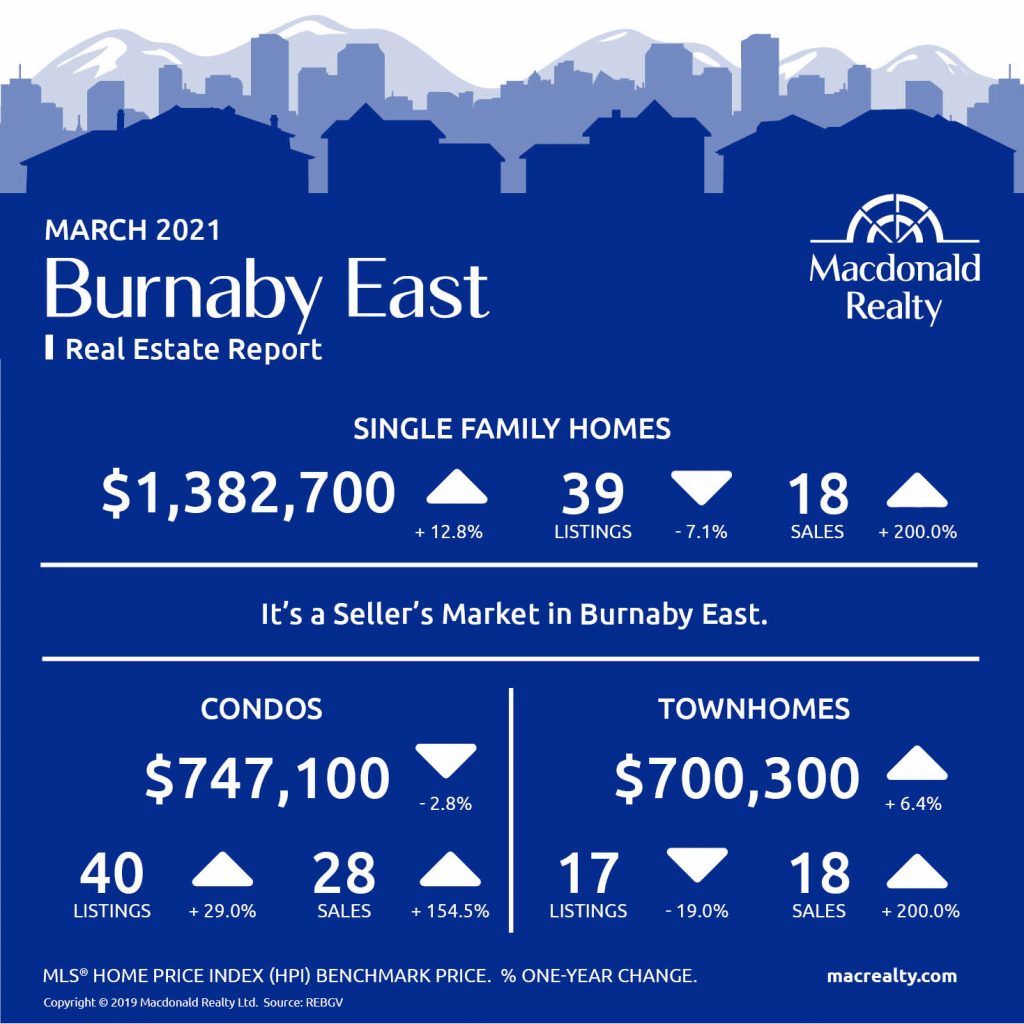
Burnaby East
Burnaby North

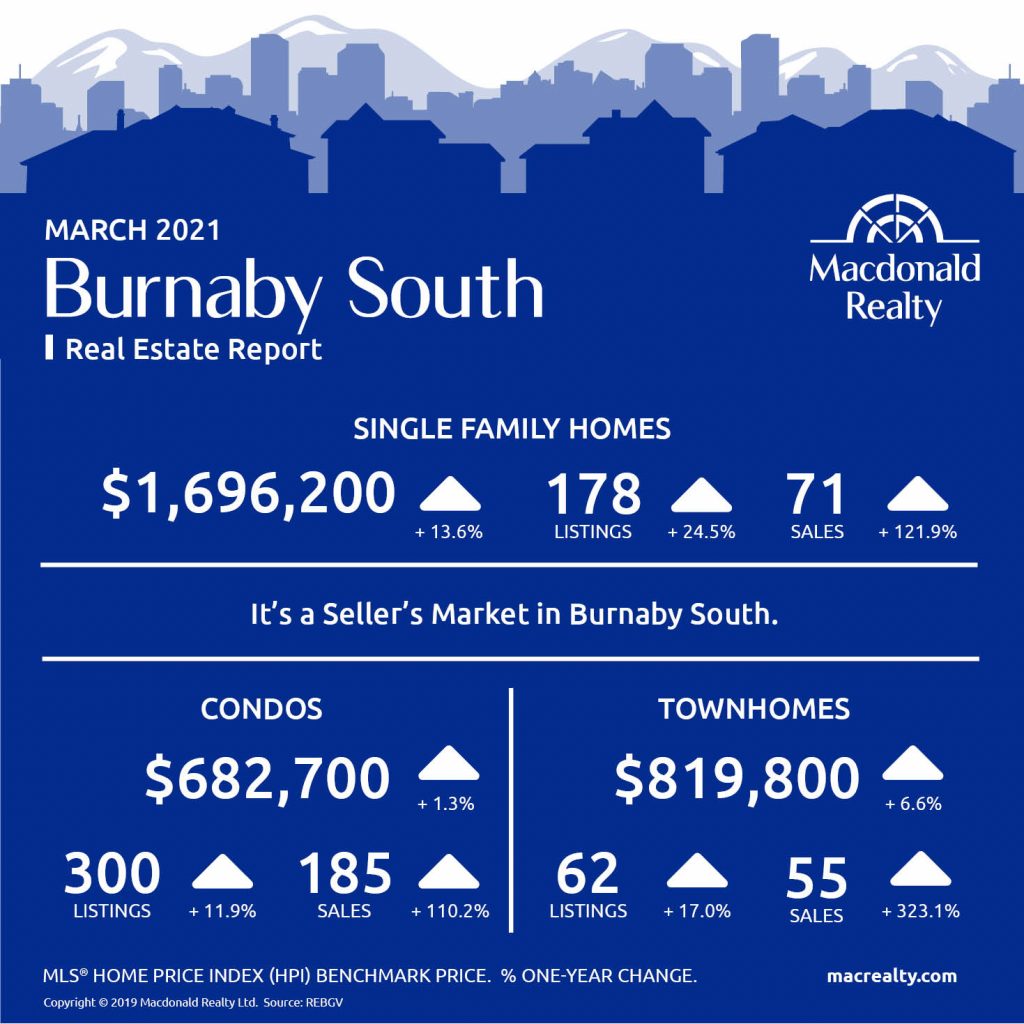
Burnaby South
Ladner

Maple Ridge
New Westminster
North Vancouver
Pitt Meadows

Coquitlam

Port Coquitlam
Port Moody

Richmond

Tsawwassen

Vancouver East

Vancouver West
West Vancouver
Looking for more information about the real estate market in specific neighbourhoods in the Greater Vancouver?
Macdonald Realty has offices across the Greater Vancouver. Please email [email protected] or call 1-877-278-3888 to be matched with a REALTOR® working in your area.
MLS® Home Price Index (HPI) Benchmark Price
Average and median home prices are often misinterpreted, are affected by change in the mix of homes sold, and can swing dramatically from month to month (based on the types and prices of properties that sold in a given month). The MLS® HPI overcomes these shortcomings and uses the concept of a benchmark home, a notional home with common attributes of typical homes in a defined area. Visit www.housepriceindex.ca for more information.
This blog post is based on market data provided by the Real Estate Board of Greater Vancouver (REBGV) www.rebgv.org
by Macrealty Marketing Team | Mar 5, 2021 | Market Updates
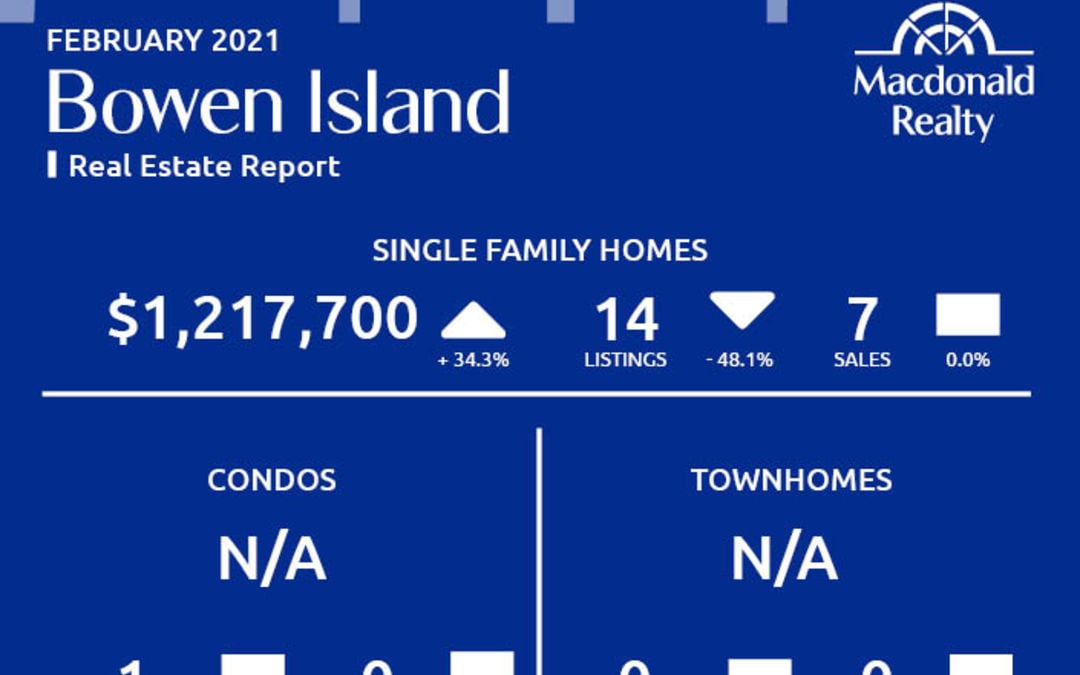
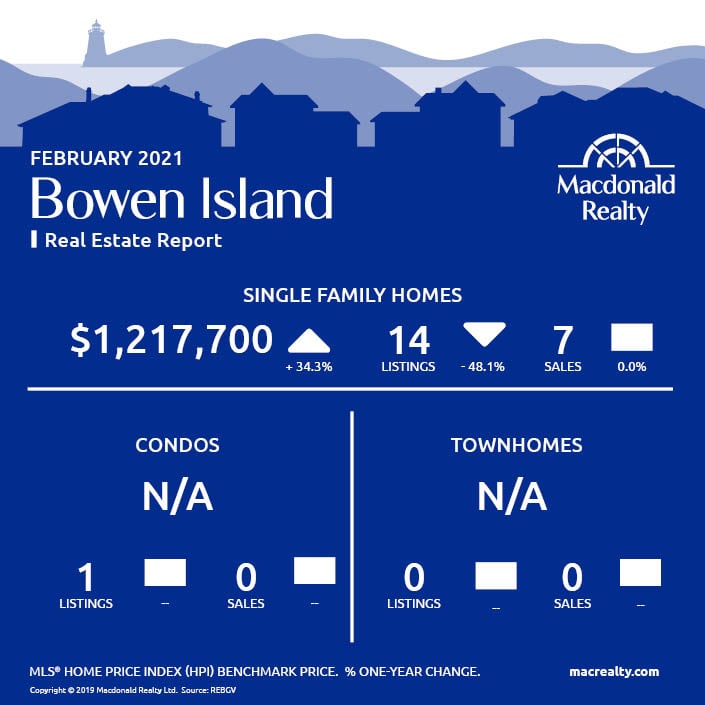
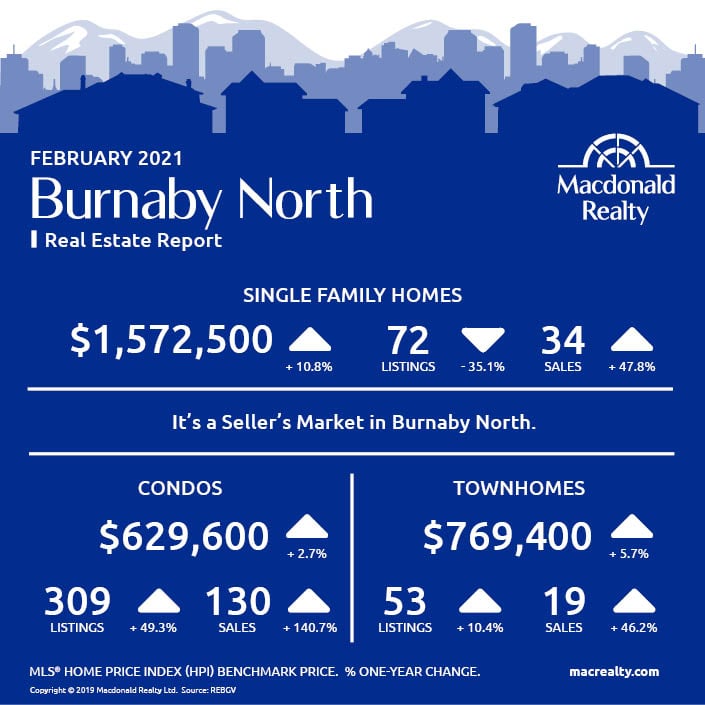
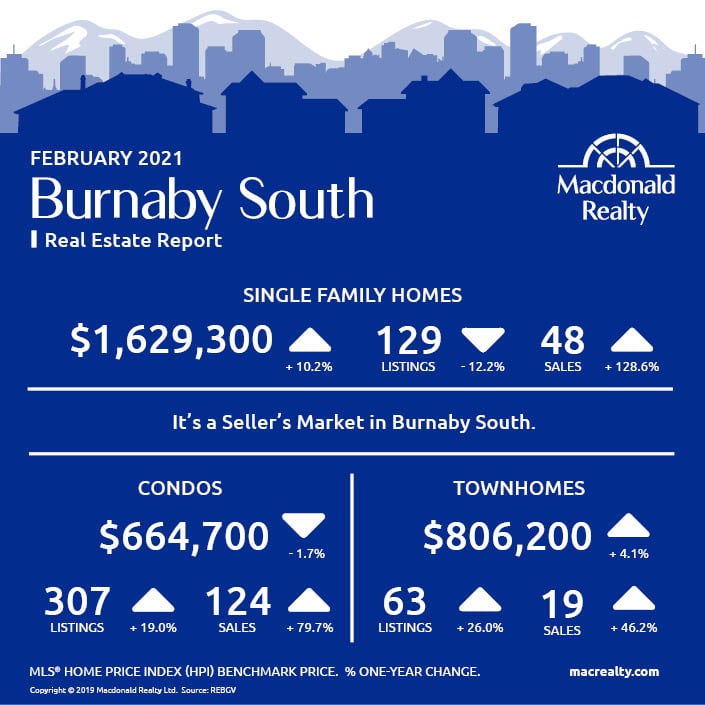
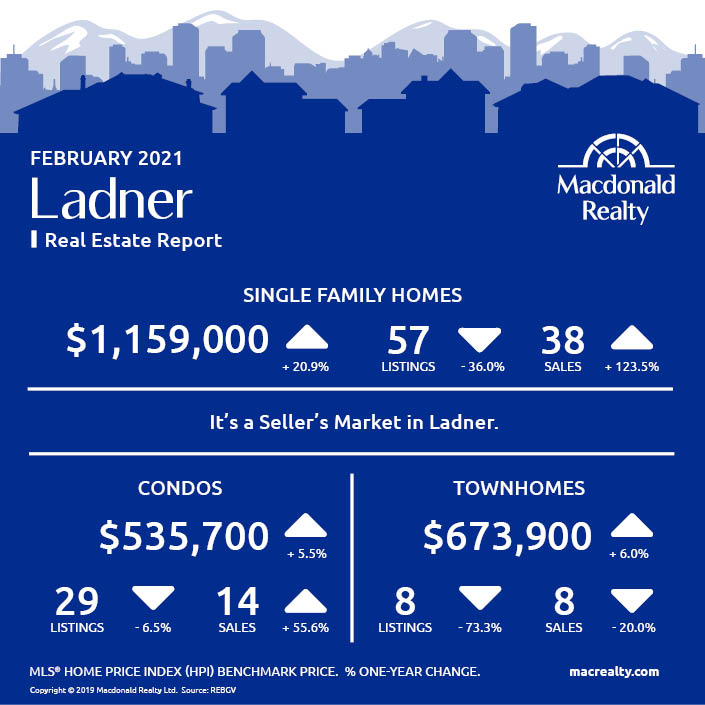
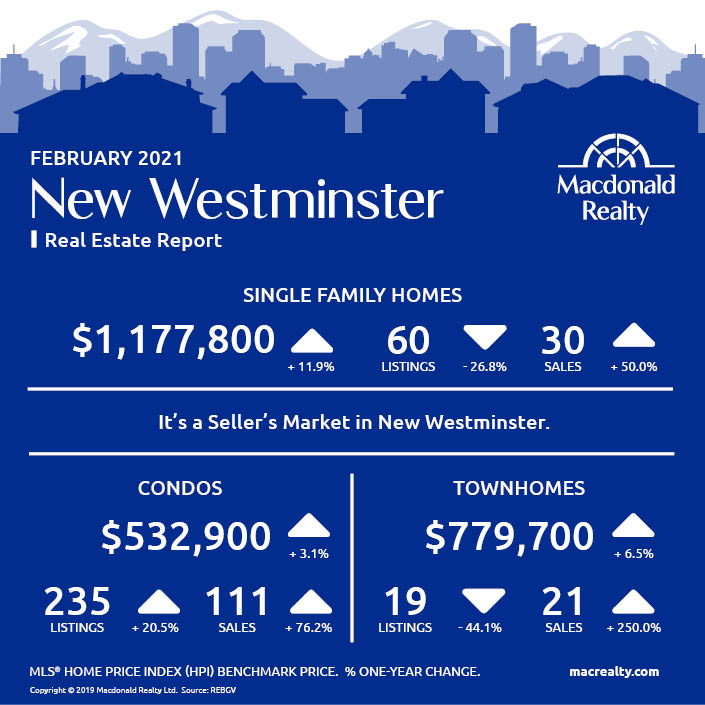
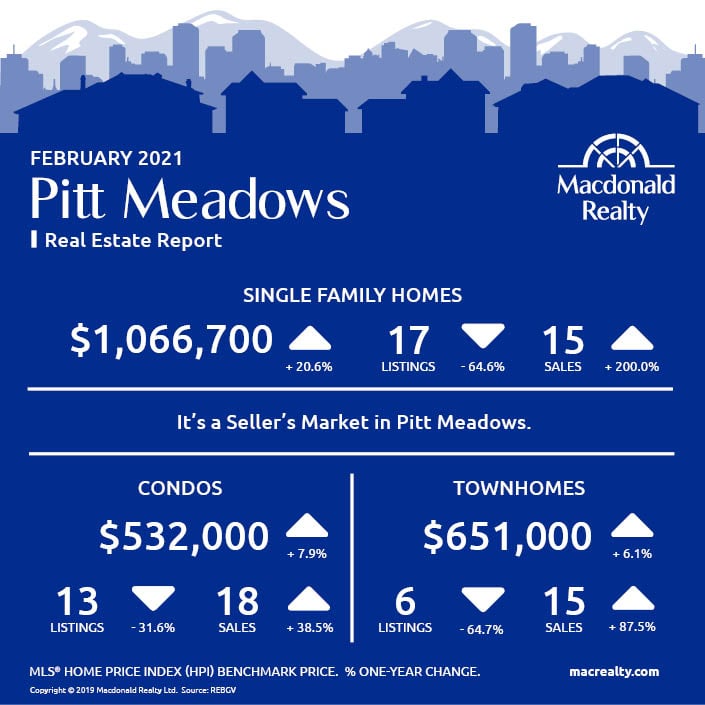
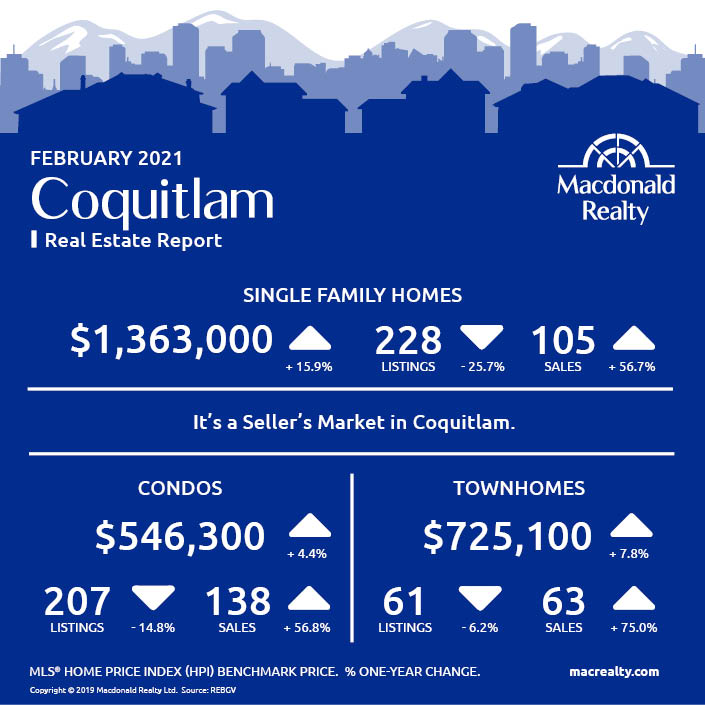
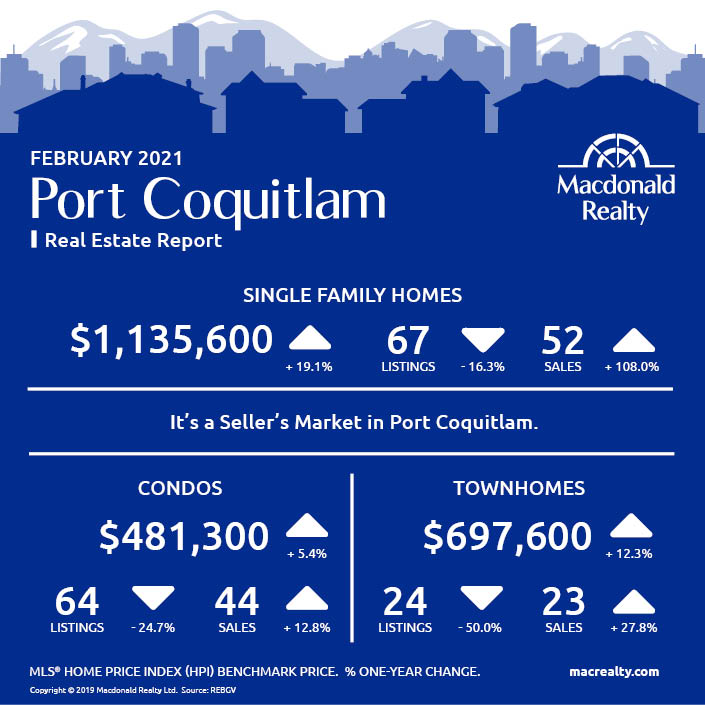
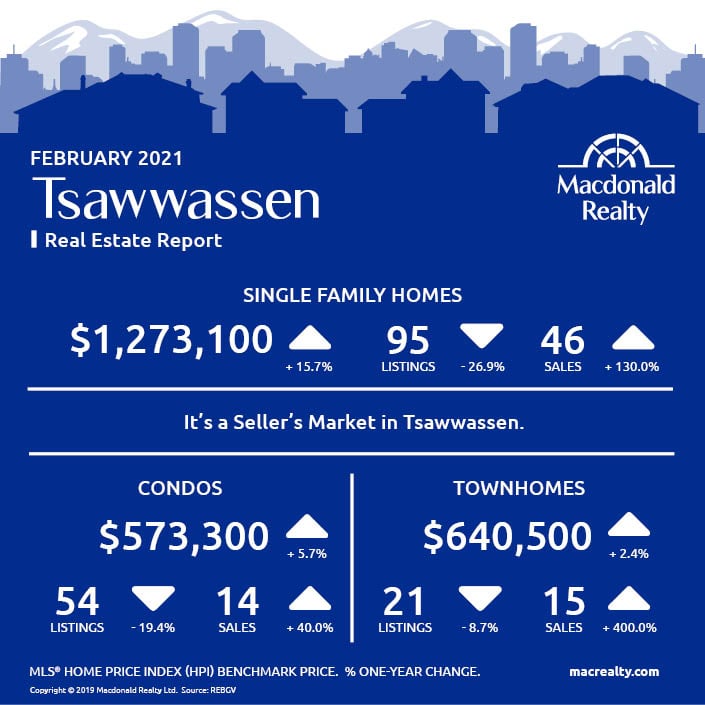
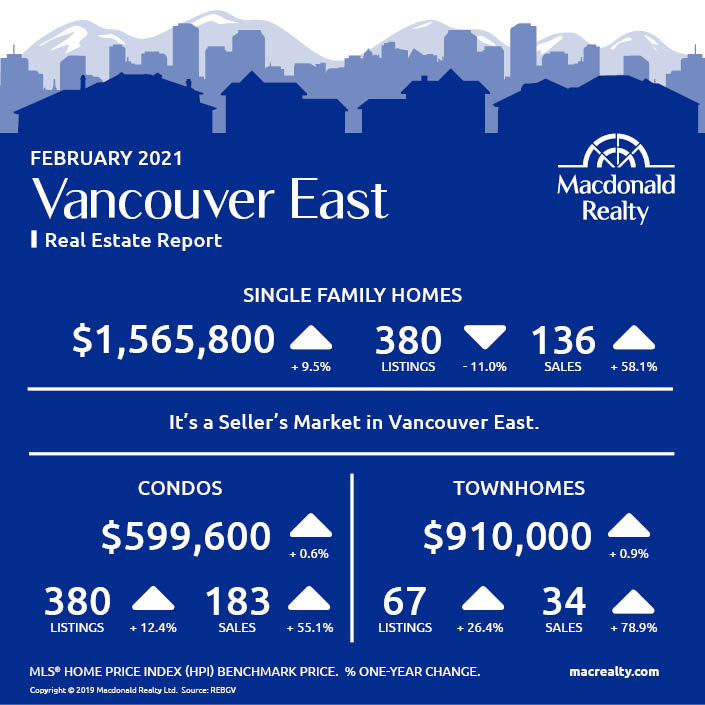
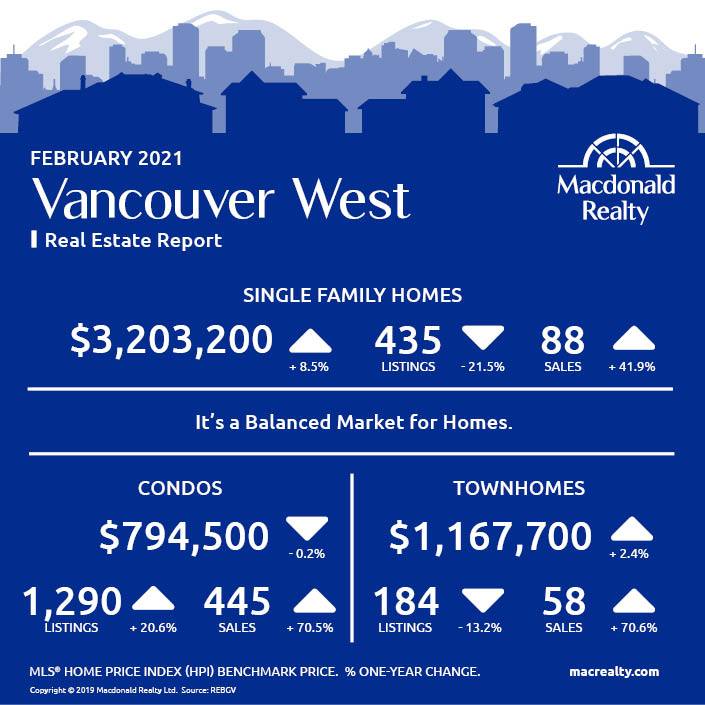
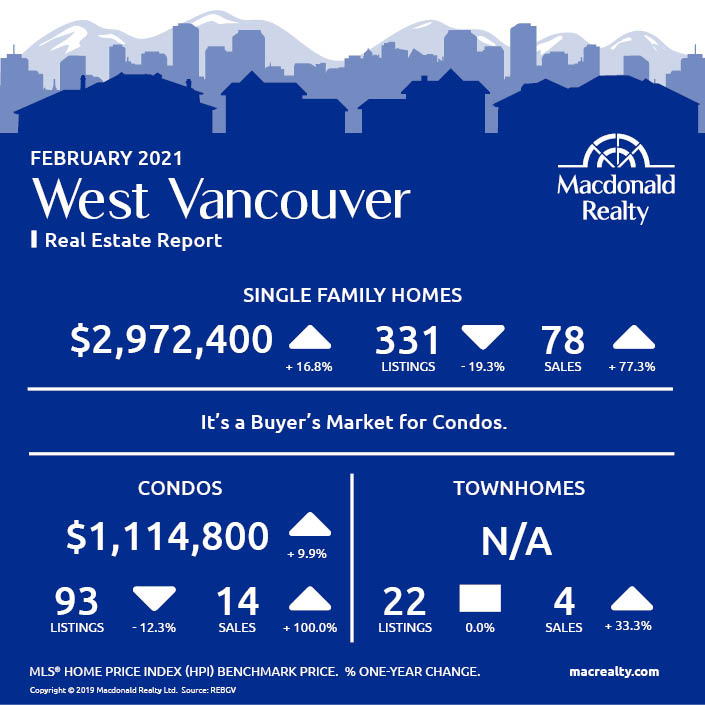
Here are the latest real estate market statistics from Macdonald Realty on the Greater Vancouver listings and sales in February 2021.
Find all the infographics by visiting the Facebook Album.
The Real Estate Board of Greater Vancouver (REBGV) reports that residential home sales in the region totalled 3,727 in February 2021, a 73.3 per cent increase from the 2,150 sales recorded in February 2020, and a 56 per cent increase from the 2,389 homes sold in January 2021.
Last month’s sales were 42.8 per cent above the 10-year February sales average.
“Metro Vancouver’s housing market is experiencing seller’s market conditions. The supply of listings for sale isn’t keeping up with the demand we’re seeing,” Colette Gerber, REBGV Chair said.
Colette also has mentioned the multiple offer situations:
“Competition amongst home buyers is causing multiple offer situations and upward pressure on prices.
Bowen Island
Burnaby East

Burnaby North
Burnaby South
Ladner
Maple Ridge

New Westminster
North Vancouver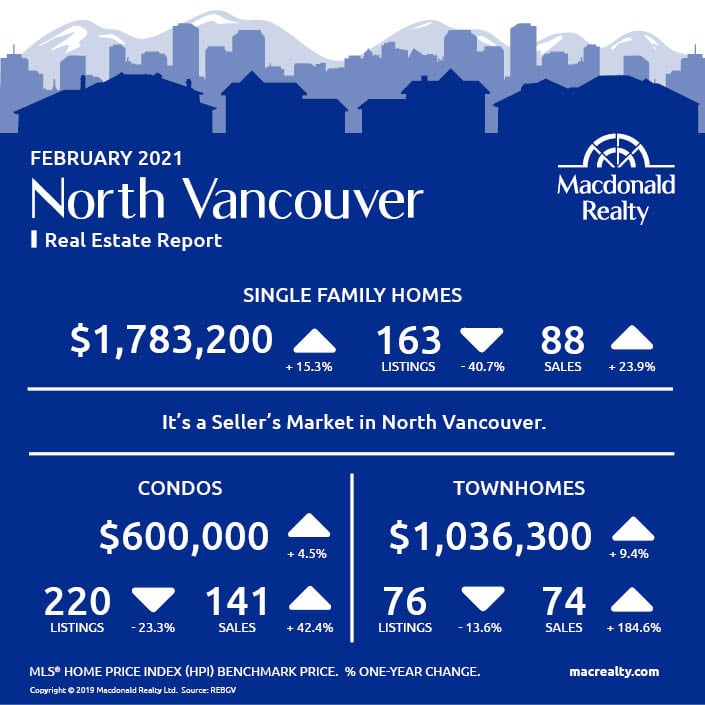
Pitt Meadows
Coquitlam
Port Coquitlam
Port Moody

Richmond

Tsawwassen
Vancouver East
Vancouver West
West Vancouver
Looking for more information about the real estate market in specific neighbourhoods in the Greater Vancouver?
Macdonald Realty has offices across the Greater Vancouver. Please email [email protected] or call 1-877-278-3888 to be matched with a REALTOR® working in your area.
MLS® Home Price Index (HPI) Benchmark Price
Average and median home prices are often misinterpreted, are affected by change in the mix of homes sold, and can swing dramatically from month to month (based on the types and prices of properties that sold in a given month). The MLS® HPI overcomes these shortcomings and uses the concept of a benchmark home, a notional home with common attributes of typical homes in a defined area. Visit www.housepriceindex.ca for more information.
This blog post is based on market data provided by the Real Estate Board of Greater Vancouver (REBGV) www.rebgv.org

