by Macrealty Marketing Team | Sep 8, 2020 | Market Updates
Here are the latest real estate market statistics from Macdonald Realty on the Greater Vancouver listings and sales in August 2020.
Find all the infographics by visiting the Facebook Album.
According to the Real Estate Board of Greater Vancouver, home buyers and sellers remained active across Metro Vancouver in August, with home sale and new listing activity outpacing the region’s historical averages.
“People who put their home buying and selling plans on hold in the spring have been returning to the market throughout the summer,” Colette Gerber, REBGV Chair said. “Like everything else in our lives these days, the uncertainty COVID-19 presents makes it challenging to predict what will happen this fall.”
Colette also has talked about the impact of low interest rates:
“Low interest rates and limited overall supply of homes for sale are creating competition in today’s housing market,” Gerber said.
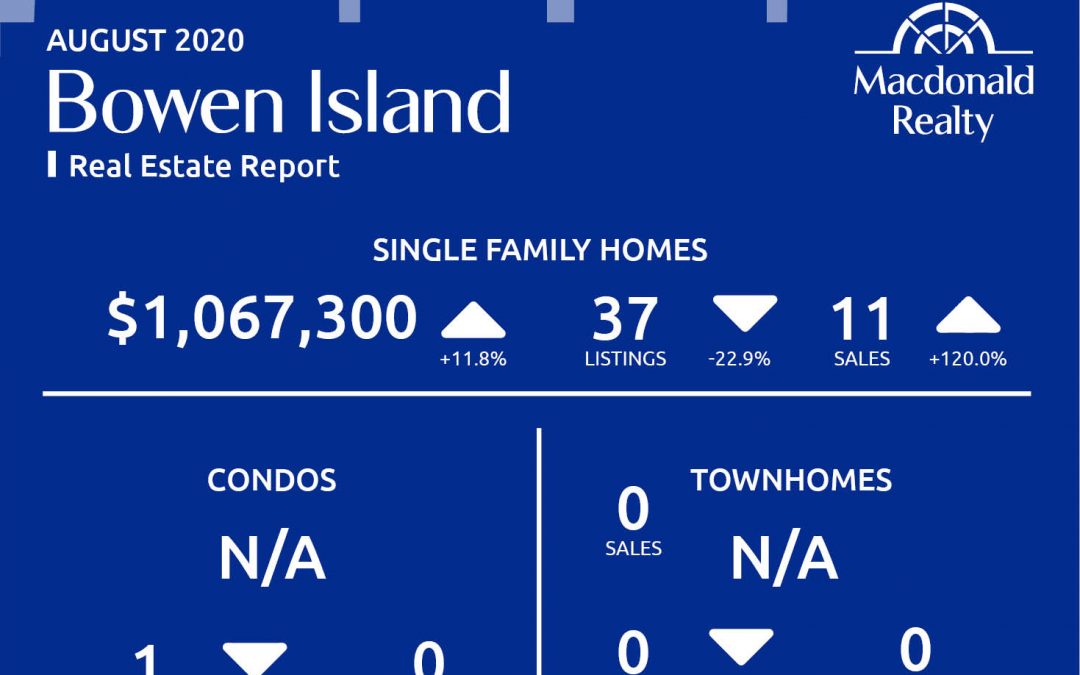
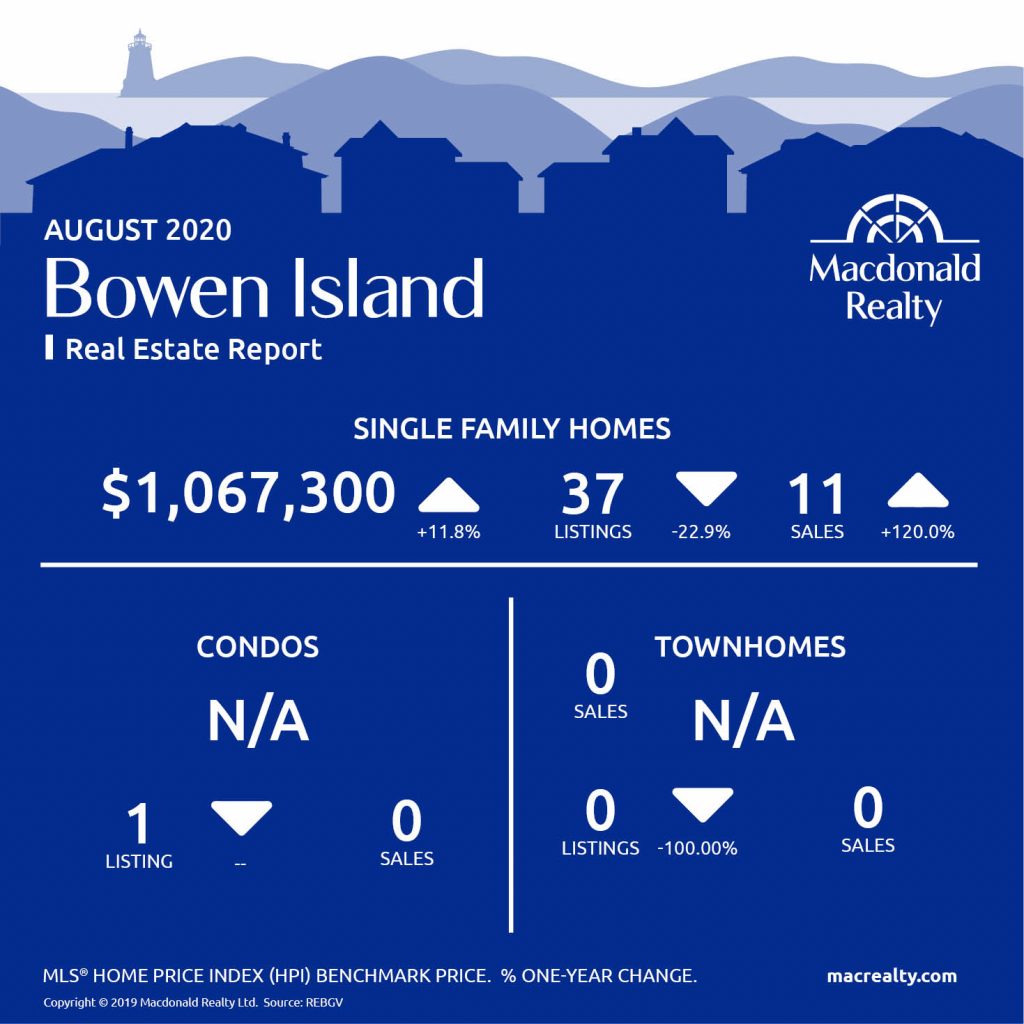
Bowen Island
In August 2020, Bowen Island had 11 sales of detached homes and 37 active listings. The benchmark sale price was $1,067,300.
While the condo market had 1 listing, there were no sales of condo or townhome market.
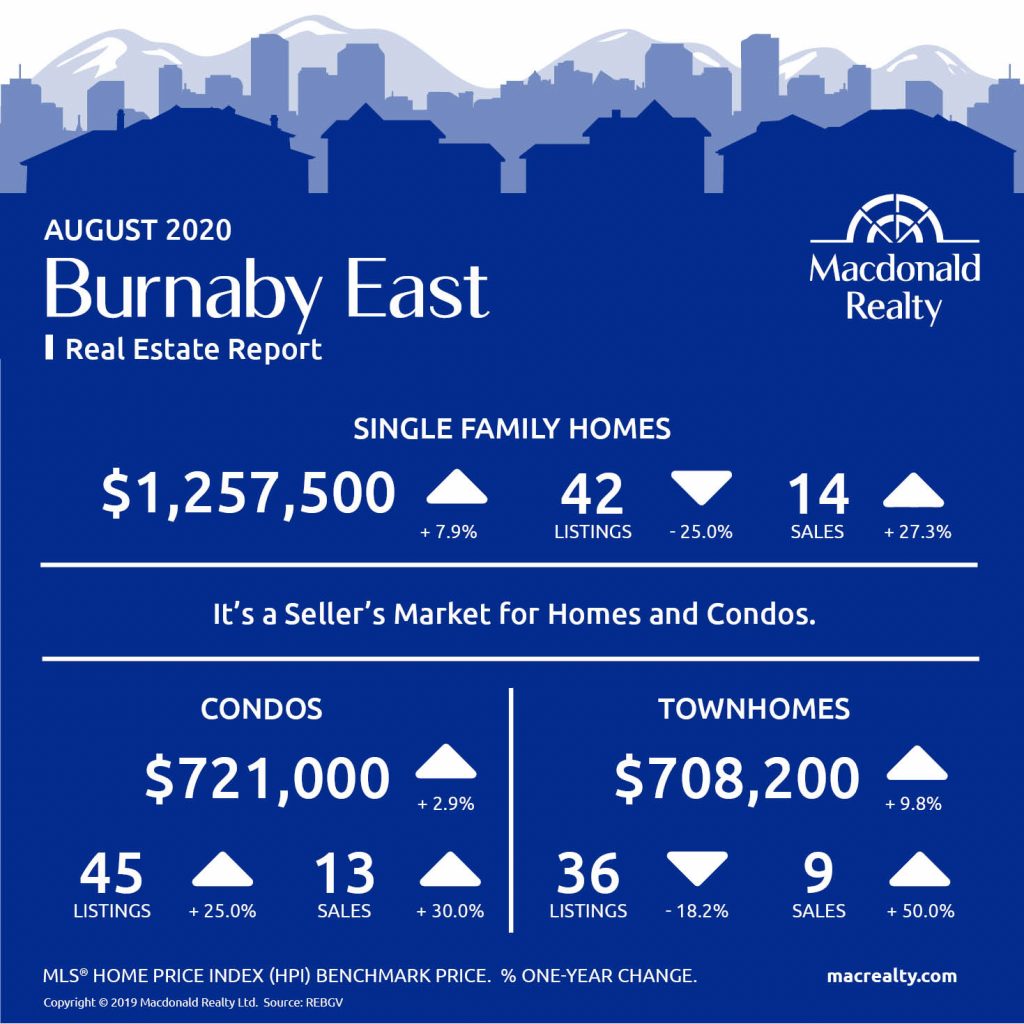
Burnaby East
In August 2020, there were 14 sales of detached homes and 42 active listings in Squamish. The benchmark sale price was $1,257,500.
The condo market had 13 sales and 45 active listings at the end of the month. The benchmark sale price was $721,000.
The townhome market had 9 sales and, the active listings were 36. The benchmark sale price was $708,200.
It’s a Seller’s Market for Homes and Condos in Burnaby East.
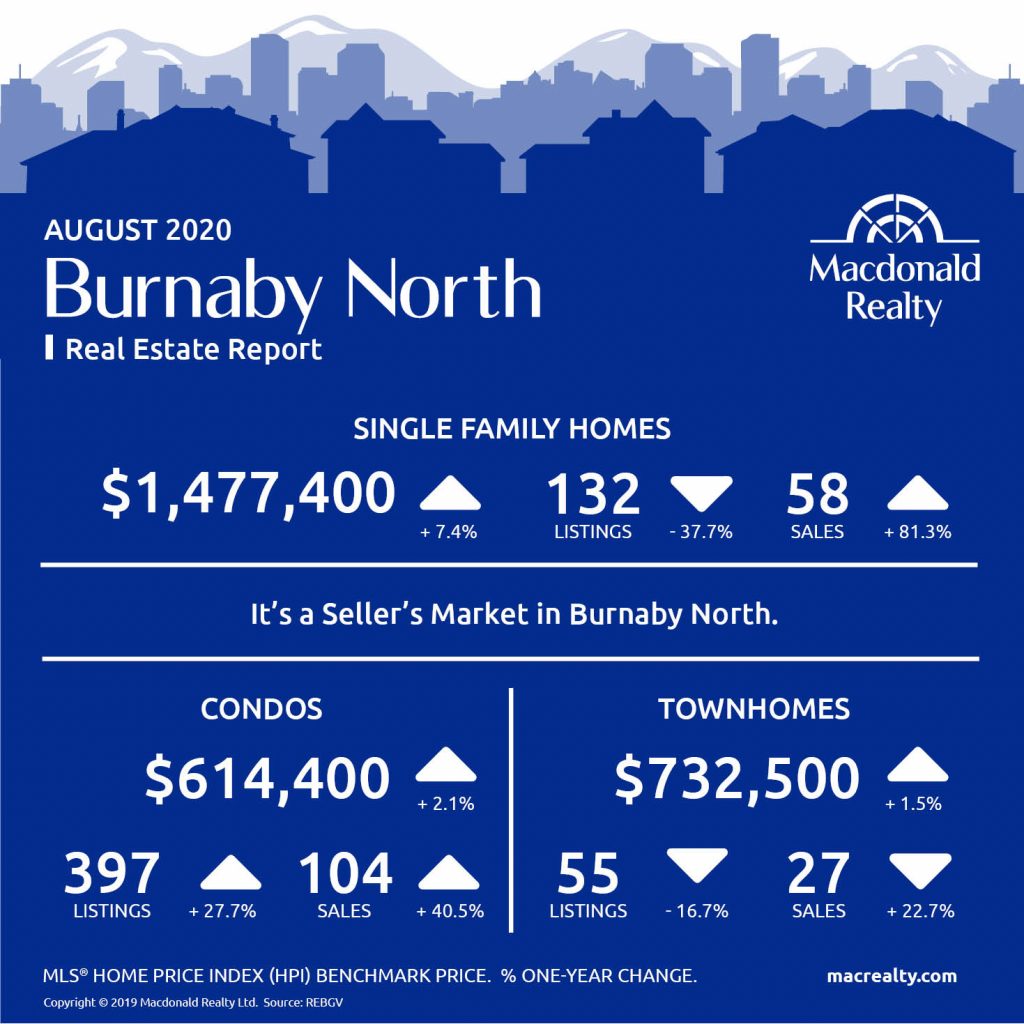
Burnaby North
In August 2020, there were 58 sales of detached homes and 132 active listings in Squamish. The benchmark sale price was $1,477,400.
The condo market had 104 sales and 397 active listings at the end of the month. The benchmark sale price was $614,400.
The townhome market had 27 sales and, the active listings were 55. The benchmark sale price was $732,500.
It’s a Seller’s Market in Burnaby North.
Burnaby South
In August 2020, there were 26 sales of detached homes and 182 active listings in Squamish. The benchmark sale price was $1,555,100.
The condo market had 81 sales and 397 active listings at the end of the month. The benchmark sale price was $656,300.
The townhome market had 19 sales and, the active listings were 67. The benchmark sale price was $802,400.
It’s a Buyer’s Market in for Homes in Burnaby South.

Coquitlam

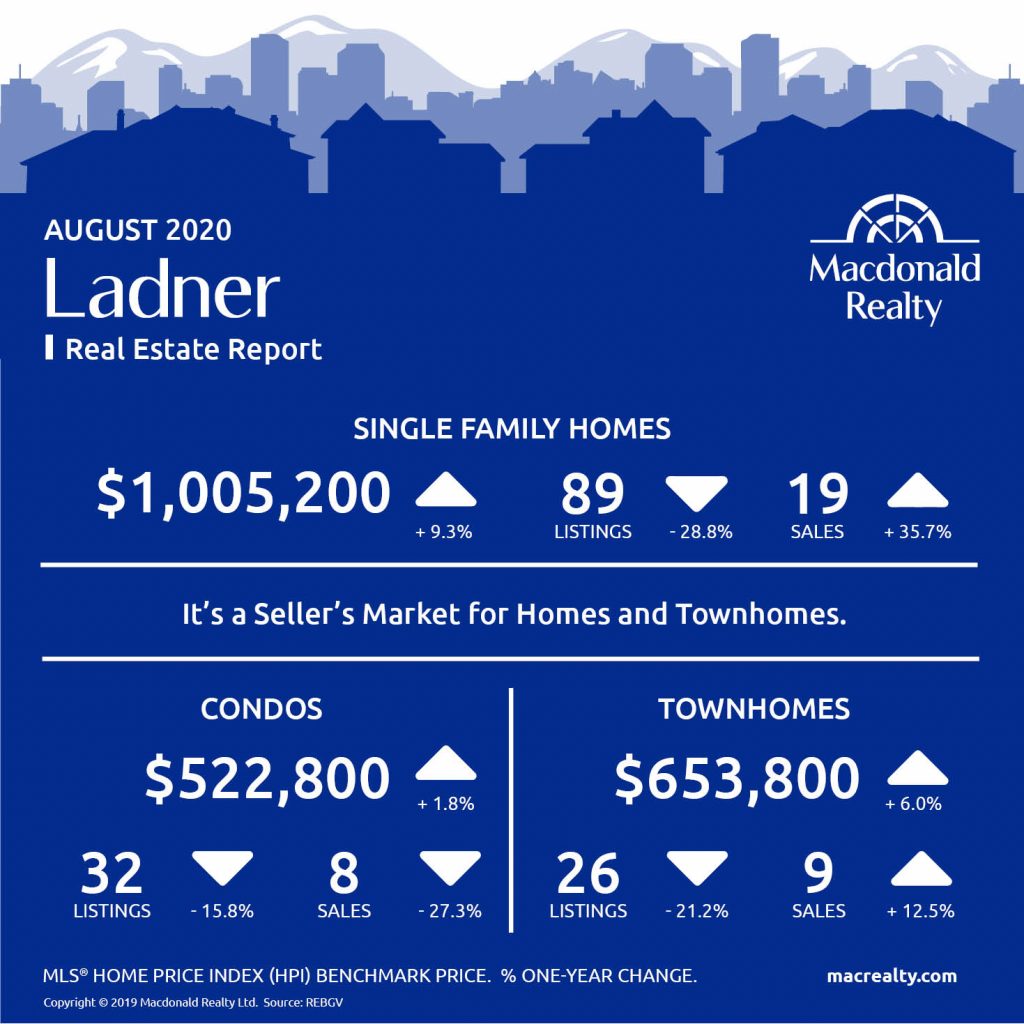
Ladner
Maple Ridge

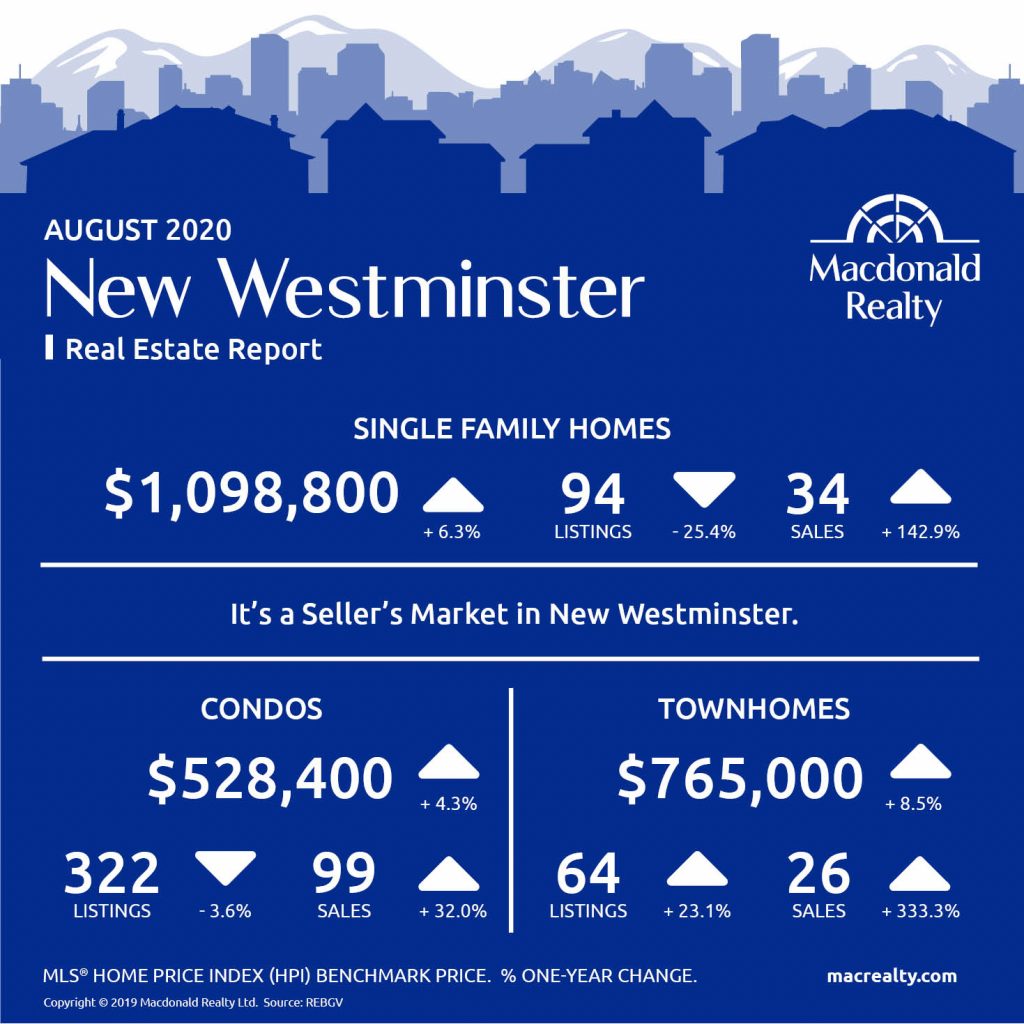
New Westminster
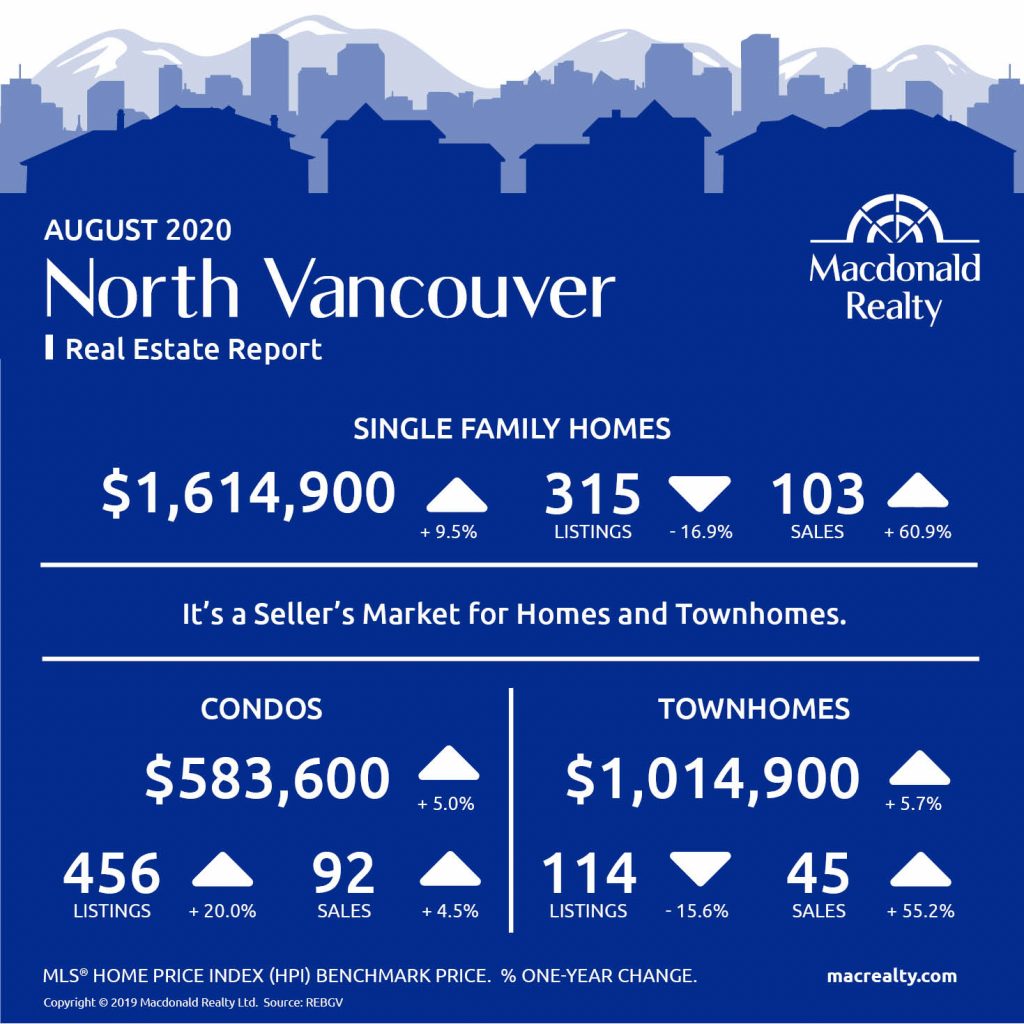
North Vancouver
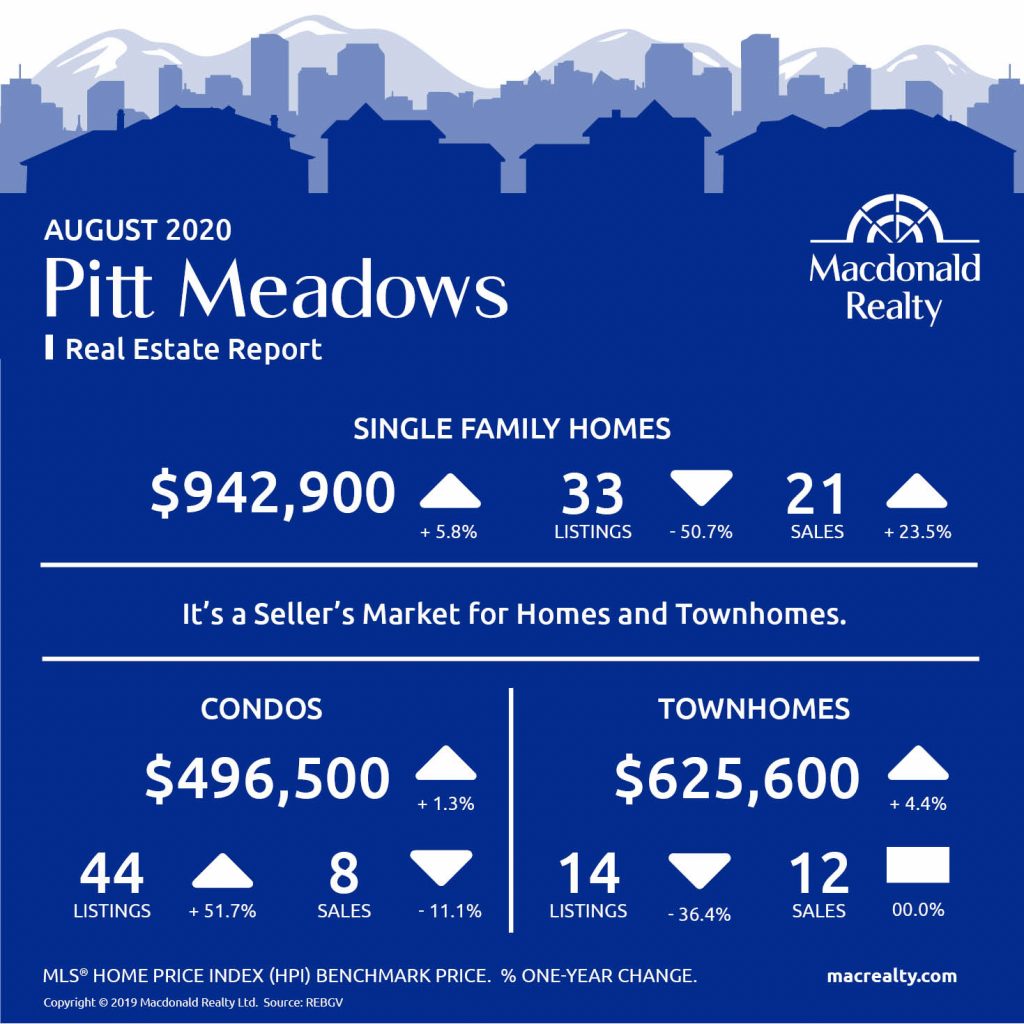
Pitt Meadows
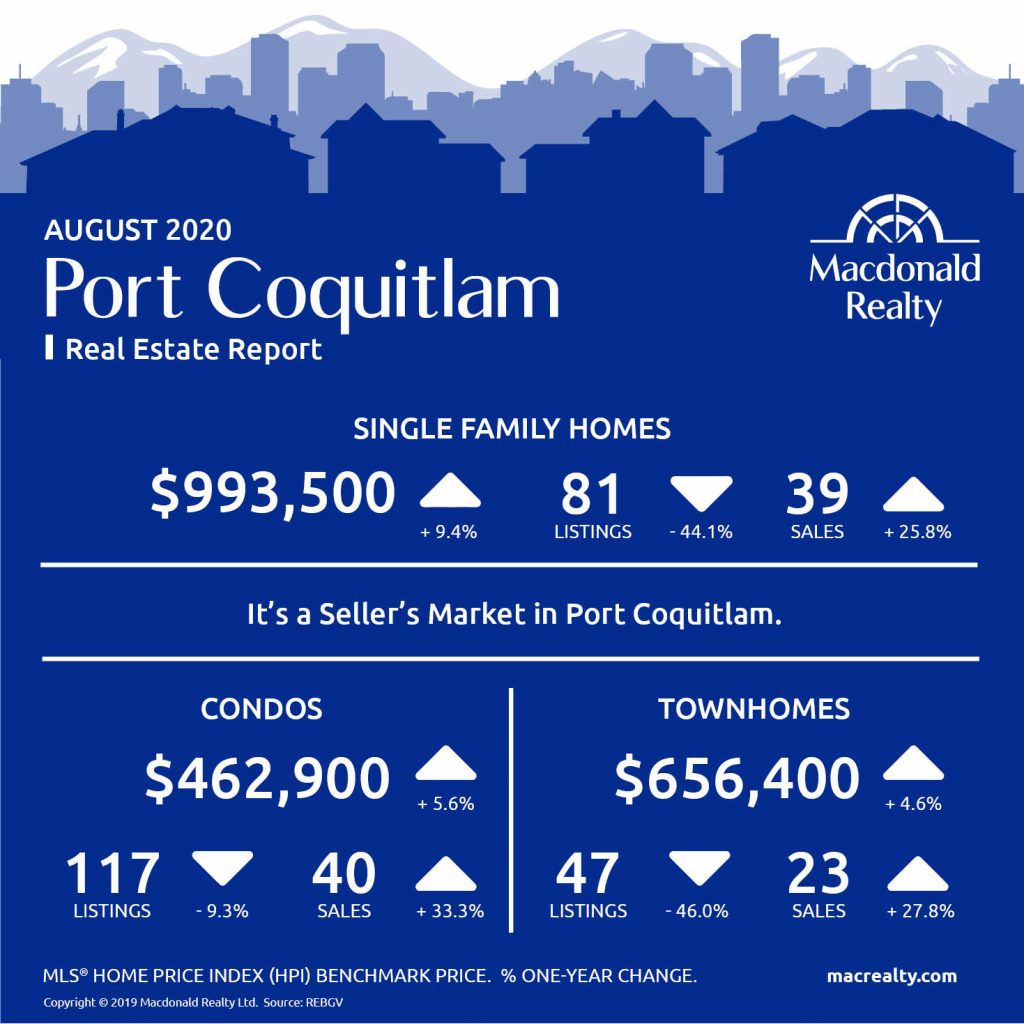
Port Coquitlam
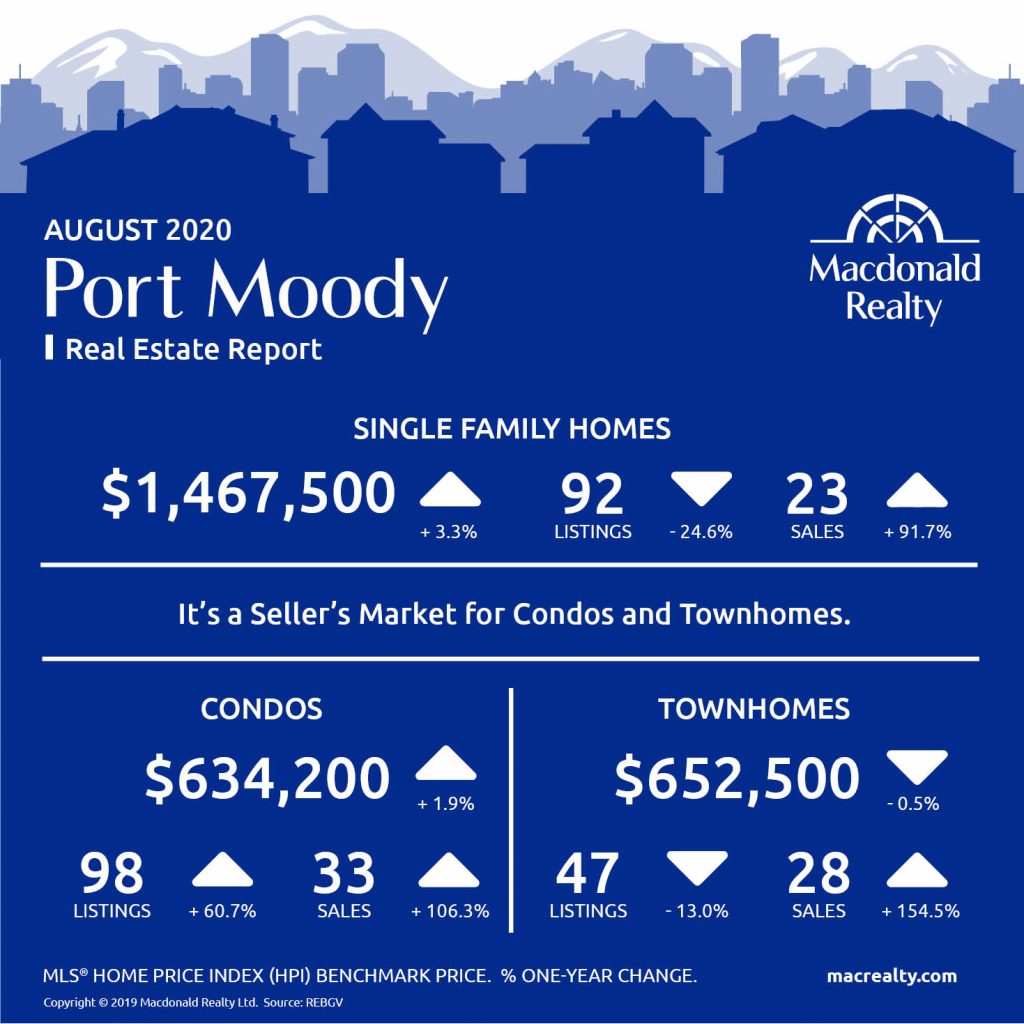
Port Moody
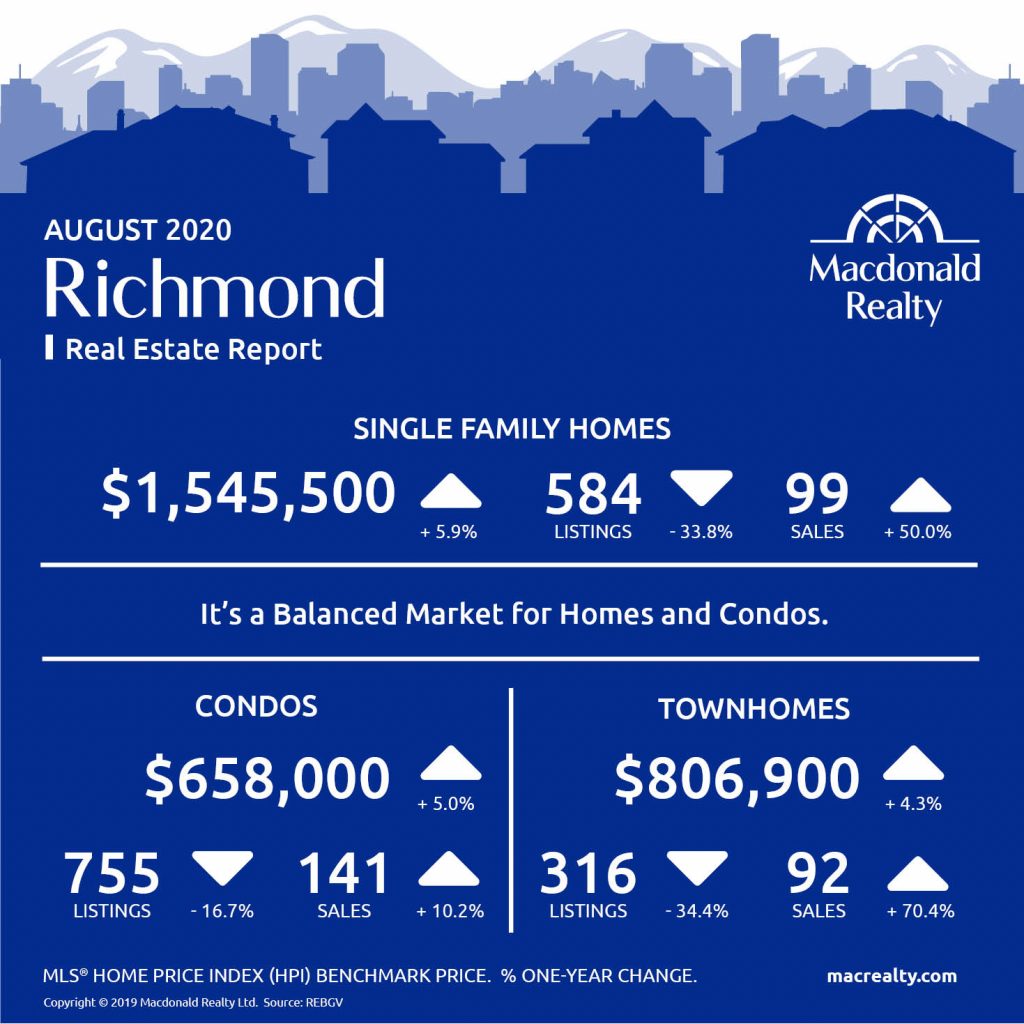
Richmond
Tsawwassen

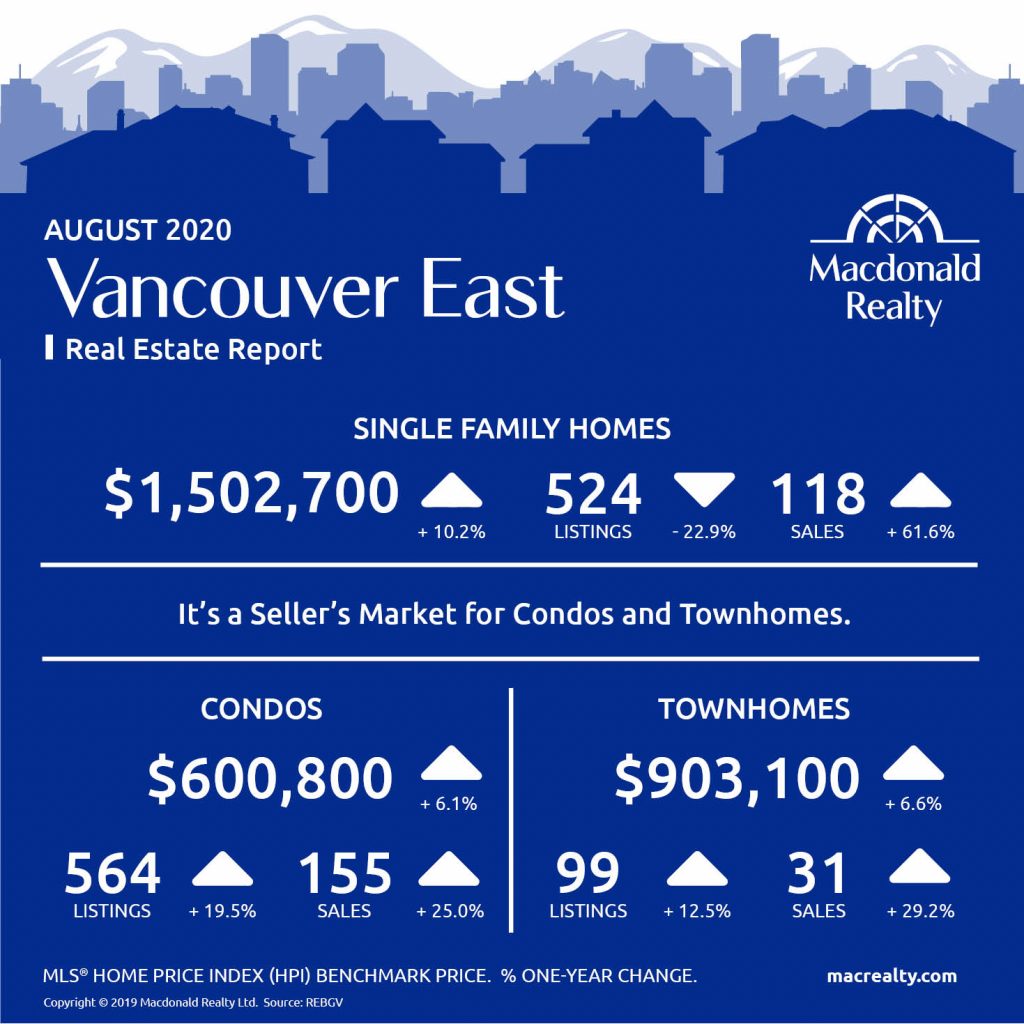
Vancouver East
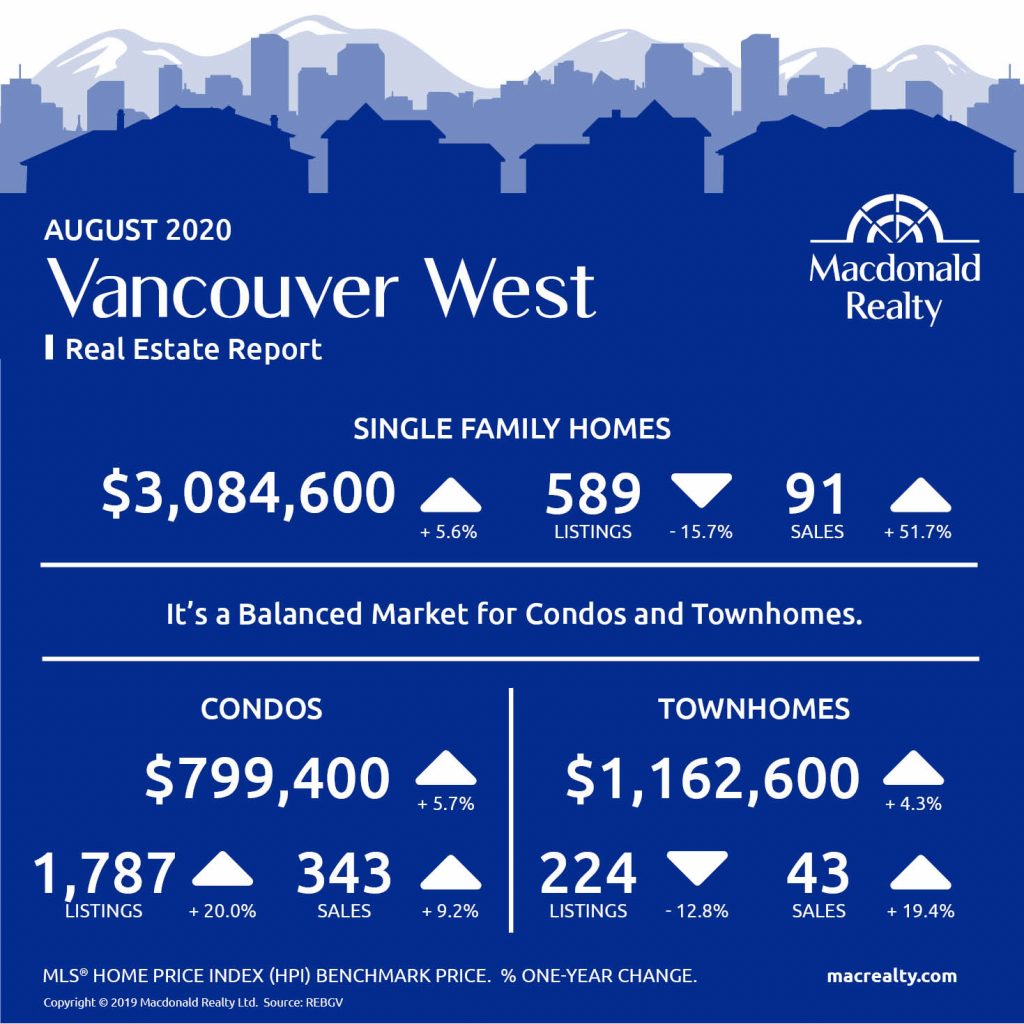
Vancouver West
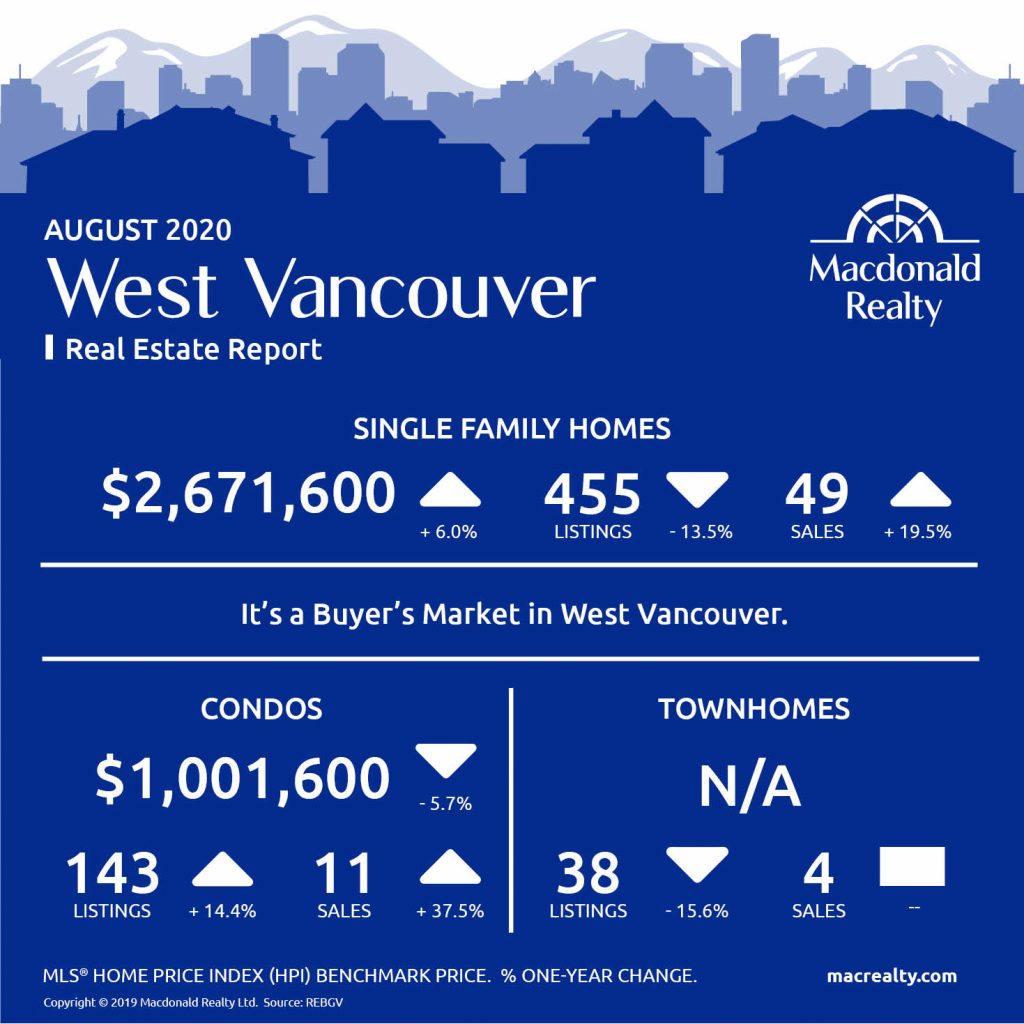
West Vancouver
Looking for more information about the real estate market in specific neighbourhoods in the Greater Vancouver?
Macdonald Realty has offices across the Greater Vancouver. Please email [email protected] or call 1-877-278-3888 to be matched with a REALTOR® working in your area.
MLS® Home Price Index (HPI) Benchmark Price
Average and median home prices are often misinterpreted, are affected by change in the mix of homes sold, and can swing dramatically from month to month (based on the types and prices of properties that sold in a given month). The MLS® HPI overcomes these shortcomings and uses the concept of a benchmark home, a notional home with common attributes of typical homes in a defined area. Visit www.housepriceindex.ca for more information.
This blog post is based on market data provided by the Real Estate Board of Greater Vancouver (REBGV) www.rebgv.org
by Macrealty Marketing Team | Aug 7, 2020 | Market Updates
Here are the latest real estate market statistics from Macdonald Realty on the Greater Vancouver listings and sales in July 2020.
Find all the infographics by visiting the Facebook Album.
According to the Real Estate Board of Greater Vancouver, home buyer and seller activity in Metro Vancouver exceeded historical levels in July.
“We’re seeing the results today of pent up activity, from both home buyers and sellers, that had been accumulating in our market throughout the year,” Colette Gerber, REBGV Chair said. “Low interest rates and limited overall supply are also increasing competition across our market.”
Colette also has talked about the COVID situation which according to him remains the top priority for our REALTOR® community.
“We continue to limit in-person interactions with clients and employ different technology solutions to ensure home buyers and sellers can get as much information as possible in a virtual setting.”
The Real Estate Board of Greater Vancouver (REBGV) reports that “residential home sales in the region totalled 3,128 in July 2020, a 22.3% increase from the 2,557 sales recorded in July 2019, and a 28%t increase from the 2,443 homes sold in June 2020. Last month’s sales were 9.4% above the 10-year July sales average”.
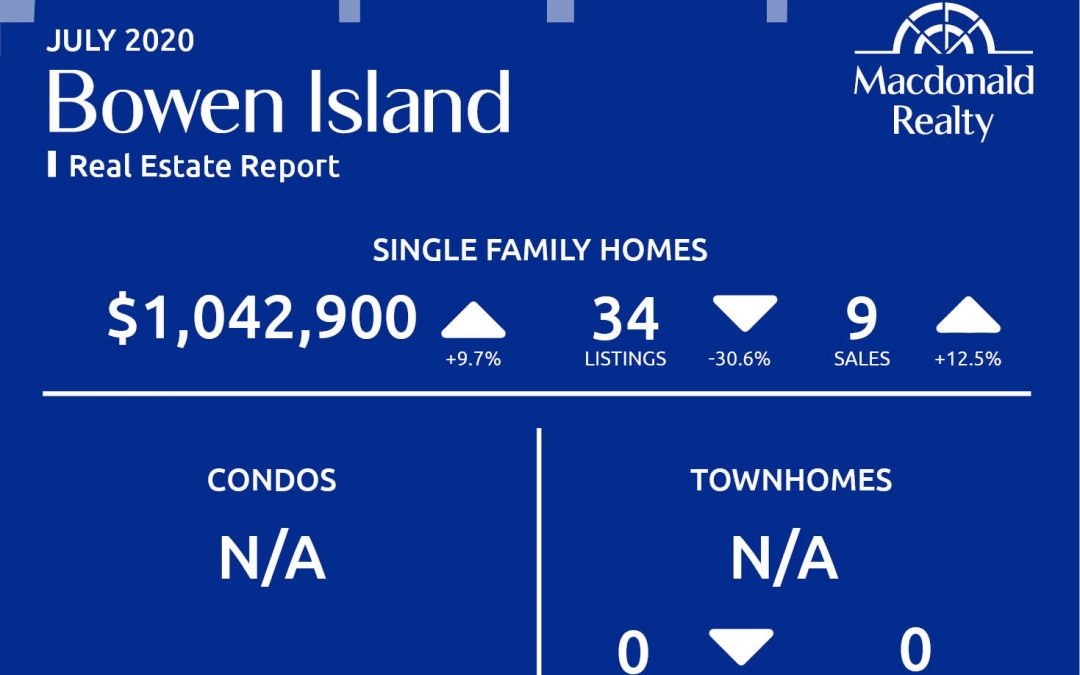
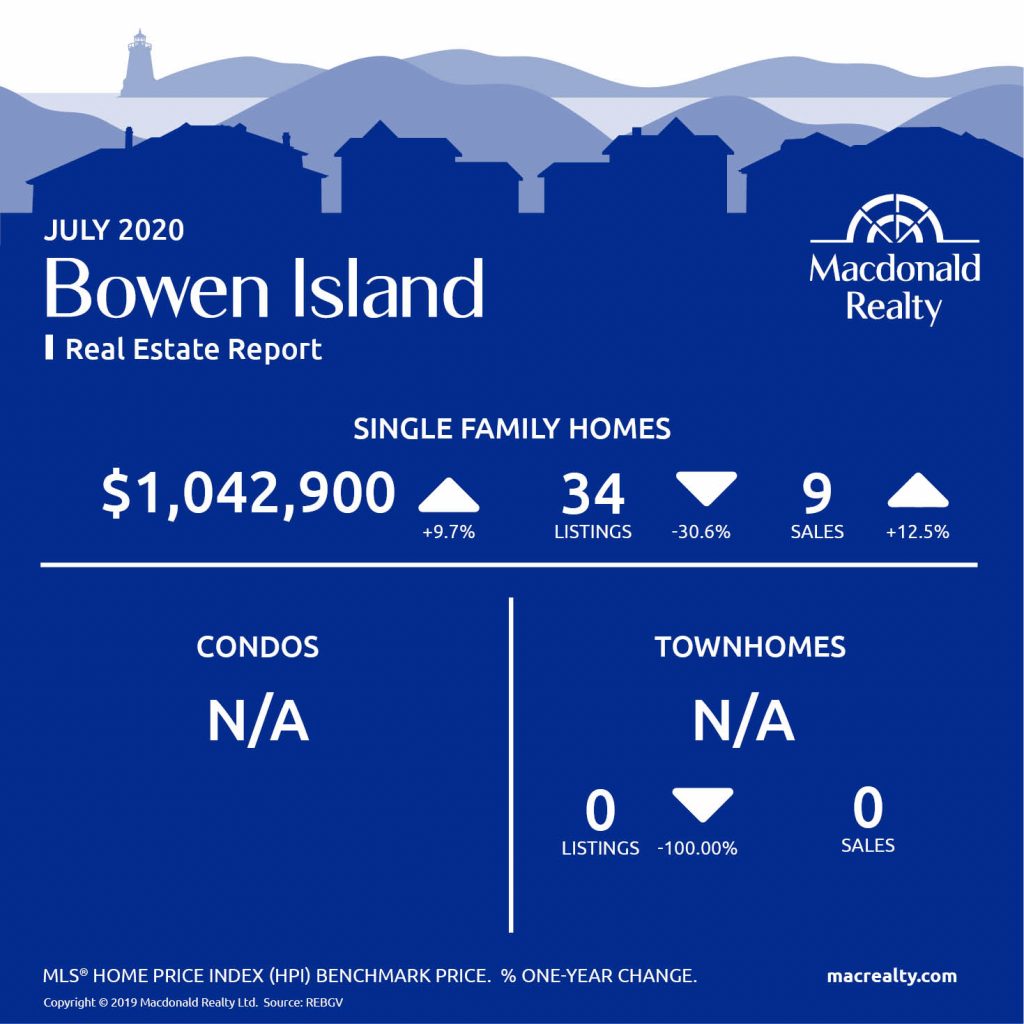
Bowen Island
Burnaby East

Burnaby North

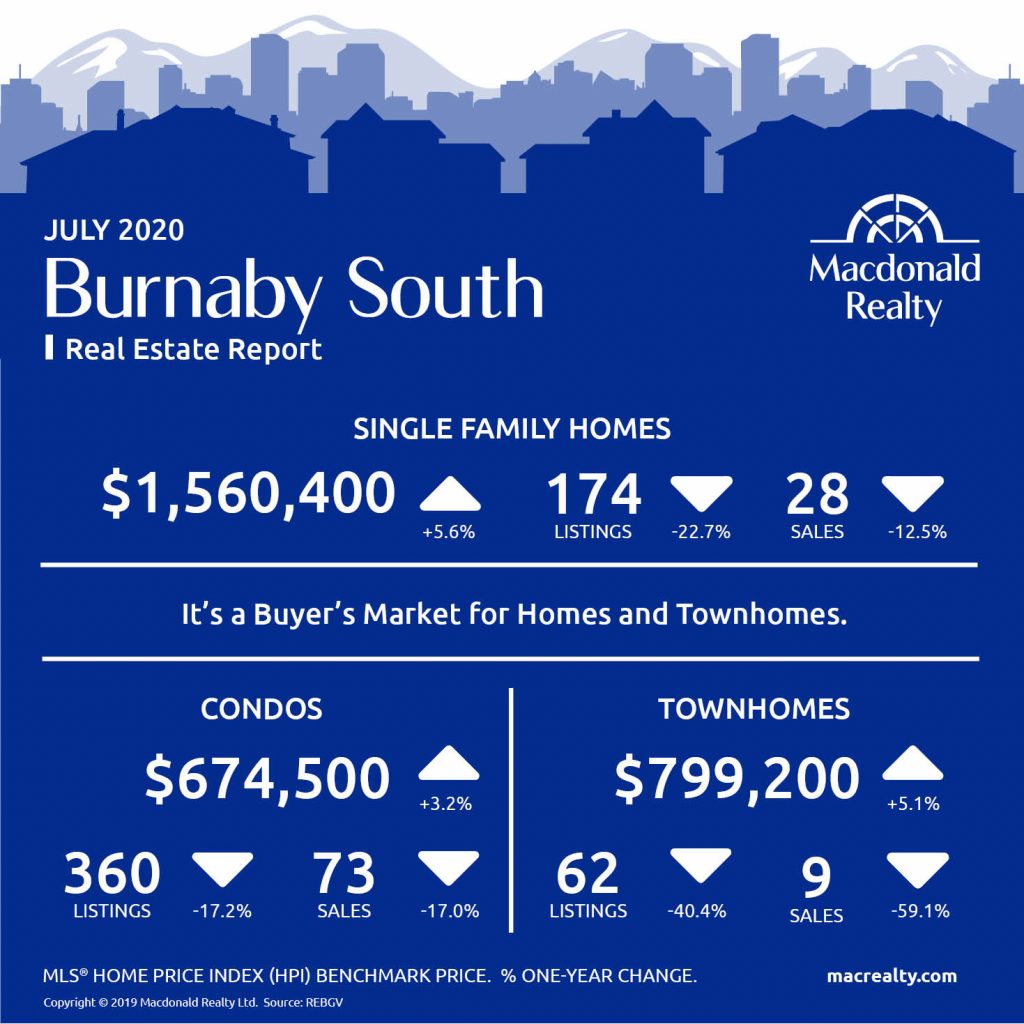
Burnaby South
Coquitlam

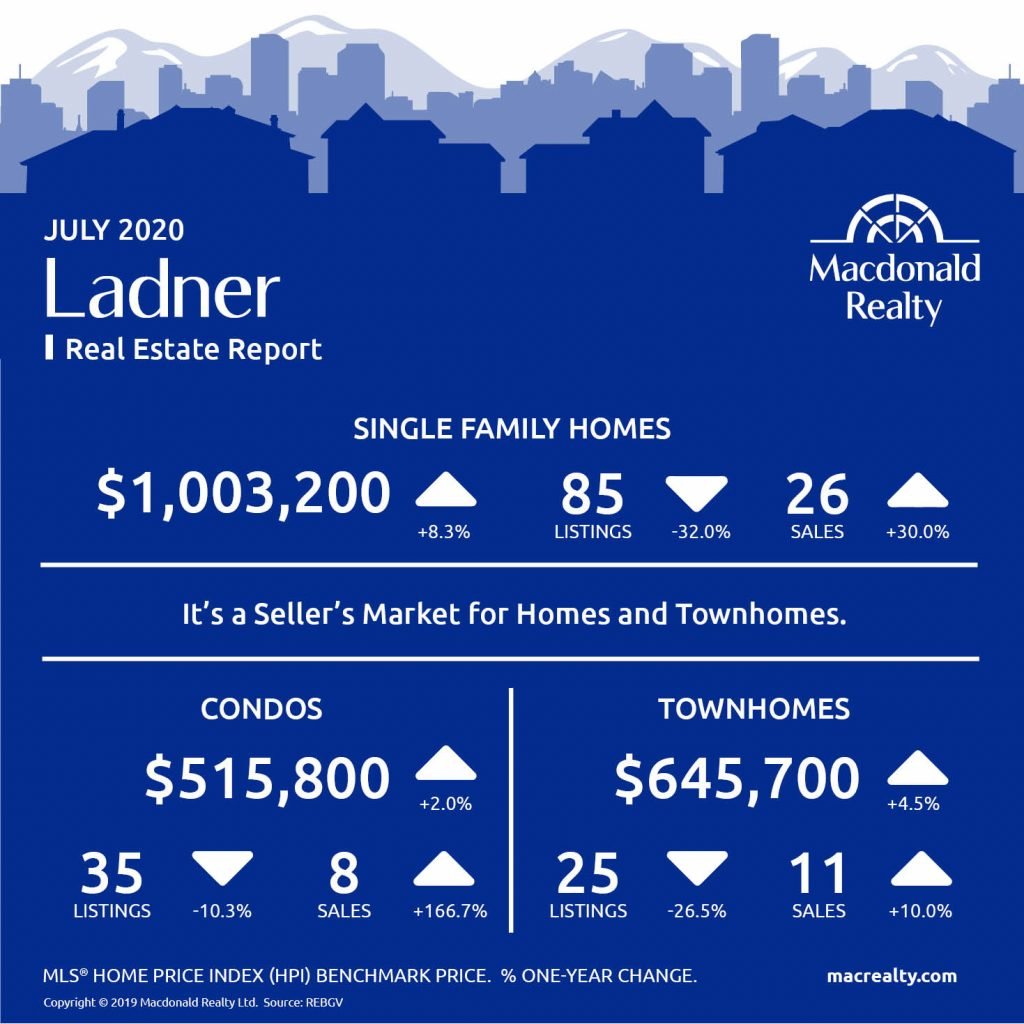
Ladner
Maple Ridge

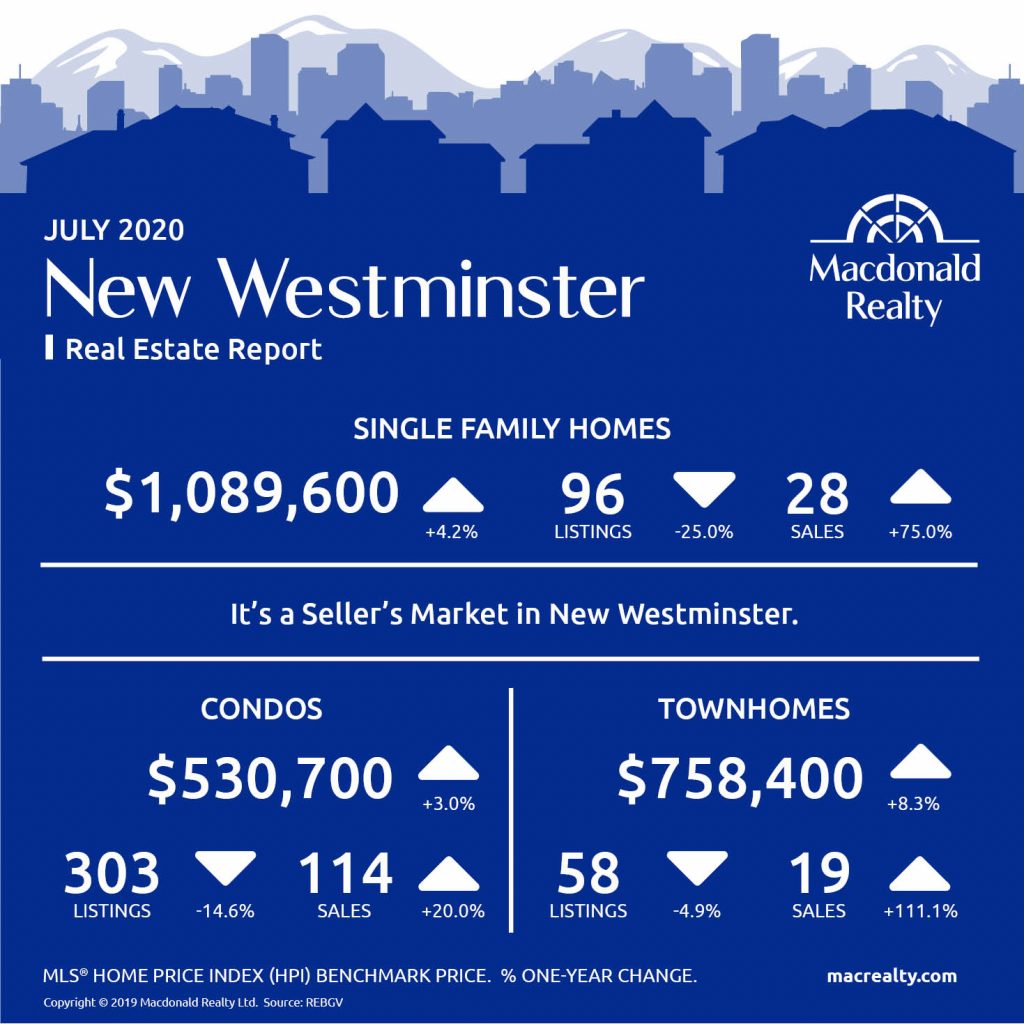
New Westminster
North Vancouver

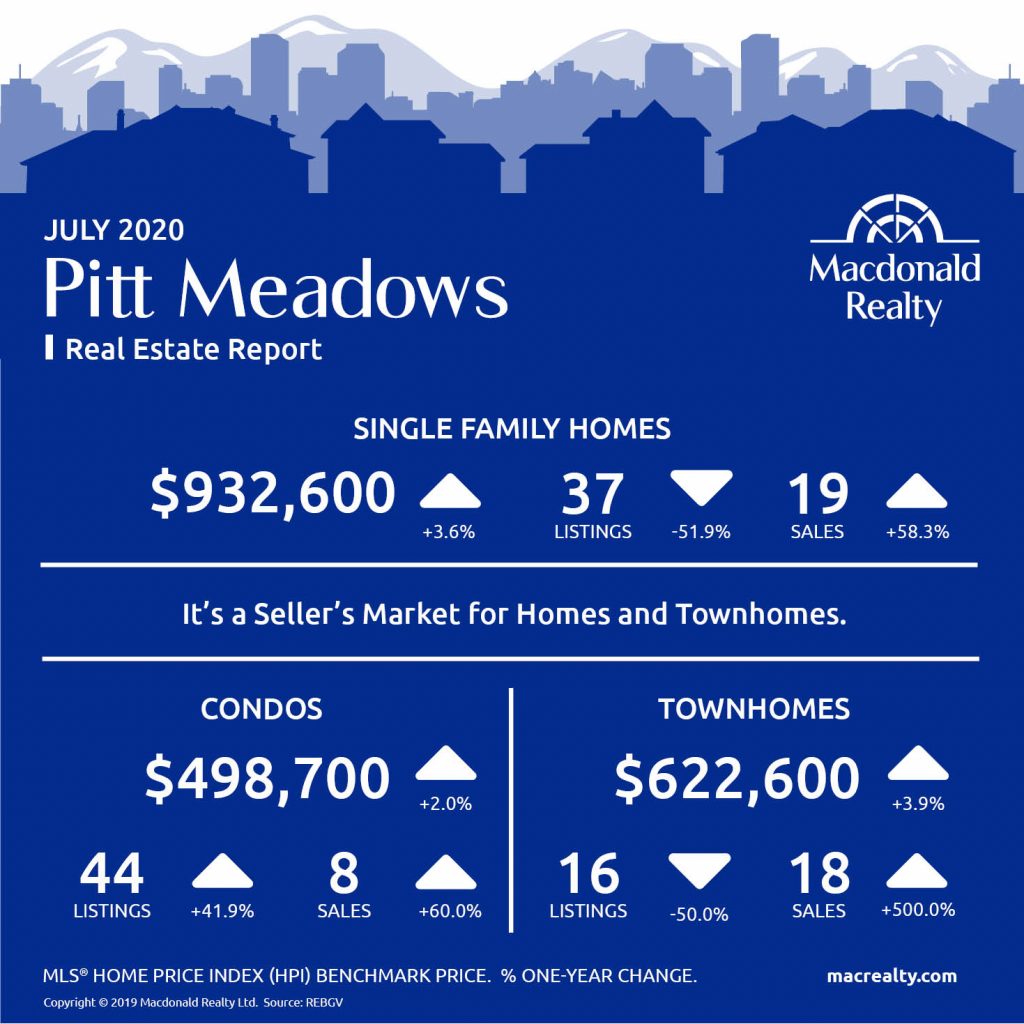
Pitt Meadows
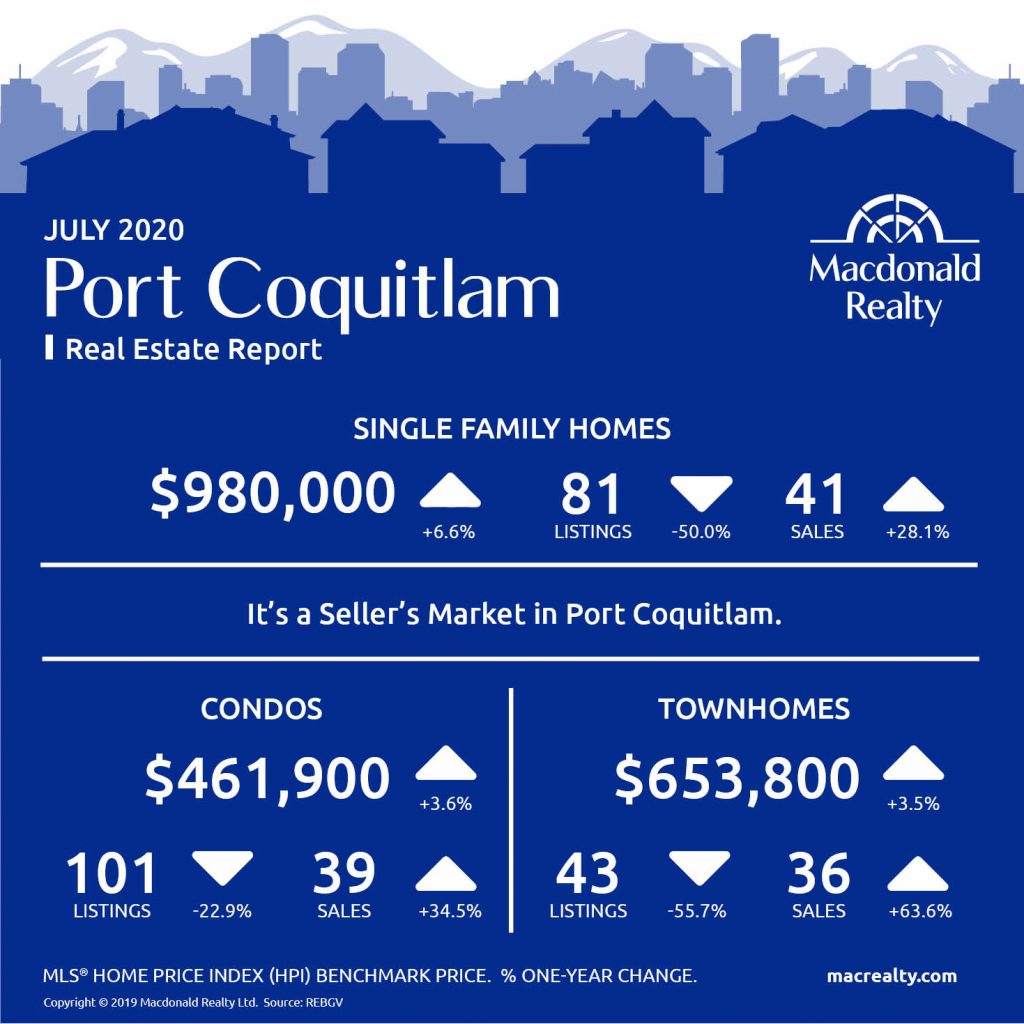
Port Coquitlam
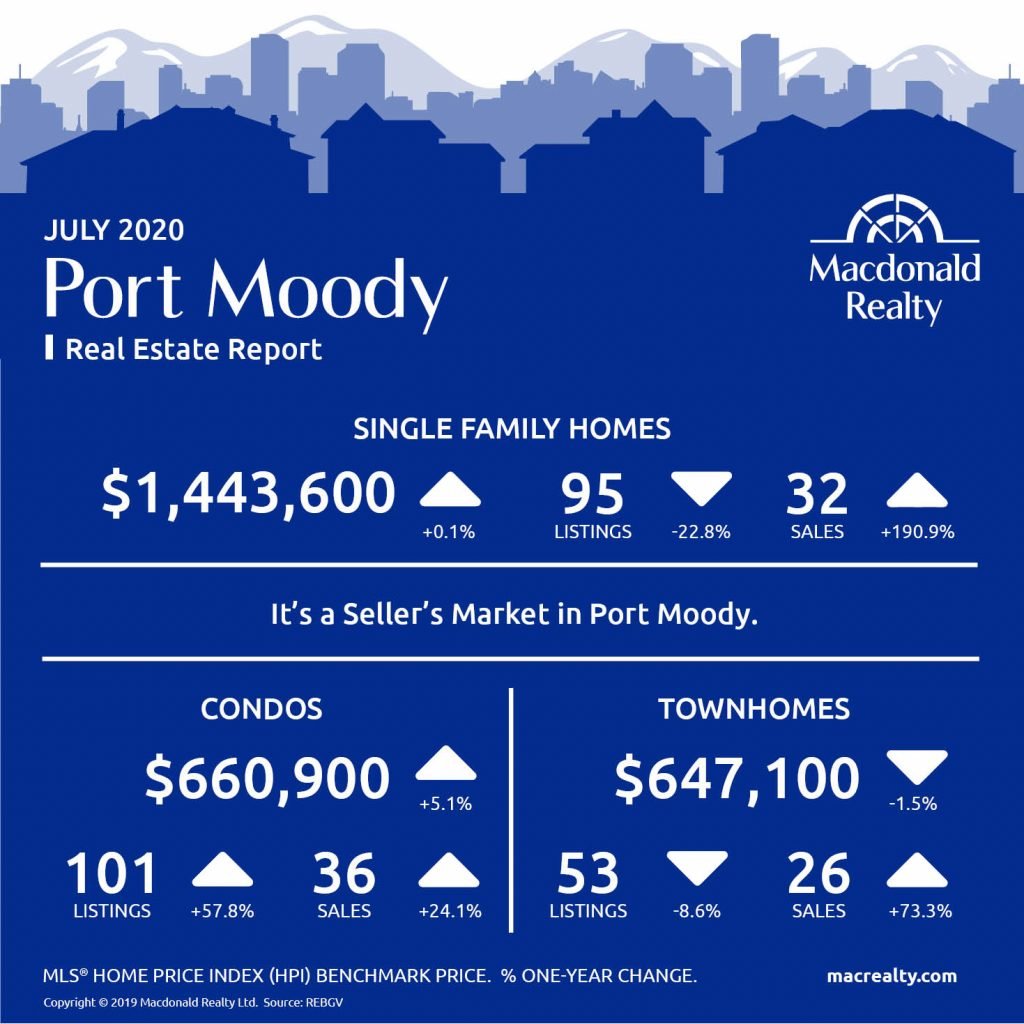
Port Moody
Richmond

Tsawwassen

Vancouver East

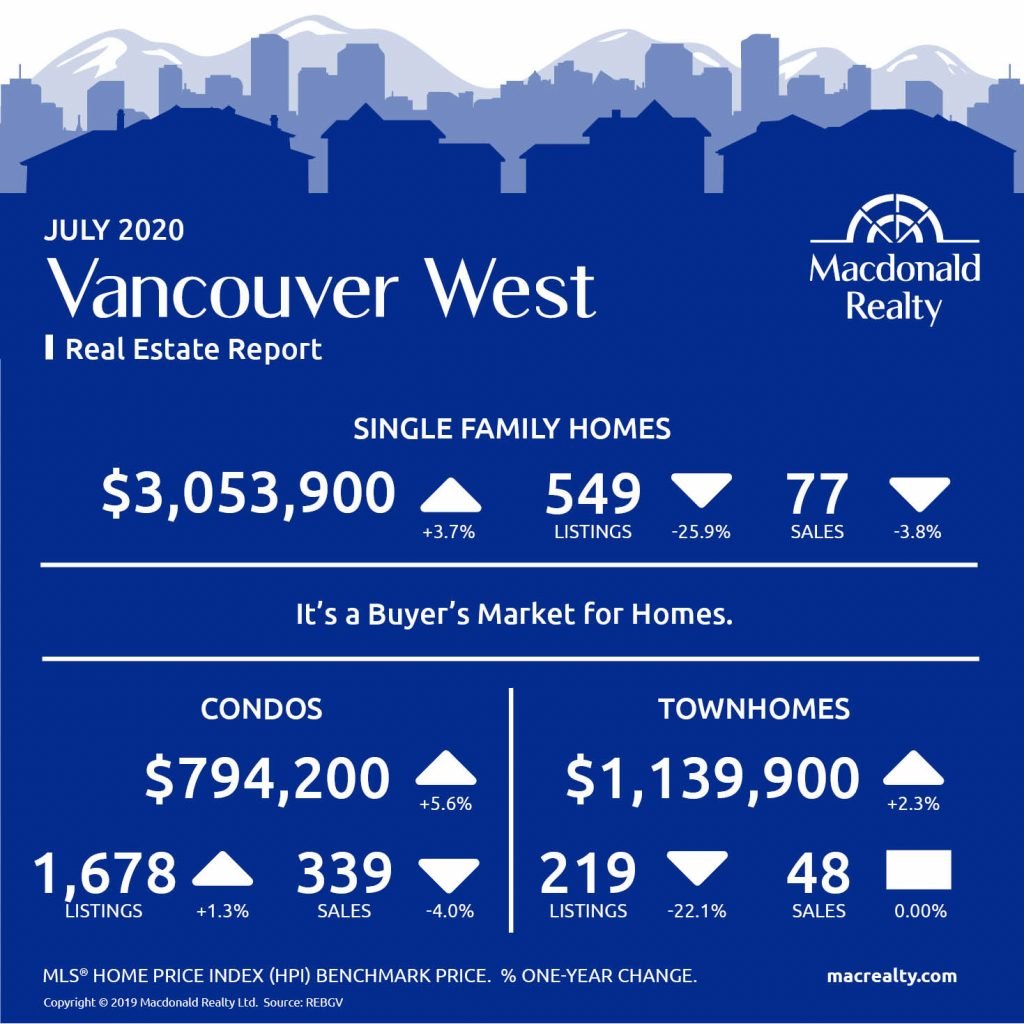
Vancouver West
West Vancouver

Looking for more information about the real estate market in specific neighbourhoods in the Greater Vancouver?
Macdonald Realty has offices across the Greater Vancouver. Please email [email protected] or call 1-877-278-3888 to be matched with a REALTOR® working in your area.
MLS® Home Price Index (HPI) Benchmark Price
Average and median home prices are often misinterpreted, are affected by change in the mix of homes sold, and can swing dramatically from month to month (based on the types and prices of properties that sold in a given month). The MLS® HPI overcomes these shortcomings and uses the concept of a benchmark home, a notional home with common attributes of typical homes in a defined area. Visit www.housepriceindex.ca for more information.
This blog post is based on market data provided by the Real Estate Board of Greater Vancouver (REBGV) www.rebgv.org

by Macrealty Marketing Team | Jul 7, 2020 | Market Updates
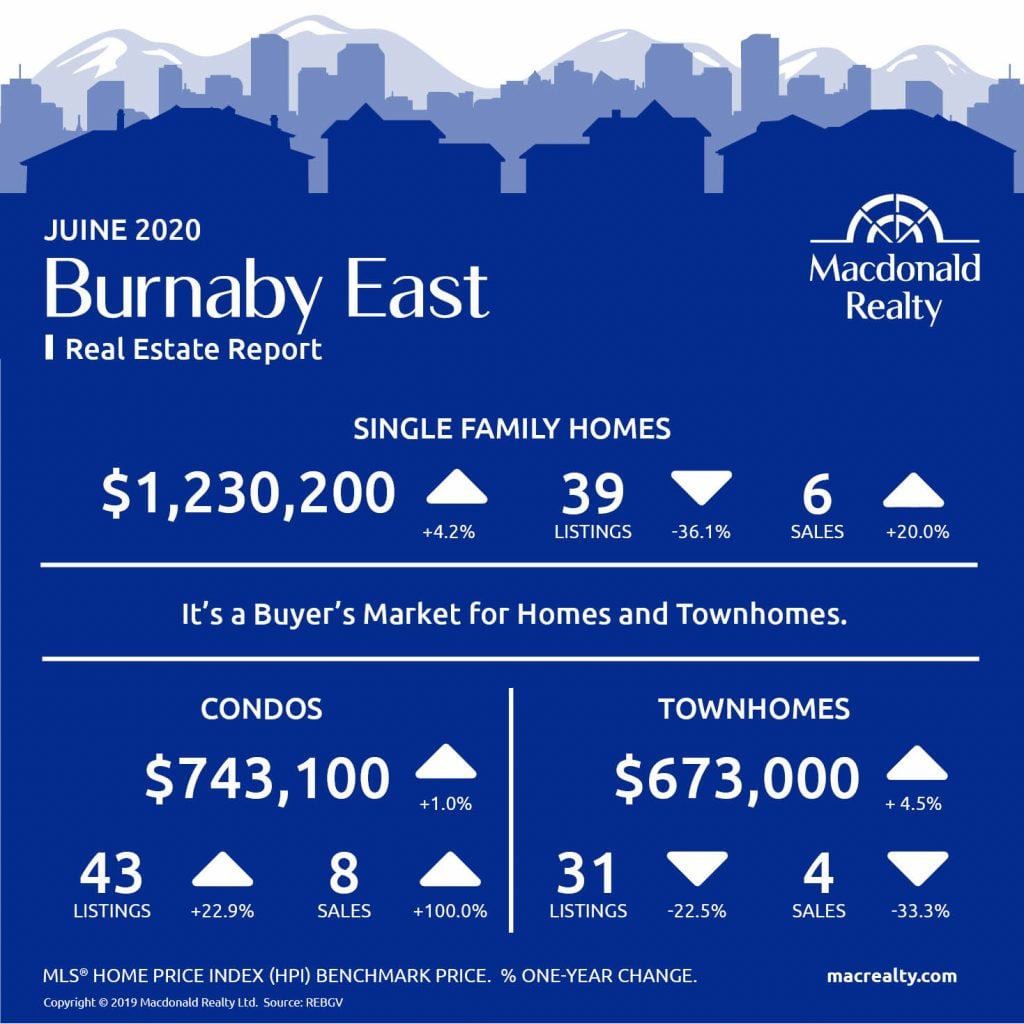
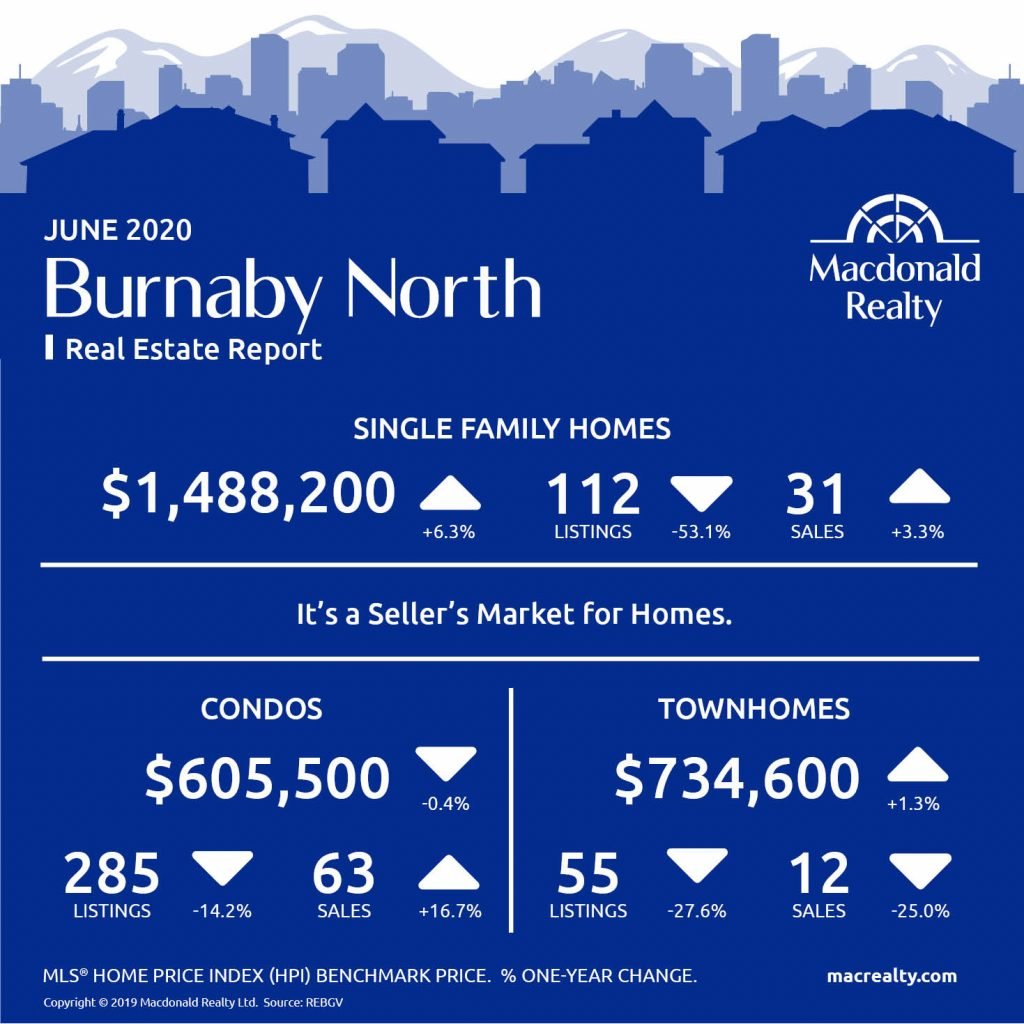
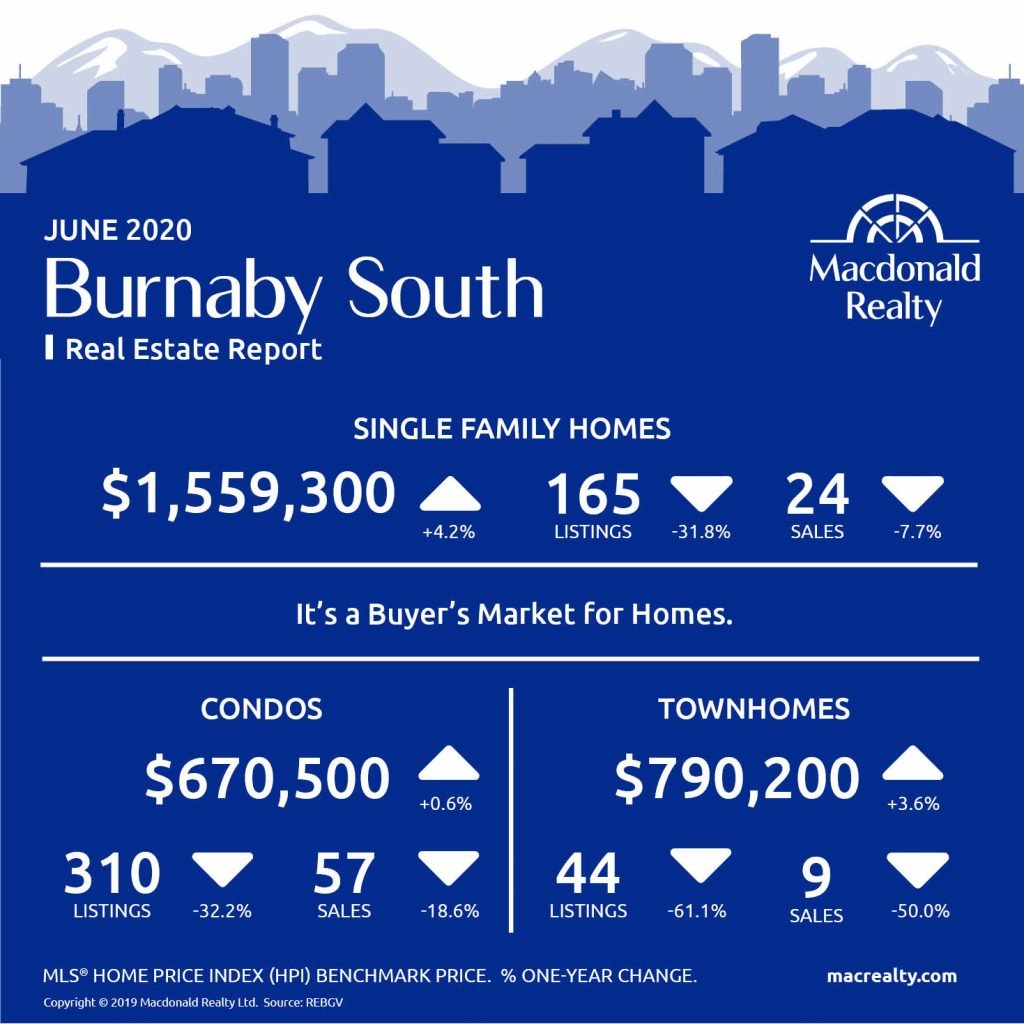
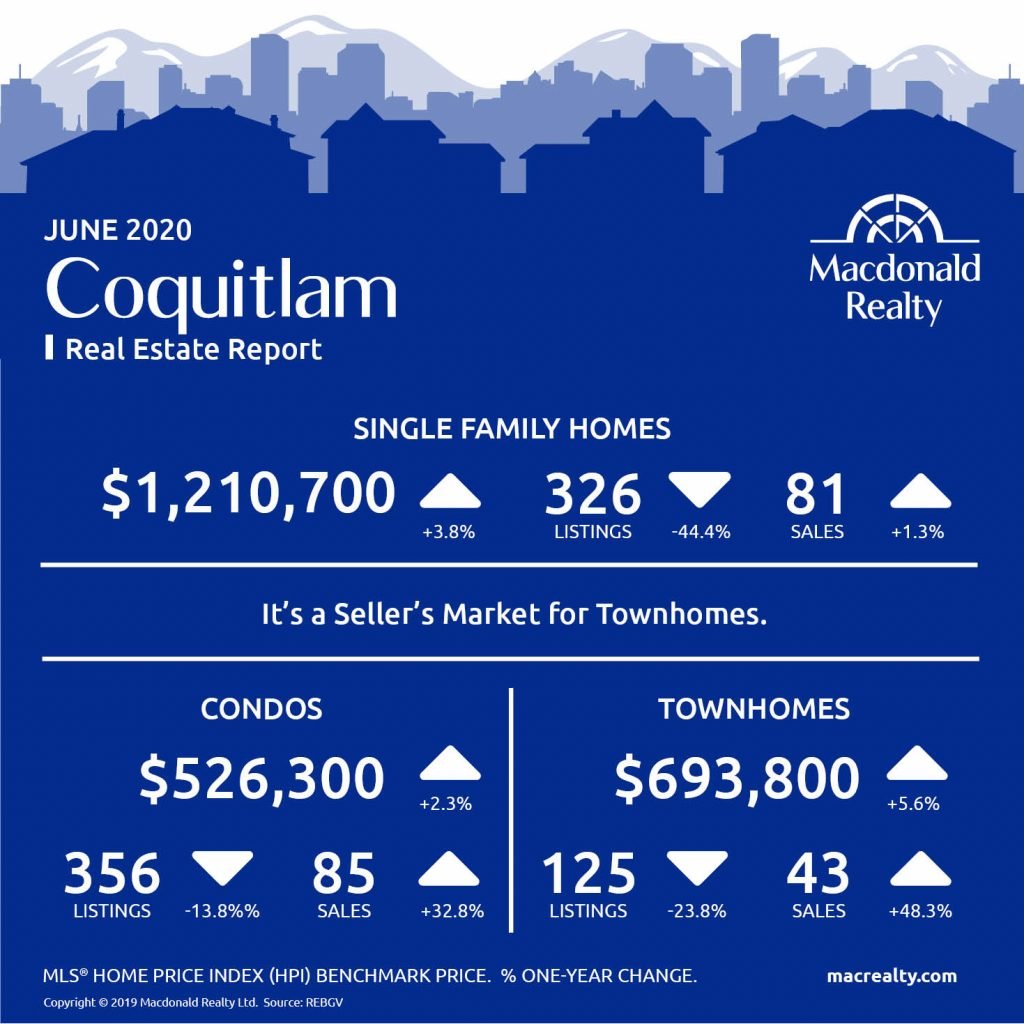
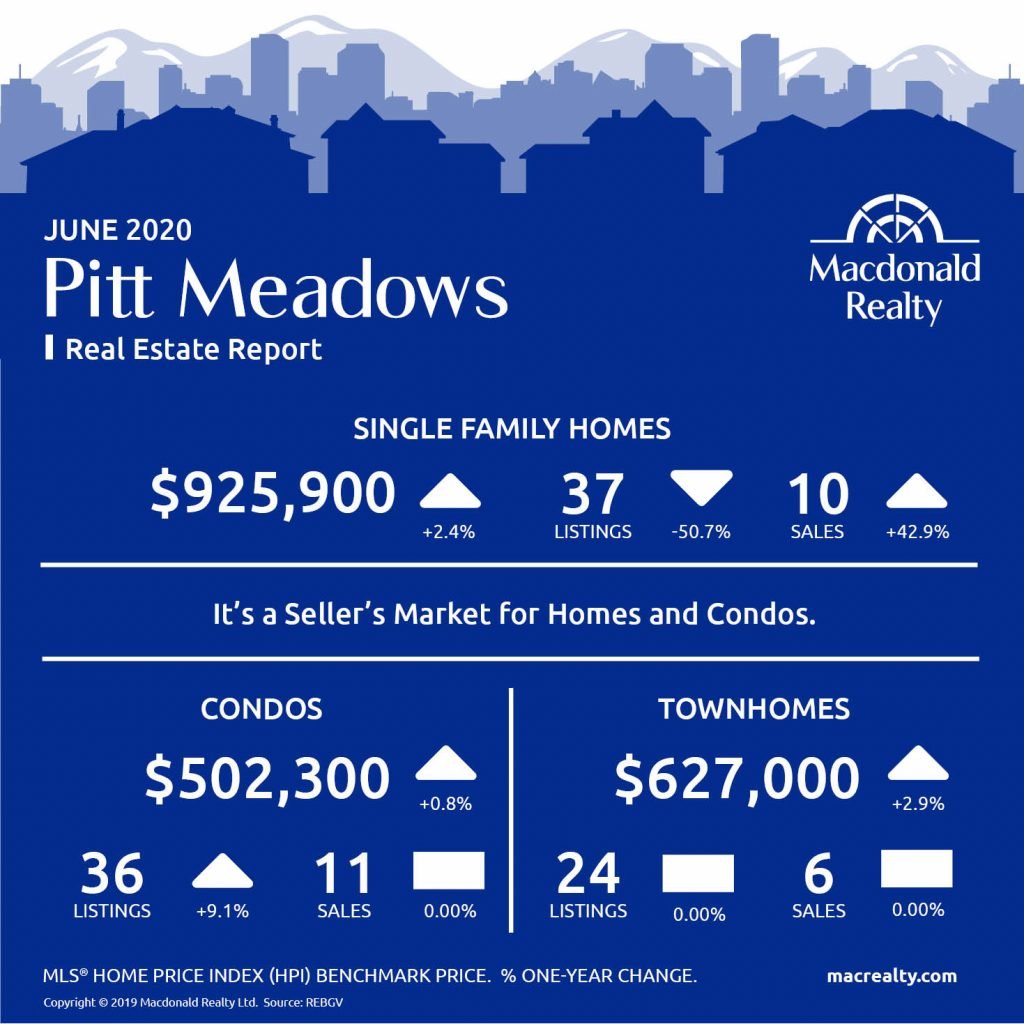
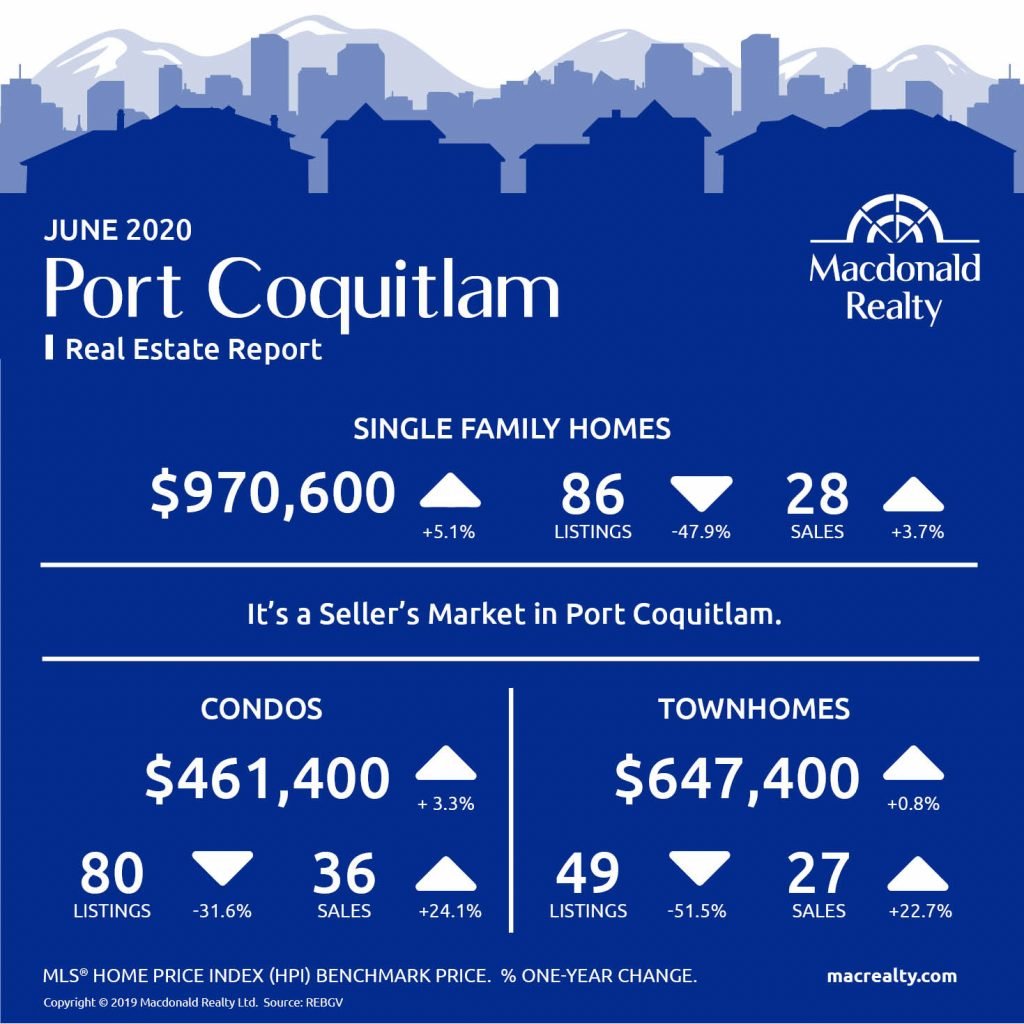
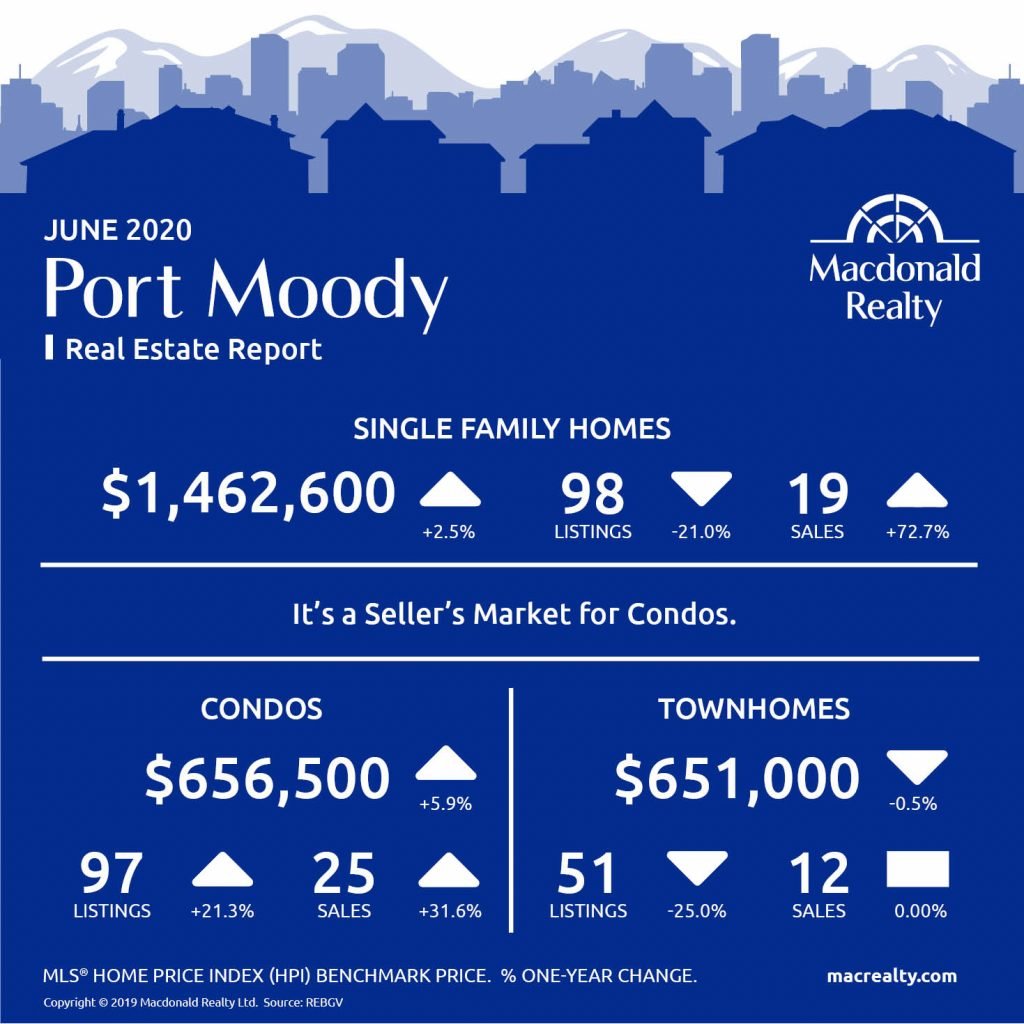
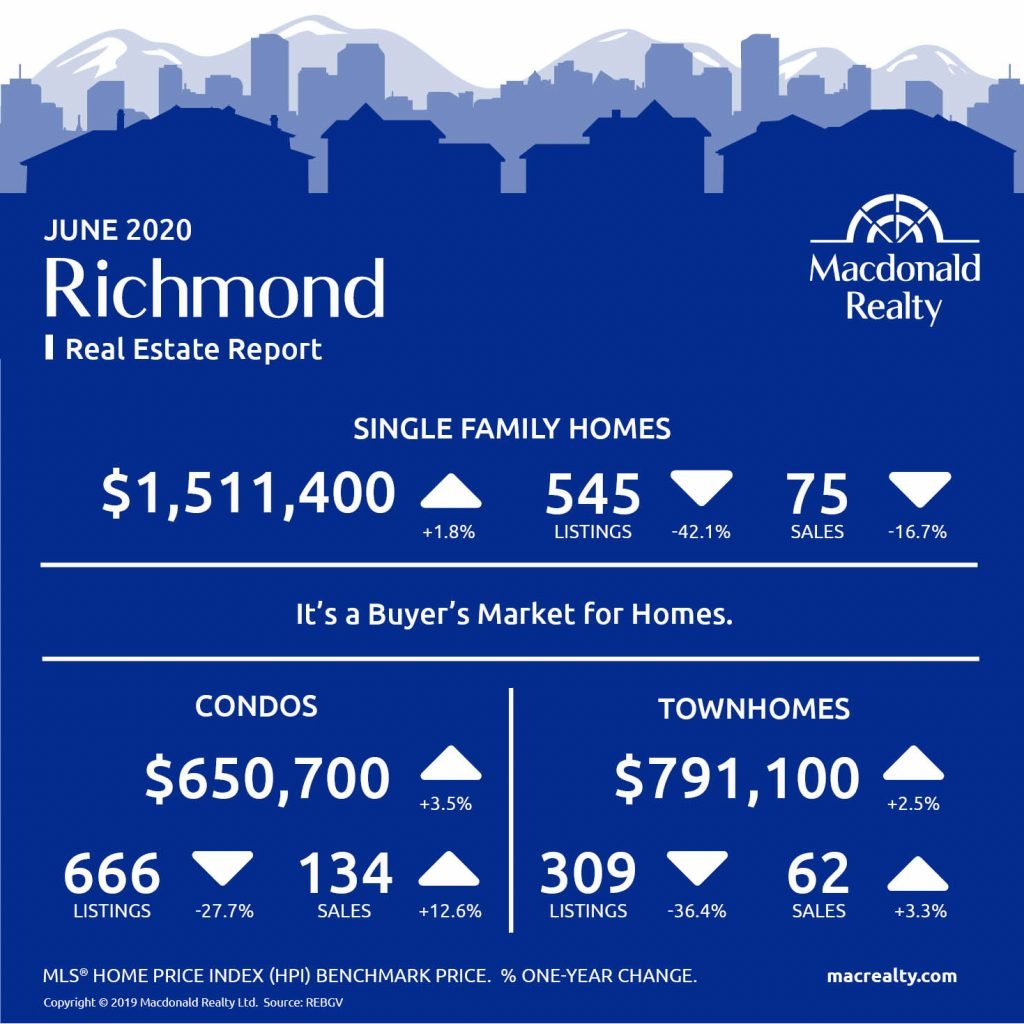
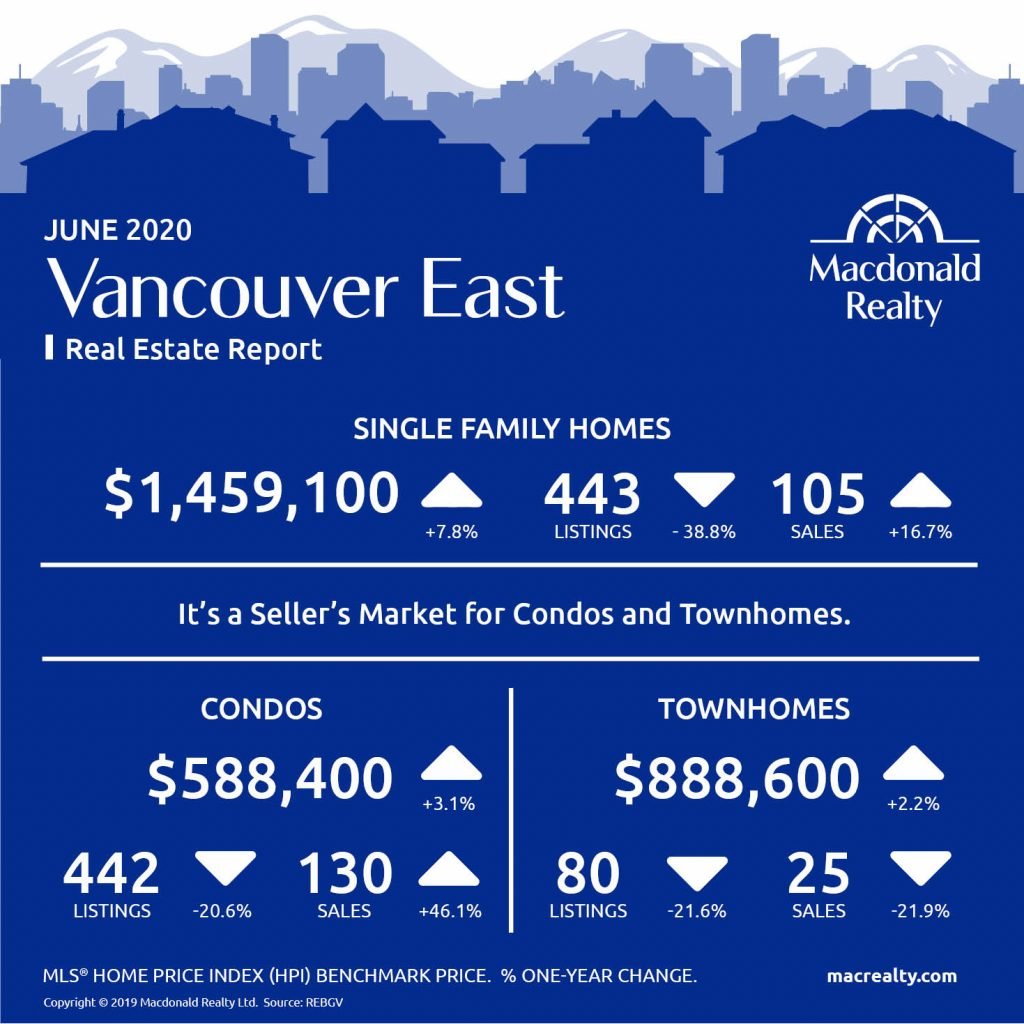
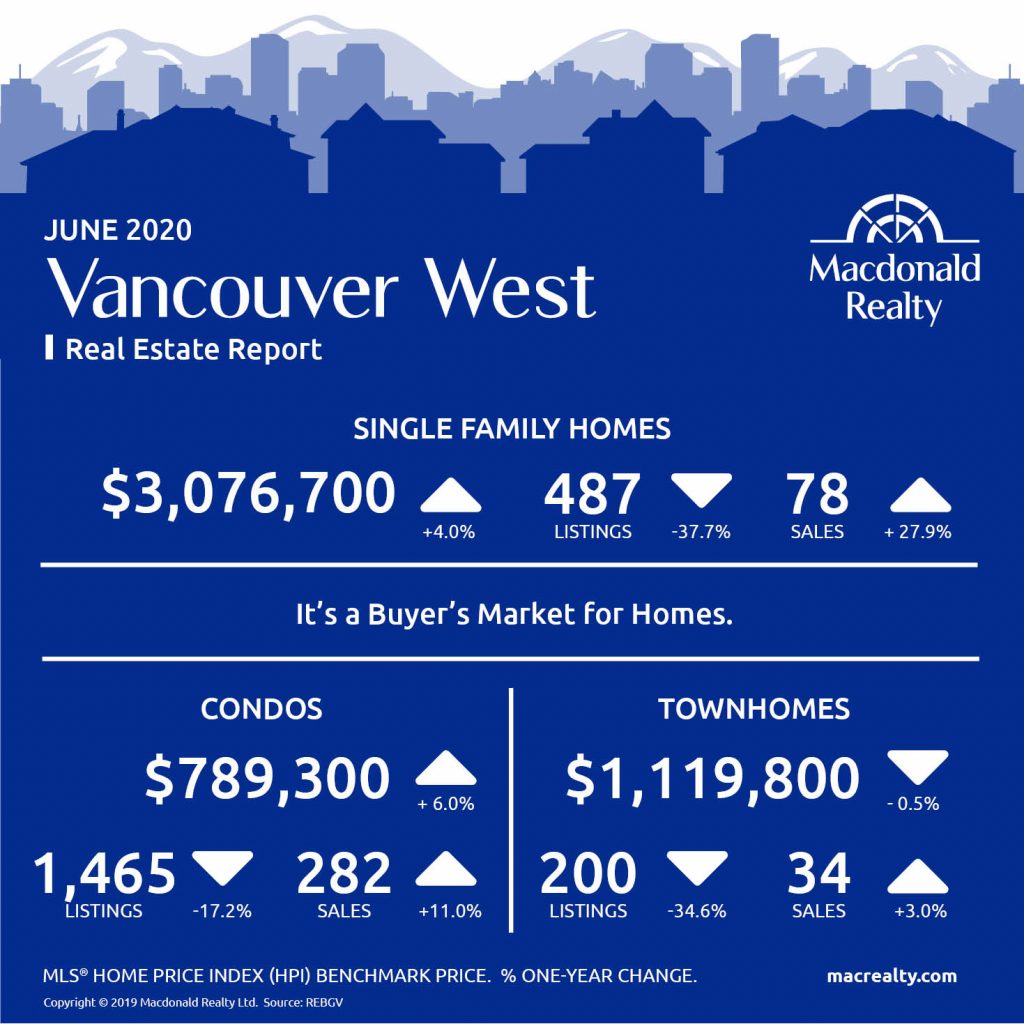
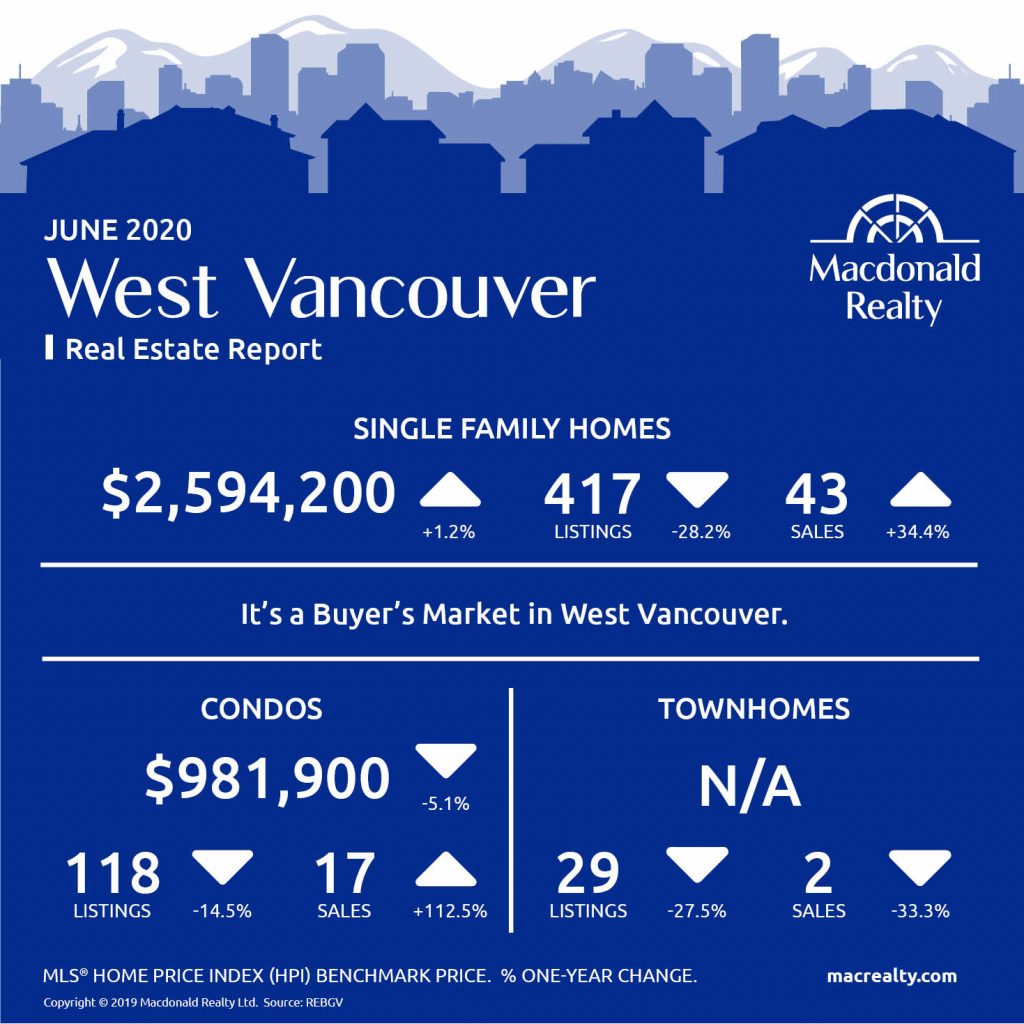
Here are the latest real estate market statistics from Macdonald Realty on the Greater Vancouver listings and sales in June 2020.
Find all the infographics by visiting the Facebook Album.
According to the Real Estate Board of Greater Vancouver, “home buyers and sellers have gradually become more active in each month of the COVID-19 pandemic. In June, home sale and listing activity in Metro Vancouver* returned to more historically typical levels. The Real Estate Board of Greater Vancouver (REBGV) reports that residential home sales in the region totalled 2,443 in June 2020, a 17.6% increase from the 2,077 sales recorded in June 2019, and a 64.5% increase from the 1,485 homes sold in May 2020. Last month’s sales were 21.9% below the 10-year June sales average.
“REALTORS® continue to optimize new technology tools and practices to help their clients meet their housing needs in a safe and responsible way. Over the last three months, home buyers and sellers have become more comfortable operating within the physical distancing and other safety protocols in place.”
“Much more of the real estate transaction is happening virtually today. Before considering an in-person showing, REALTORS® are helping potential buyers pre-screen homes more thoroughly by taking video tours, reviewing floorplans and an increased number of high-resolution images, as well as often driving through the neighborhood.”
Colette Gerber, REBGV Chair
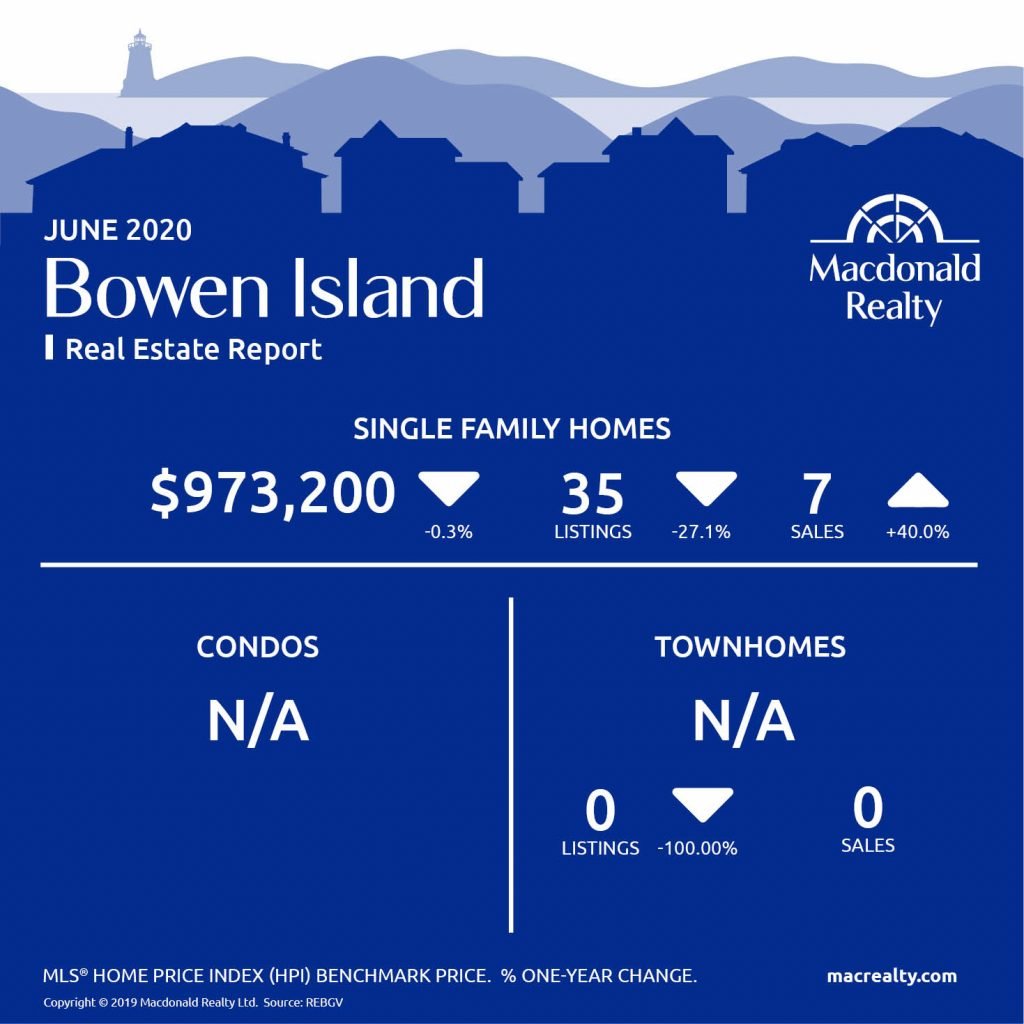
Bowen Island
Burnaby East
Burnaby North
Burnaby South
Coquitlam
Ladner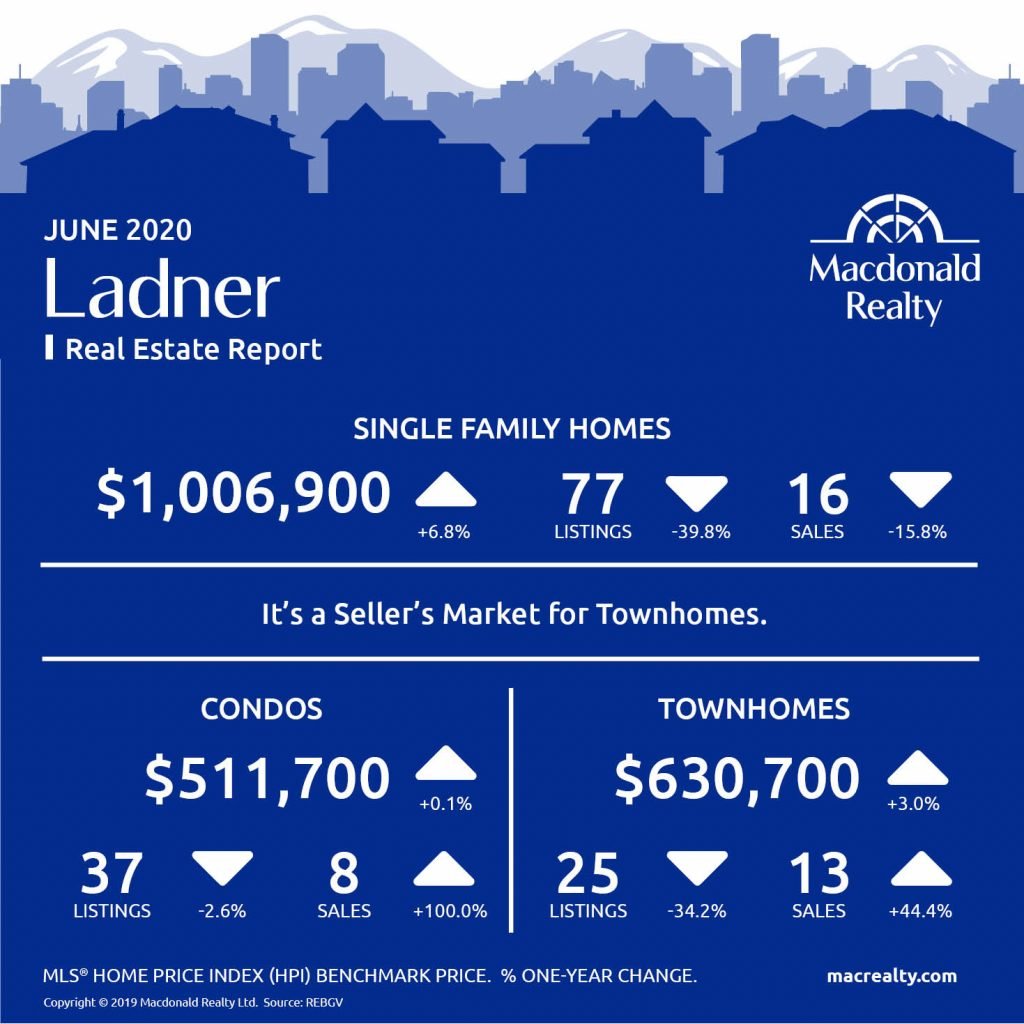
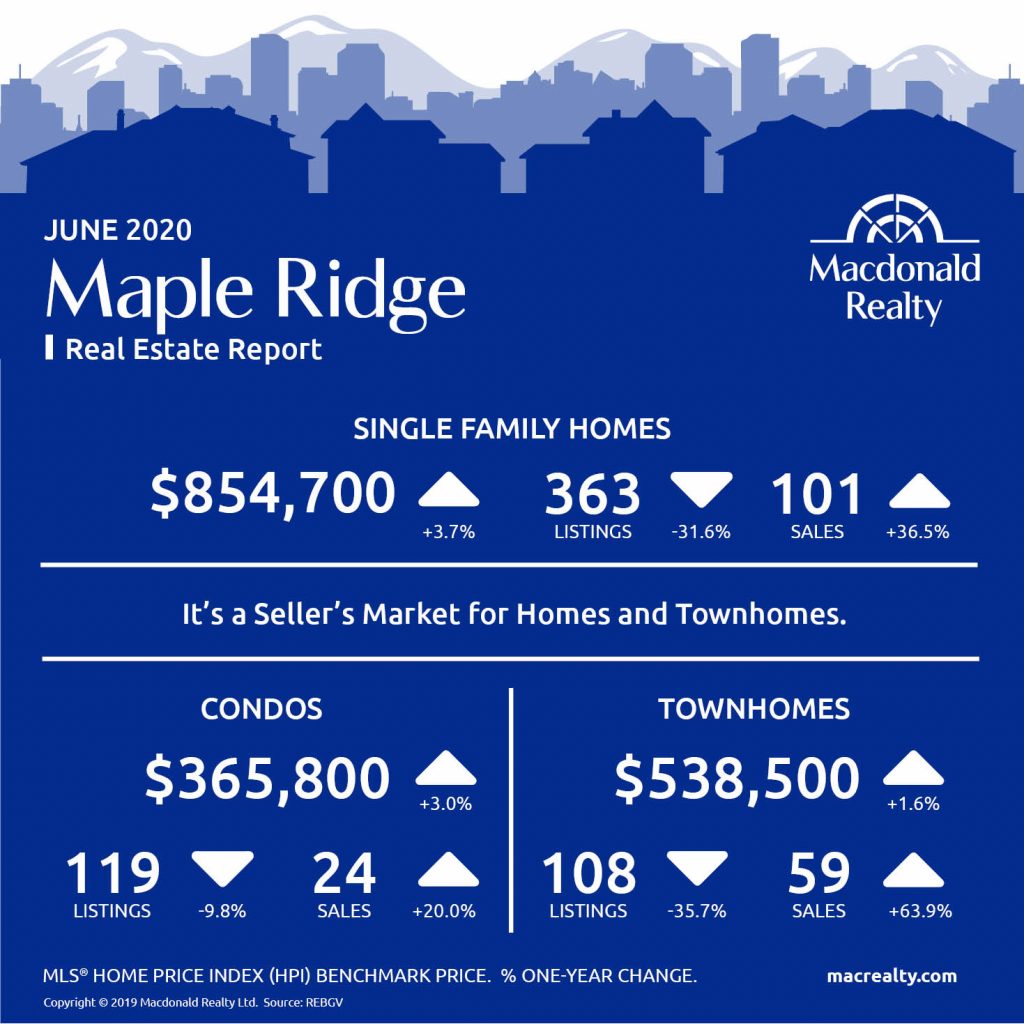
Maple Ridge
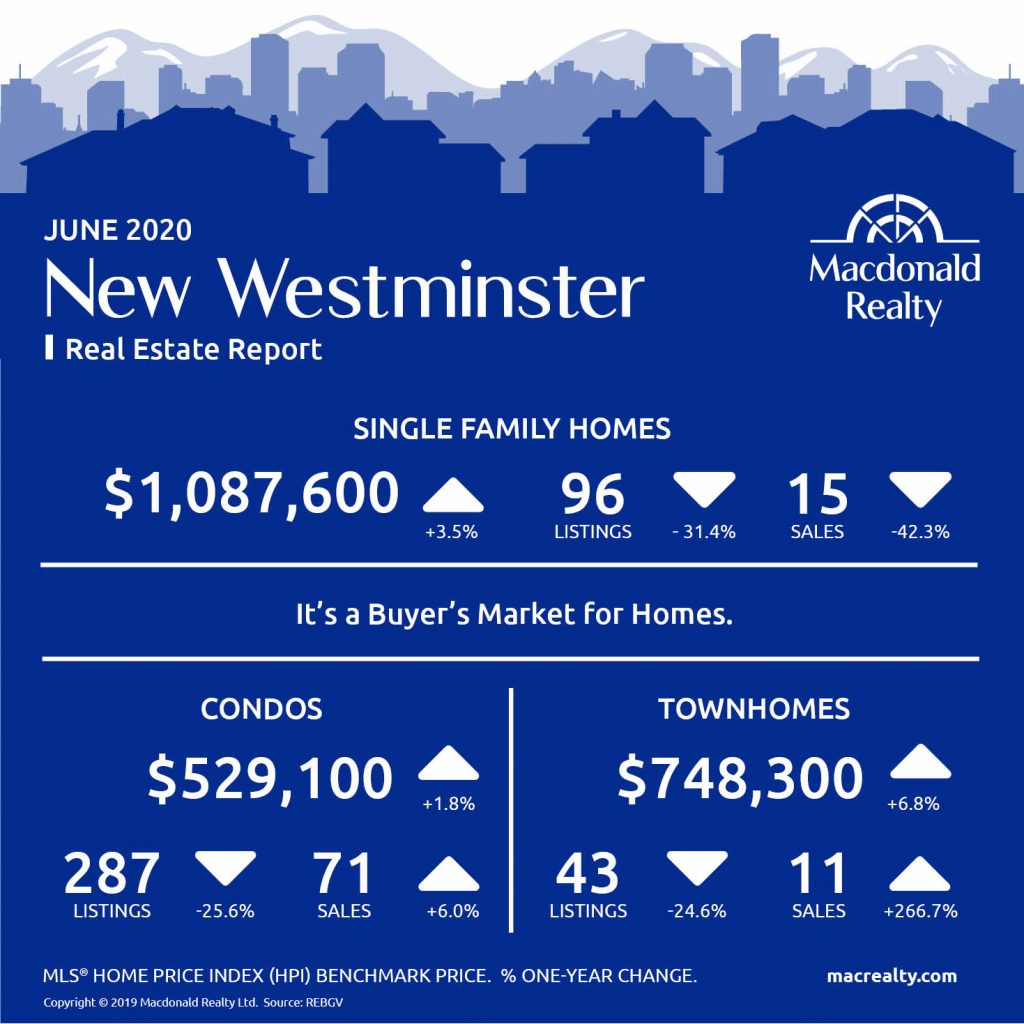
New Westminster
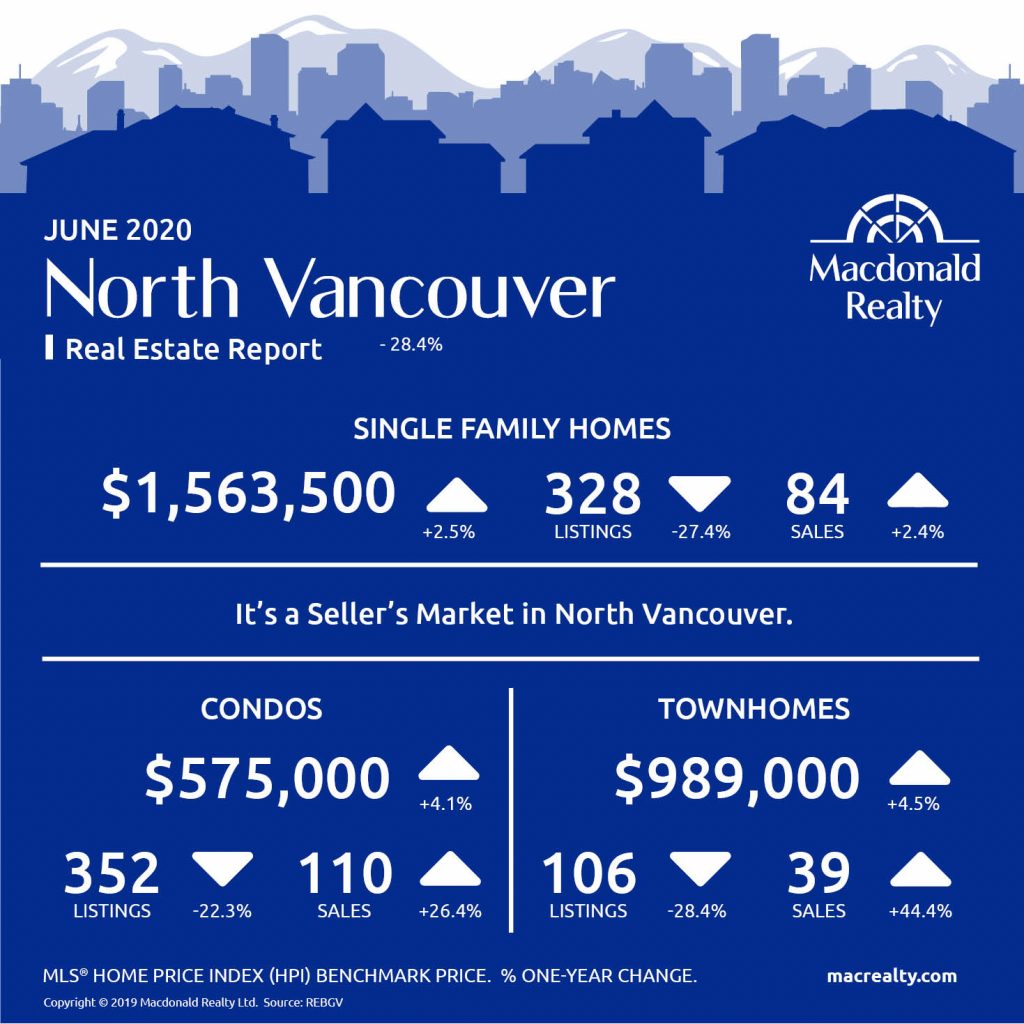
North Vancouver
Pitt Meadows
Port Coquitlam
Port Moody
Richmond
Tsawwassen

Vancouver East
Vancouver West
West Vancouver
Looking for more information about the real estate market in specific neighbourhoods in the Greater Vancouver?
Macdonald Realty has offices across the Greater Vancouver. Please email [email protected] or call 1-877-278-3888 to be matched with a REALTOR® working in your area.
MLS® Home Price Index (HPI) Benchmark Price
Average and median home prices are often misinterpreted, are affected by change in the mix of homes sold, and can swing dramatically from month to month (based on the types and prices of properties that sold in a given month). The MLS® HPI overcomes these shortcomings and uses the concept of a benchmark home, a notional home with common attributes of typical homes in a defined area. Visit www.housepriceindex.ca for more information.
This blog post is based on market data provided by the Real Estate Board of Greater Vancouver (REBGV) www.rebgv.org
by Macrealty Marketing Team | Jun 5, 2020 | Market Updates
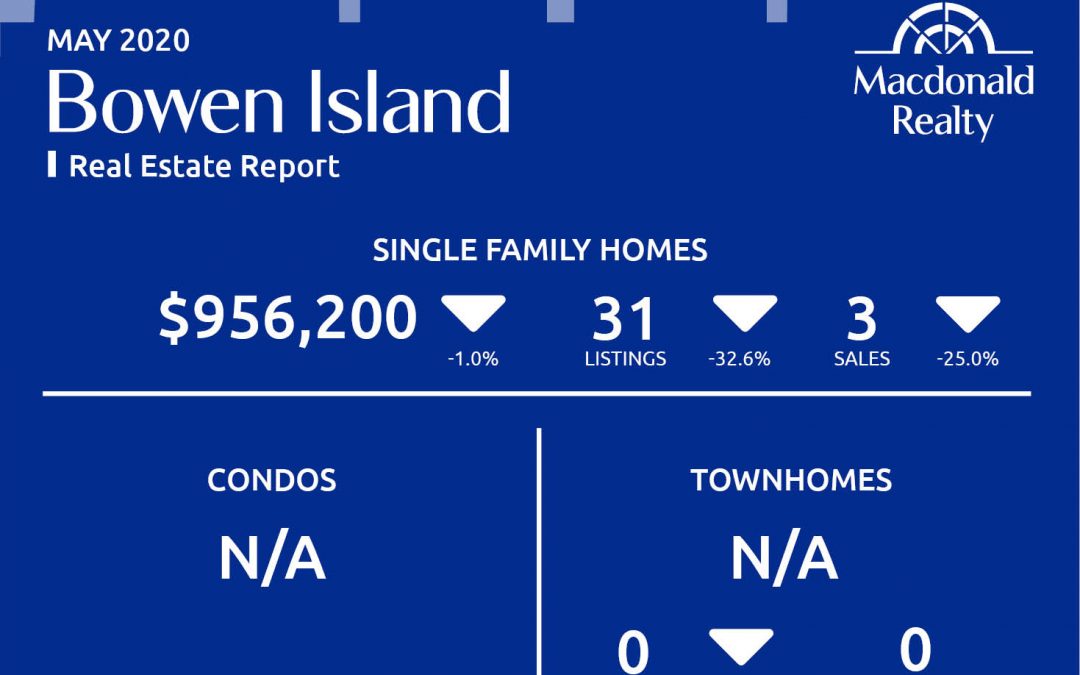
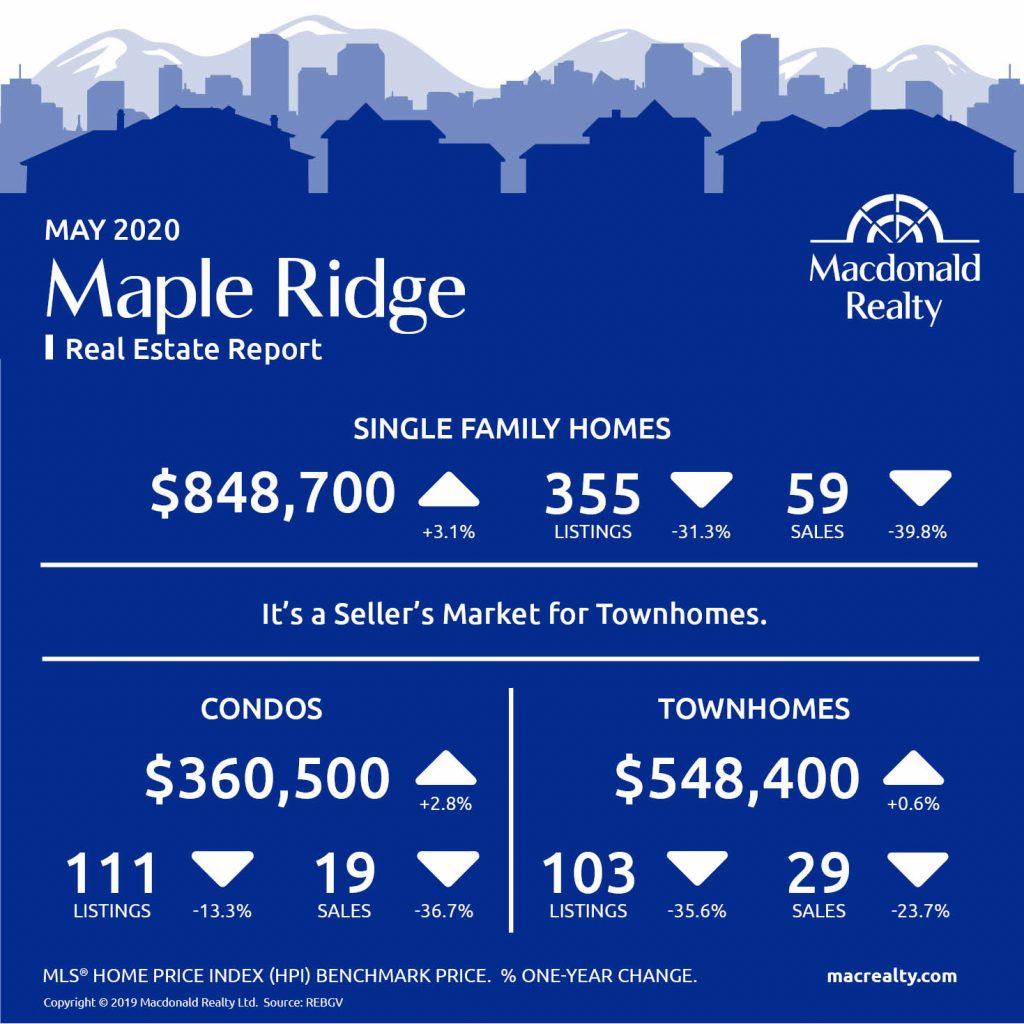
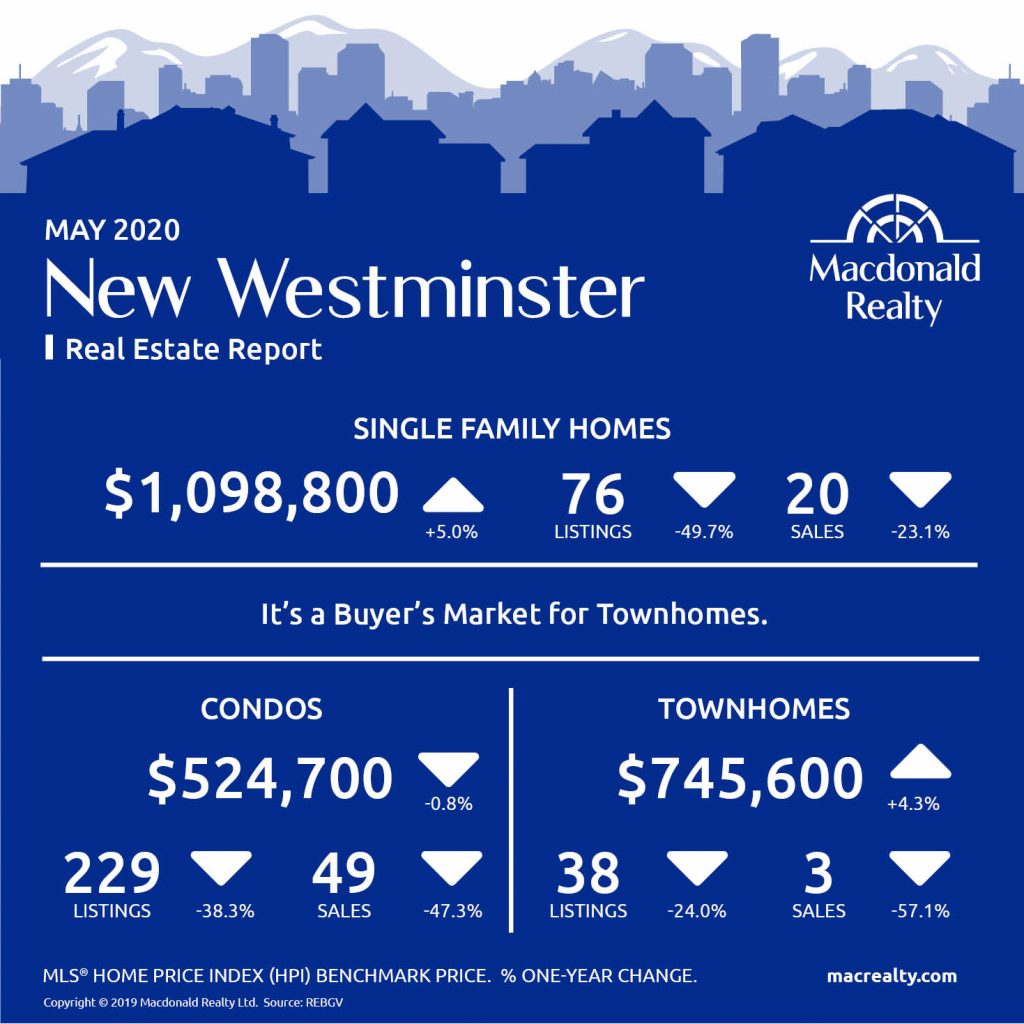
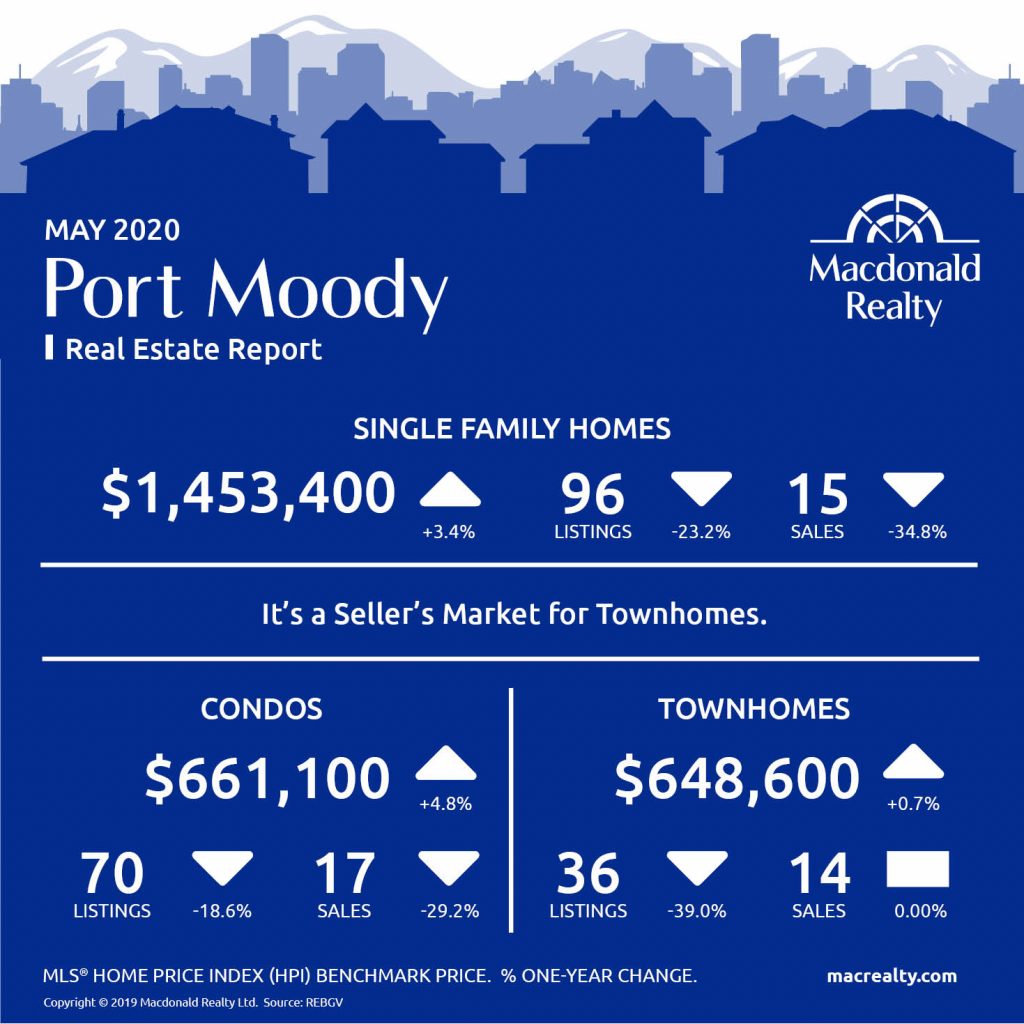
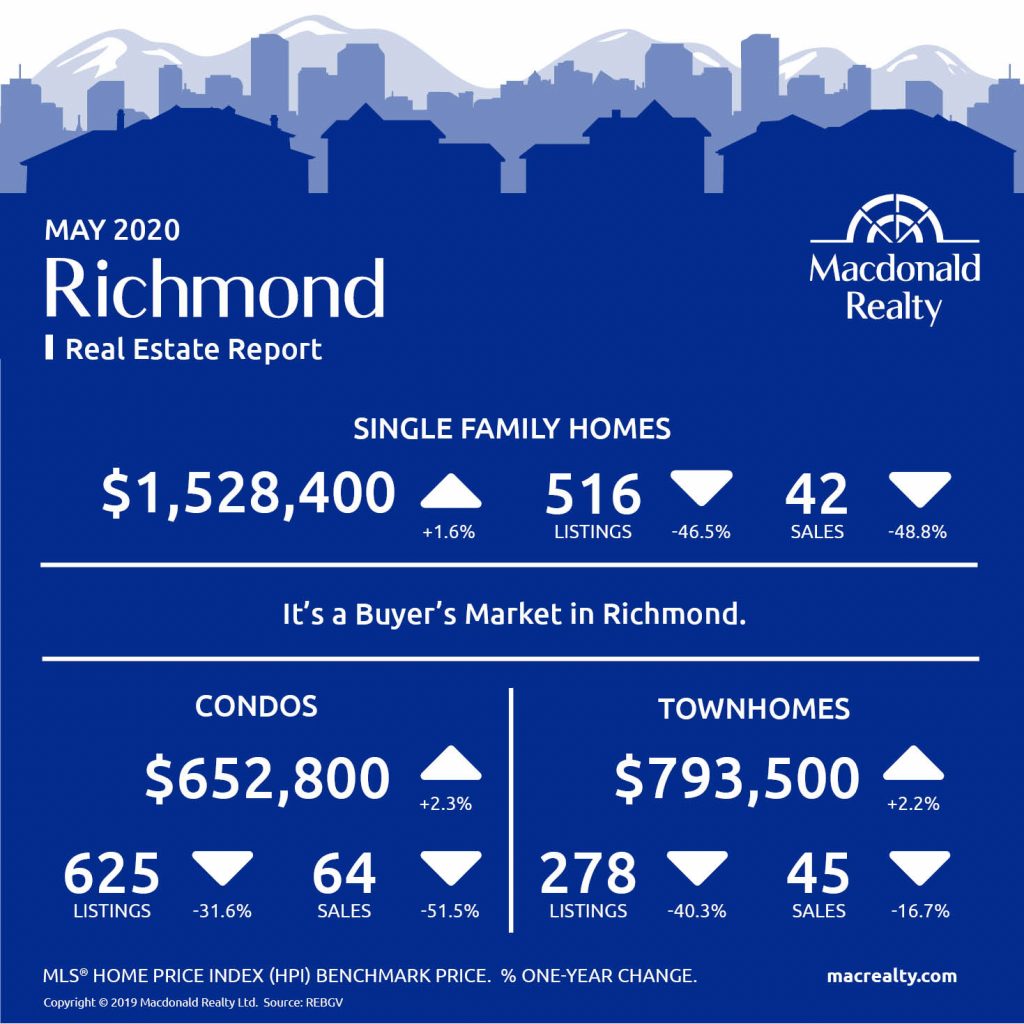
Here are the latest real estate market statistics from Macdonald Realty on the Greater Vancouver listings and sales in May 2020.
“Home prices have been stable during the COVID-19 period,” Colette Gerber, REBGV Chair said. “While we’re seeing a variety of long-term projections for the market, it’s critical to understand the facts and trends as they emerge.”
Find all the infographics by visiting the Facebook Album.
Bowen Island
Bowen Island had 3 sales and 31 active listings for detached homes at the end of the month. The benchmark sales price was $956,200.

Burnaby East
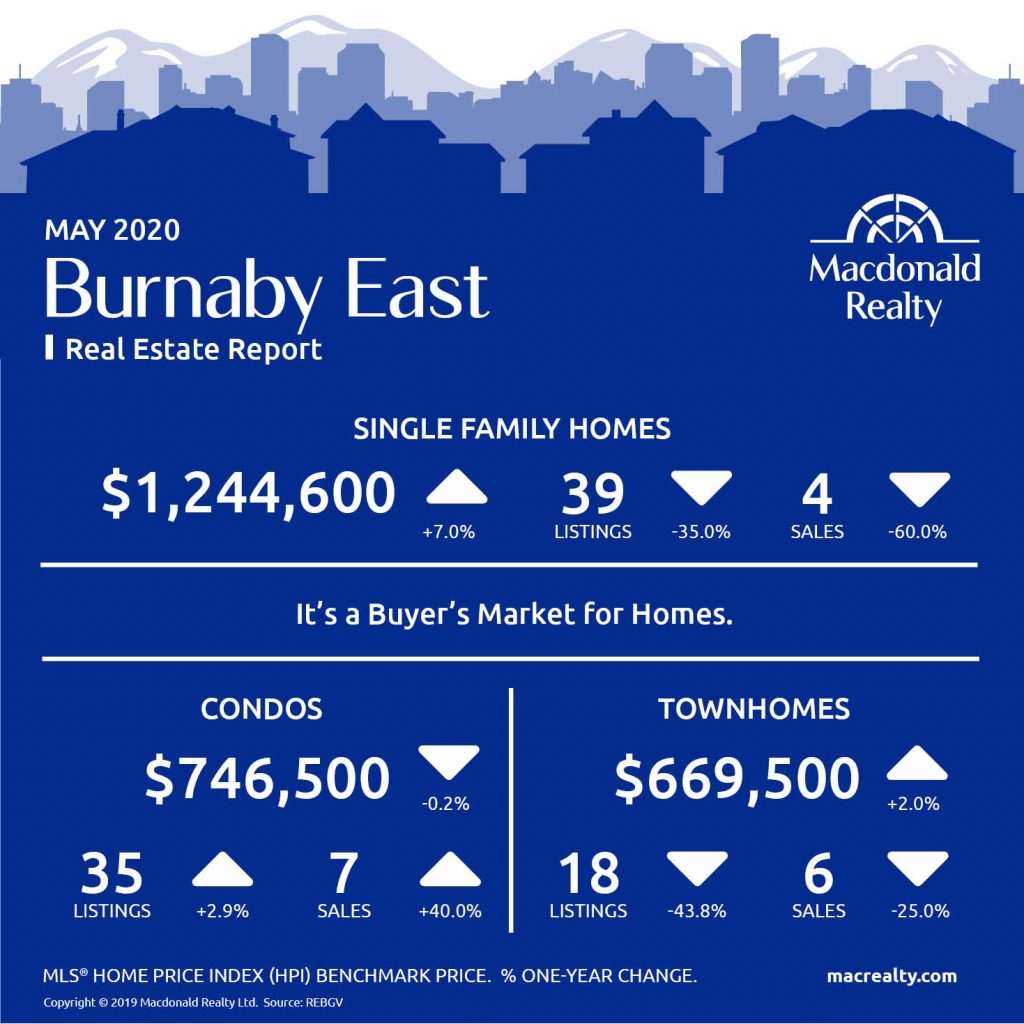
Burnaby East had 4 sales and 39 active listings for detached homes at the end of the month. The benchmark sales price was $1,244,600.
The condo market featured 7 sales, 35 active listings, and a benchmark sales price was $746,500.
The townhome market had 6 sales and 18 active listings. The benchmark sale price was $669,500.
It’s a buyer’s market for homes in Burnaby East.
Burnaby North
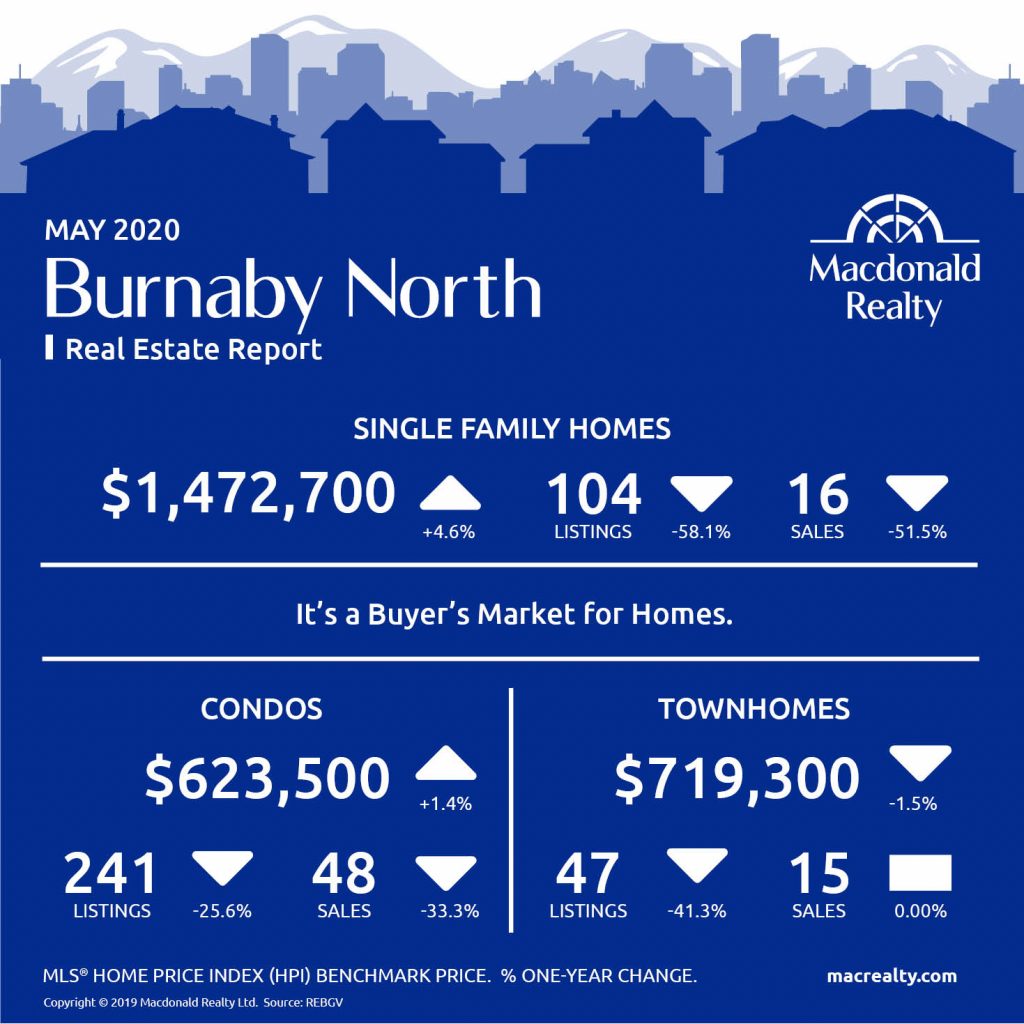
Burnaby North had 16 sales and 104 active listings for detached homes at the end of the month. The benchmark sales price was $1,472,700.
The condo market featured 48 sales, 241 active listings, and a benchmark sales price was $623,500.
The townhome market had 15 sales and 47 active listings. The benchmark sale price was $719,300.
It’s a buyer’s market for homes in Burnaby North.
Burnaby South
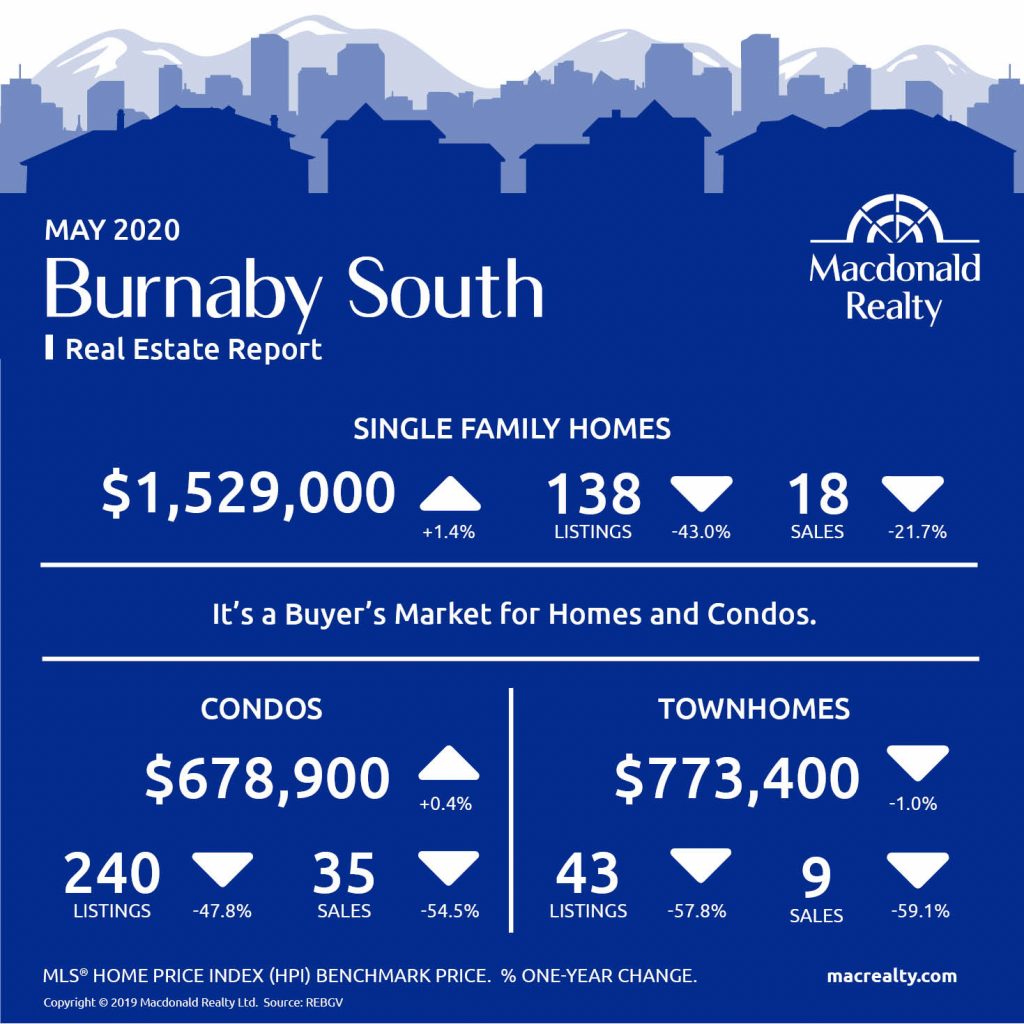
Burnaby South had 18 sales and 138 active listings for detached homes at the end of the month. The benchmark sales price was $1,529,000.
The condo market featured 35 sales, 240 active listings, and a benchmark sales price was $678,900.
The townhome market had 9 sales and 43 active listings. The benchmark sale price was $773,400.
It’s a buyer’s market for homes and condos in Burnaby South.
Coquitlam

Ladner
Maple Ridge
New Westminster
North Vancouver

Pitt Meadows

Port Coquitlam

Port Moody
Richmond
Tsawwassen
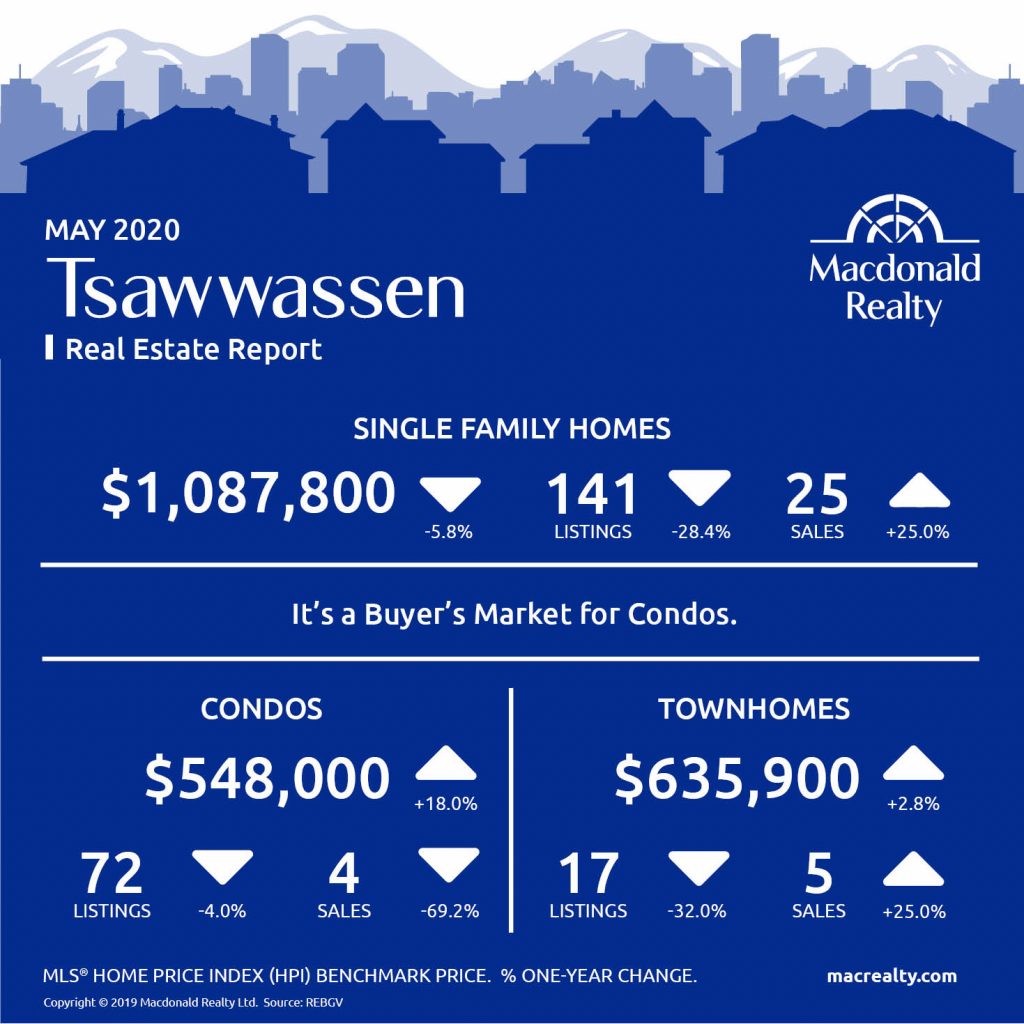
Vancouver East

Vancouver West
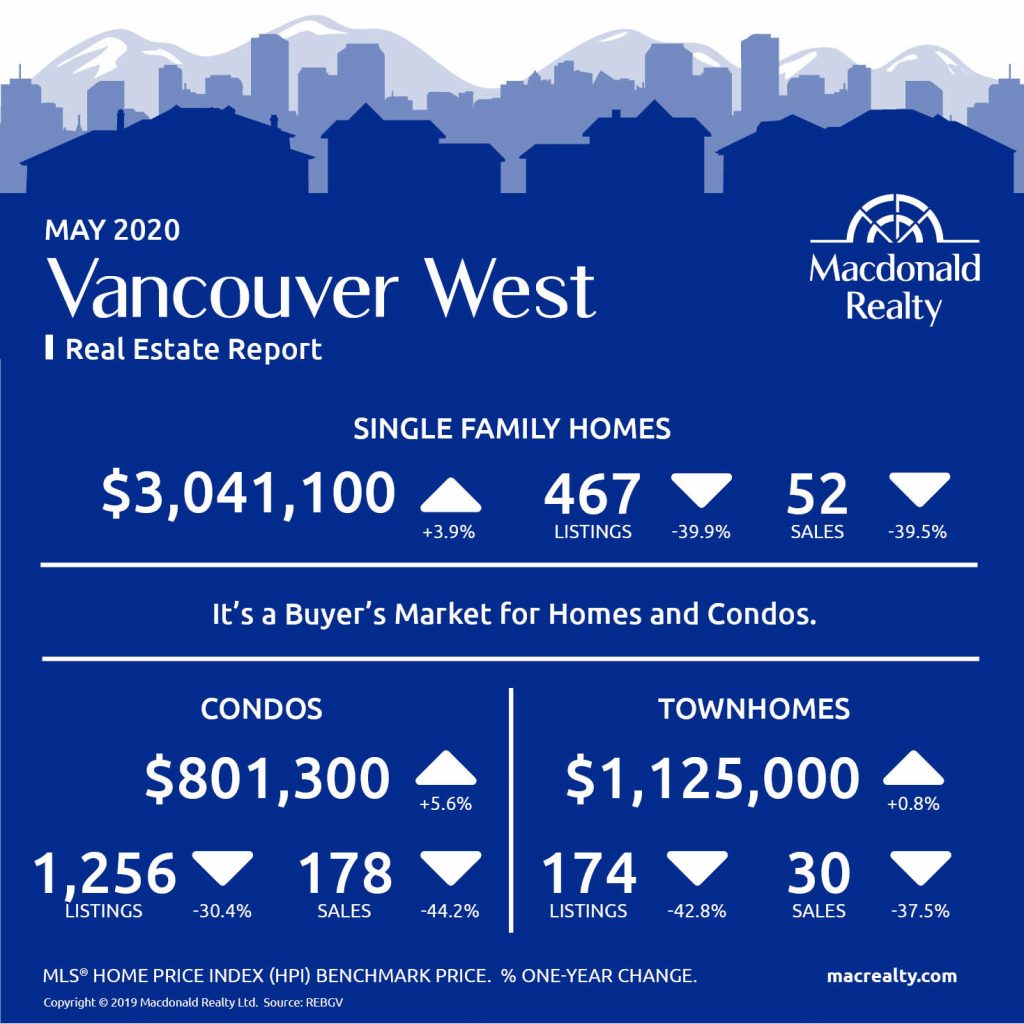
West Vancouver

Looking for more information about the real estate market in specific neighbourhoods in the Greater Vancouver?
Macdonald Realty has offices across the Greater Vancouver. Please email [email protected] or call 1-877-278-3888 to be matched with a REALTOR® working in your area.
MLS® Home Price Index (HPI) Benchmark Price
Average and median home prices are often misinterpreted, are affected by change in the mix of homes sold, and can swing dramatically from month to month (based on the types and prices of properties that sold in a given month). The MLS® HPI overcomes these shortcomings and uses the concept of a benchmark home, a notional home with common attributes of typical homes in a defined area. Visit www.housepriceindex.ca for more information.
This blog post is based on market data provided by the Real Estate Board of Greater Vancouver (REBGV) www.rebgv.org
by Macrealty Marketing Team | May 6, 2020 | Market Updates
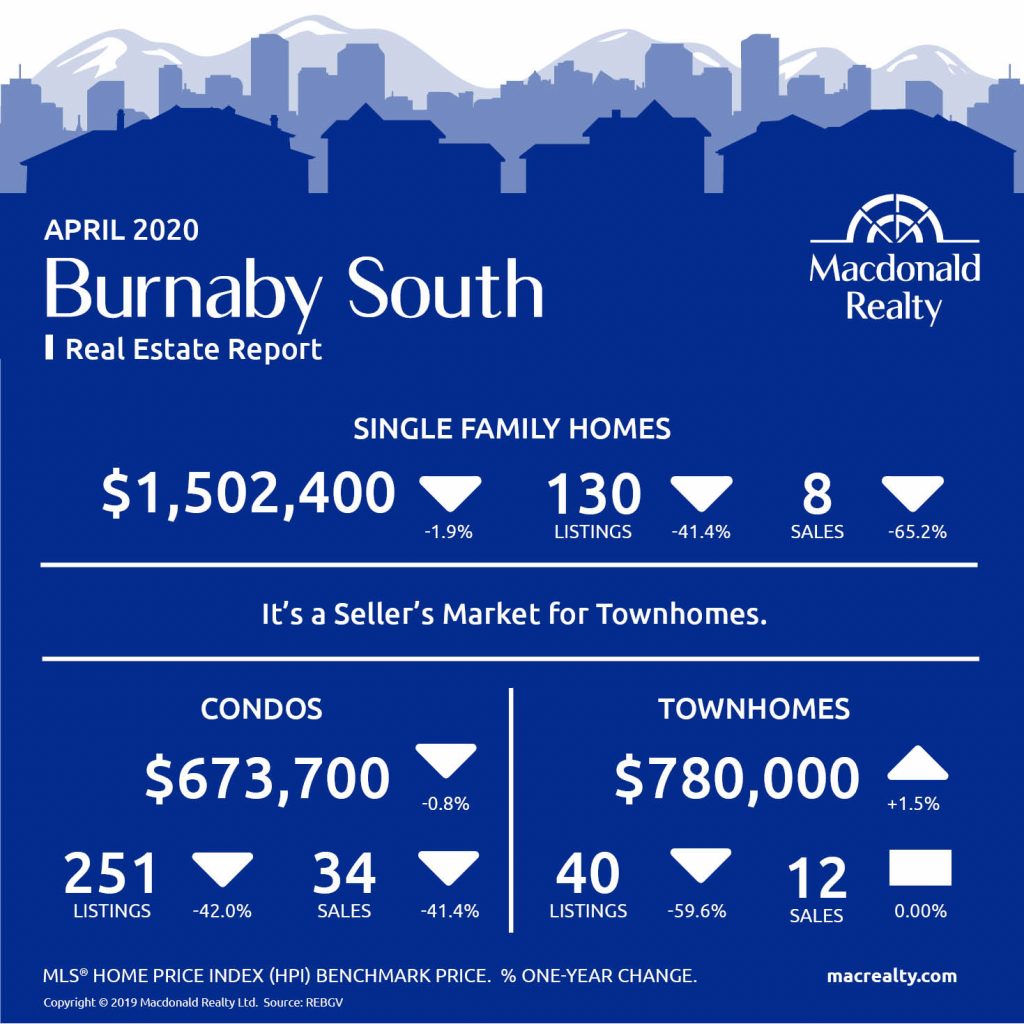
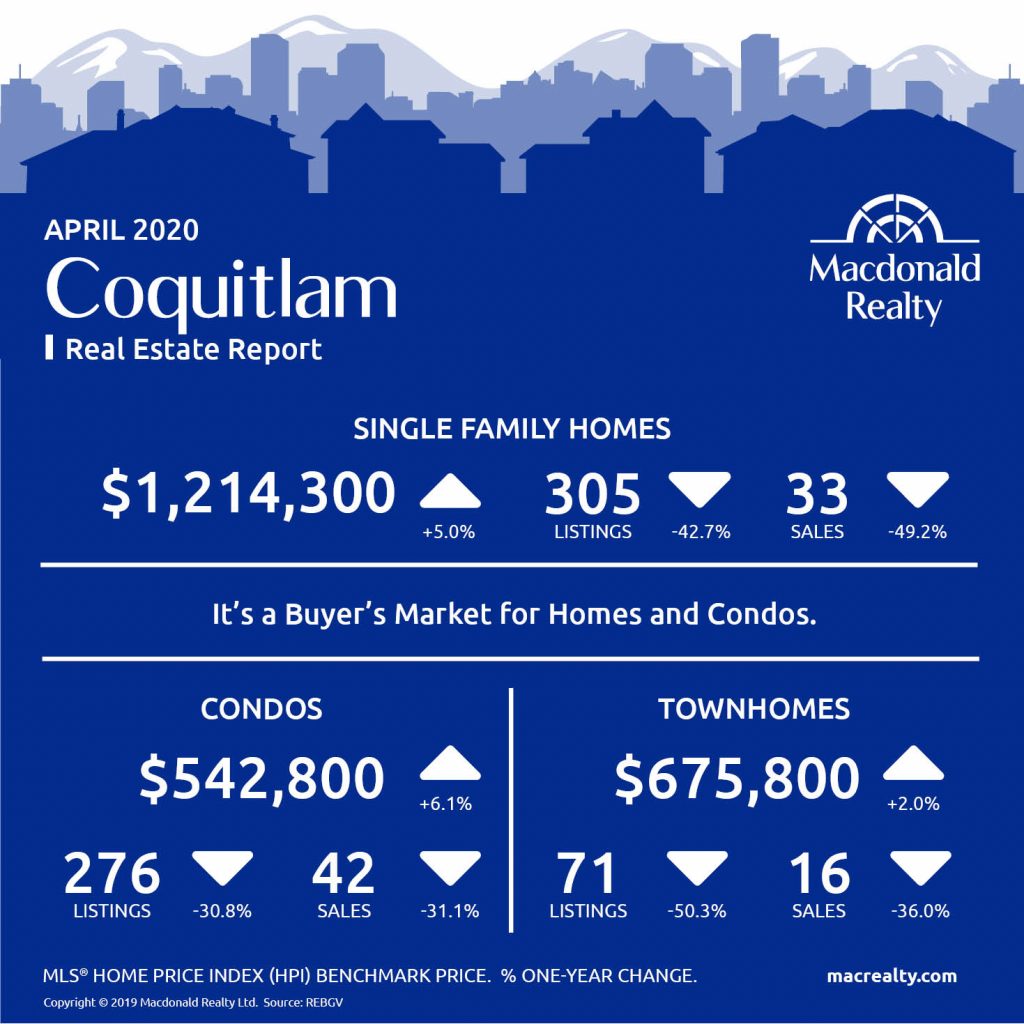
Here are the latest real estate market statistics from Macdonald Realty on the Greater Vancouver listings and sales in April 2020.
“Predictably, the number of home sales and listings declined in April given the physical distancing measures in place,” Colette Gerber, REBGV’s president-elect said. “People are, however, adapting. They’re working with their Realtors to get information, advice and to explore their options so that they’re best positioned in the market during and after this pandemic.”
Find all the infographics by visiting the Facebook Album.
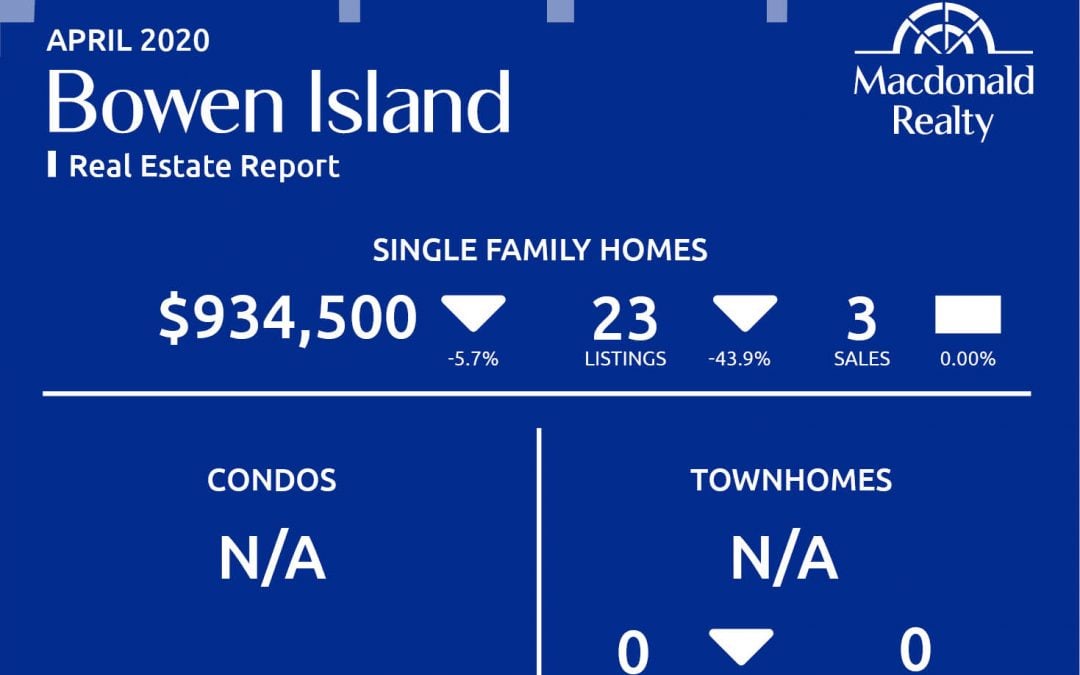
Bowen Island
Bowen Island had 3 sales and 23 active listings for detached homes at the end of the month. The benchmark sales price was $934,500.

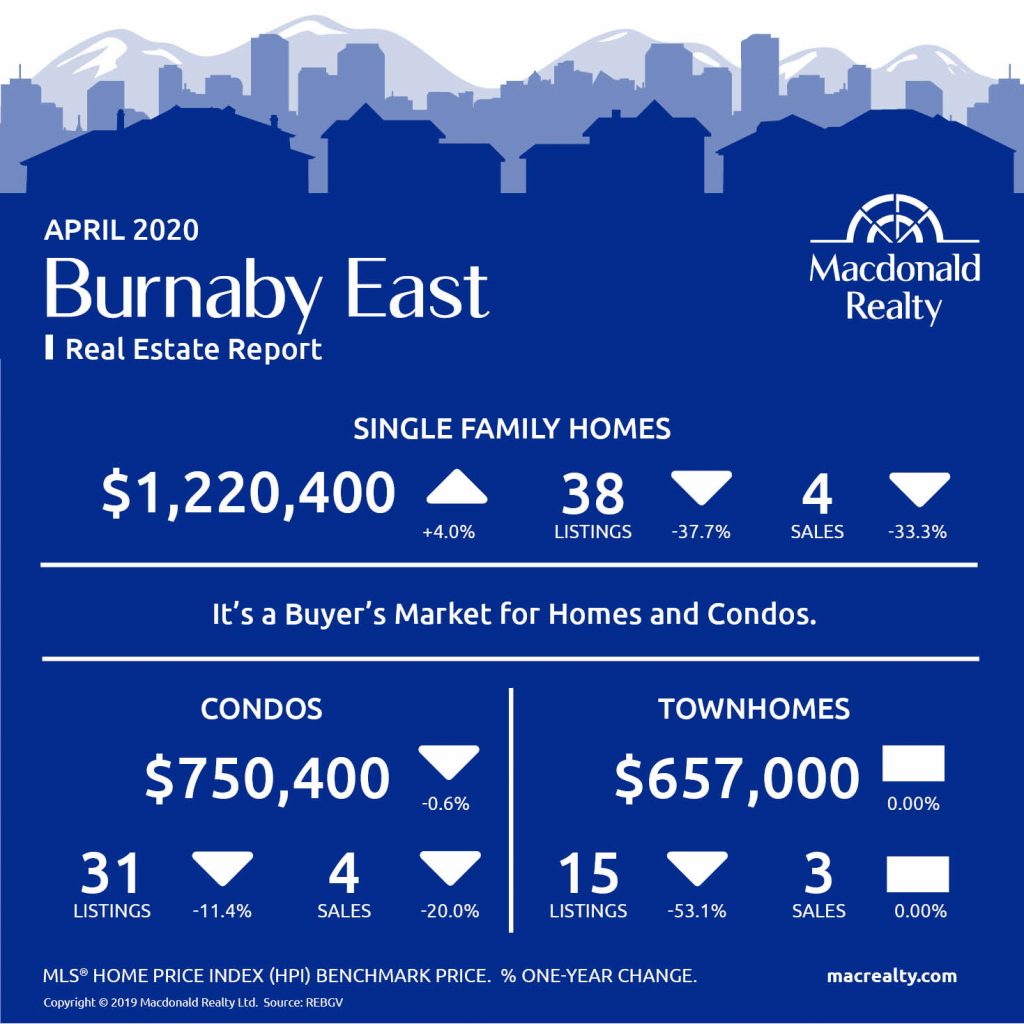
Burnaby East
Burnaby East had 4 sales and 38 active listings for detached homes at the end of the month. The benchmark sales price was $1,220,400.
The condo market featured 4 sales, 31 active listings, and a benchmark sales price was $750,400.
The townhome market had 3 sales and 15 active listings. The benchmark sale price was $657,000.
It’s a buyer’s market for Homes and Condos in Burnaby East.
Burnaby North
Burnaby North had 14 sales and 96 active listings for detached homes at the end of the month. The benchmark sales price was $1,470,100.
The condo market featured 19 sales, 240 active listings, and a benchmark sales price was $619,100.
The townhome market had 4 sales and 53 active listings. The benchmark sale price was $727,100.
It’s a buyer’s market for in Burnaby North.

Burnaby South
Coquitlam
Ladner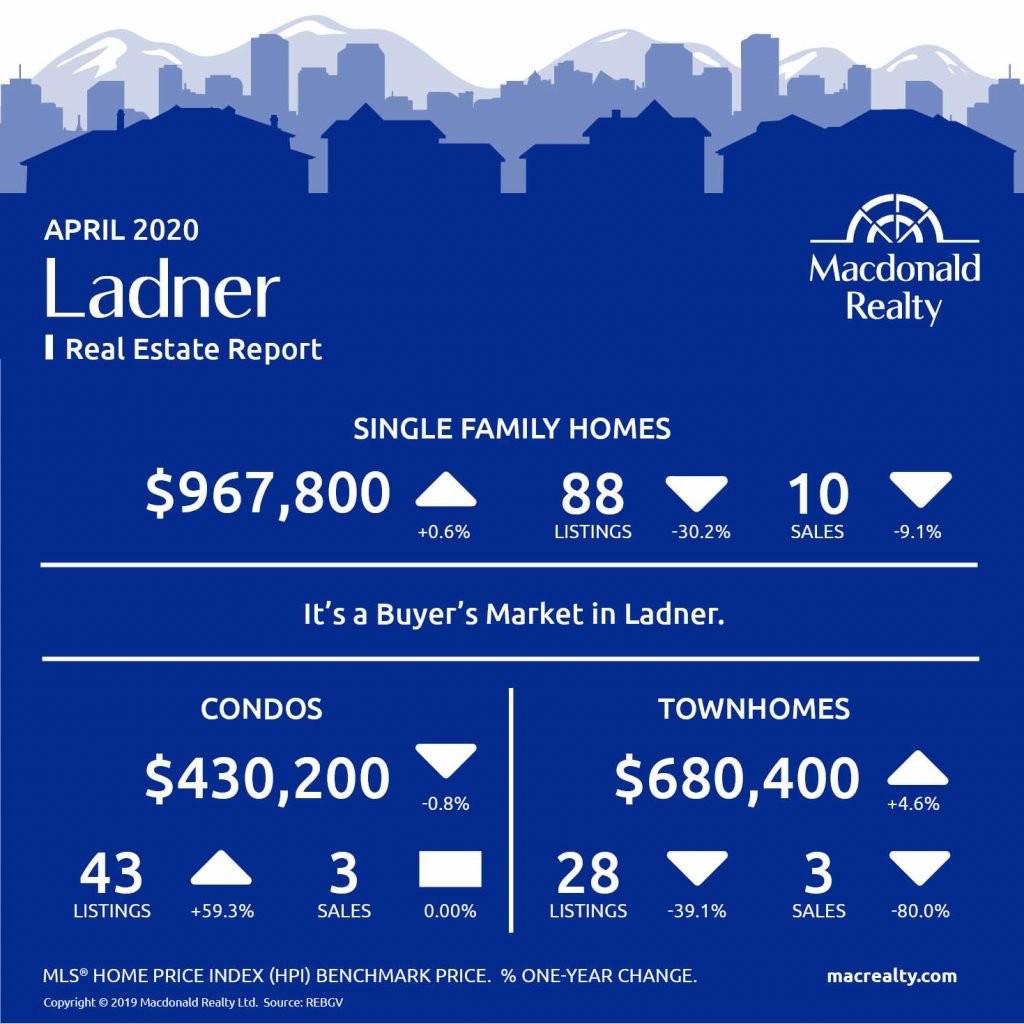
Maple Ridge
New Westminster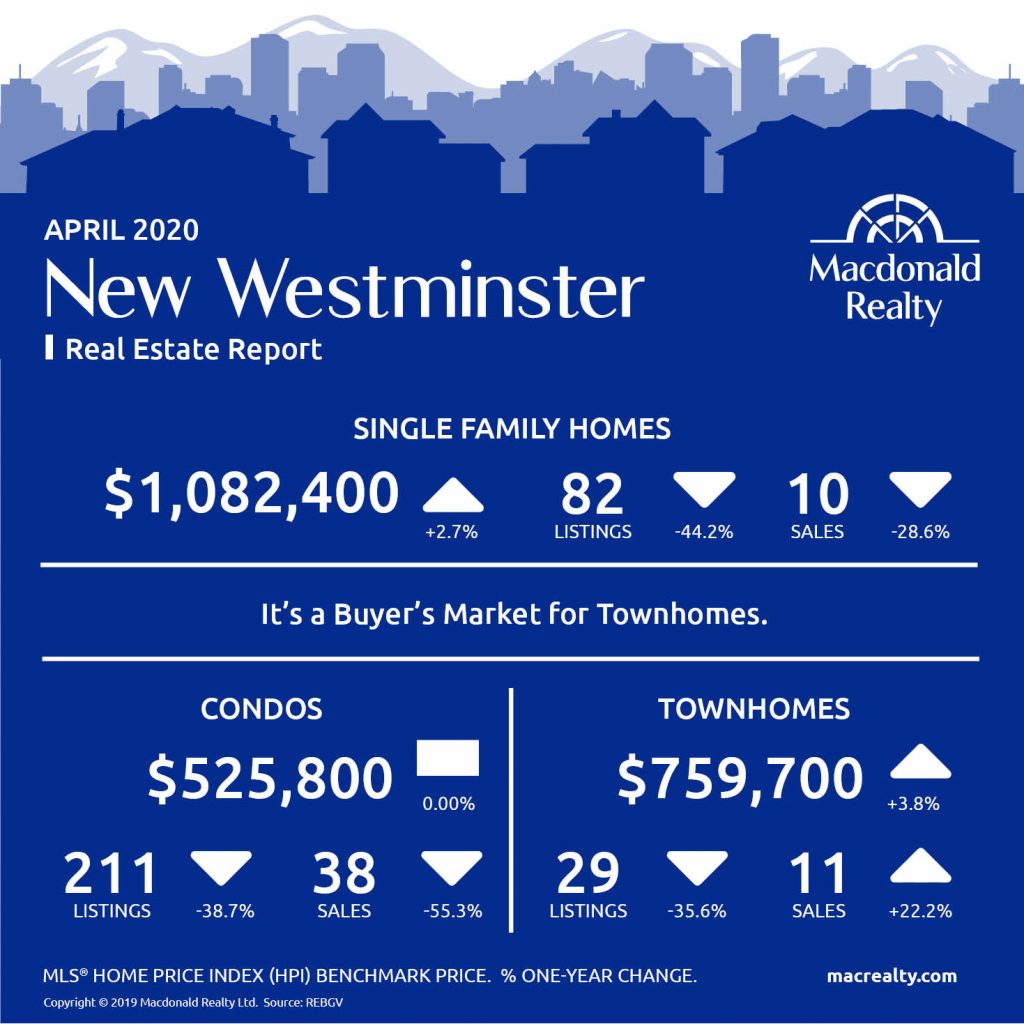
North Vancouver
Pitt Meadows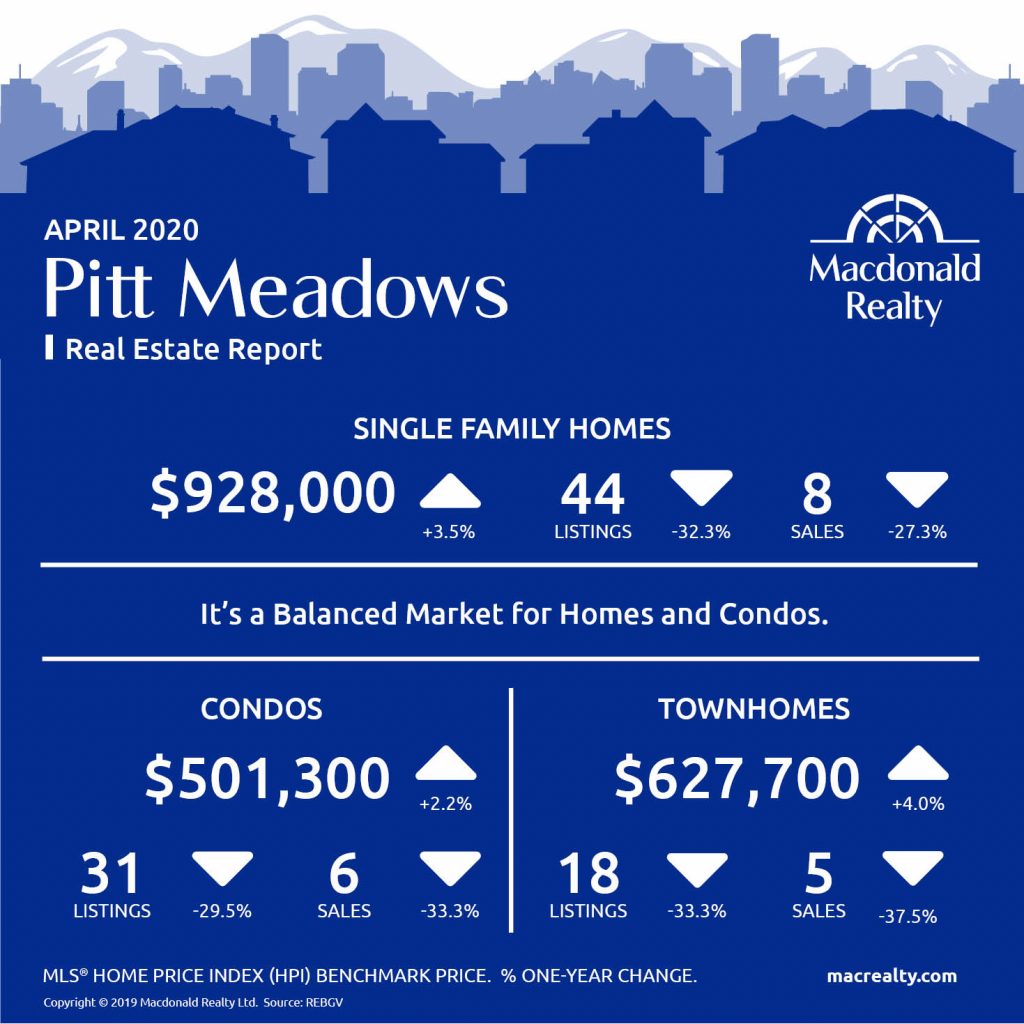
Port Coquitlam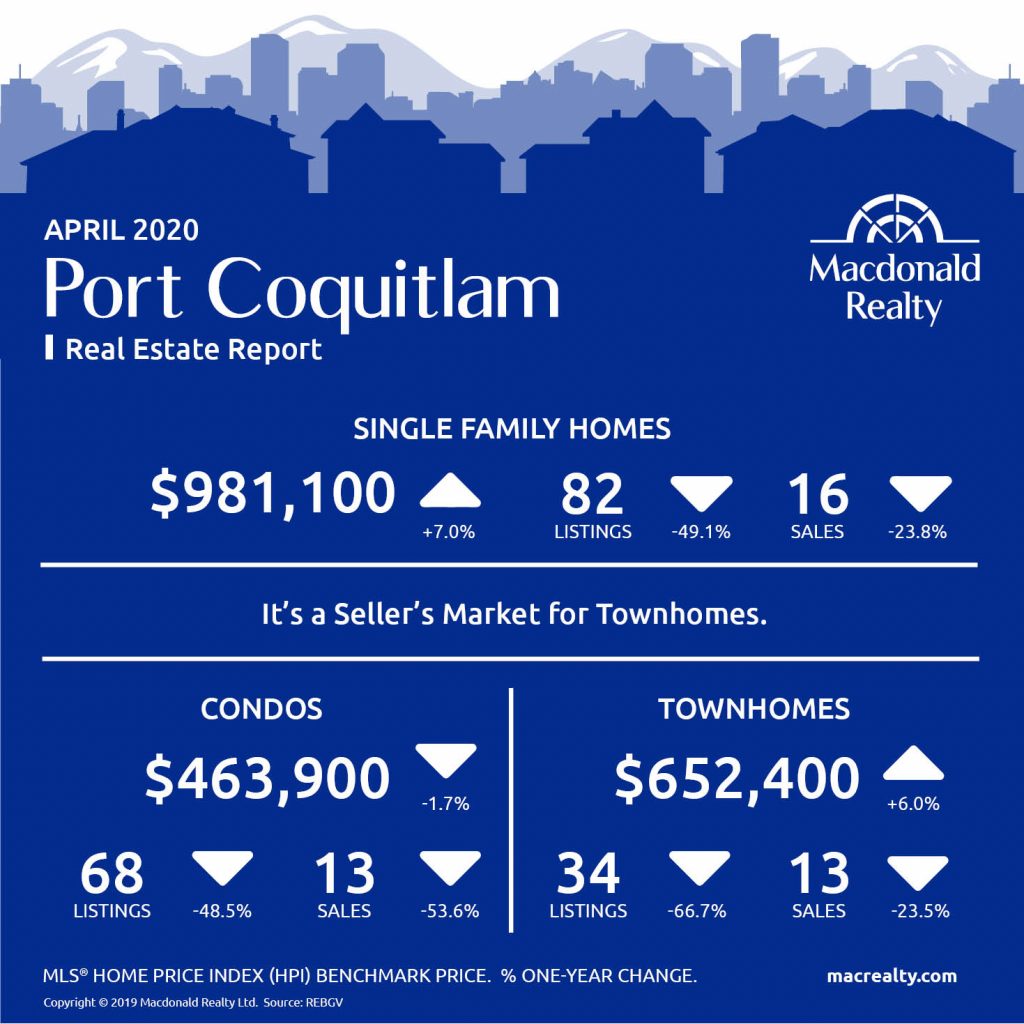
Port Moody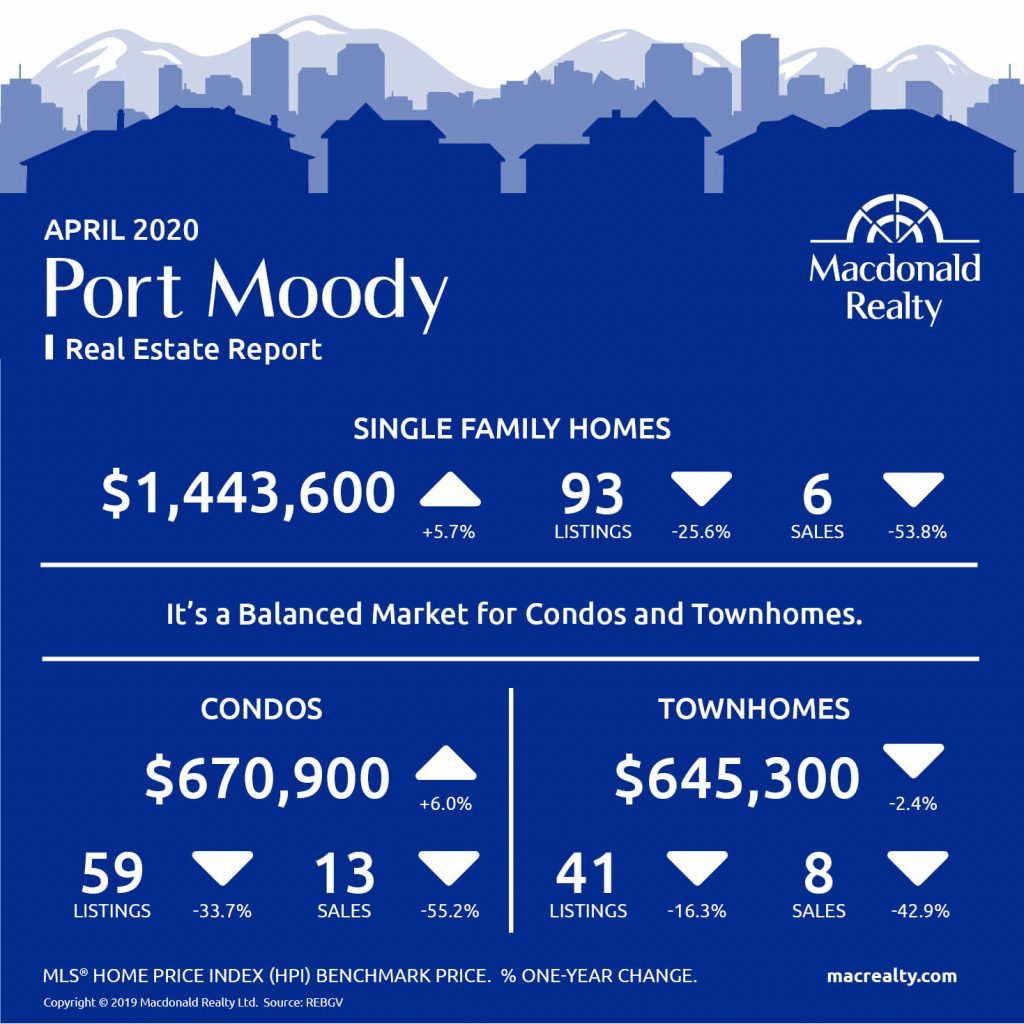
Richmond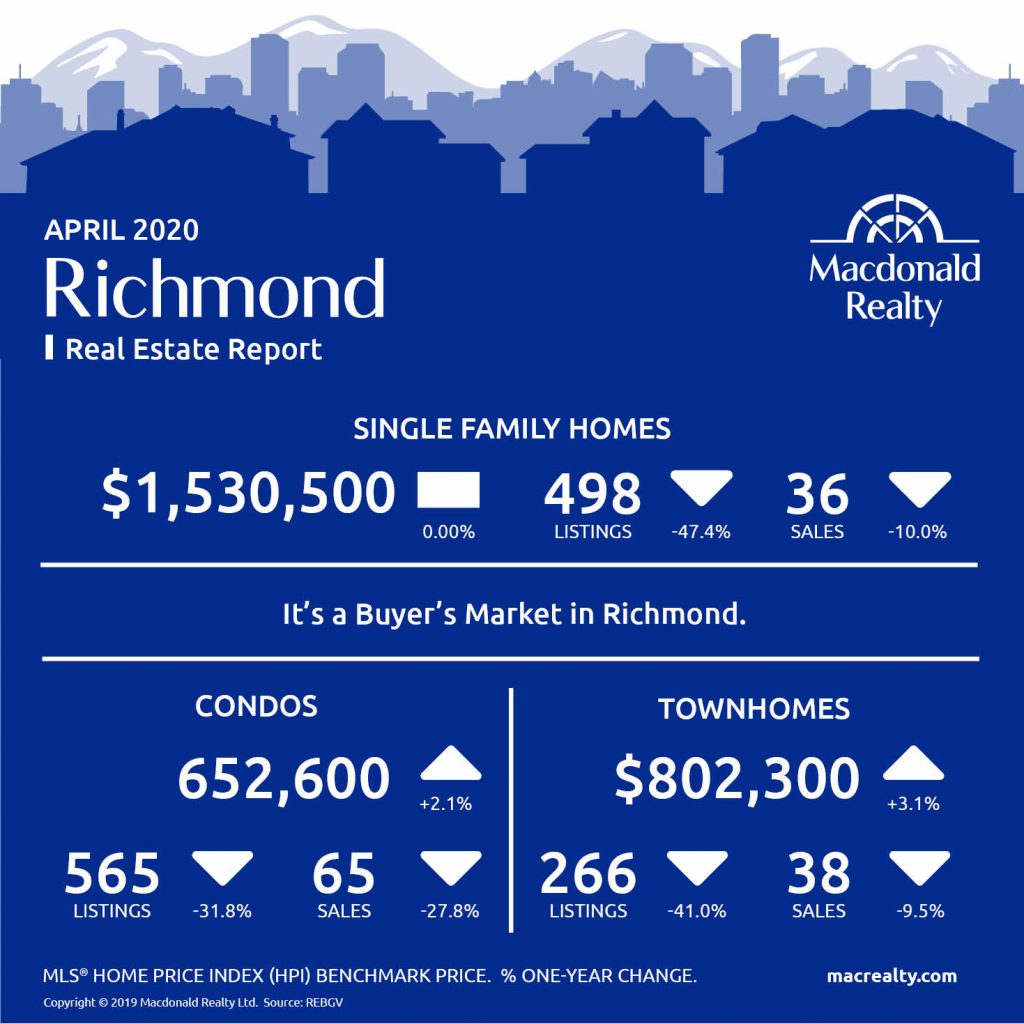
Tsawwassen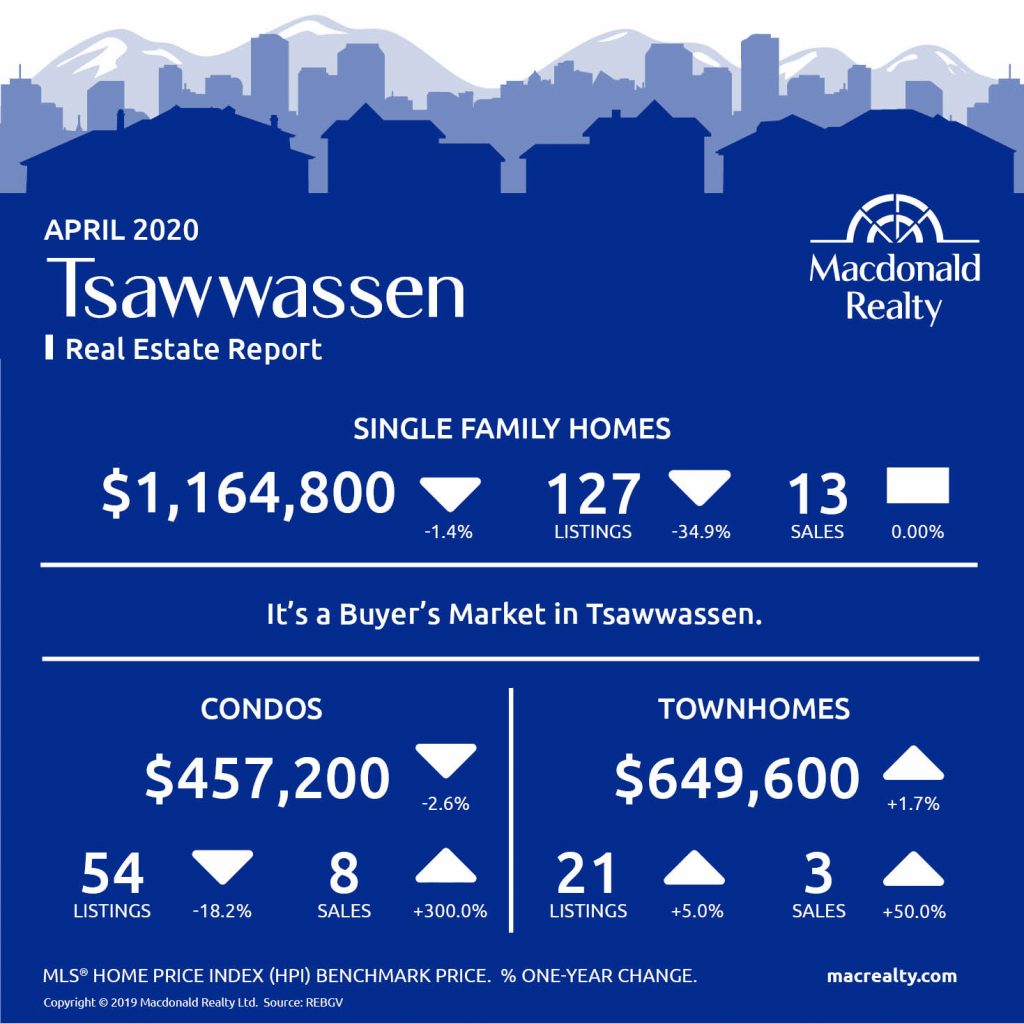
Vancouver East
Vancouver West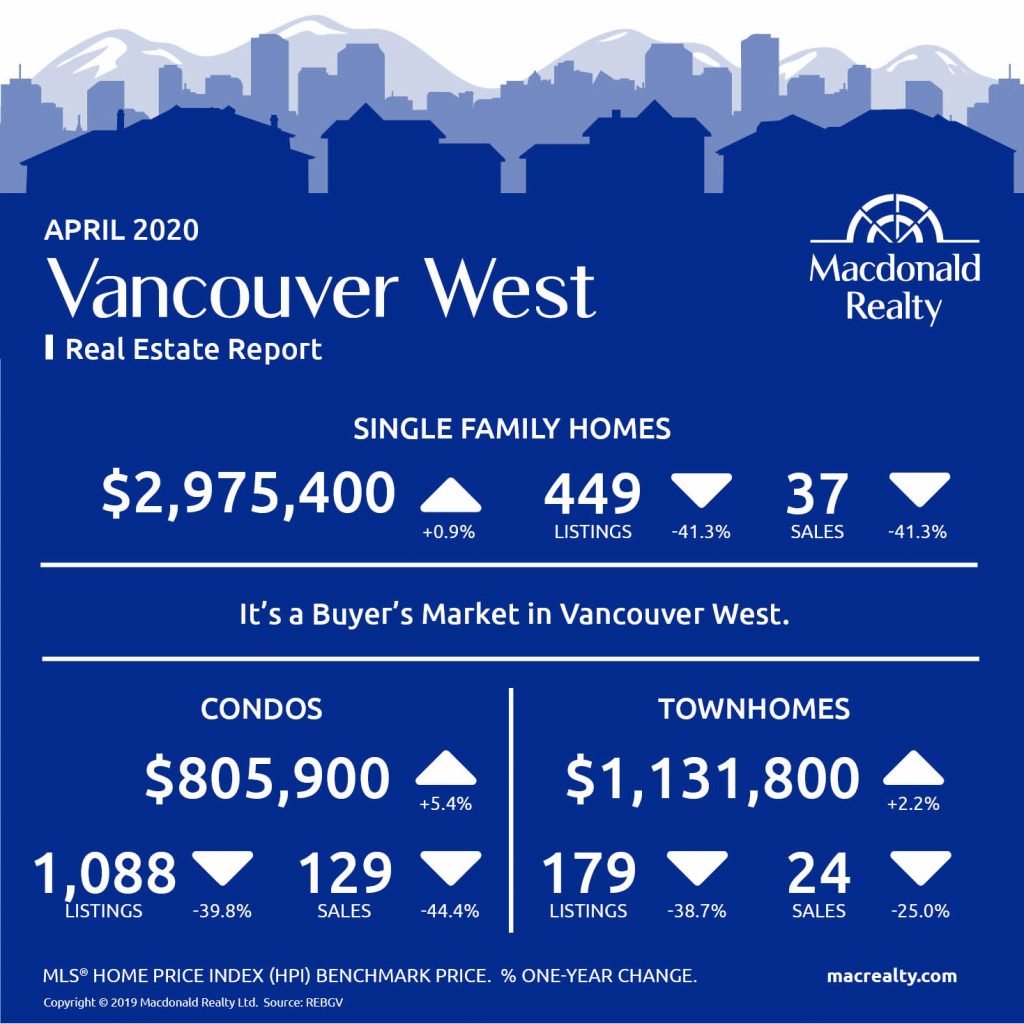
West Vancouver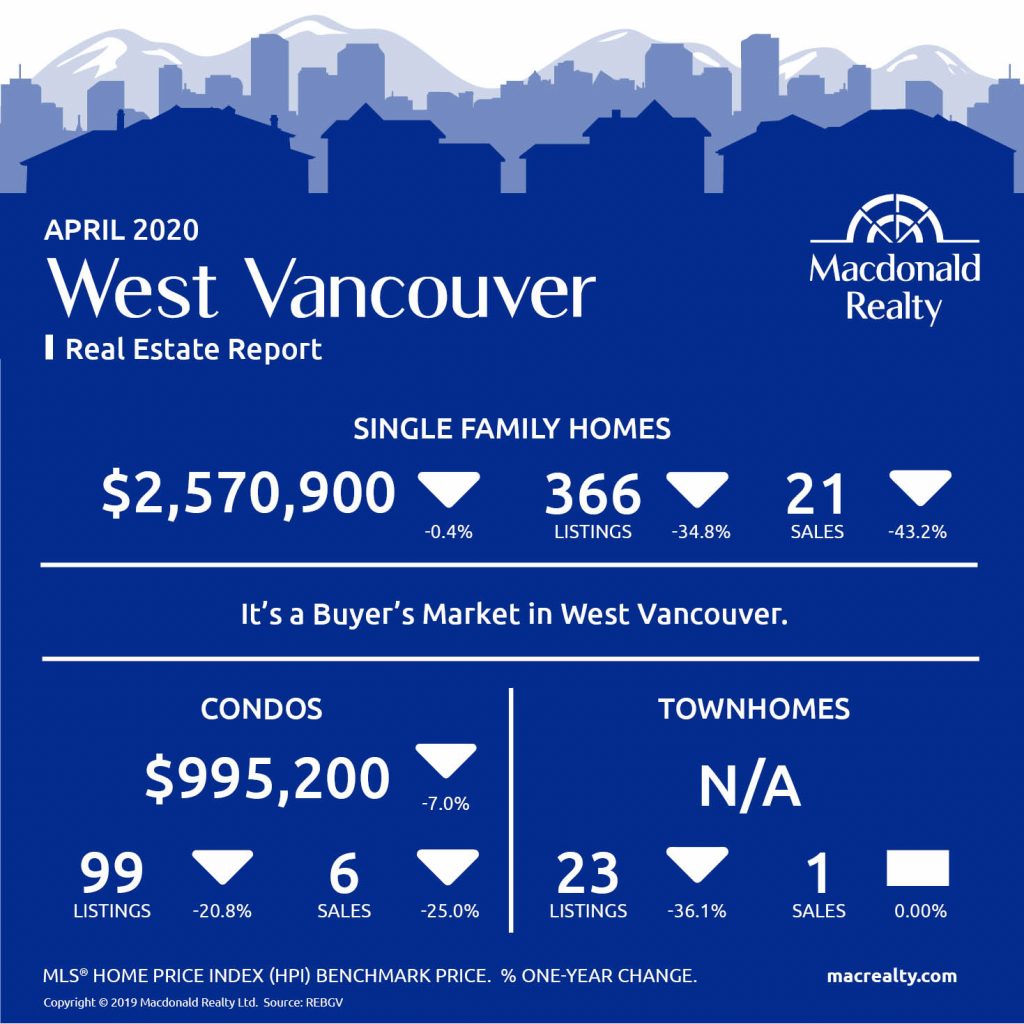
Looking for more information about the real estate market in specific neighbourhoods in the Greater Vancouver?
Macdonald Realty has offices across the Greater Vancouver. Please email [email protected] or call 1-877-278-3888 to be matched with a REALTOR® working in your area.
MLS® Home Price Index (HPI) Benchmark Price
Average and median home prices are often misinterpreted, are affected by change in the mix of homes sold, and can swing dramatically from month to month (based on the types and prices of properties that sold in a given month). The MLS® HPI overcomes these shortcomings and uses the concept of a benchmark home, a notional home with common attributes of typical homes in a defined area. Visit www.housepriceindex.ca for more information.
This blog post is based on market data provided by the Real Estate Board of Greater Vancouver (REBGV) www.rebgv.org

