by Macrealty Marketing Team | Apr 7, 2020 | Market Updates
Here are the latest real estate market statistics from Macdonald Realty on the Greater Vancouver listings and sales in March 2020.
The Real Estate Board of Greater Vancouver (REBGV) reports that residential home sales in the region totalled 2,524 in March 2020, a 46.1% increase from the 1,727 sales recorded in March 2019, and a 17.4% increase from the 2,150 homes sold in February 2020.
Ashley Smith, REBGV president said:
“The first two weeks of the month were the busiest days of the year for our region with heightened demand and multiple offers becoming more common. Like other aspects of our lives, this changed as concerns over the COVID-19 situation in our province grew.”
Areas covered by the Real Estate Board of Greater Vancouver include Burnaby, Coquitlam, Maple Ridge, New Westminster, North Vancouver, Pitt Meadows, Port Coquitlam, Port Moody, Richmond, South Delta, Squamish, Sunshine Coast, Vancouver, West Vancouver, and Whistler.
Please check out the infographics for Squamish, Sunshine Coast and Whistler here.
Find all the infographics by visiting our Facebook Album.
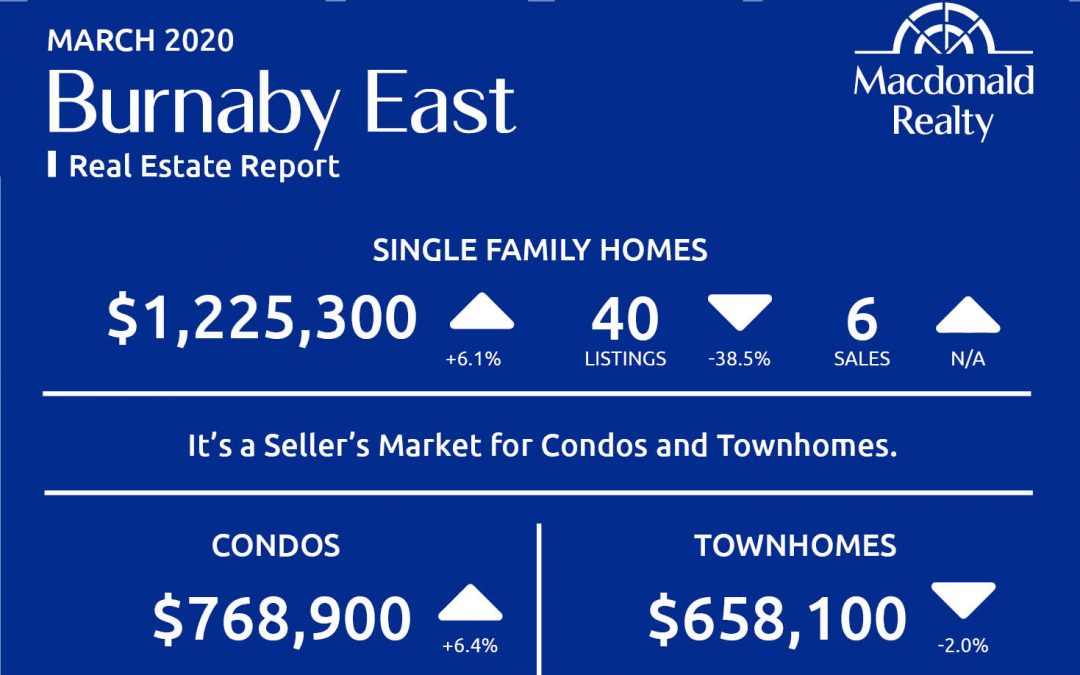
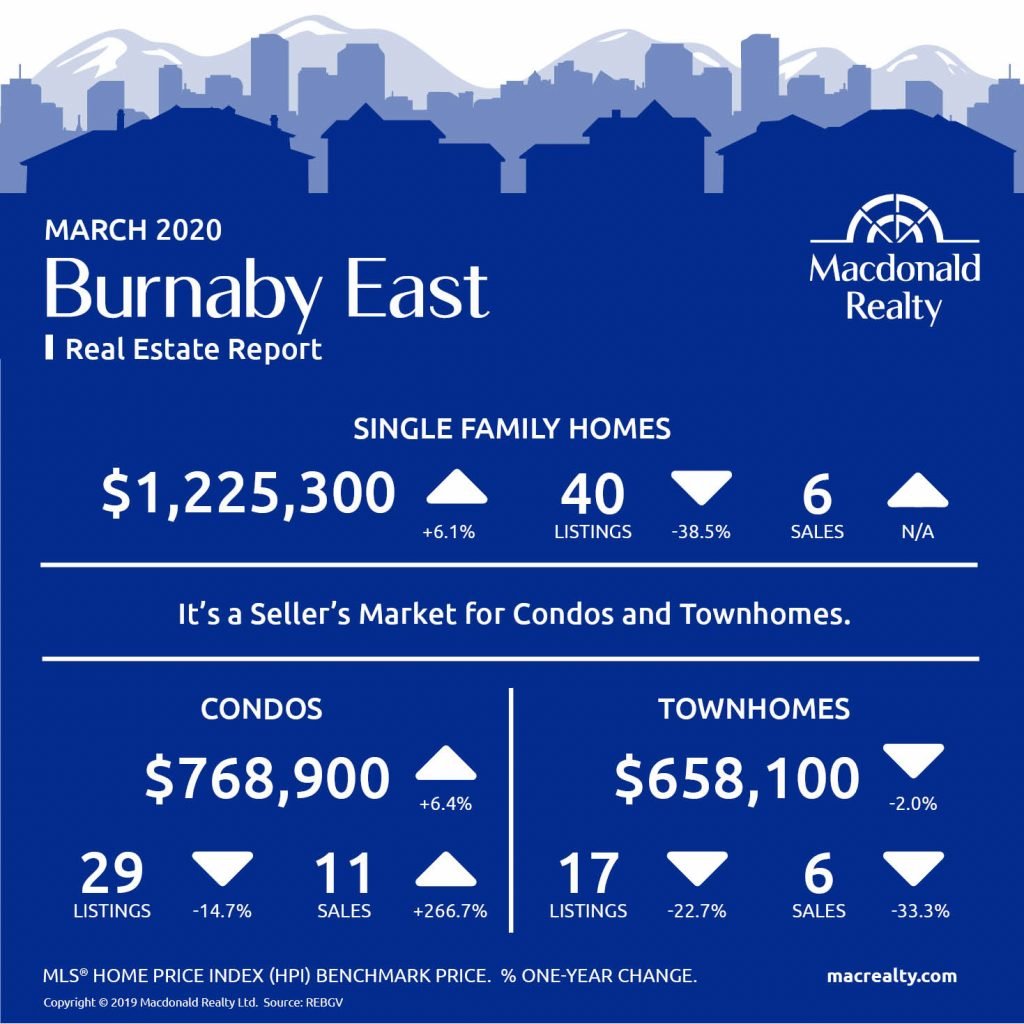
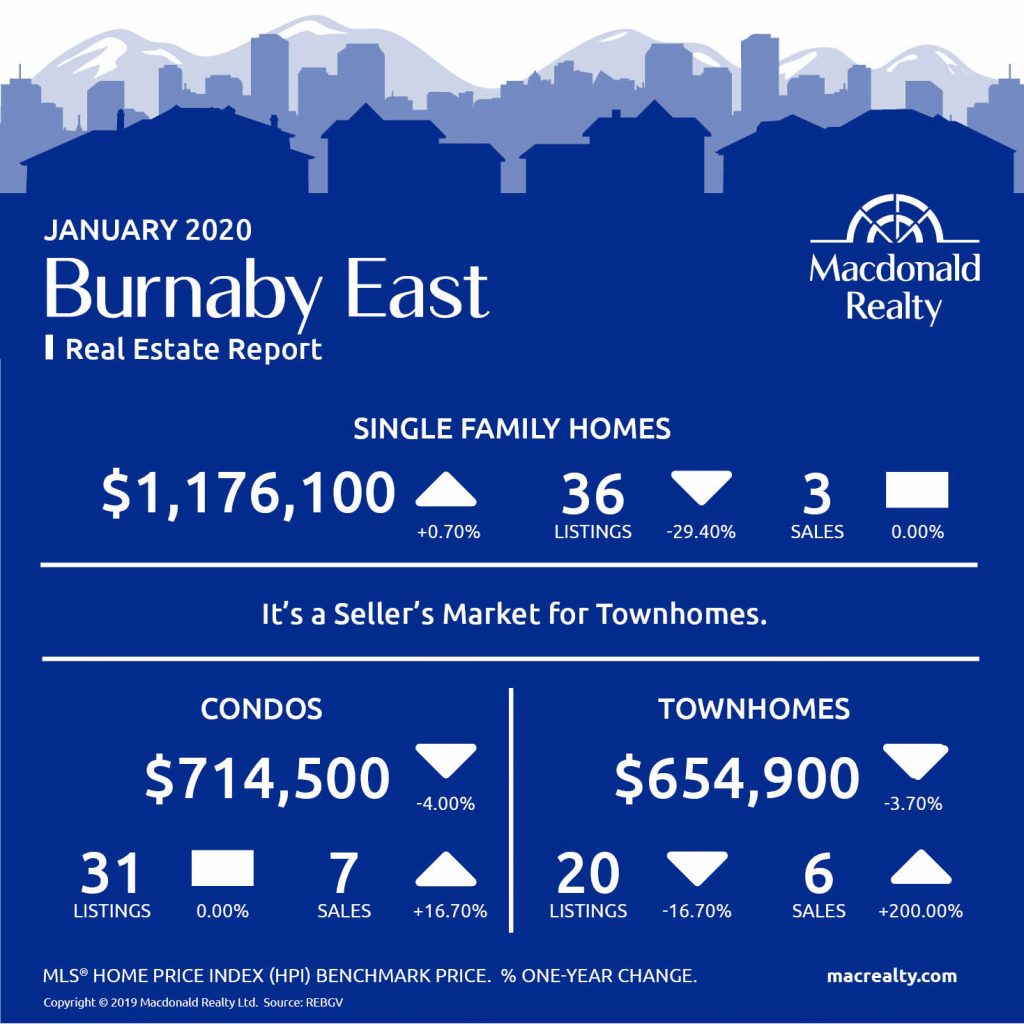
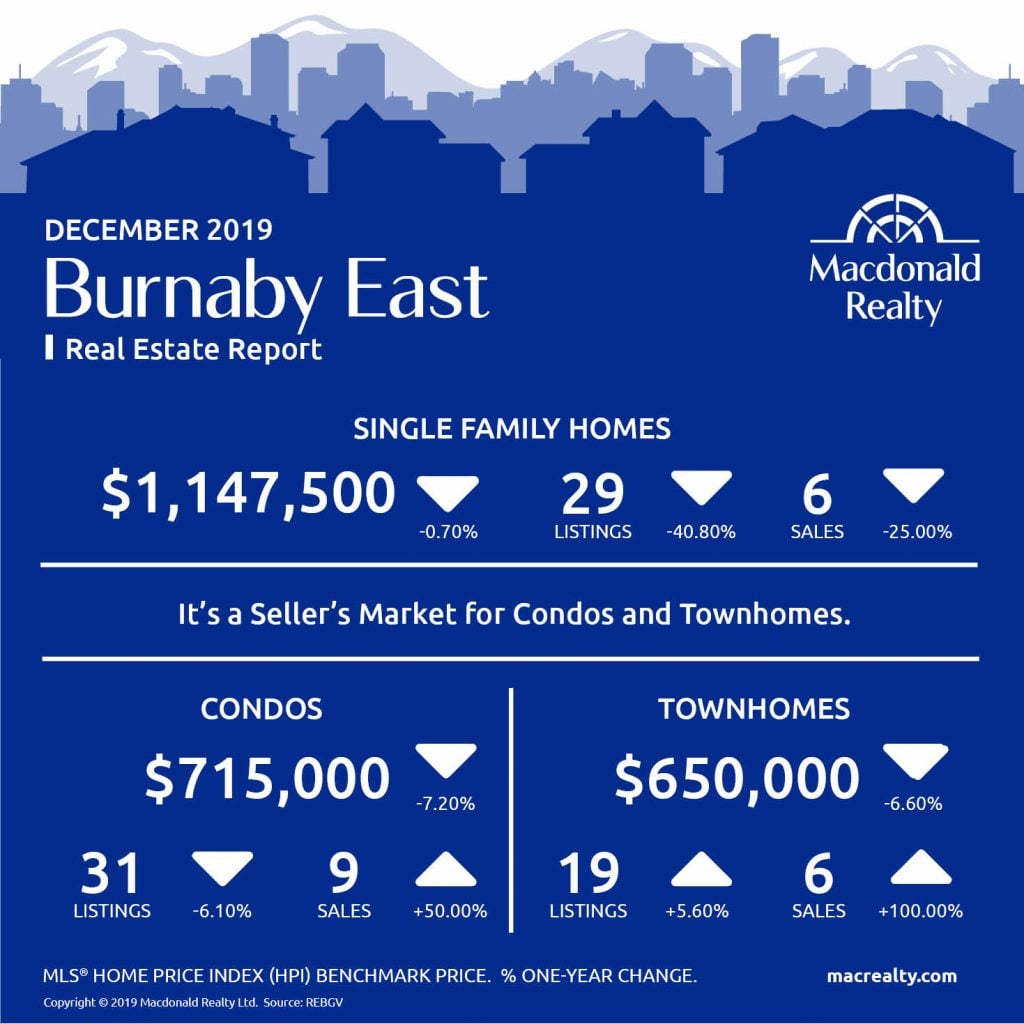
Burnaby East
In March 2020, there were 6 sales of detached homes and 40 active listings in Burnaby East. The benchmark sale price was $1,225,300.
The condo market had 11 sales and 29 active listings at the end of the month. The benchmark sale price was $768,900.
The townhome market had 6 sales and, the active listings were 17. The benchmark sale price was $658,100.
It’s a seller’s market for condos and townhomes in Burnaby East.
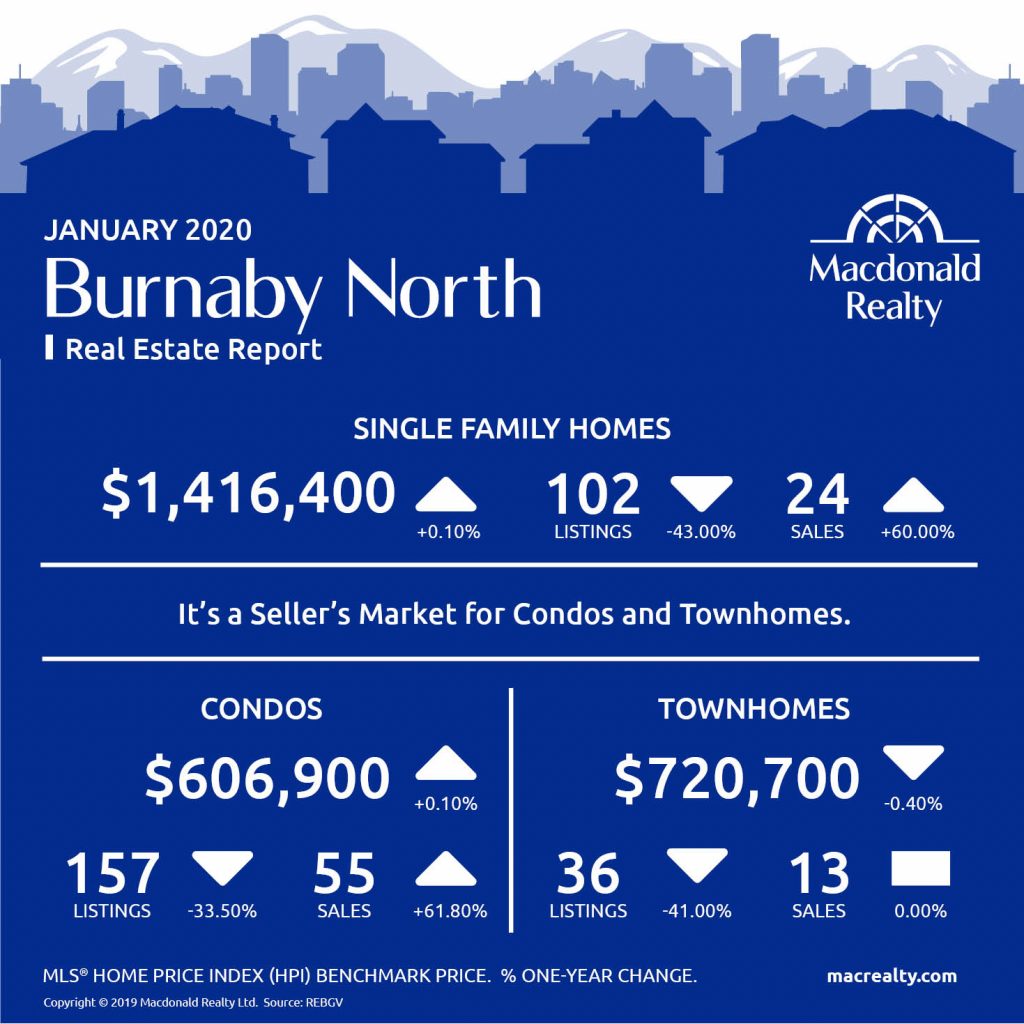
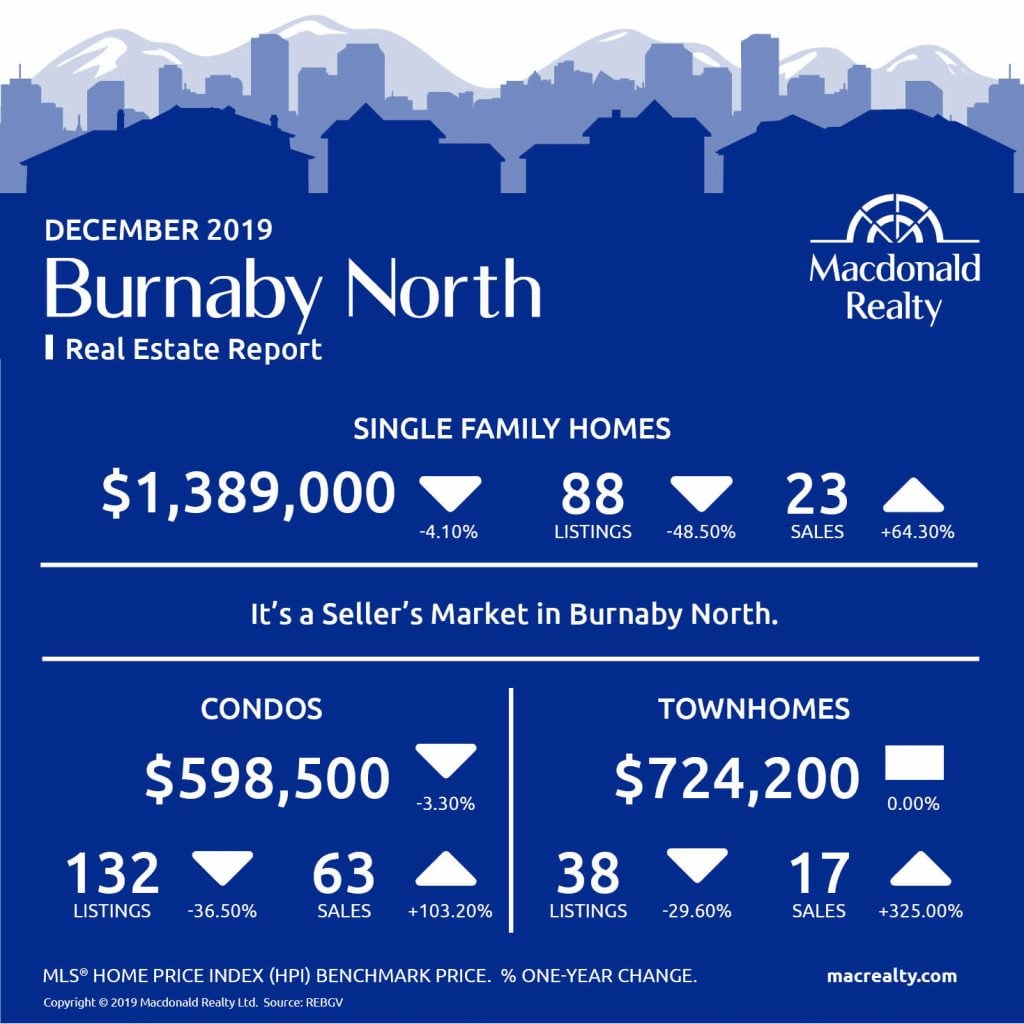
Burnaby North
In March 2020, there were 31 sales of detached homes and 105 active listings in Burnaby East. The benchmark sale price was $1,453,100.
The condo market had 71 sales and 229 active listings at the end of the month. The benchmark sale price was $616,500.
The townhome market had 18 sales and, the active listings were 42. The benchmark sale price was $727,700.
It’s a seller’s market in Burnaby North.

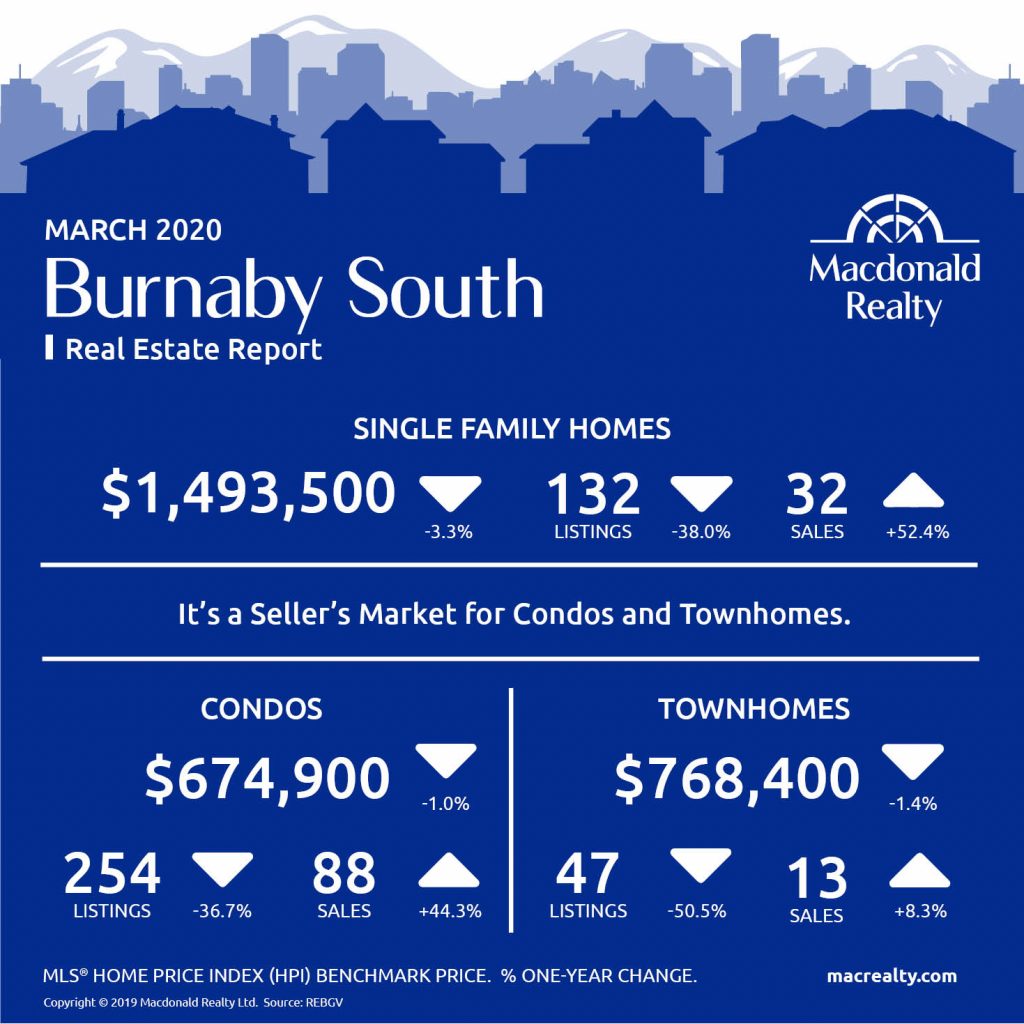
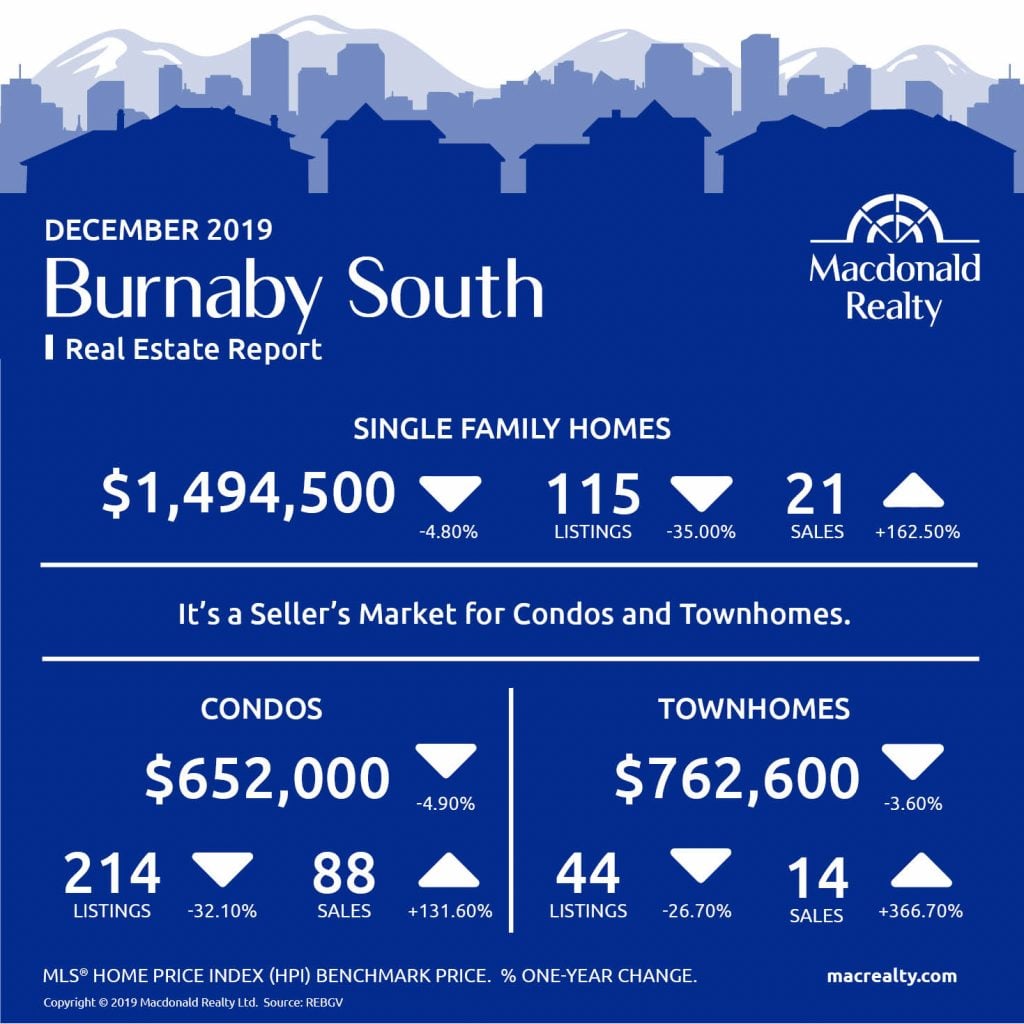
Burnaby South
In March 2020, there were 32 sales of detached homes and 132 active listings in Burnaby East. The benchmark sale price was $1,493,500.
The condo market had 88 sales and 254 active listings at the end of the month. The benchmark sale price was $768,400.
The townhome market had 13 sales and, the active listings were 47. The benchmark sale price was $768,400.
It’s a seller’s market for condos and townhomes in Burnaby North.
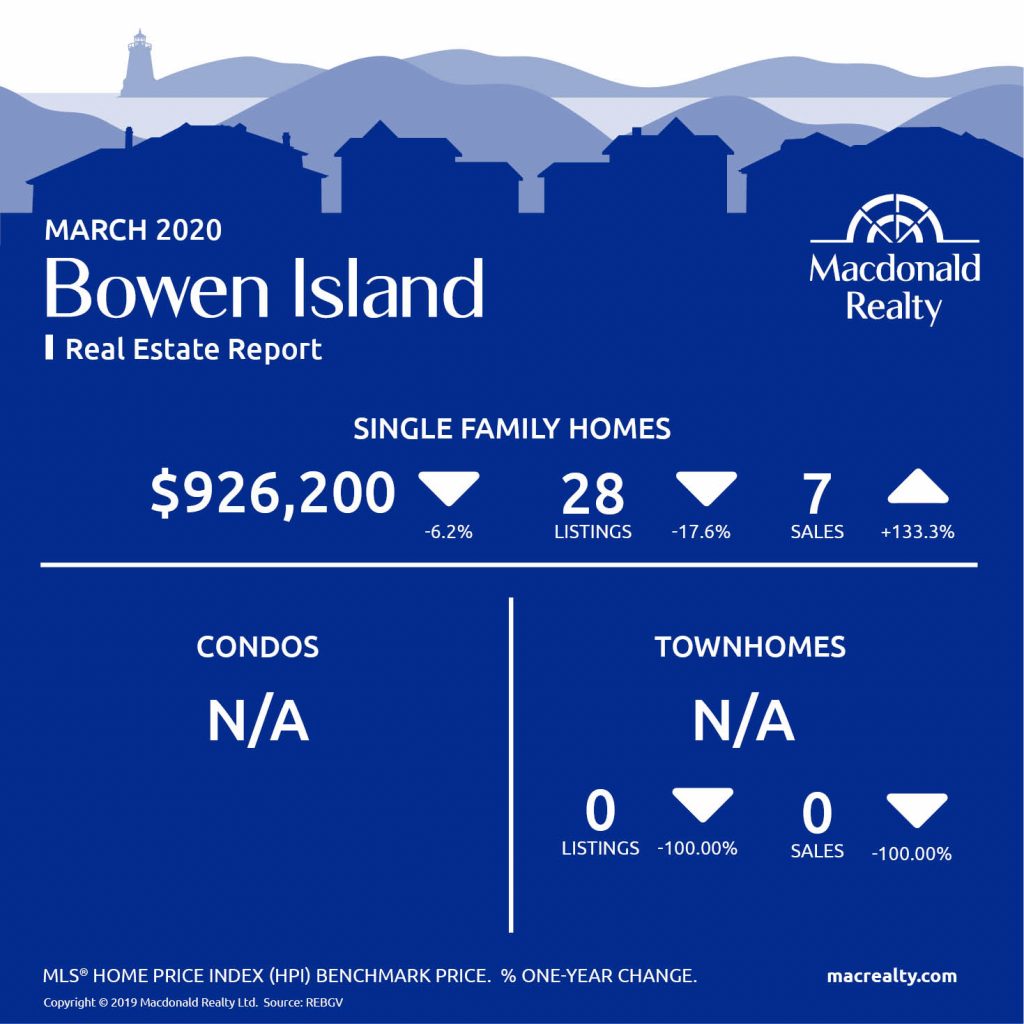
Bowen Island
Coquitlam

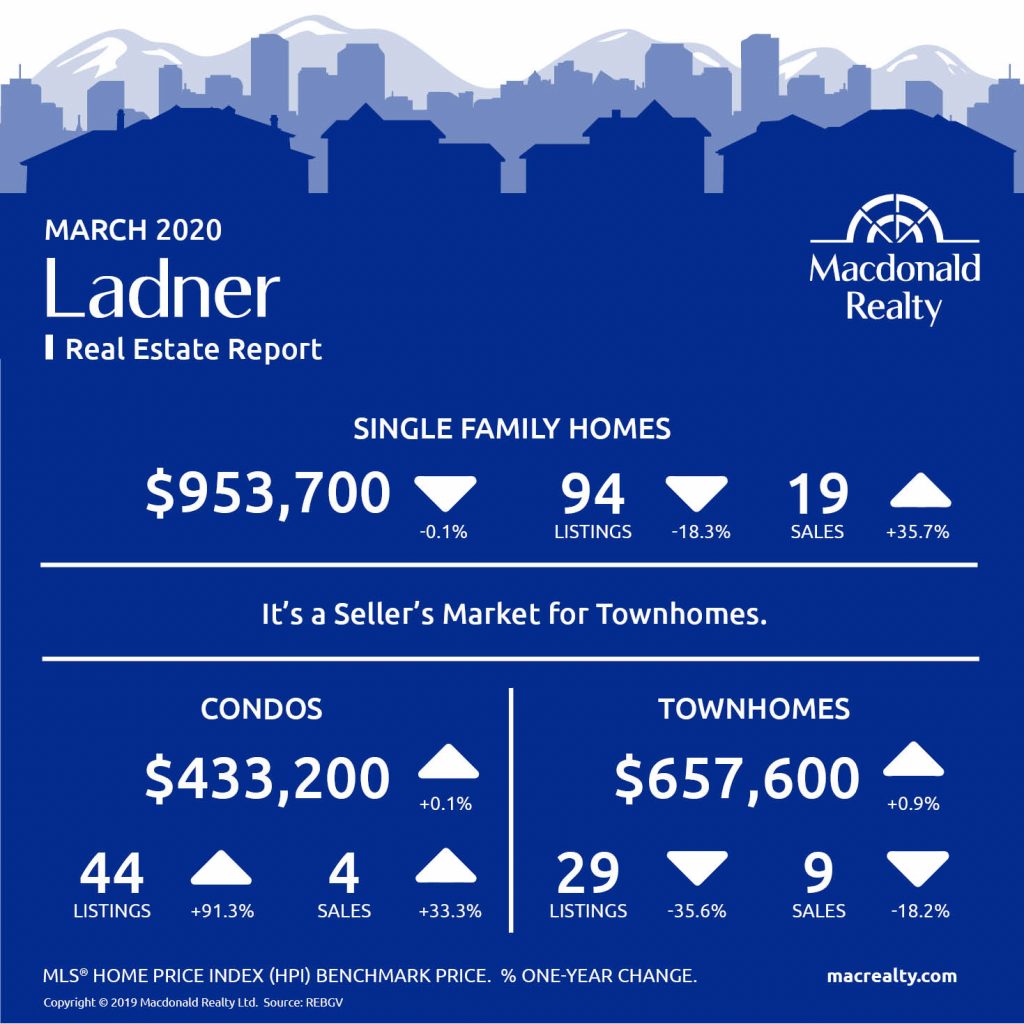
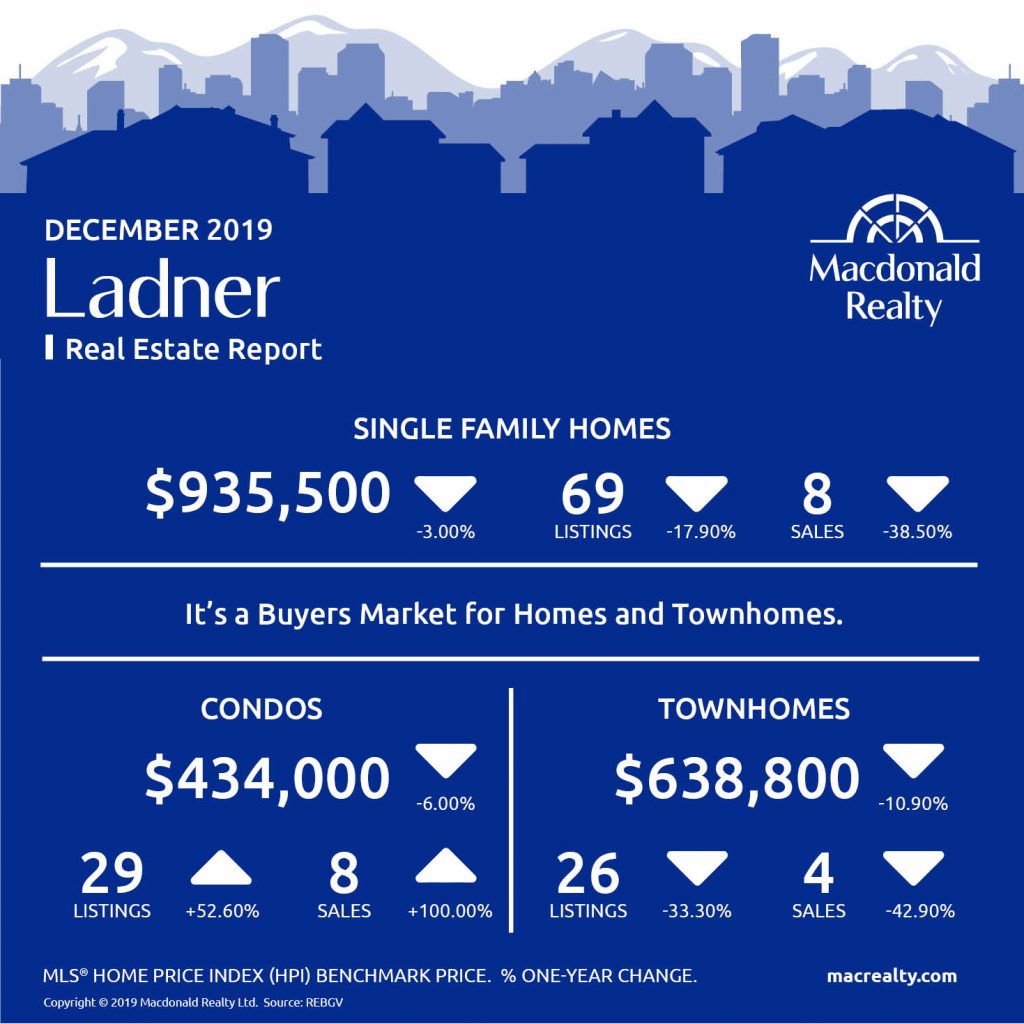
Ladner
Maple Ridge

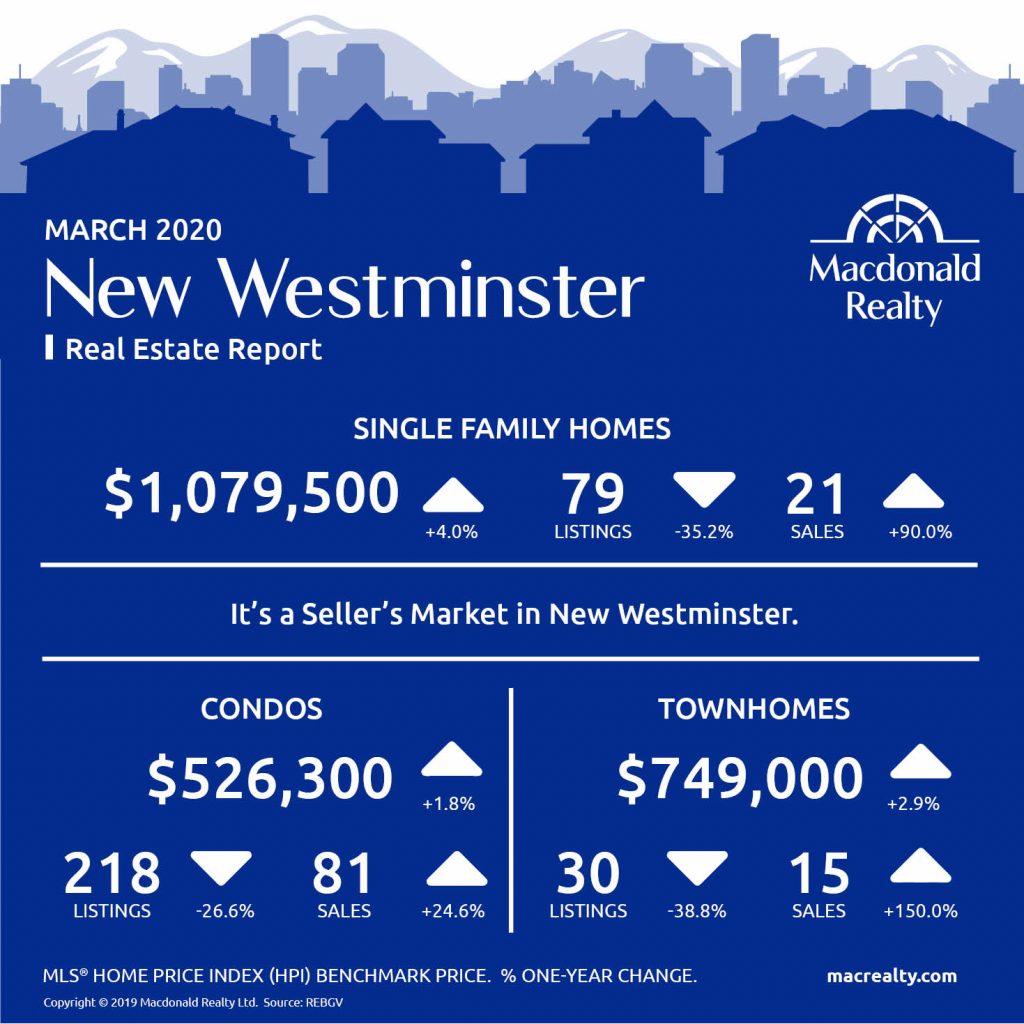
New Westminster
North Vancouver

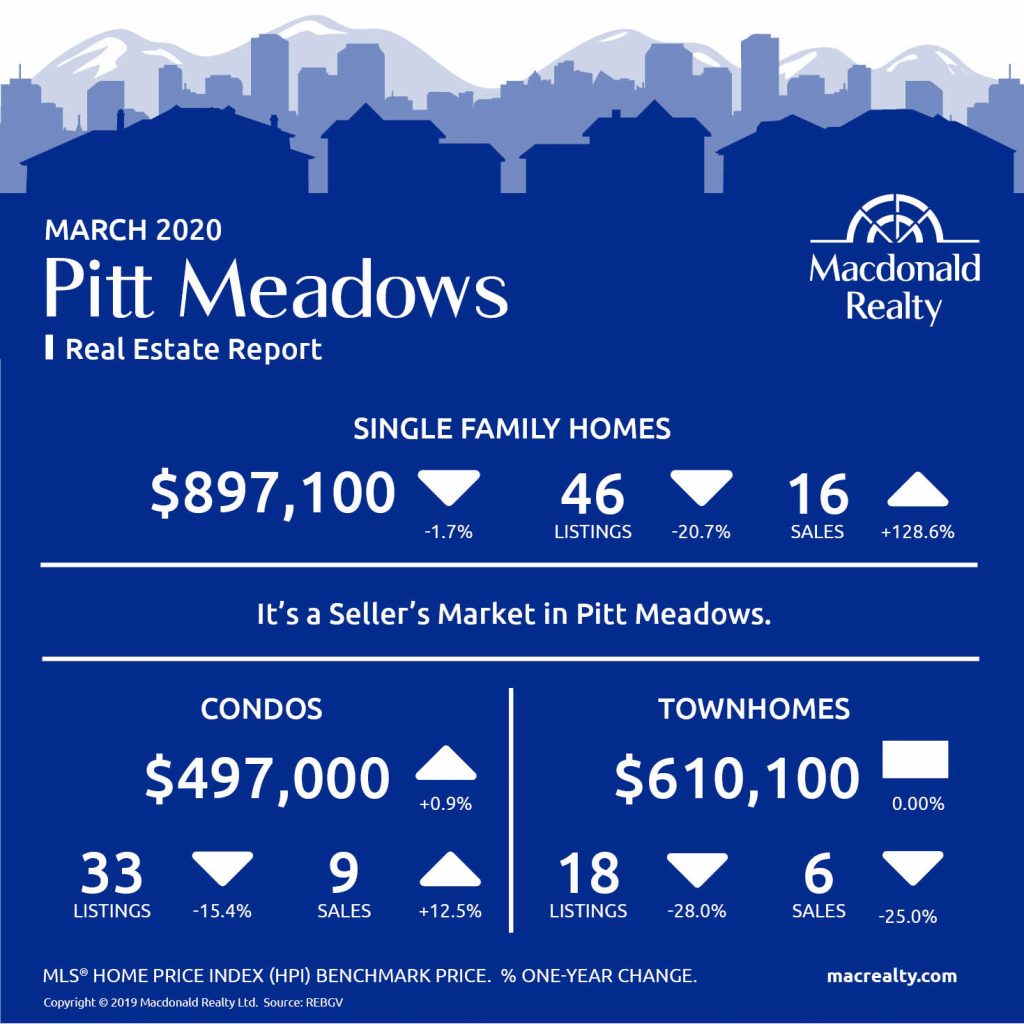
Pitt Meadows
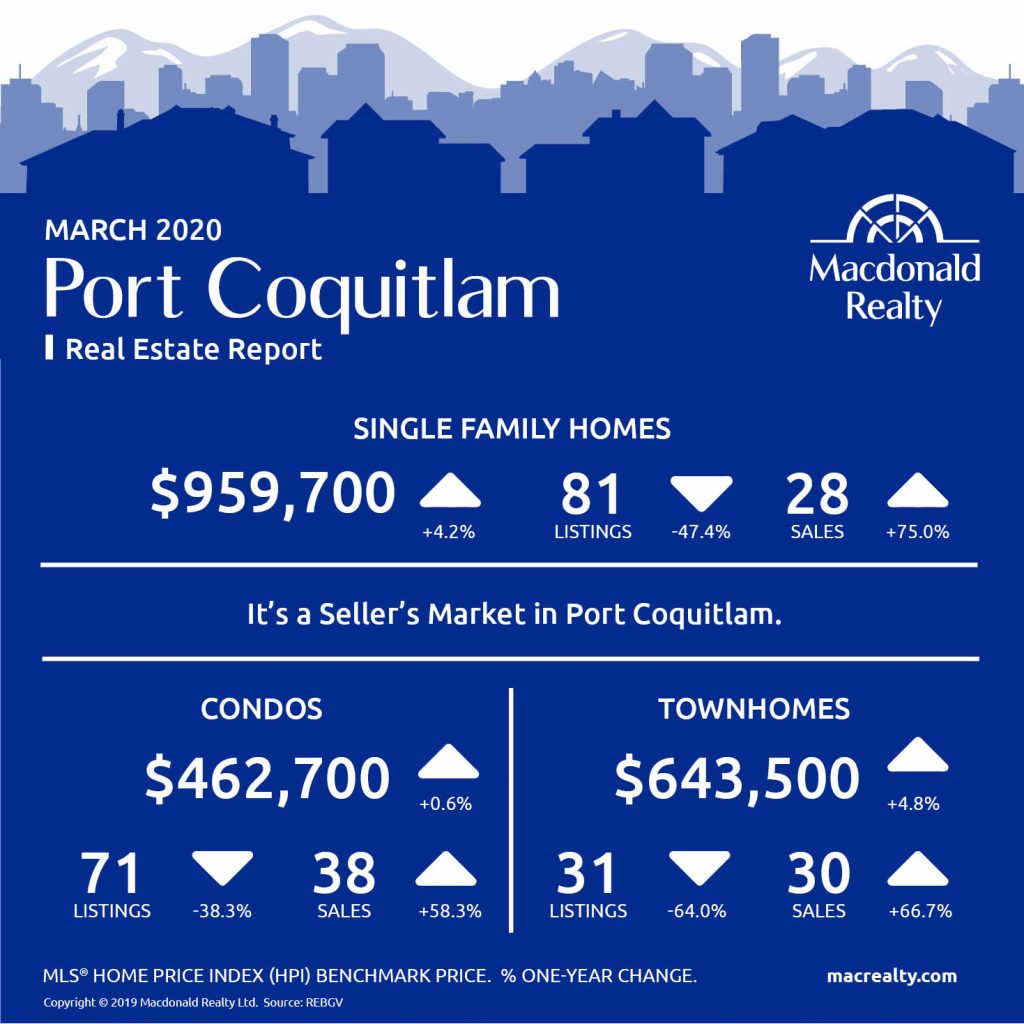
Port Coquitlam
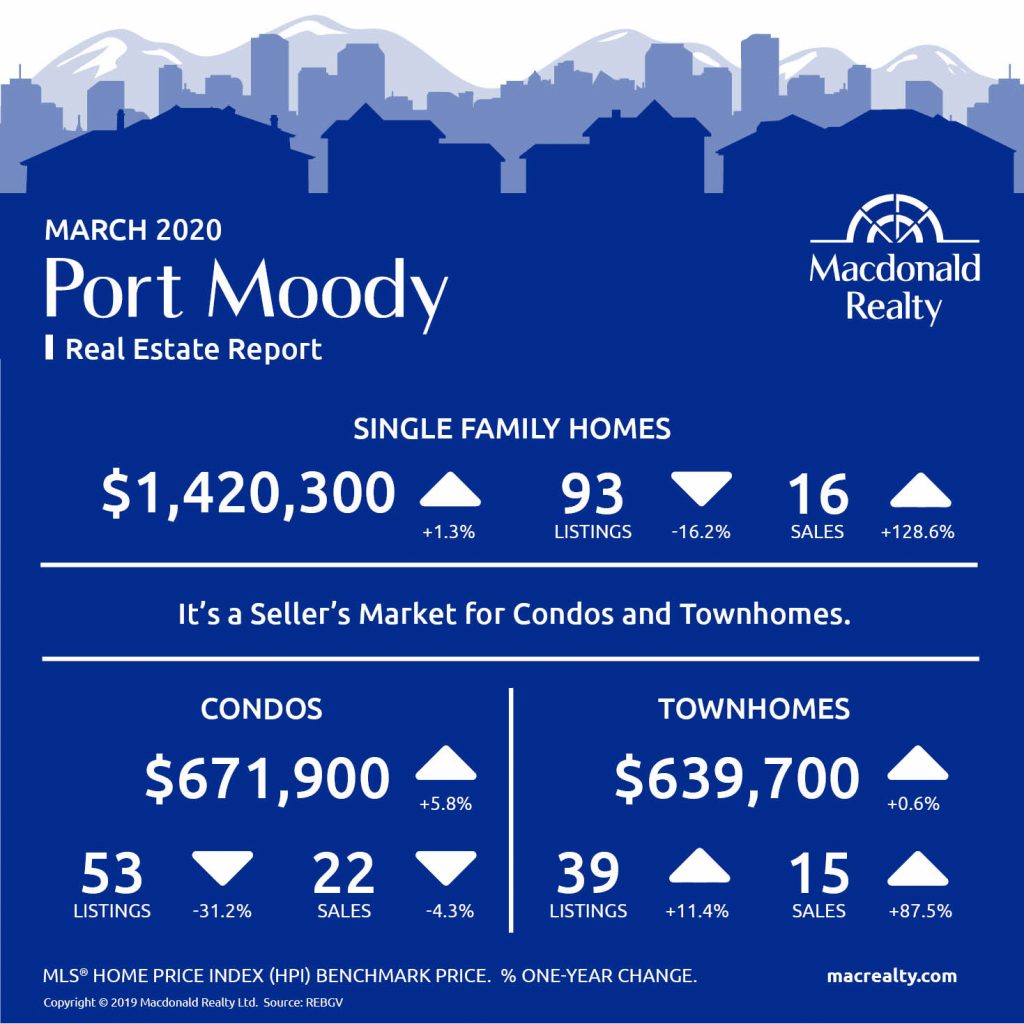
Port Moody
Richmond

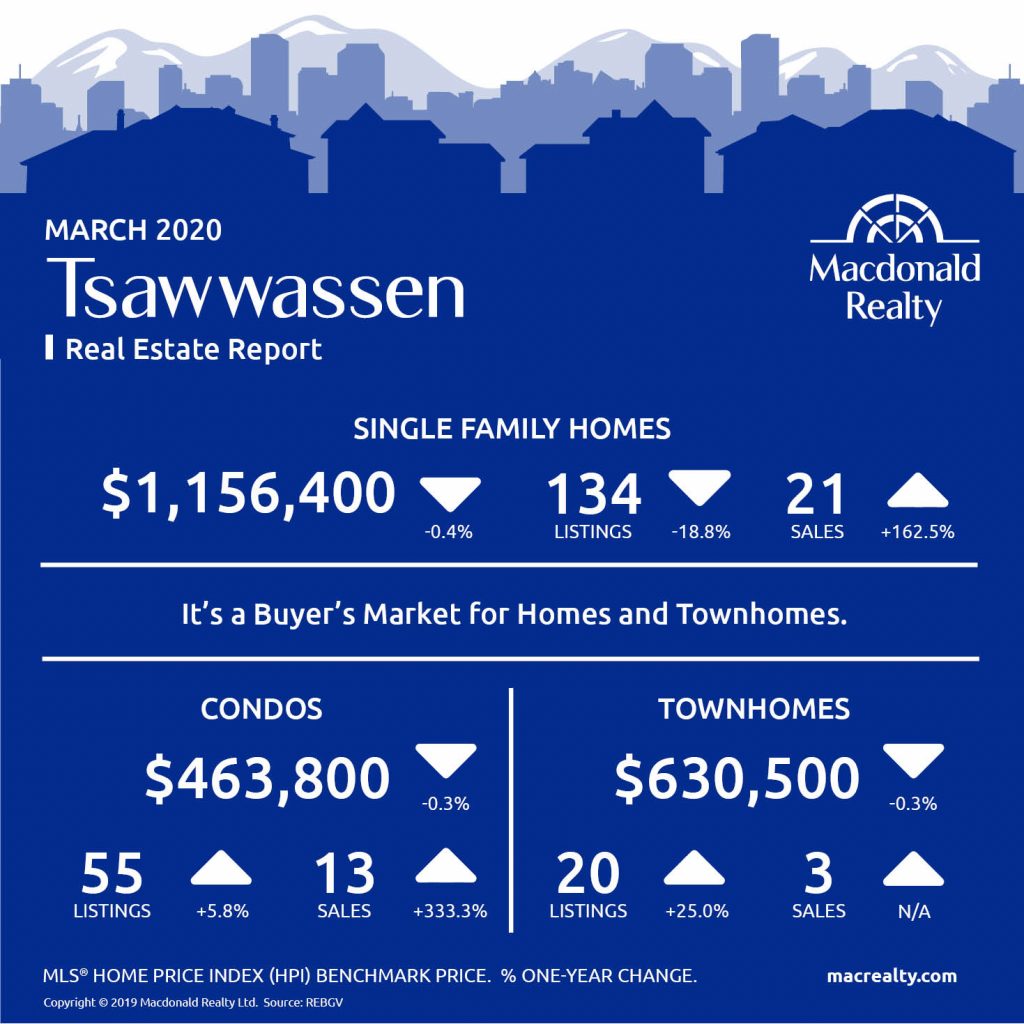
Tsawwassen
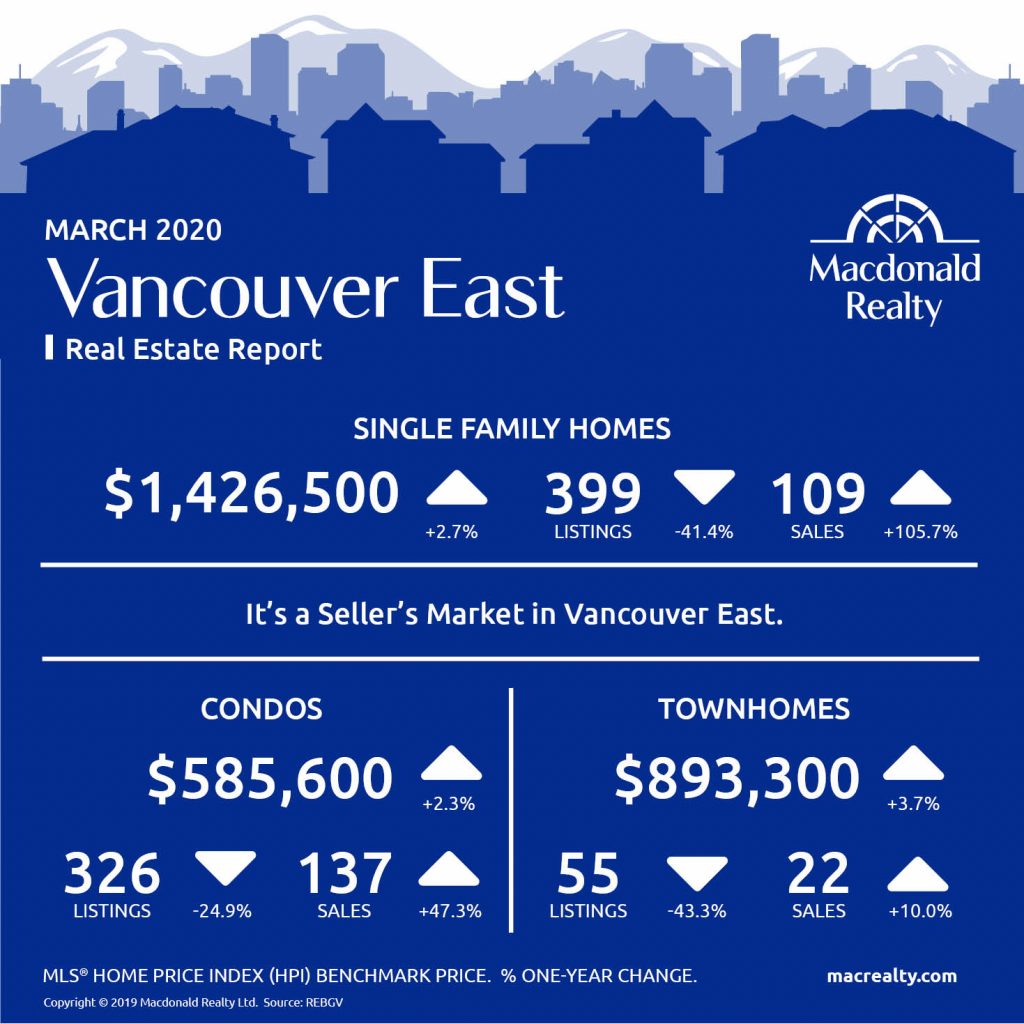
Vancouver East
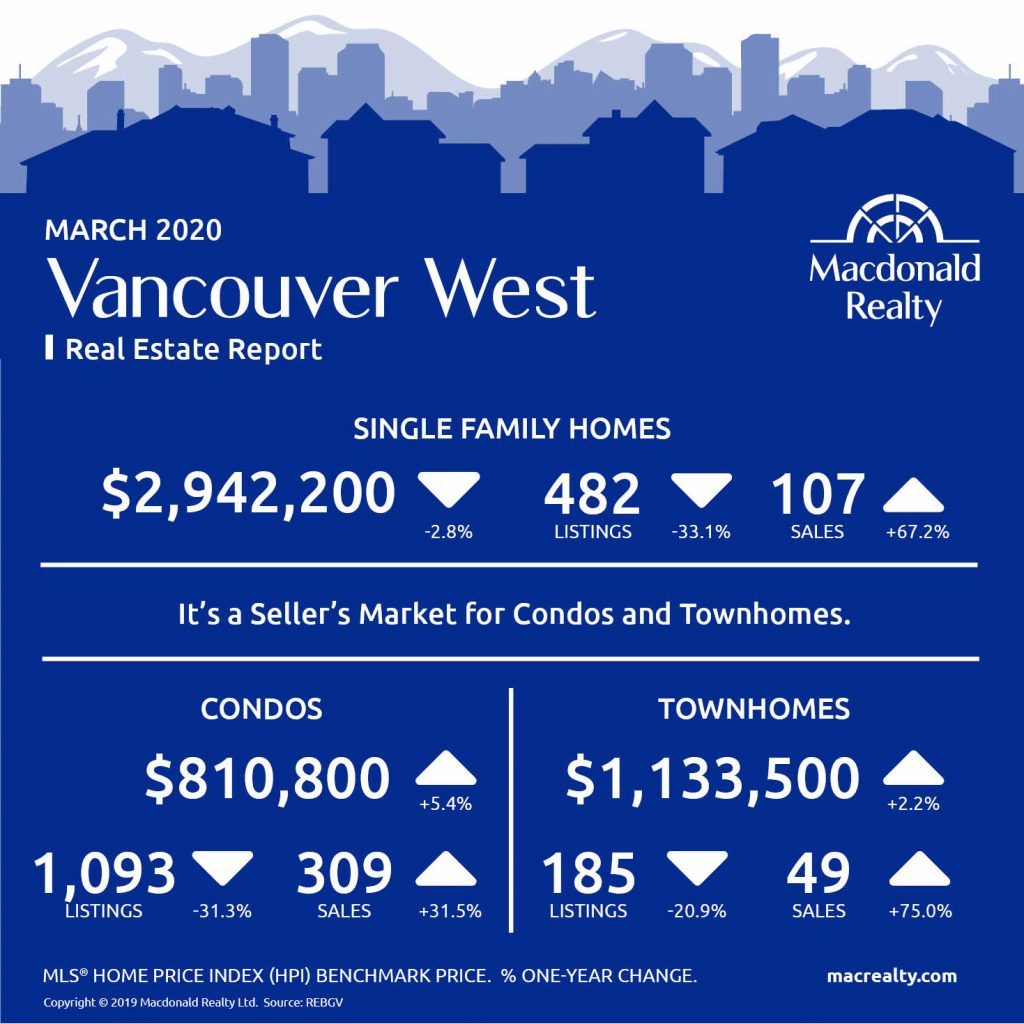
Vancouver West
West Vancouver

Looking for more information about the real estate market in specific neighbourhoods in the Greater Vancouver?
Macdonald Realty has offices across the Greater Vancouver. Please email [email protected] or call 1-877-278-3888 to be matched with a REALTOR® working in your area.
MLS® Home Price Index (HPI) Benchmark Price
Average and median home prices are often misinterpreted, are affected by change in the mix of homes sold, and can swing dramatically from month to month (based on the types and prices of properties that sold in a given month). The MLS® HPI overcomes these shortcomings and uses the concept of a benchmark home, a notional home with common attributes of typical homes in a defined area. Visit www.housepriceindex.ca for more information.
This blog post is based on market data provided by the Real Estate Board of Greater Vancouver (REBGV) www.rebgv.org
by Macrealty Marketing Team | Mar 5, 2020 | Market Updates
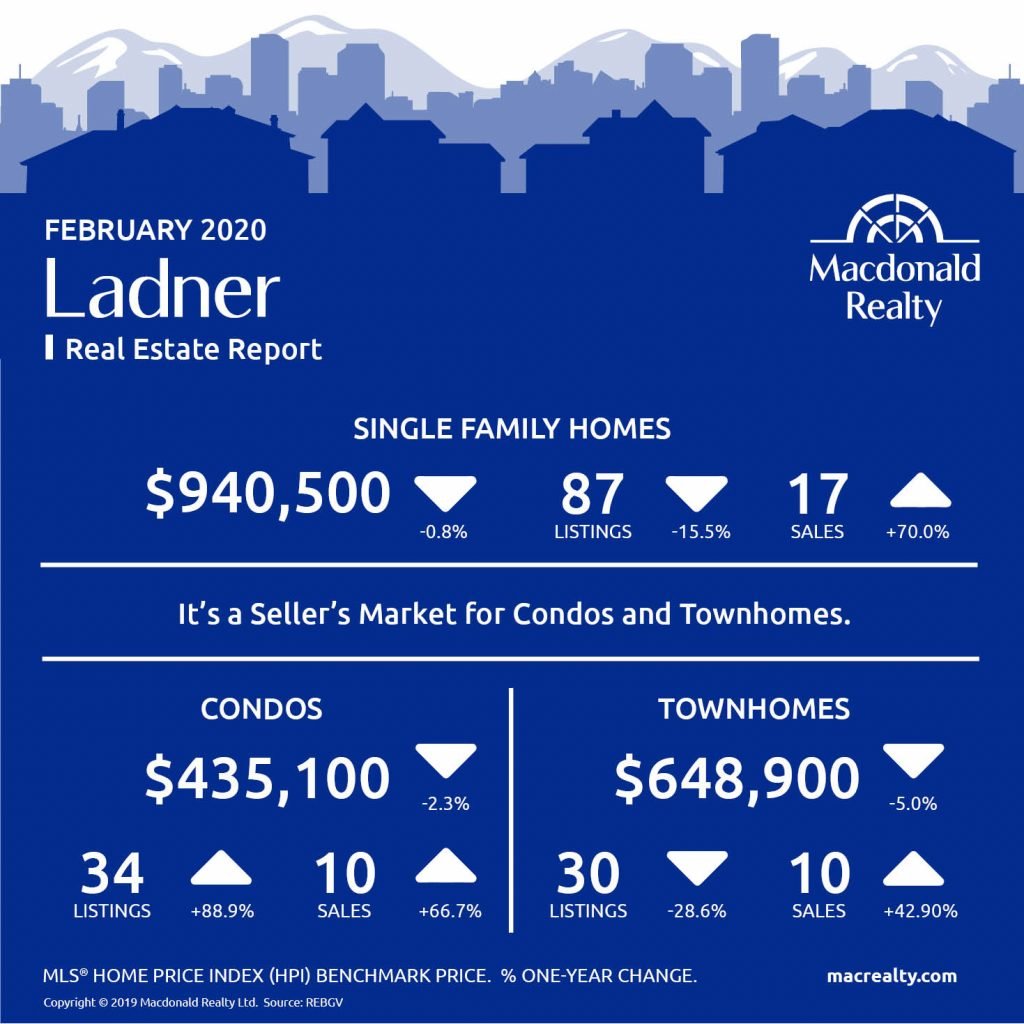
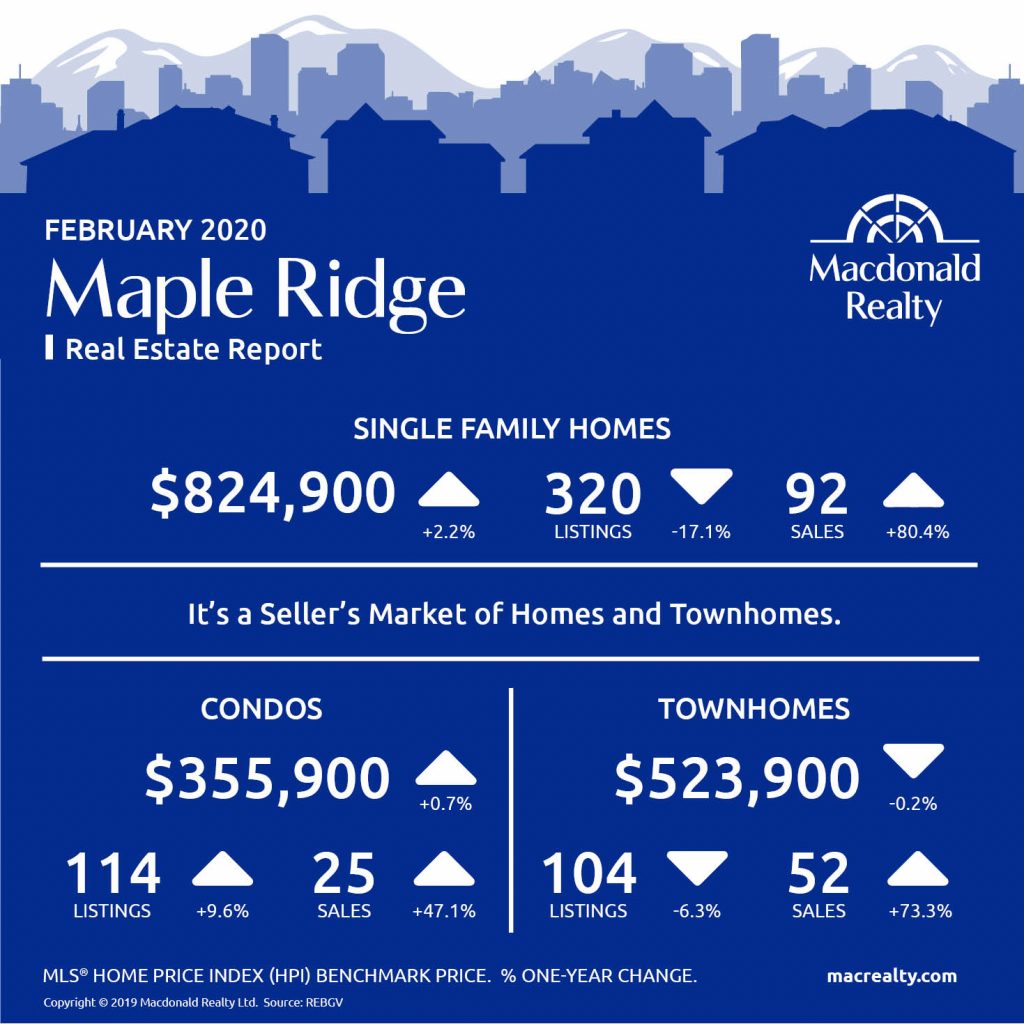
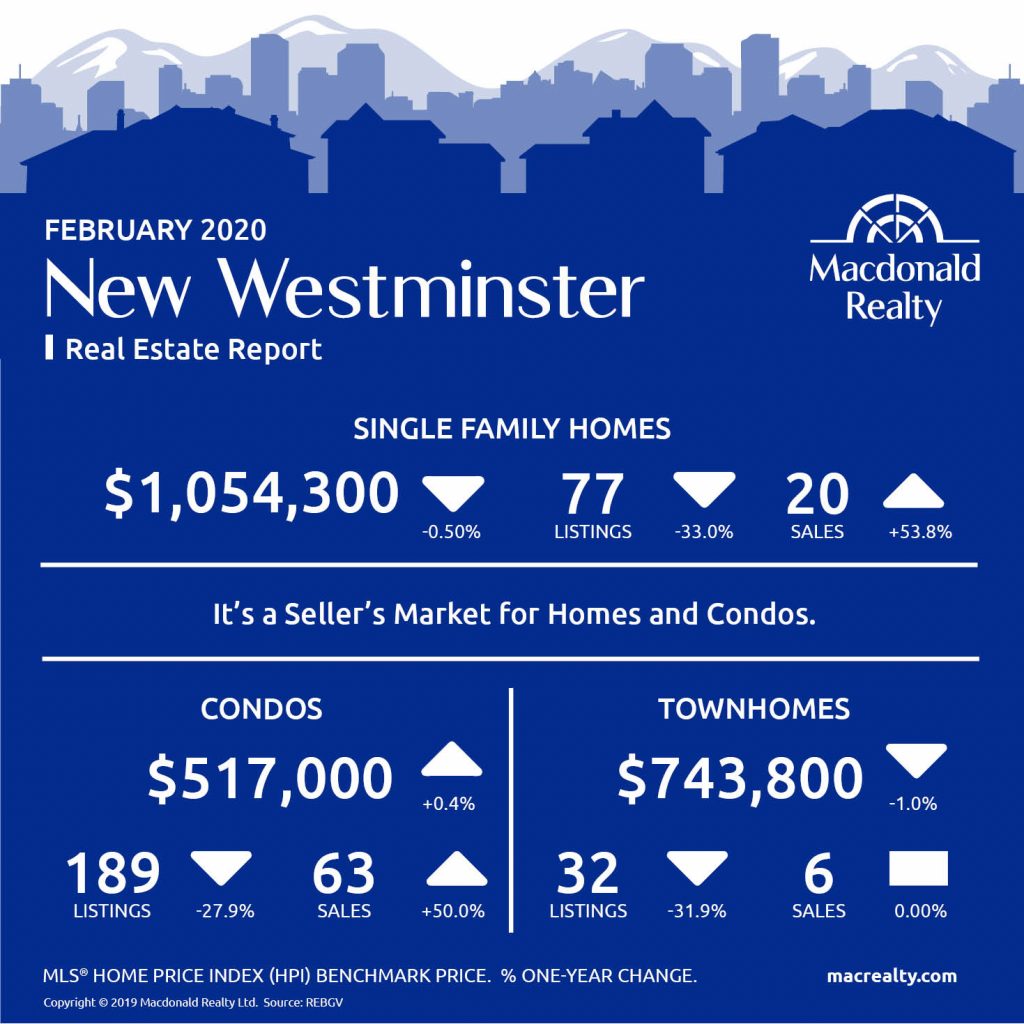
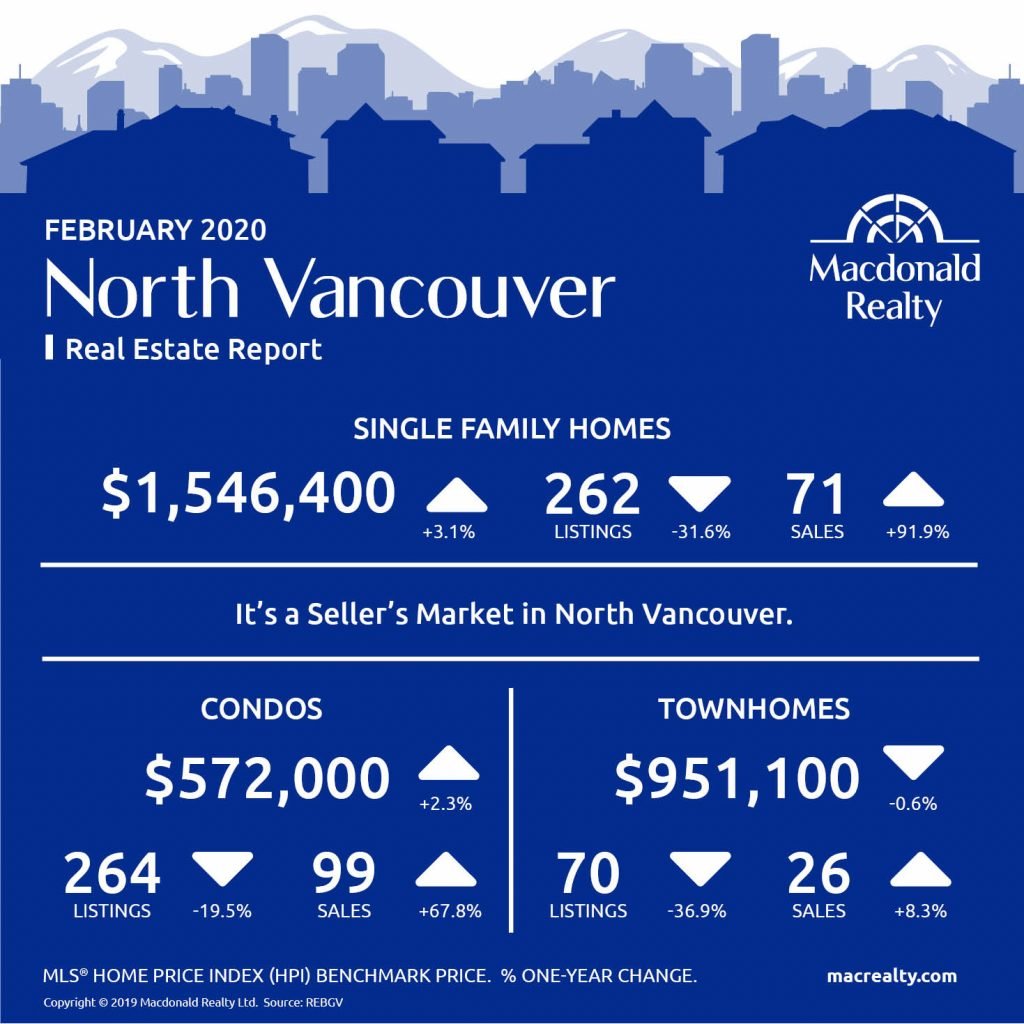
Here are the latest real estate market statistics from Macdonald Realty on the Greater Vancouver listings and sales in February 2020.
According to the Real Estate Board of Greater the Metro Vancouver residential home sales in the region totalled 2,150 in February 2020, a 44.9 per cent increase from the 1,484 sales recorded in February 2019, and a 36.9 per cent increase from the 1,571 homes sold in January 2020. In the report, the Board highlights that last month’s sales were 15.6 per cent below the 10-year February sales average.
Ashley Smith, REBGV president said:
“Home buyer demand again saw strong year-over-year increases in February while the total inventory of homes for sale struggled to keep pace -This was most pronounced in the condominium market.”
Areas covered by the Real Estate Board of Greater Vancouver include: Burnaby, Coquitlam, Maple Ridge, New Westminster, North Vancouver, Pitt Meadows, Port Coquitlam, Port Moody, Richmond, South Delta, Squamish, Sunshine Coast, Vancouver, West Vancouver, and Whistler.
Please check out the infographics for Squamish, Sunshine Coast and Whistler here.
Find all the infographics by visiting our Facebook Album.
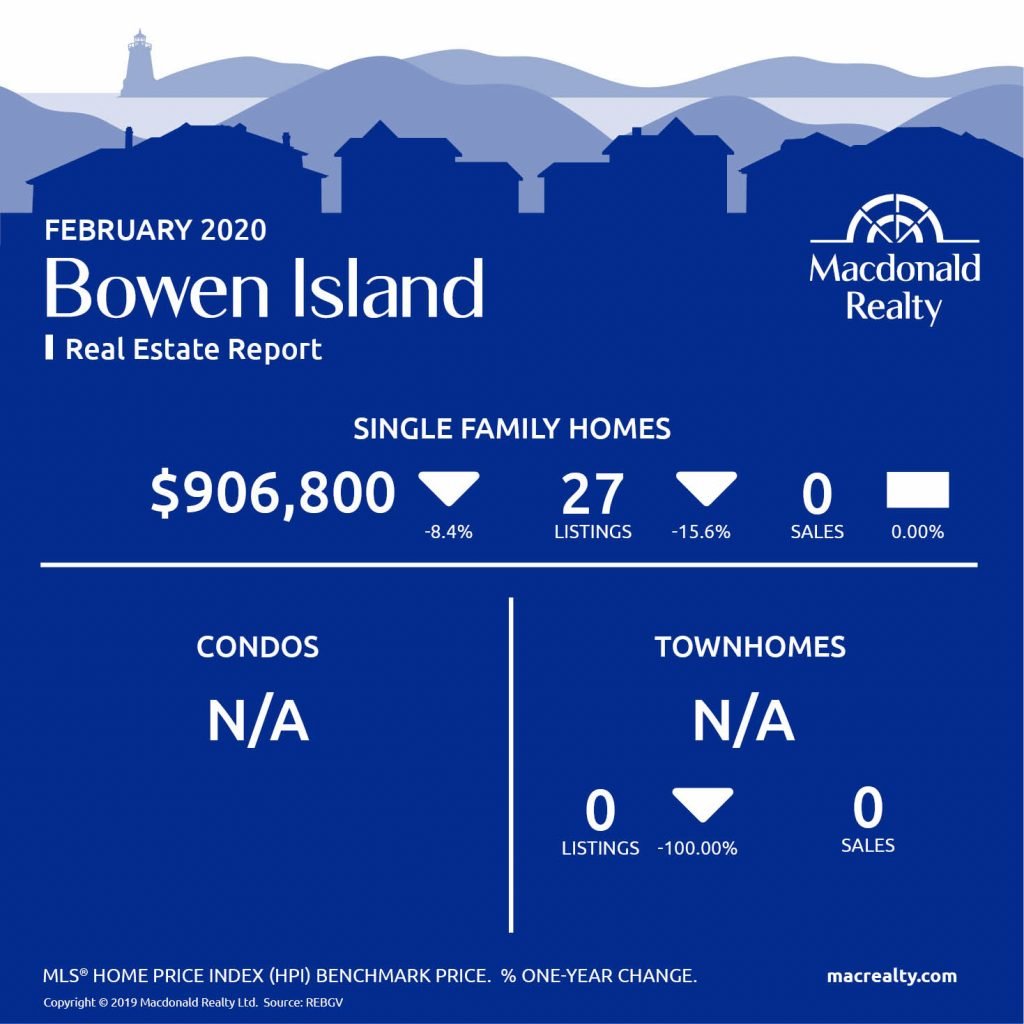
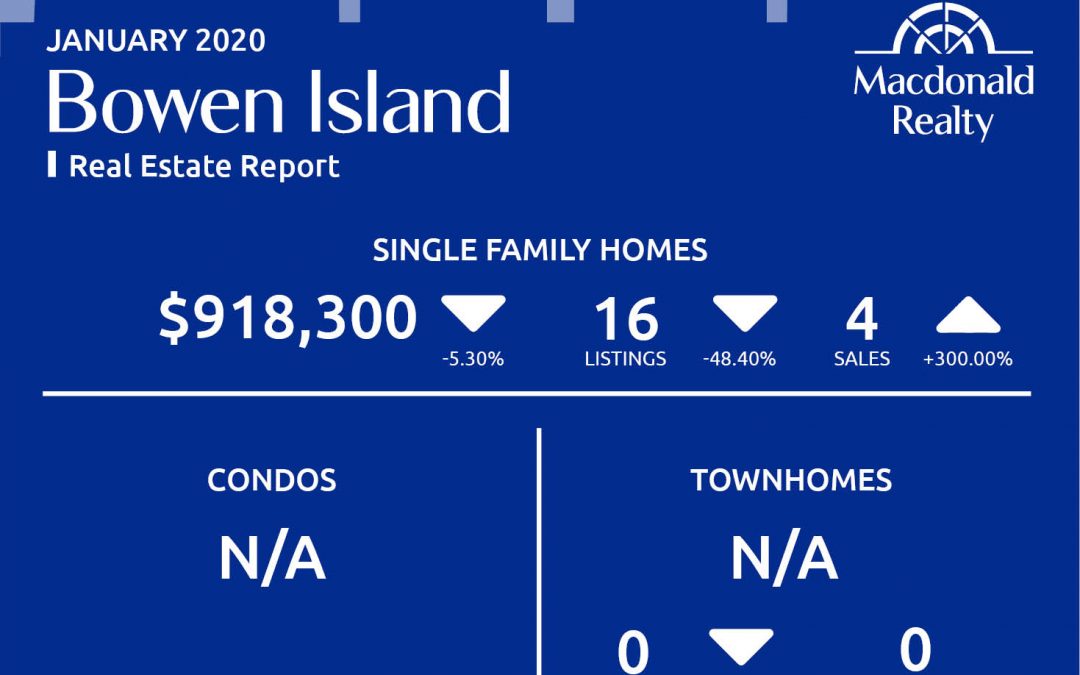
Bowen Island
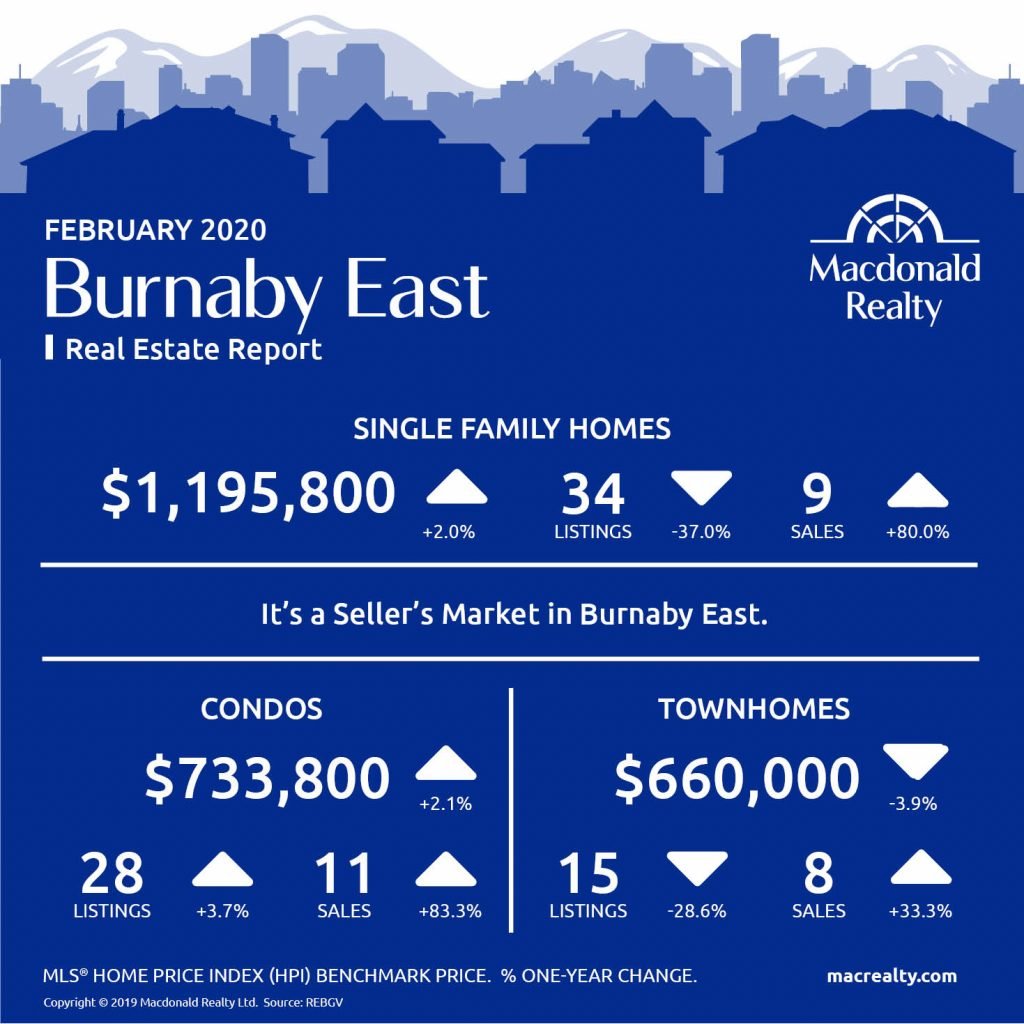
Burnaby East
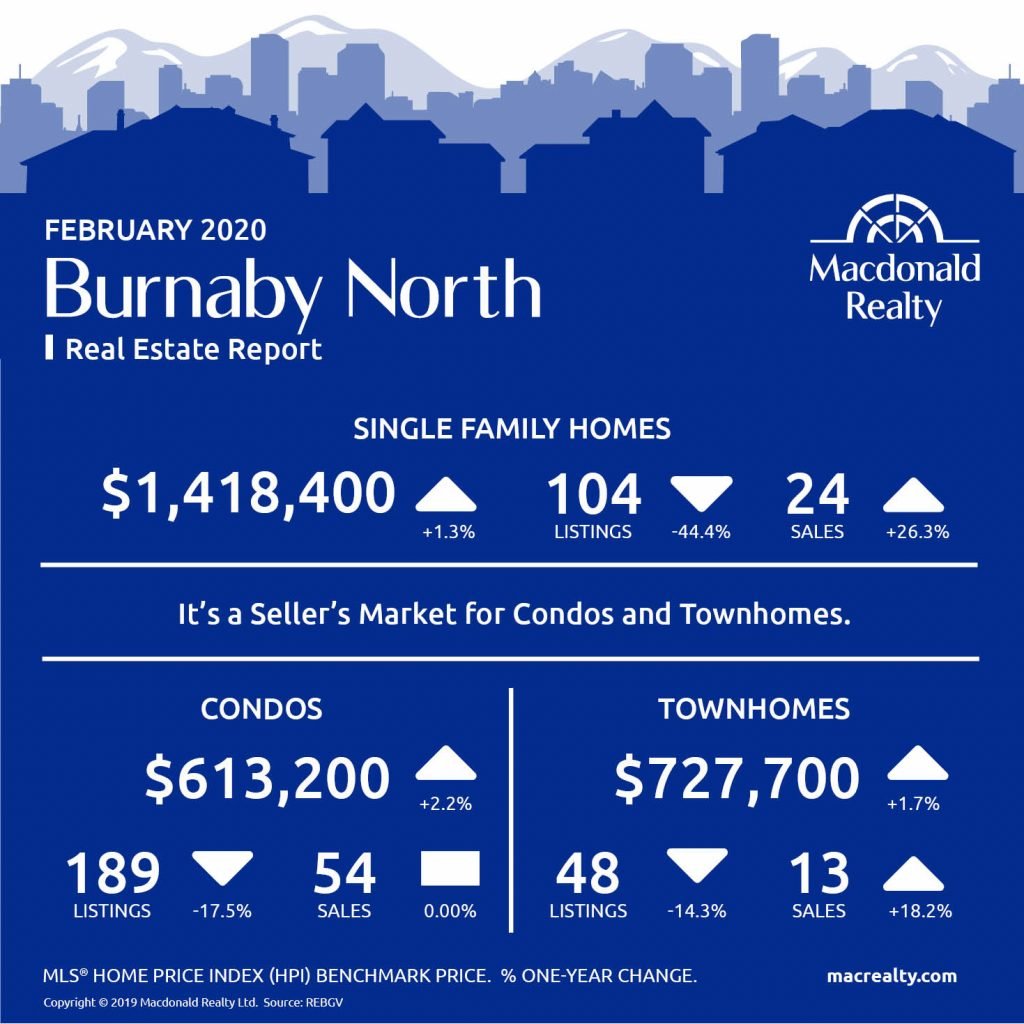
Burnaby North
Burnaby South

Coquitlam

Ladner
Maple Ridge
New Westminster
North Vancouver
Pitt Meadows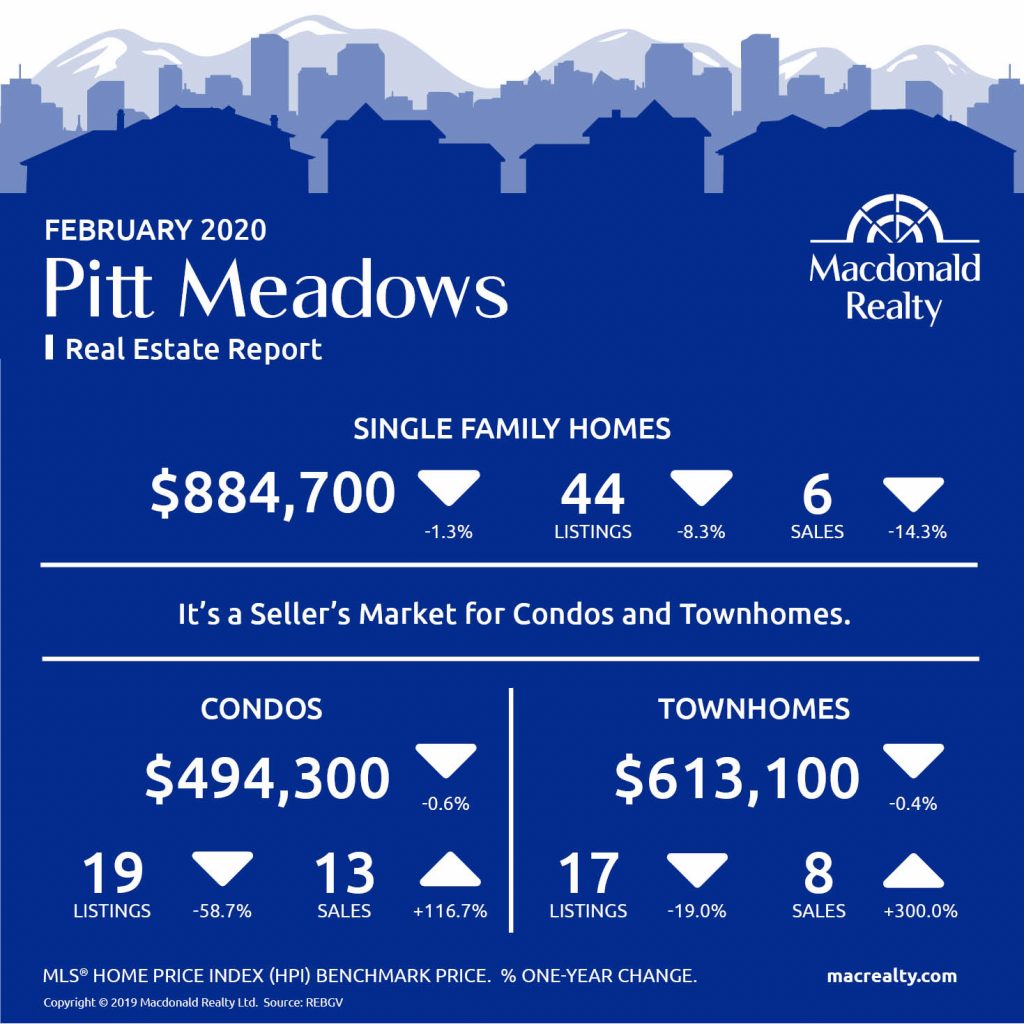
Port Coquitlam

Port Moody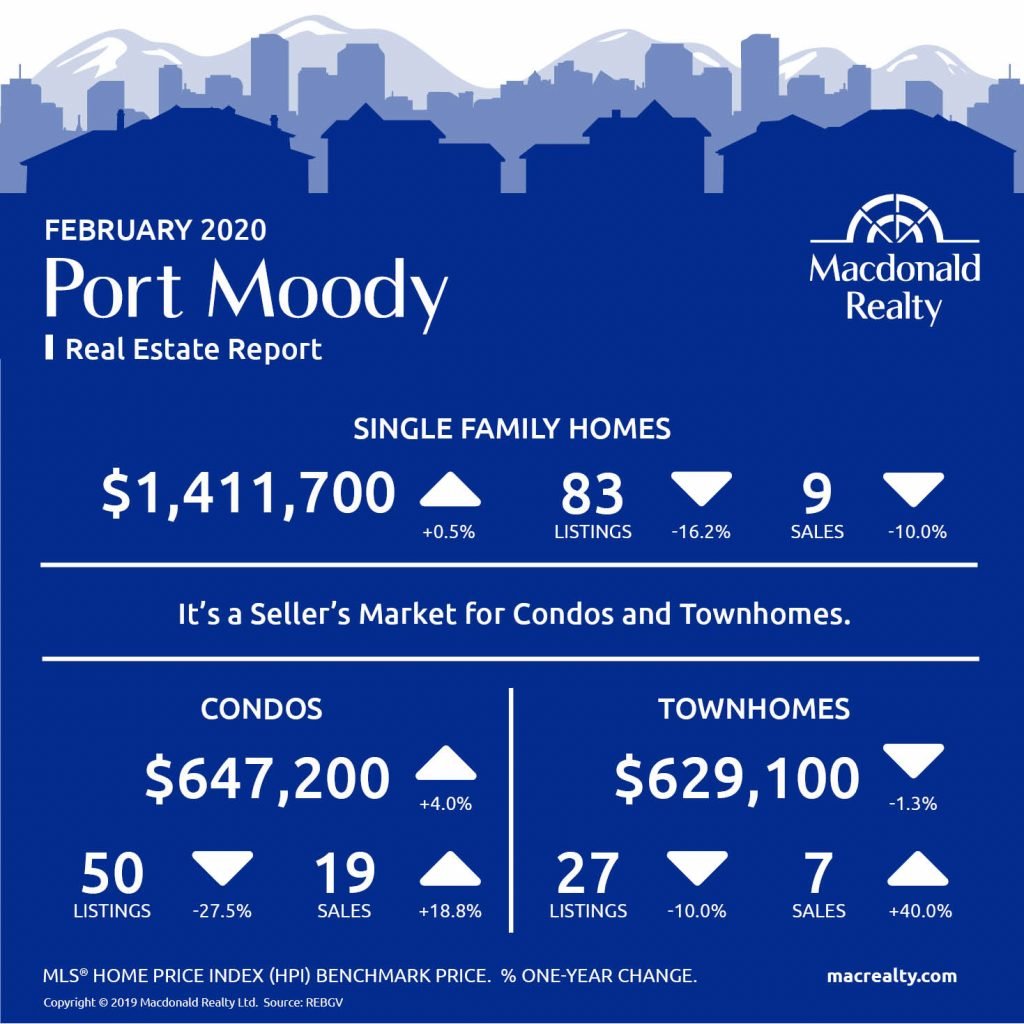
Richmond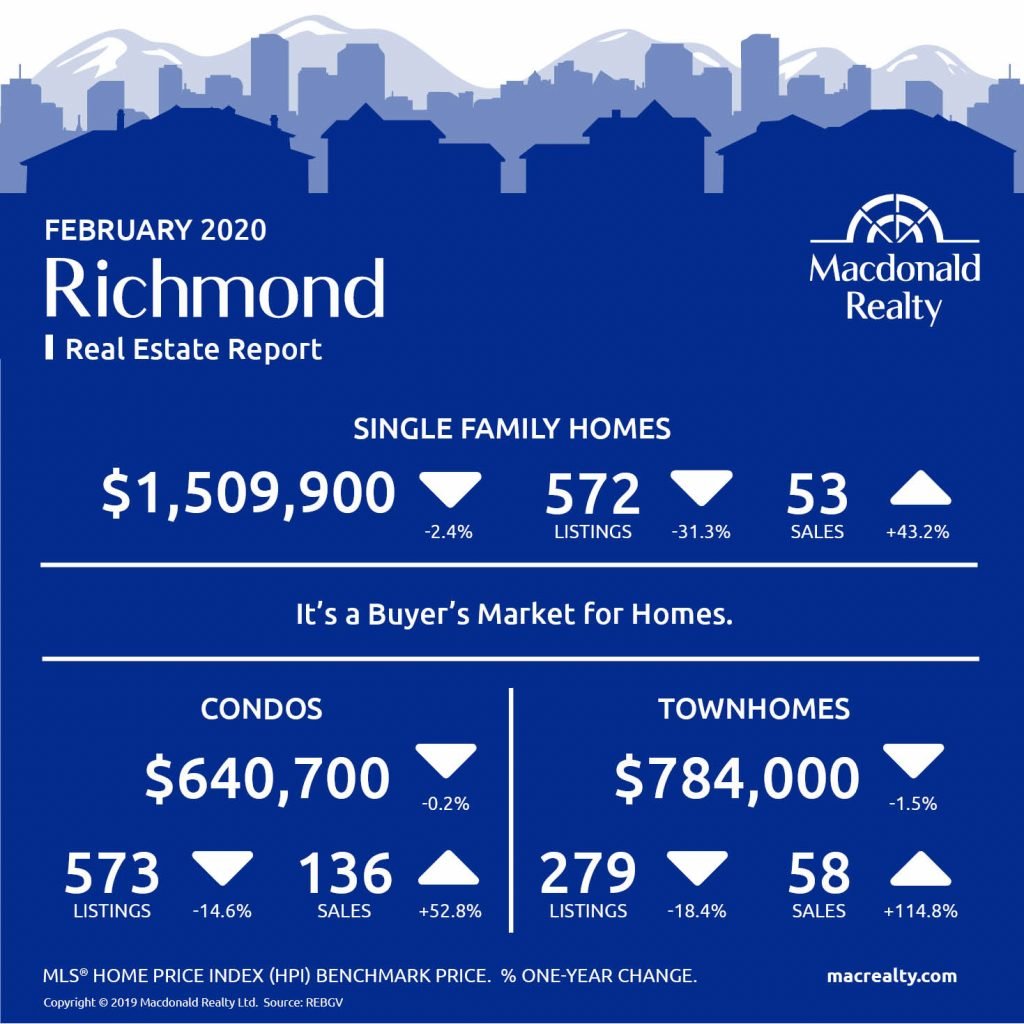
Tsawwassen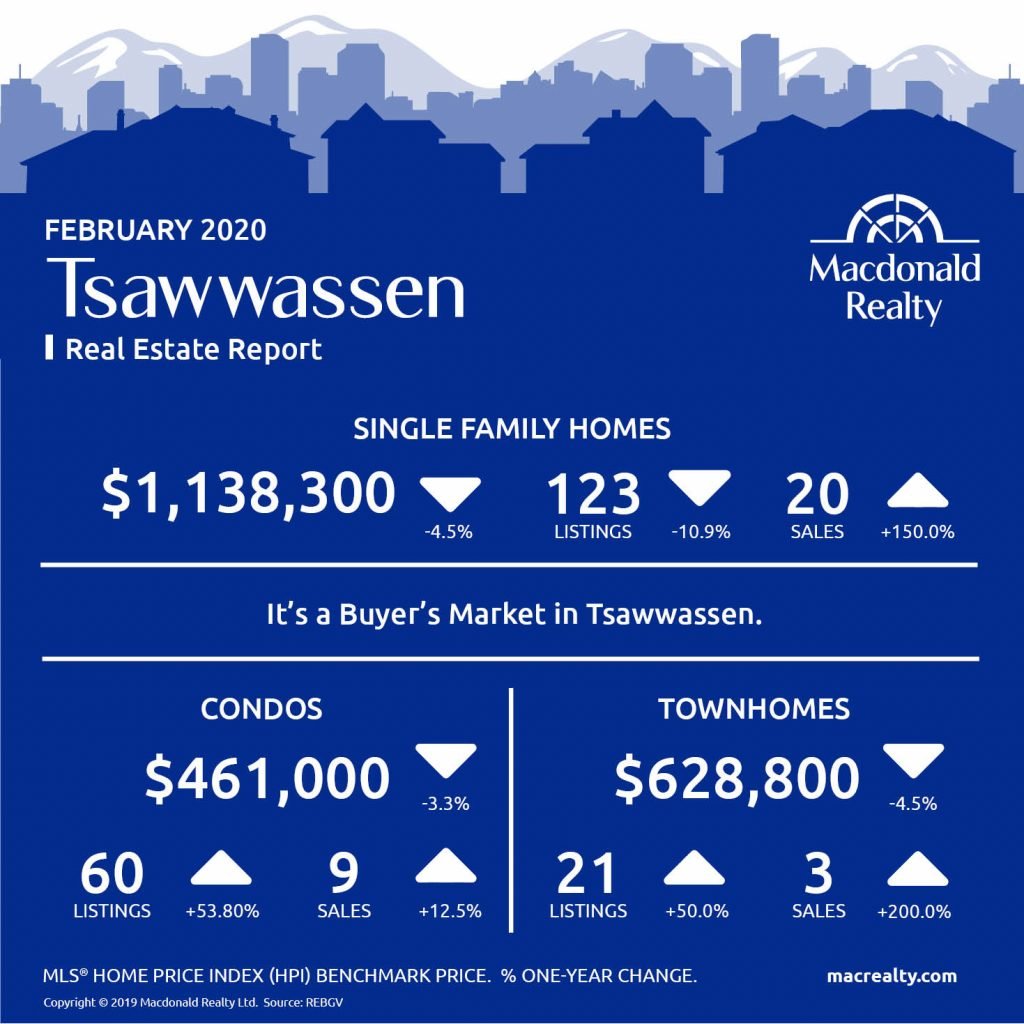
Vancouver East

Vancouver West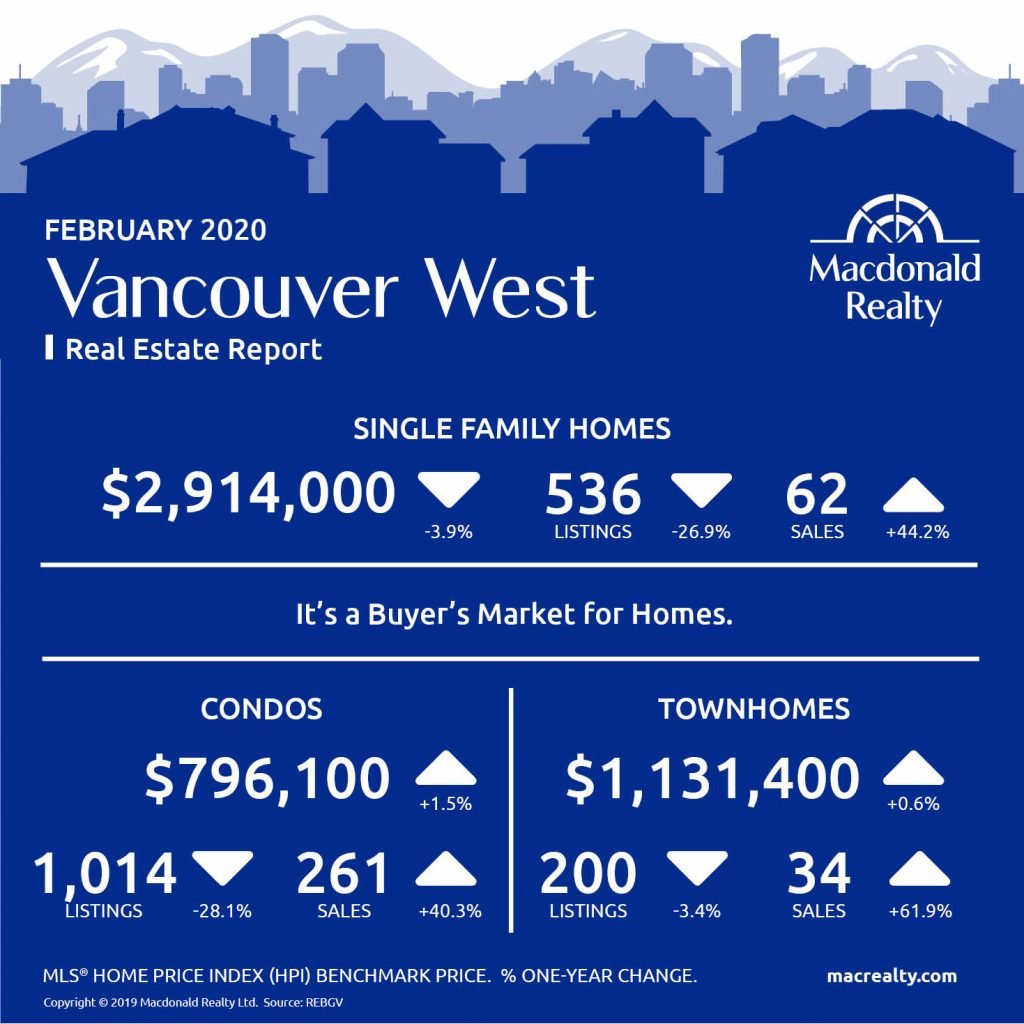
West Vancouver
Looking for more information about the real estate market in specific neighbourhoods in the Greater Vancouver?
Macdonald Realty has offices across the Greater Vancouver. Please email [email protected] or call 1-877-278-3888 to be matched with a REALTOR® working in your area.
MLS® Home Price Index (HPI) Benchmark Price
Average and median home prices are often misinterpreted, are affected by change in the mix of homes sold, and can swing dramatically from month to month (based on the types and prices of properties that sold in a given month). The MLS® HPI overcomes these shortcomings and uses the concept of a benchmark home, a notional home with common attributes of typical homes in a defined area. Visit www.housepriceindex.ca for more information.
This blog post is based on market data provided by the Real Estate Board of Greater Vancouver (REBGV) www.rebgv.org
by Macrealty Marketing Team | Feb 7, 2020 | Market Updates
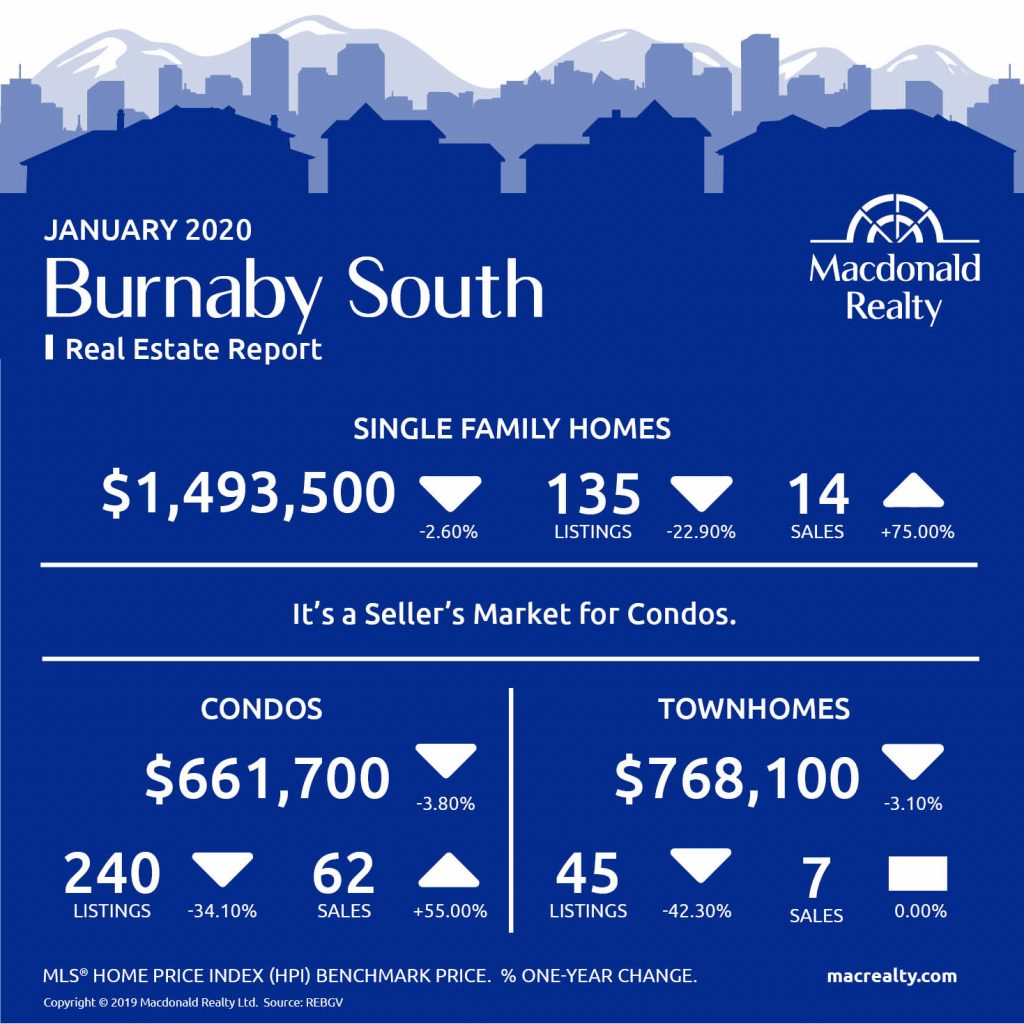
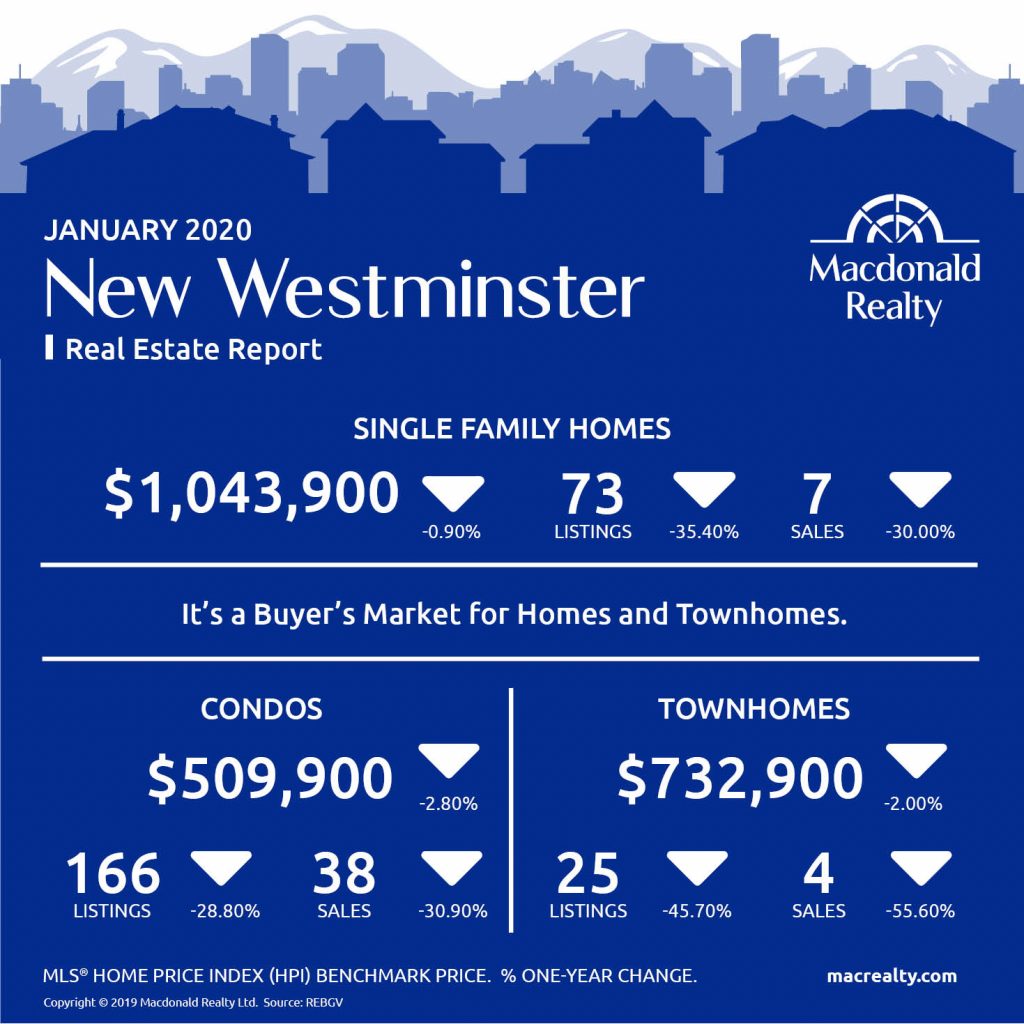
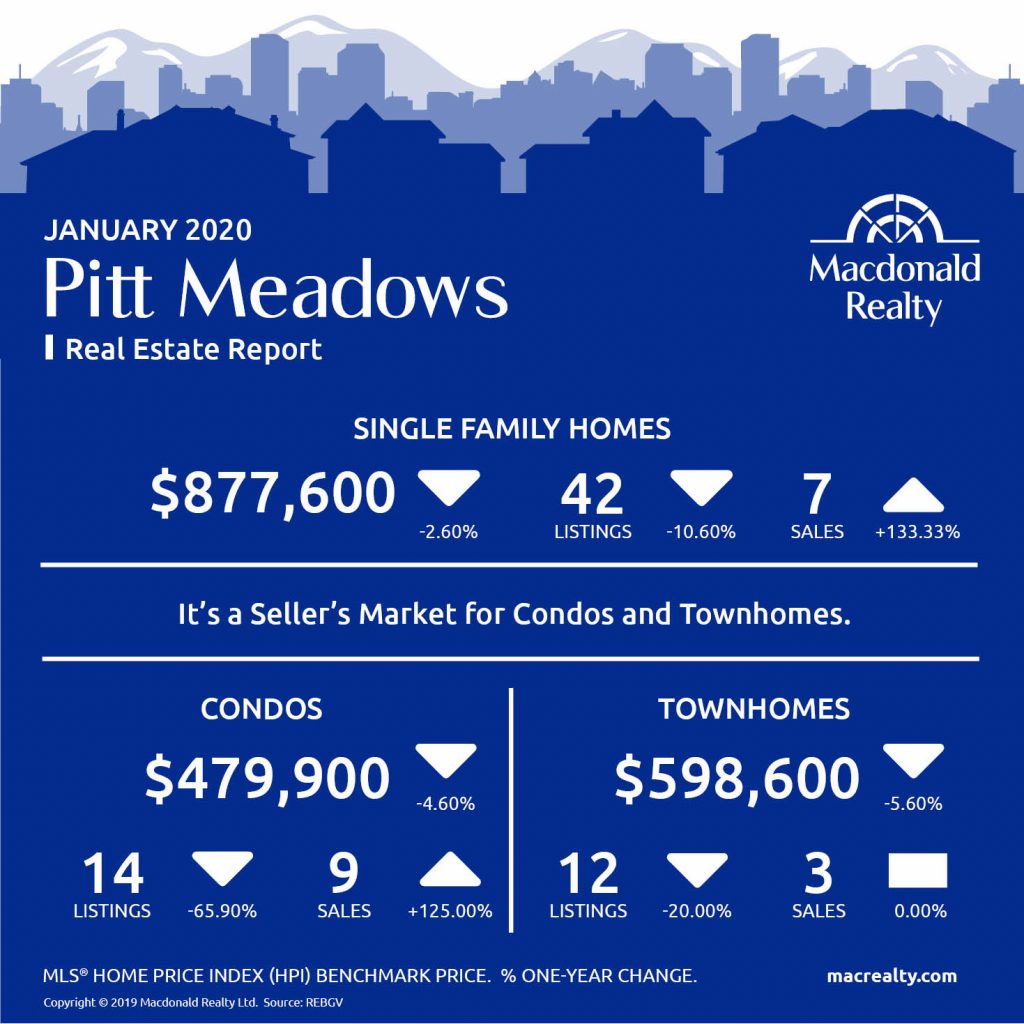
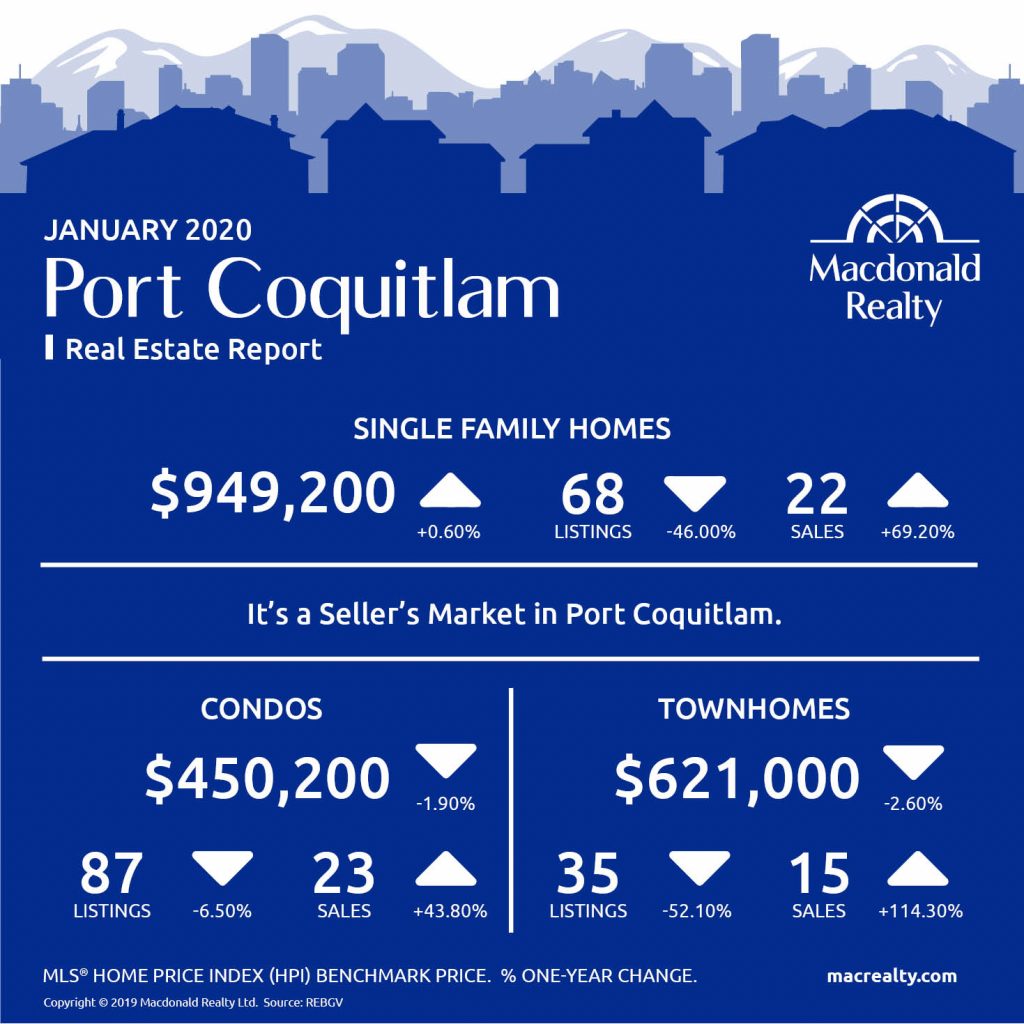
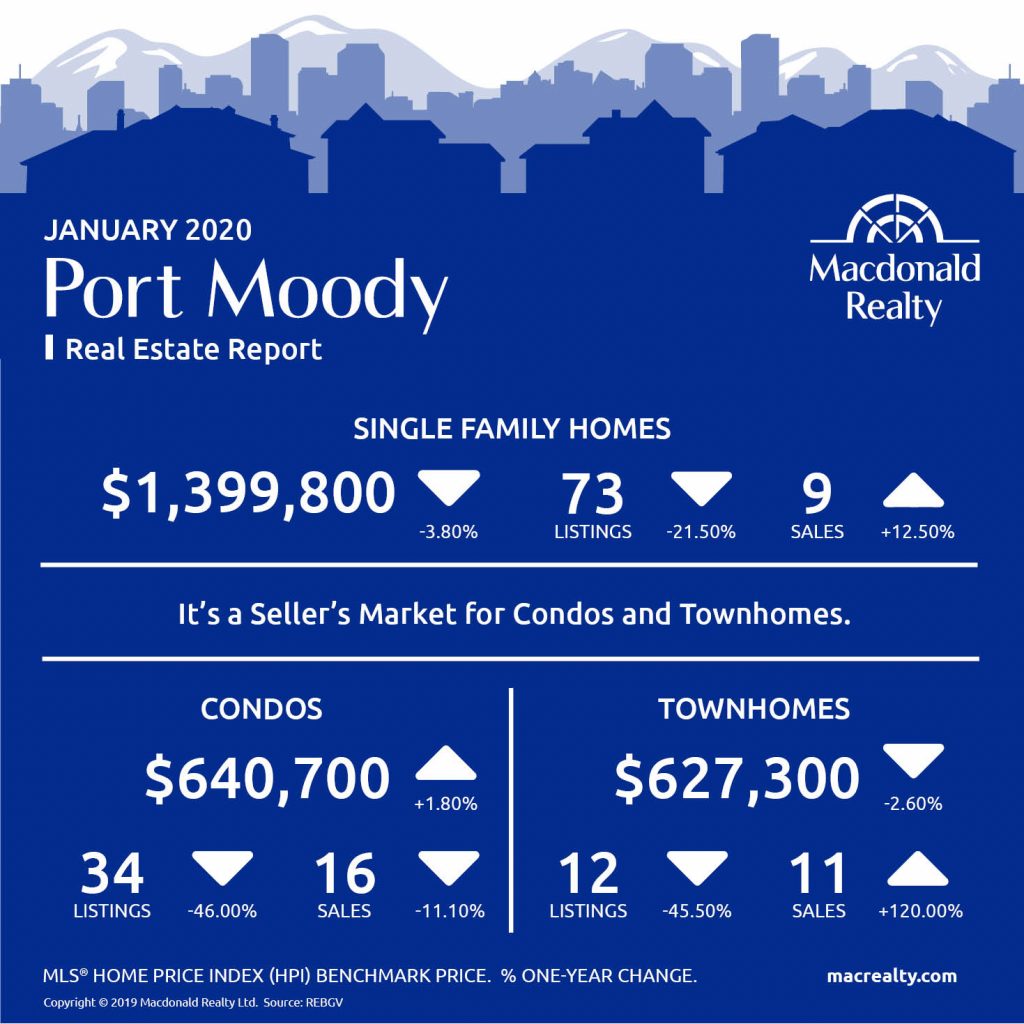
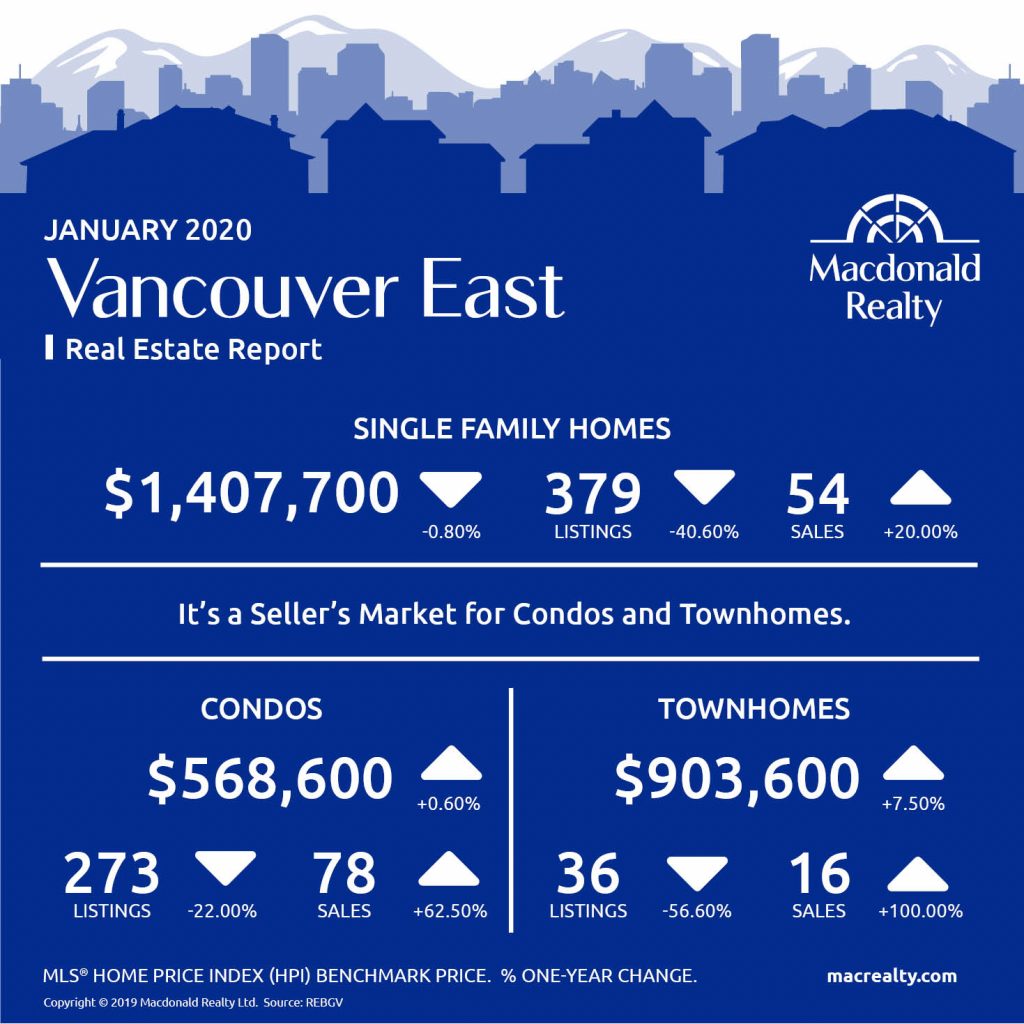
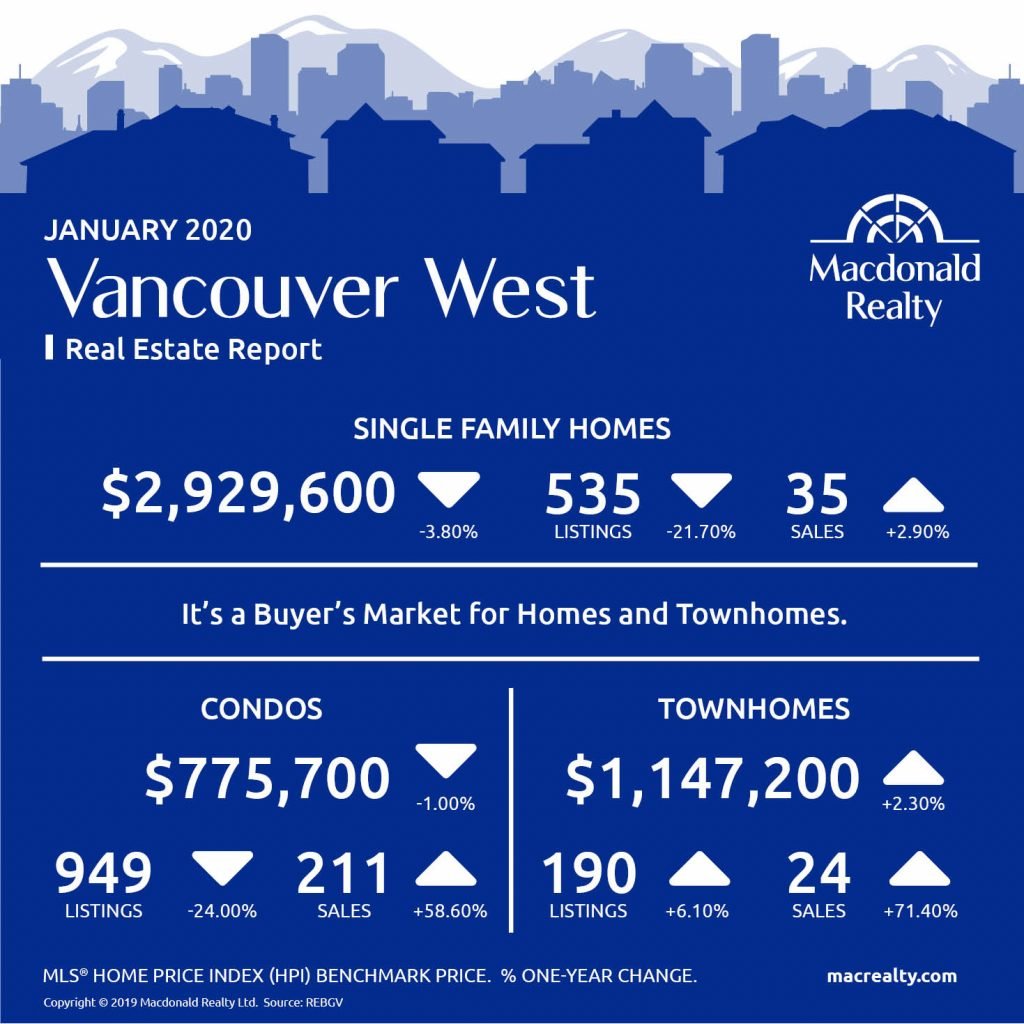
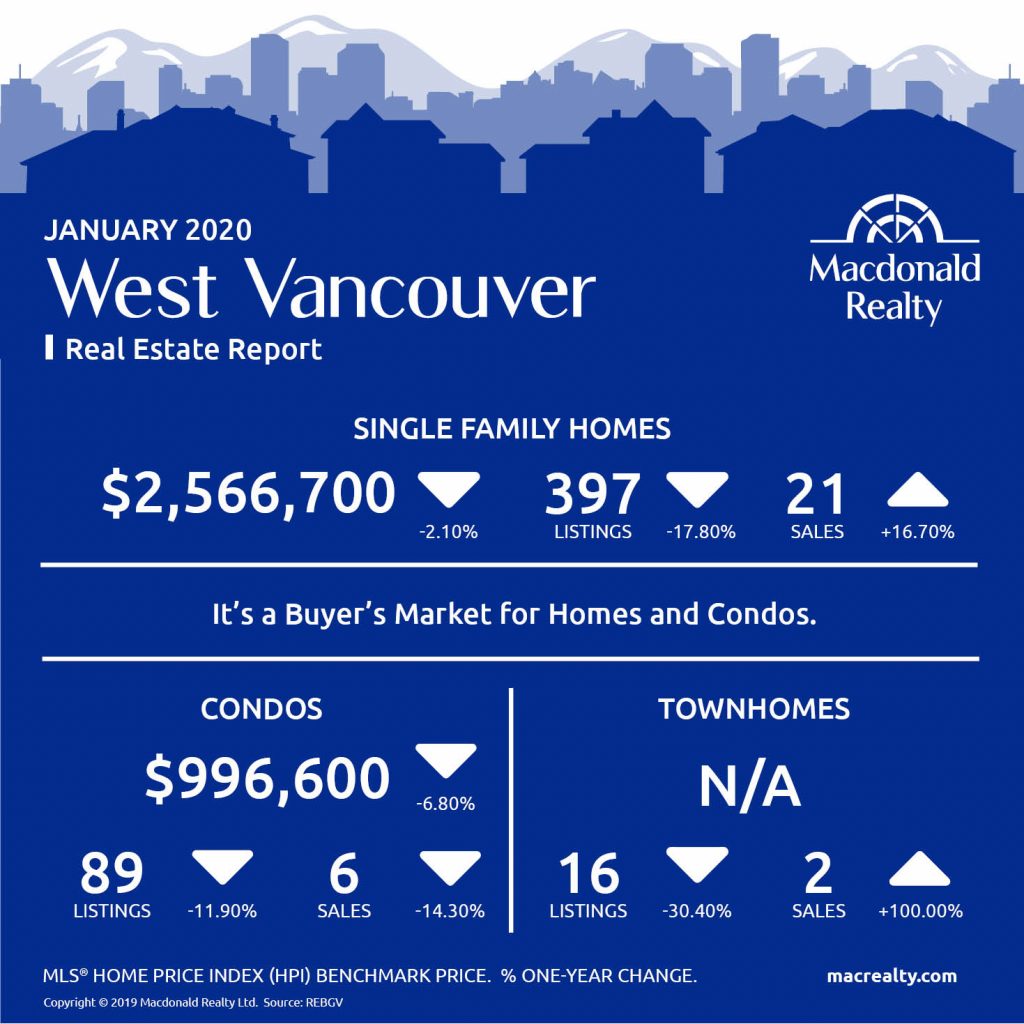
Here are the latest real estate market statistics from Macdonald Realty on the Greater Vancouver listings and sales in January 2020.
According to The Real Estate Board of Greater the Metro Vancouver home sale and price activity remained steady in Metro Vancouver to start 2020 while home listing activity declined in January.
As mentioned in the REBGV report the residential home sales in the region totaled 1,571 in January 2020, a 42.4 per cent increase from the 1,103 sales recorded in January 2019, and a 22.1 per cent decrease from the 2,016 homes sold in December 2019.
Ashley Smith, REBGV president said that 2020 begun with steady home buyer demand that tracks close to the region’s long-term average.
She added, “Looking at supply, we’re seeing fewer homes listed for sale than is typical for this time of year. As we approach the traditionally more active spring market, we’ll keep a close eye on supply to see if the number of homes being listed is keeping pace with demand.”
Bowen Island

Burnaby East
Burnaby North
Burnaby South
Coquitlam

Ladner

Maple Ridge

New Westminster
North Vancouver

Pitt Meadows
Port Coquitlam
Port Moody
Richmond

Tsawwassen

Vancouver East
Vancouver West
West Vancouver
Looking for more information about the real estate market in specific neighbourhoods in the Greater Vancouver?
Macdonald Realty has offices across the Greater Vancouver. Please email [email protected] or call 1-877-278-3888 to be matched with a REALTOR® working in your area.
MLS® Home Price Index (HPI) Benchmark Price
Average and median home prices are often misinterpreted, are affected by change in the mix of homes sold, and can swing dramatically from month to month (based on the types and prices of properties that sold in a given month). The MLS® HPI overcomes these shortcomings and uses the concept of a benchmark home, a notional home with common attributes of typical homes in a defined area. Visit www.housepriceindex.ca for more information.
This blog post is based on market data provided by the Real Estate Board of Greater Vancouver (REBGV) www.rebgv.org
by Macrealty Marketing Team | Jan 8, 2020 | Market Updates
According to the Real Estate Board of Greater the Metro Vancouver housing market experienced below-average sales activity and moderate price declines in 2019.
“We didn’t see typical seasonal patterns in 2019. Homebuyer demand was quieter in the normally busy spring season and it picked up in the second half of the year,” Ashley Smith, REBGV president said. “In terms of home values, prices dipped between two and four percent across the region last year depending on the property type.”
Here are the latest real estate market statistics from Macdonald Realty on the Greater Vancouver listings and sales in December 2019.
Vancouver-East
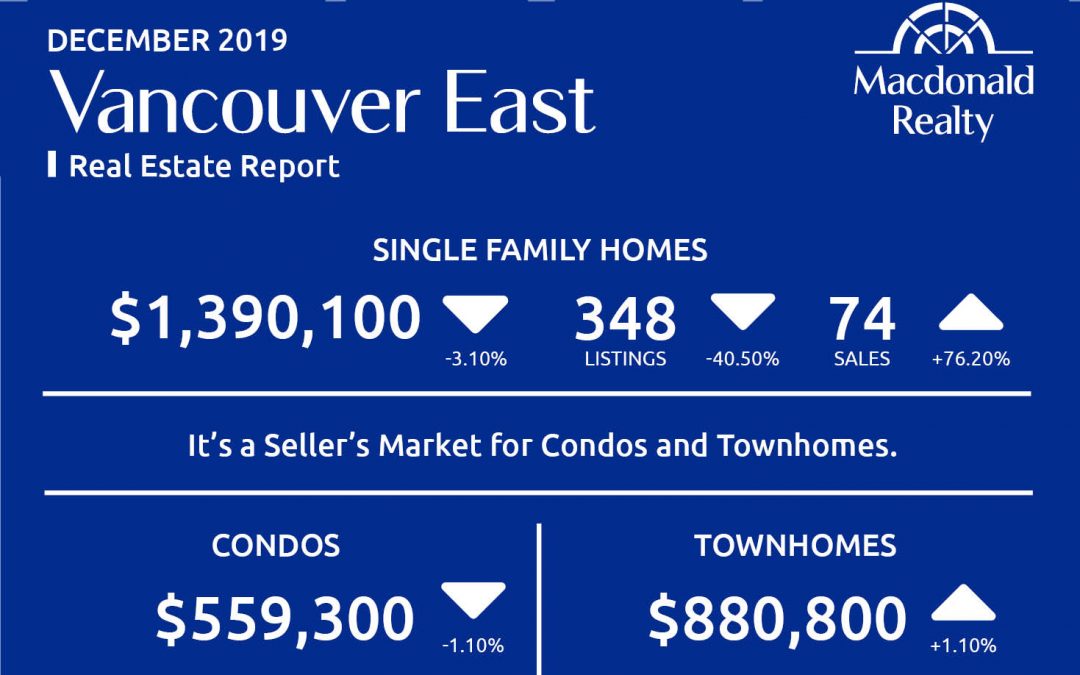
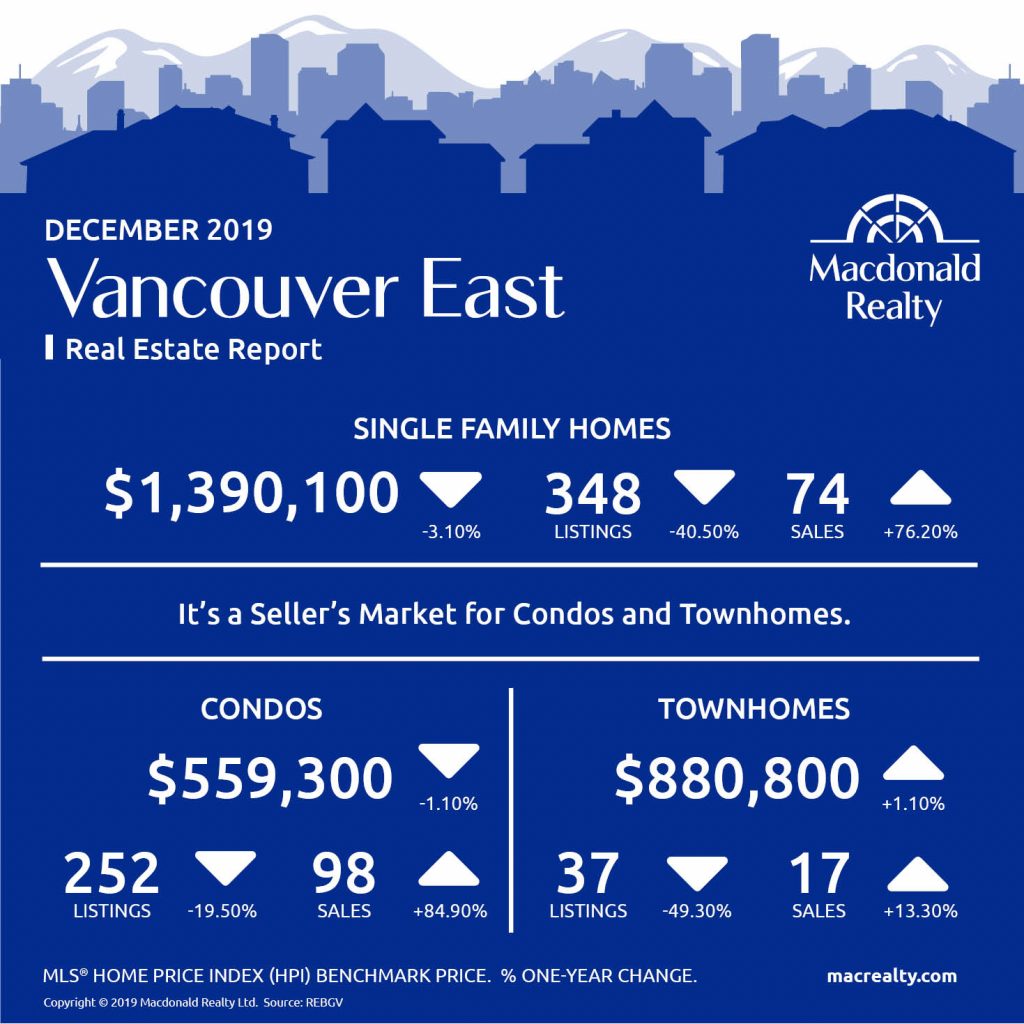
Vancouver-East had 74 sales and 348 active listings for detached homes at the end of the month. The benchmark sales price was $1,390,100.
The condo market featured 98 sales, 252 active listings, and a benchmark sales price was $559,300.
The townhome market had 17 sales and 37 active listings. The benchmark sale price was $880,800.
It’s a seller’s market for condos and townhomes in Vancouver-East.
Vancouver West
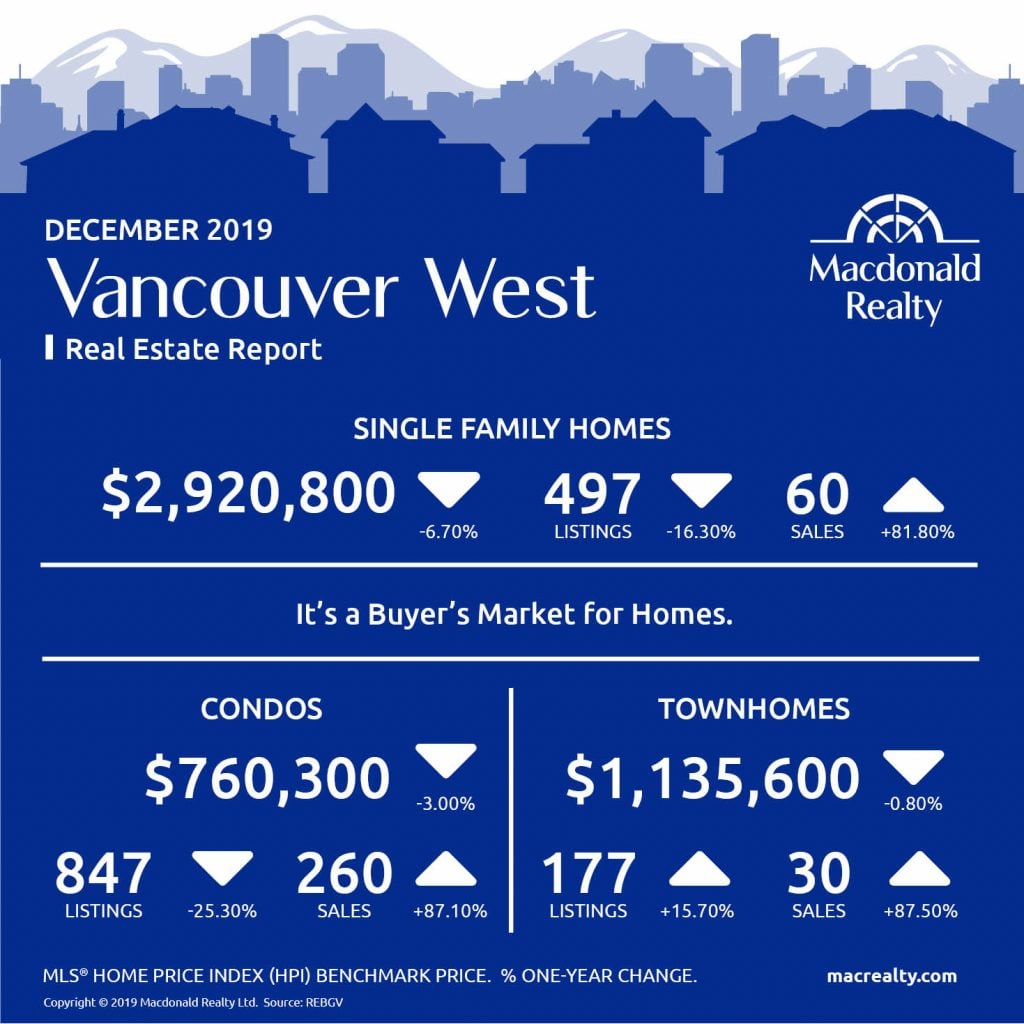
In December, Vancouver West market had 60 sales and 497 active listings for detached homes. The benchmark sale price was $2,920,800.
There were 260 sales and 847 active listings for condos. The benchmark sale price was $760,300.
The townhome market had 30 sales and 177 active listings. The benchmark sale price was $1,135,600.
It’s a buyer’s market for homes in Vancouver West.
West Vancouver
In West Vancouver, there were 28 sales of detached homes and 324 active listings at the end of the month. The benchmark sale price was $2,588,900.
In comparison, the condo market had 11 sales, 82 active listings and a benchmark sale price of $1,009,900.
The townhome market had 5 sales and 15 active listings.
It’s a buyer’s market for homes and condos in West Vancouver .

Bowen Island
Burnaby East
Burnaby North
Burnaby South
Coquitlam

Ladner
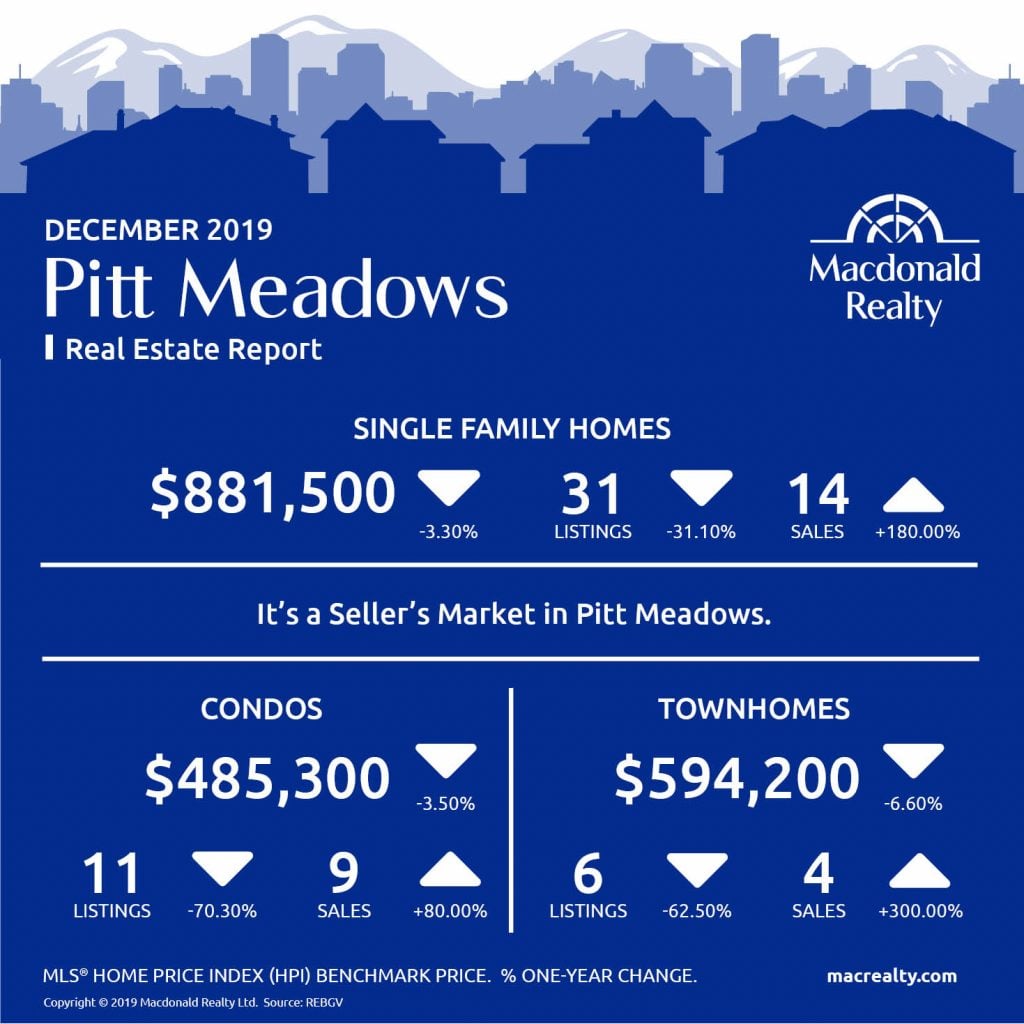
Pitt Meadows
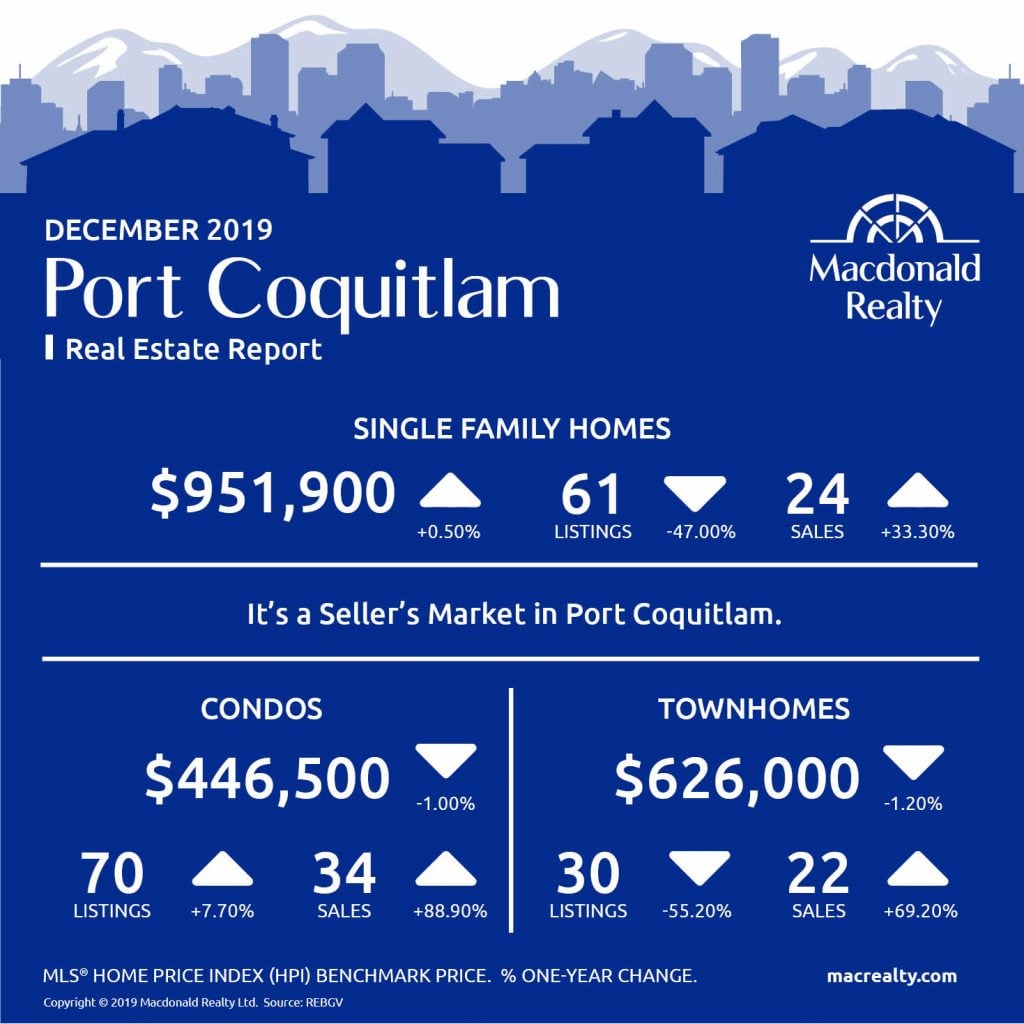
Port Coquitlam
Port Moody

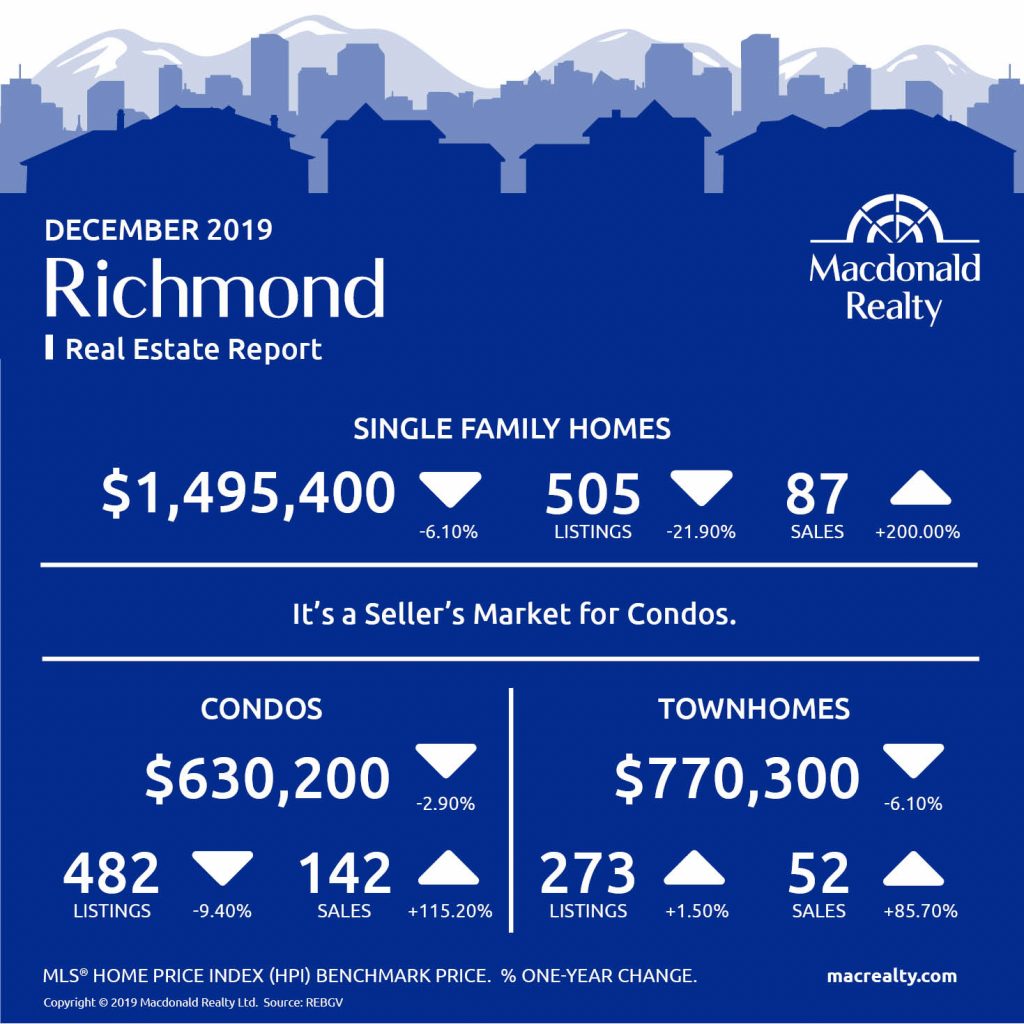
Richmond
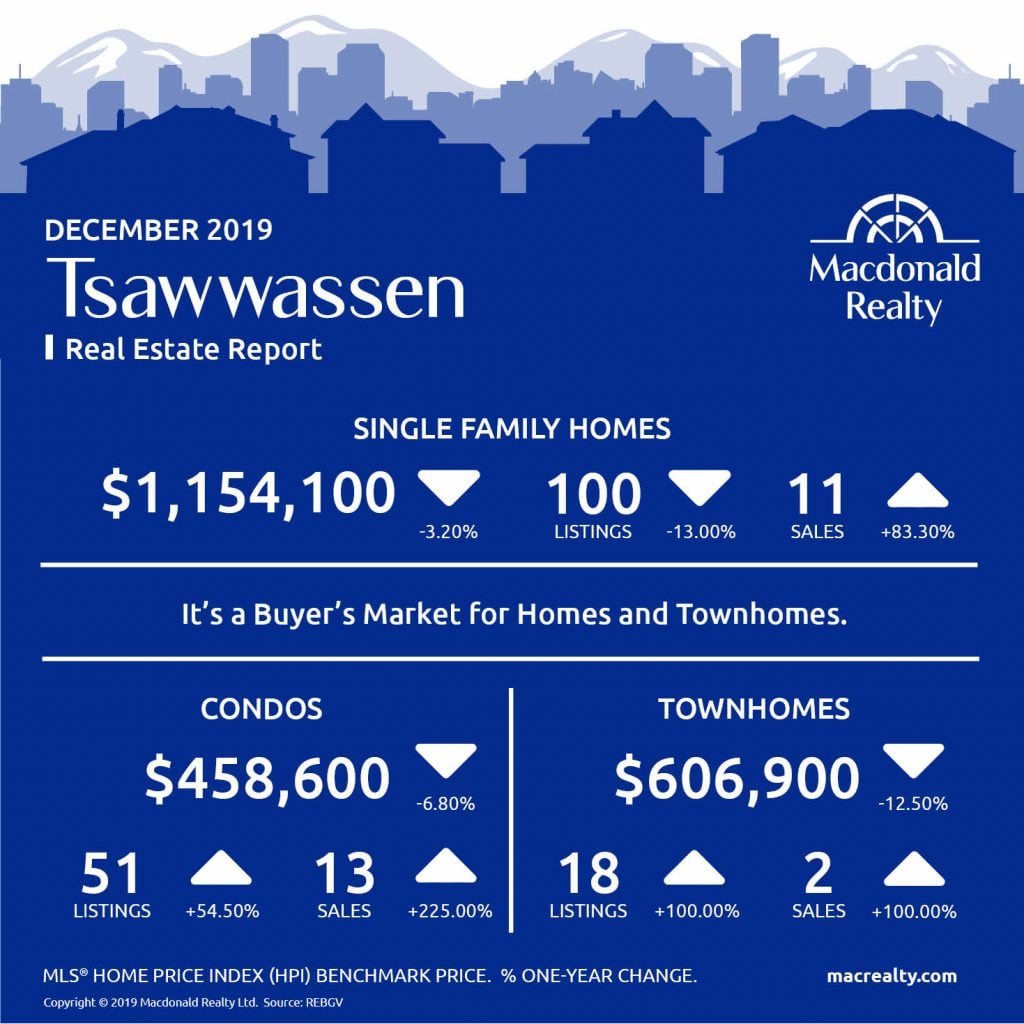
Tsawwassen
Maple Ridge

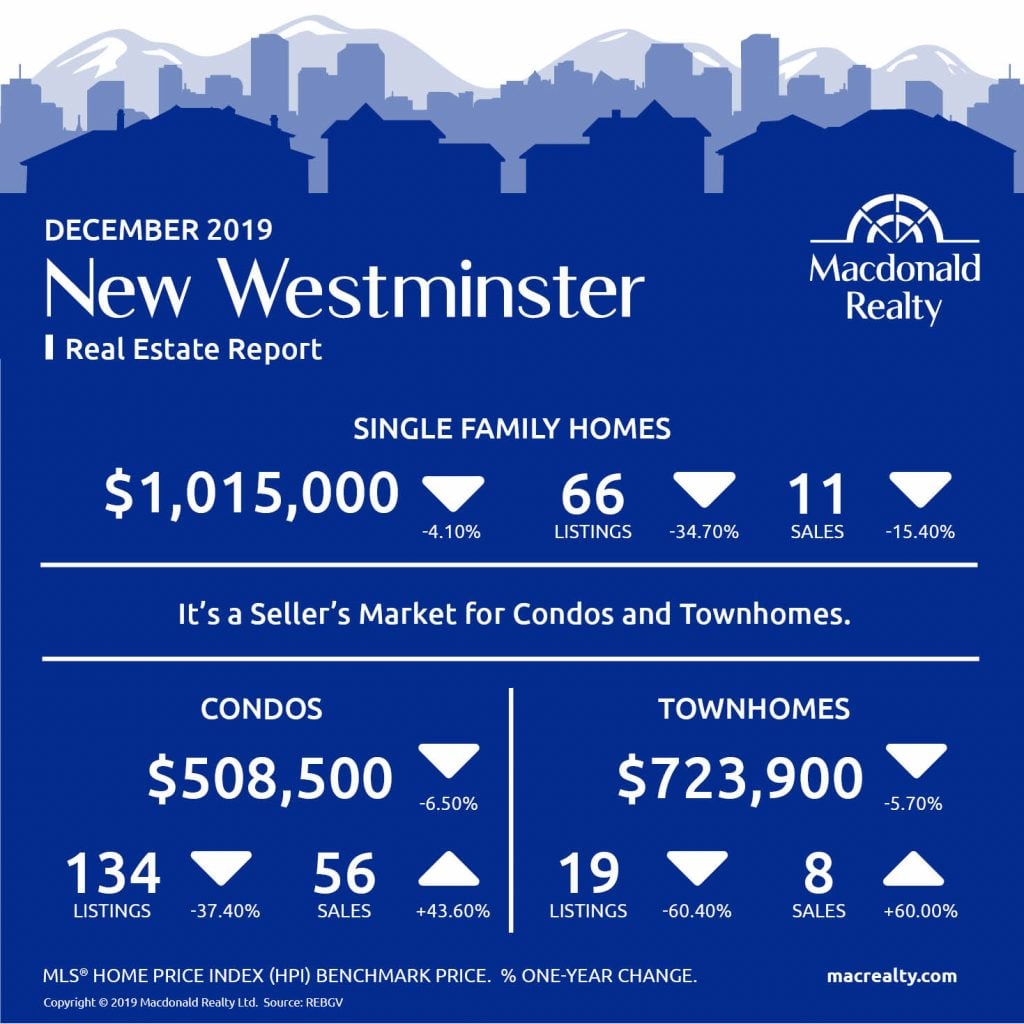
New Westminster
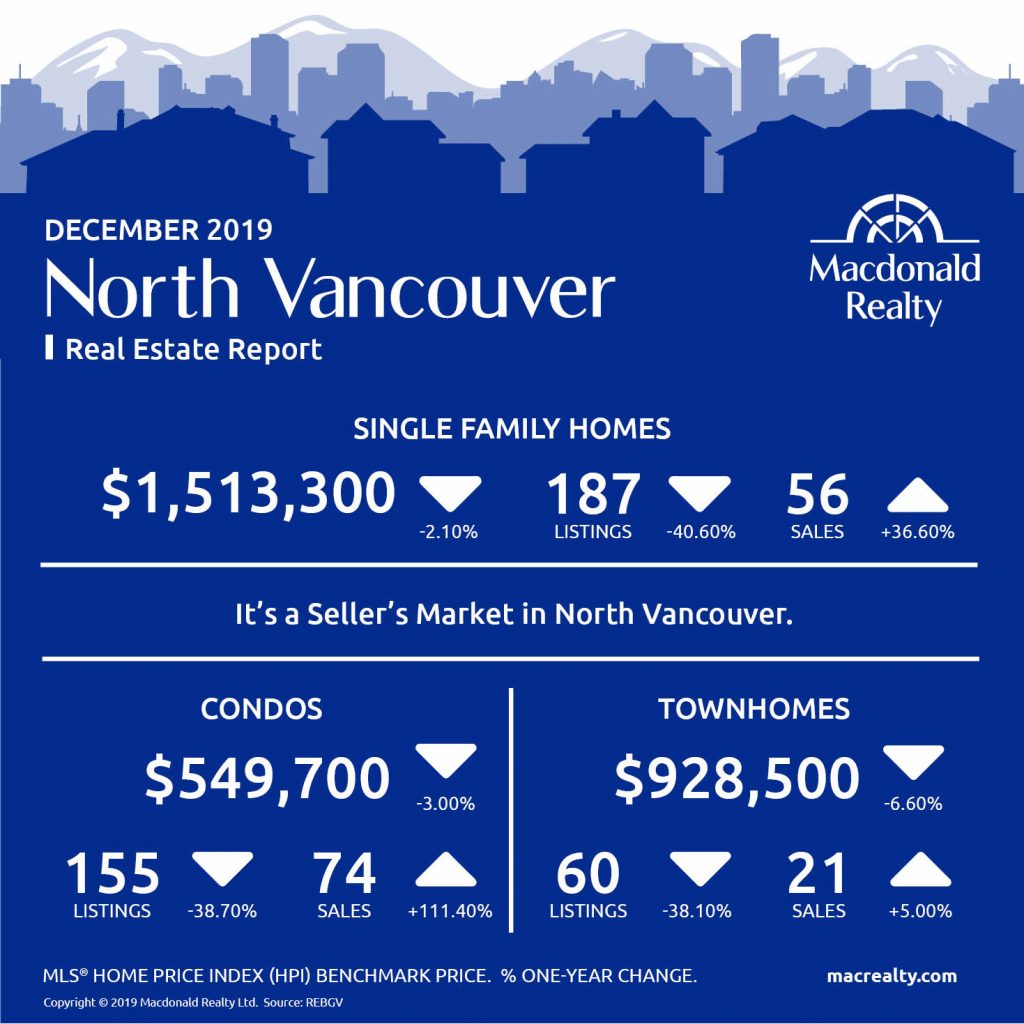
North Vancouver
Looking for more information about the real estate market in specific neighbourhoods in the Greater Vancouver?
Macdonald Realty has offices across the Greater Vancouver. Please email [email protected] or call 1-877-278-3888 to be matched with a REALTOR® working in your area.
MLS® Home Price Index (HPI) Benchmark Price
Average and median home prices are often misinterpreted, are affected by change in the mix of homes sold, and can swing dramatically from month to month (based on the types and prices of properties that sold in a given month). The MLS® HPI overcomes these shortcomings and uses the concept of a benchmark home, a notional home with common attributes of typical homes in a defined area. Visit www.housepriceindex.ca for more information.
This blog post is based on market data provided by the Real Estate Board of Greater Vancouver (REBGV) www.rebgv.org
by Macrealty Marketing Team | Dec 6, 2019 | Market Updates
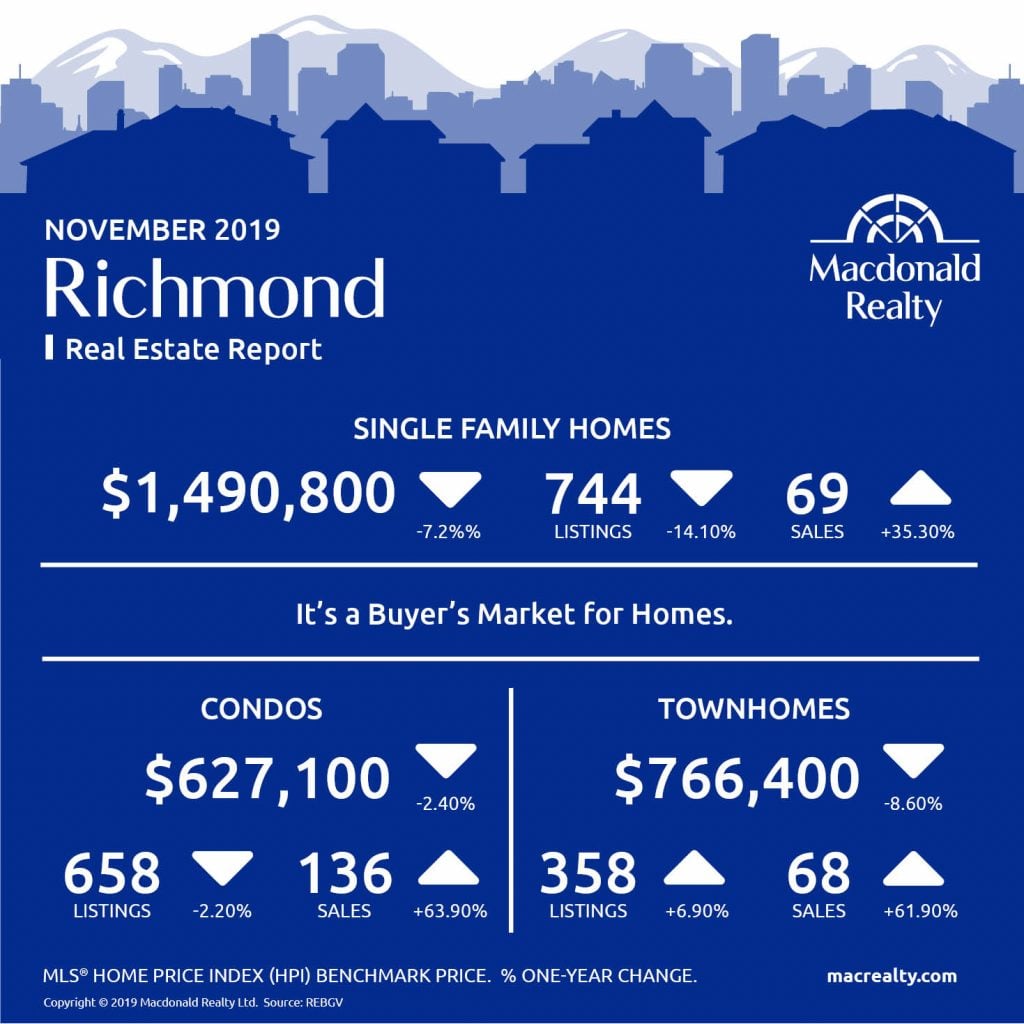
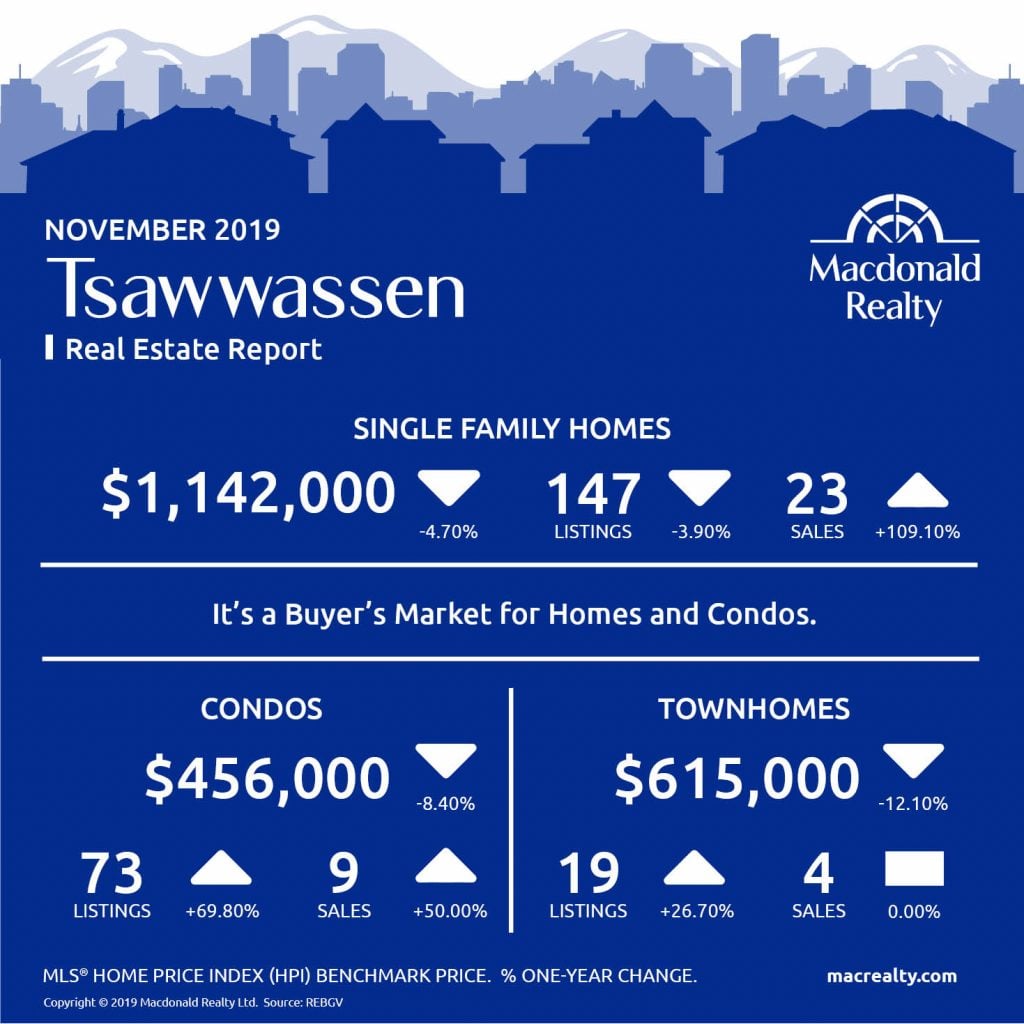
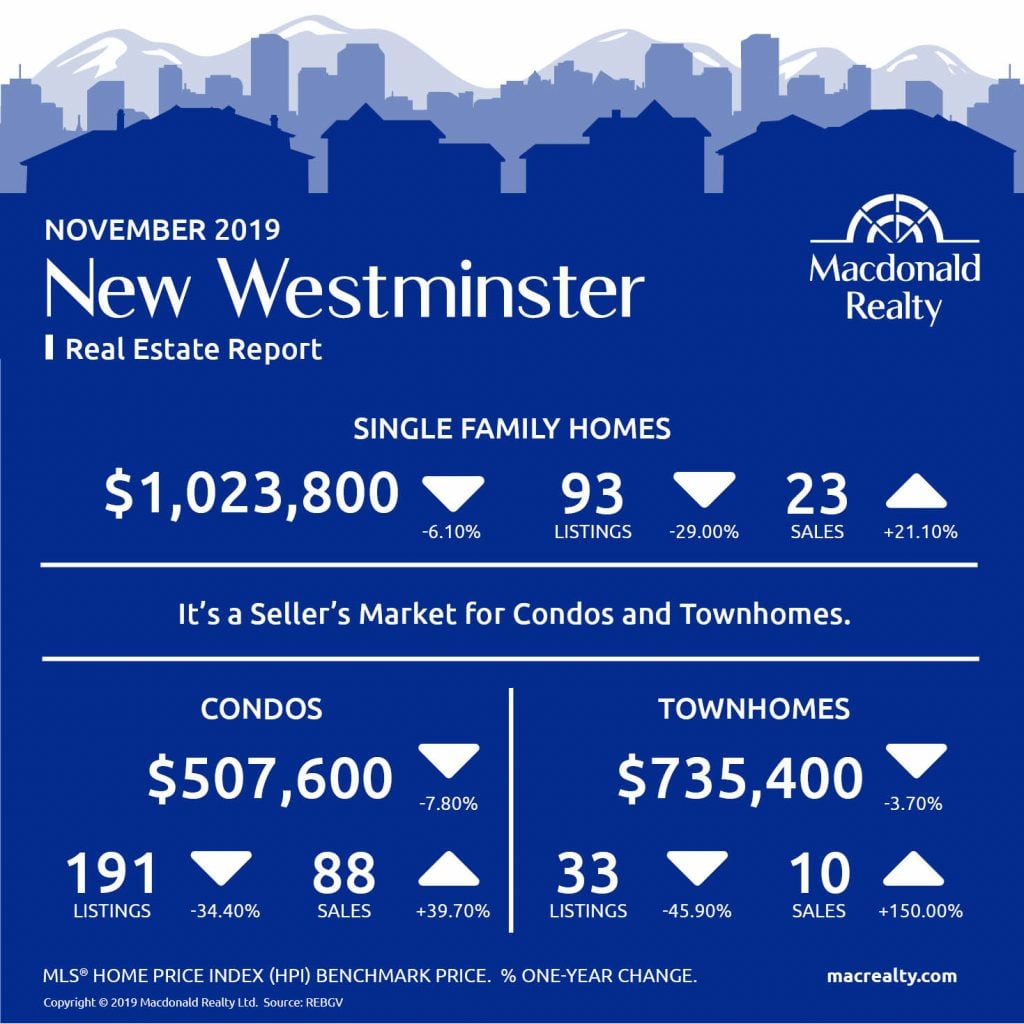
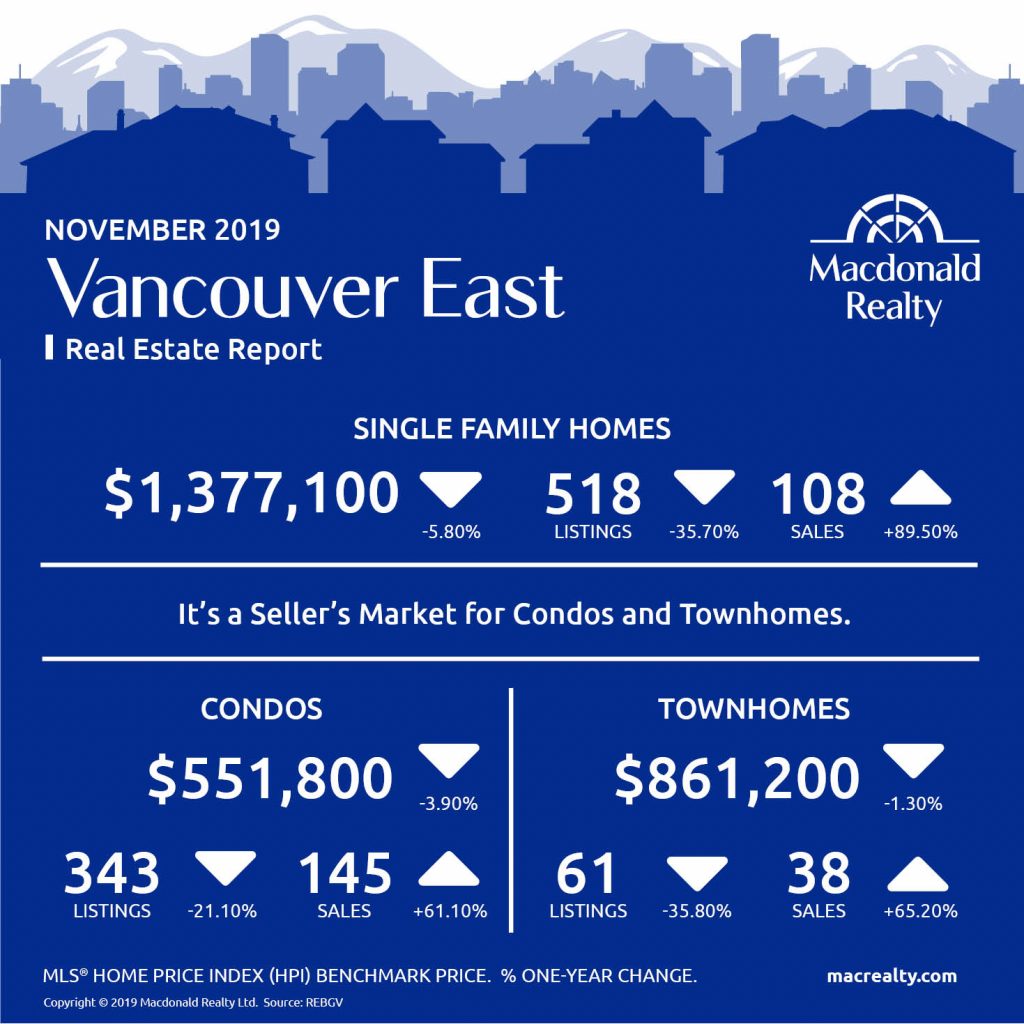
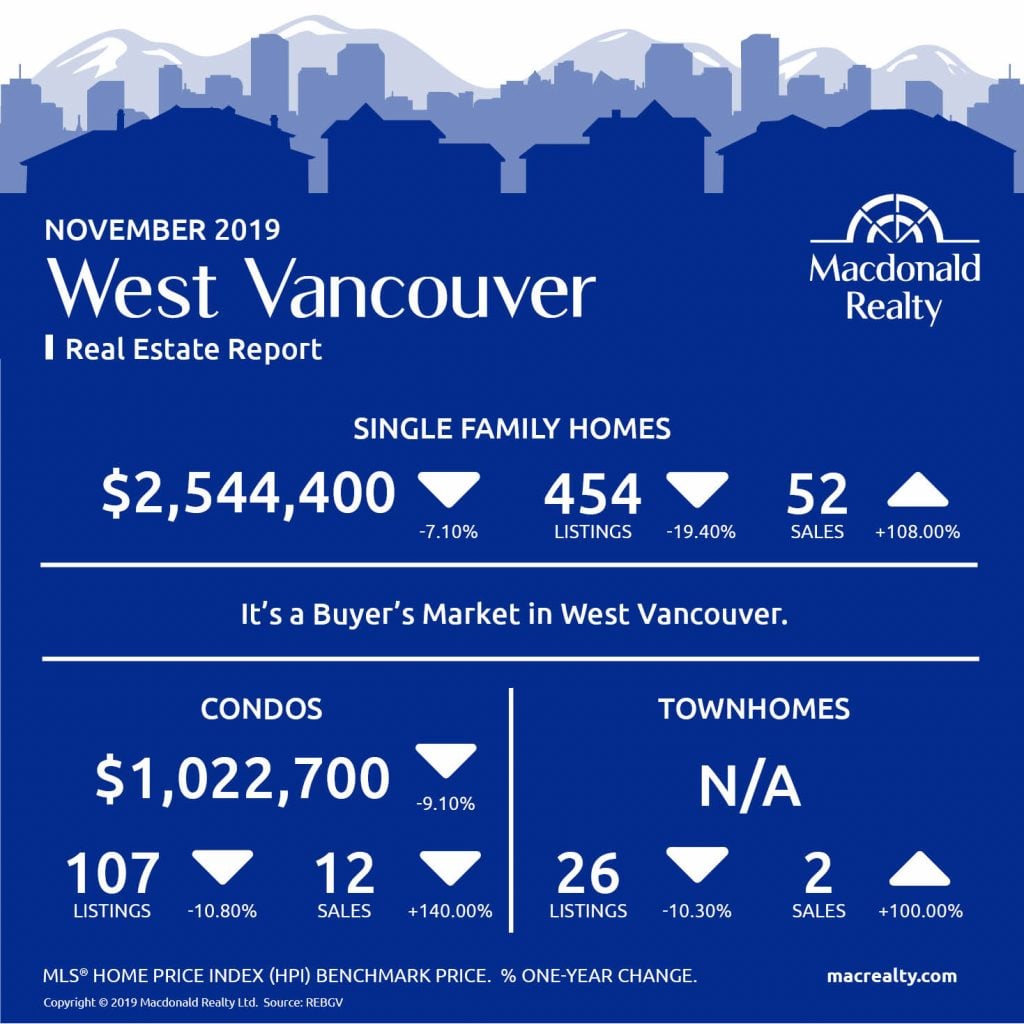
Here are the latest real estate market statistics from Macdonald Realty on the Greater Vancouver listings and sales in November 2019.
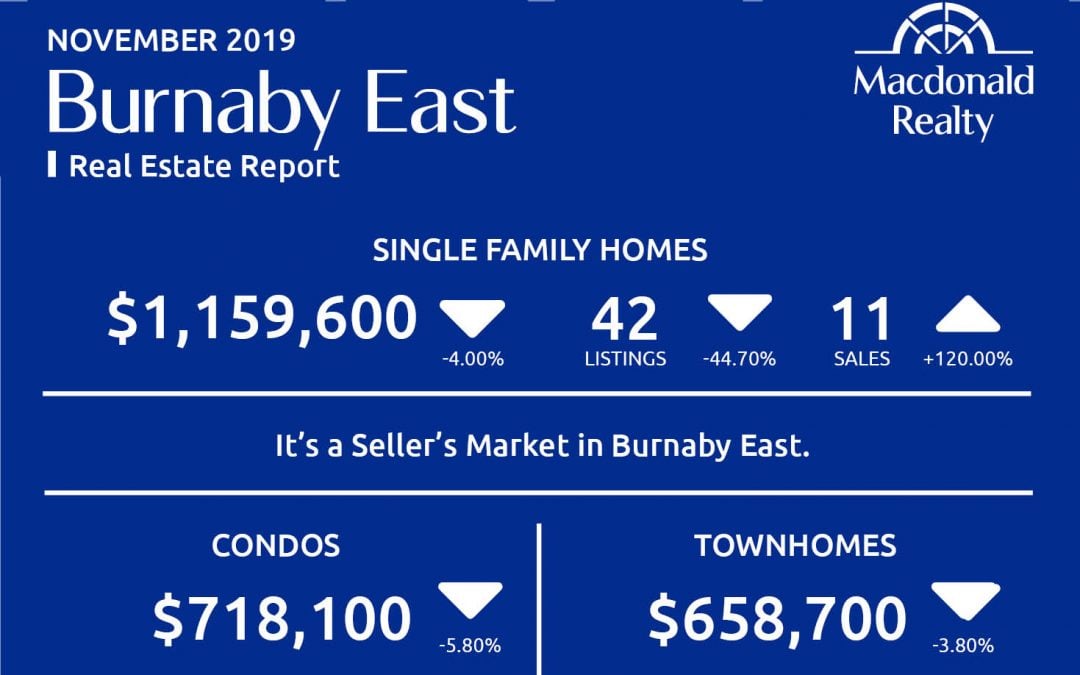
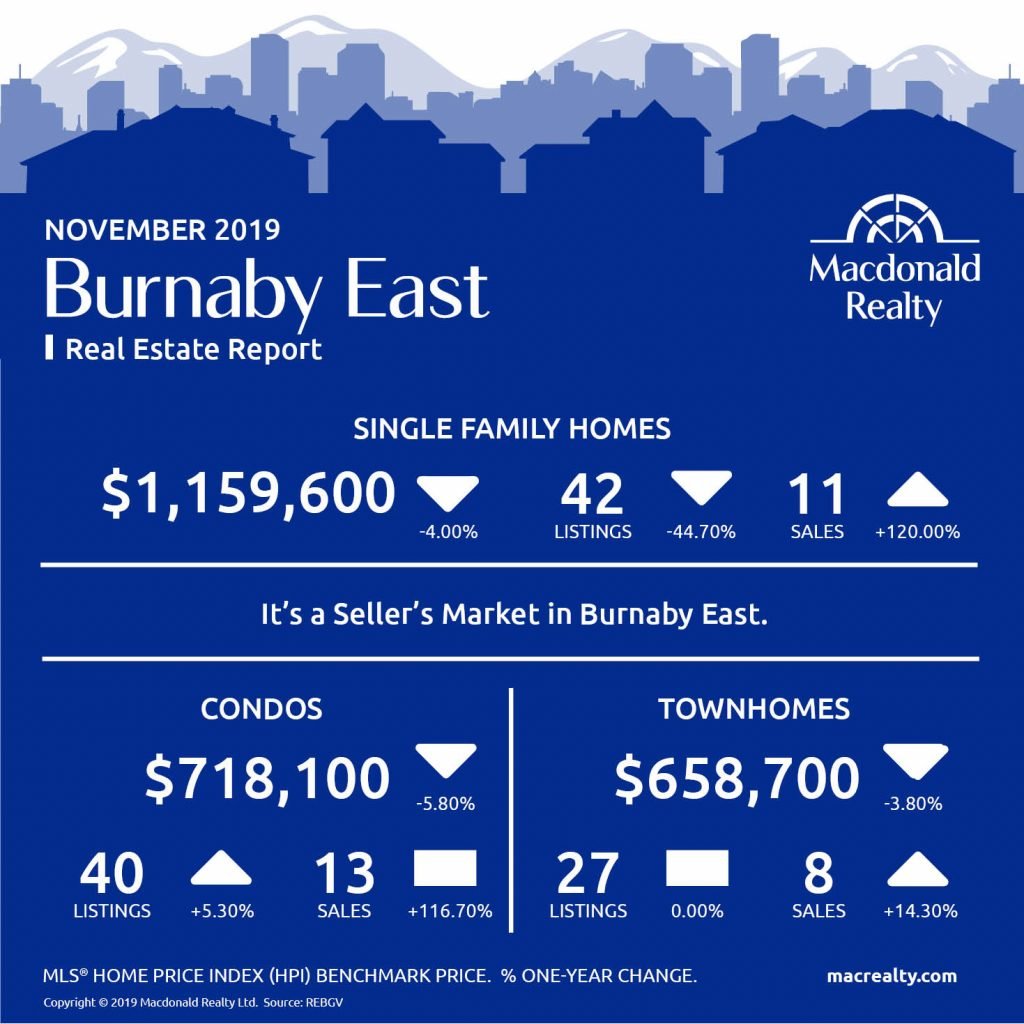
Burnaby East
Burnaby East had 11 sales and 42 active listings for detached homes at the end of the month. The benchmark sales price was $1,159,600.
The condo market featured 13 sales, 40 active listings, and a benchmark sales price was $718,100.
The townhome market had 8 sales and 27 active listings. The benchmark sale price was $658,700.
It’s a seller’s market in Burnaby East.
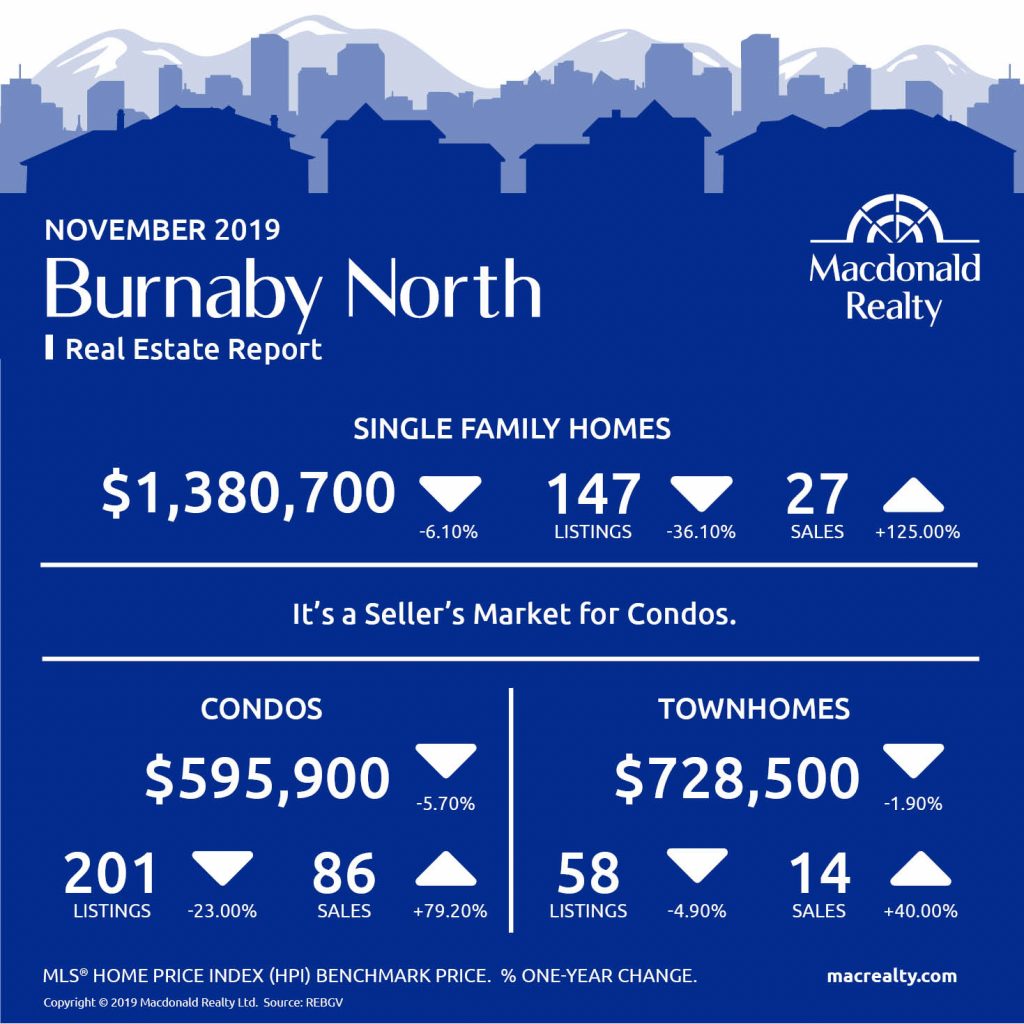
Burnaby North
In September, Burnaby North market had 27 sales and 147 active listings for detached homes. The benchmark sale price was $1,380,700.
There were 86 sales and 201 active listings for condos. The benchmark sale price was $595,900.
The townhome market had 14 sales and 58 active listings. The benchmark sale price was $728,500.
It’s a seller’s market for condos in Burnaby North.
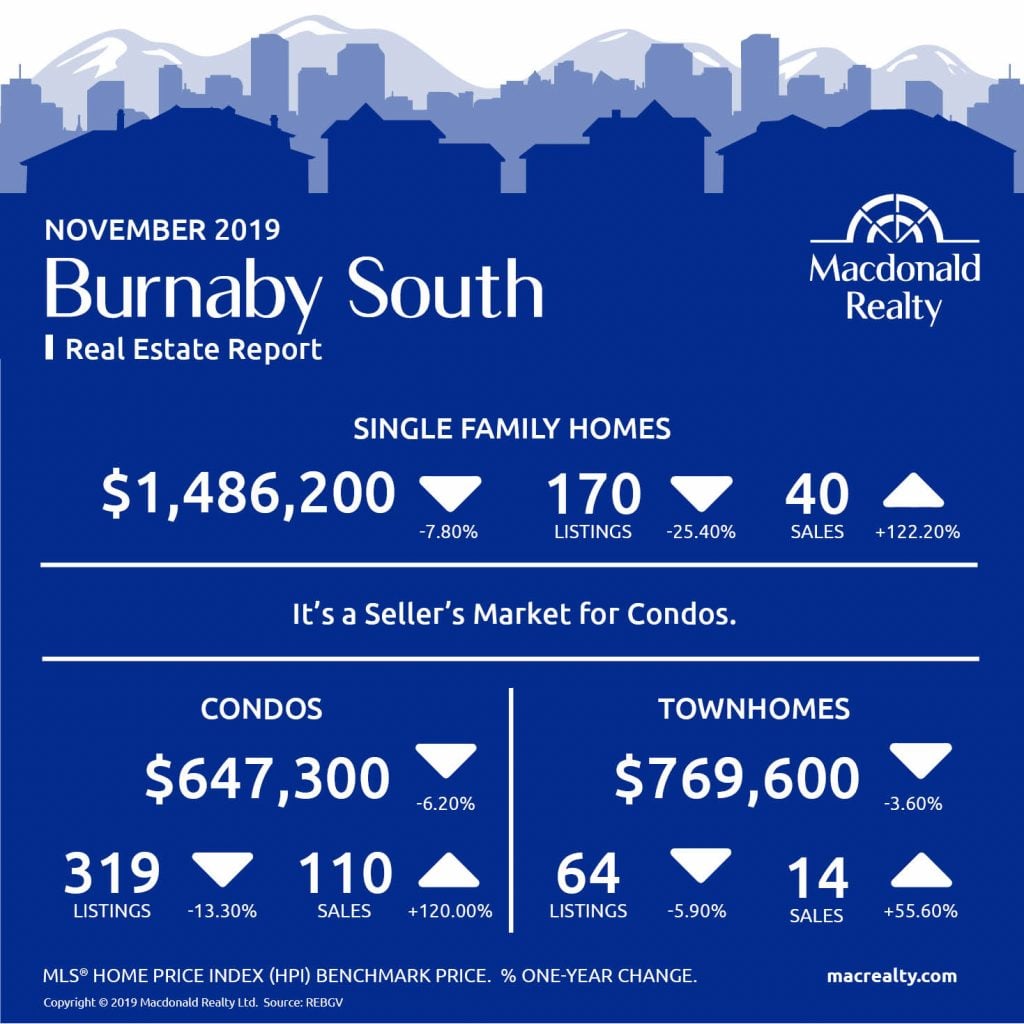
Burnaby South
In Burnaby South, there were 40 sales of detached homes and 170 active listings at the end of the month. The benchmark sale price was $1,486,200.
In comparison, the condo market had 110 sales, 319 active listings and a benchmark sale price of $647,300.
The townhome market had 14 sales and 64 active listings. The benchmark sale price was $769,600.
It’s a seller’s market for condos in Burnaby South.
Bowen Island

Coquitlam

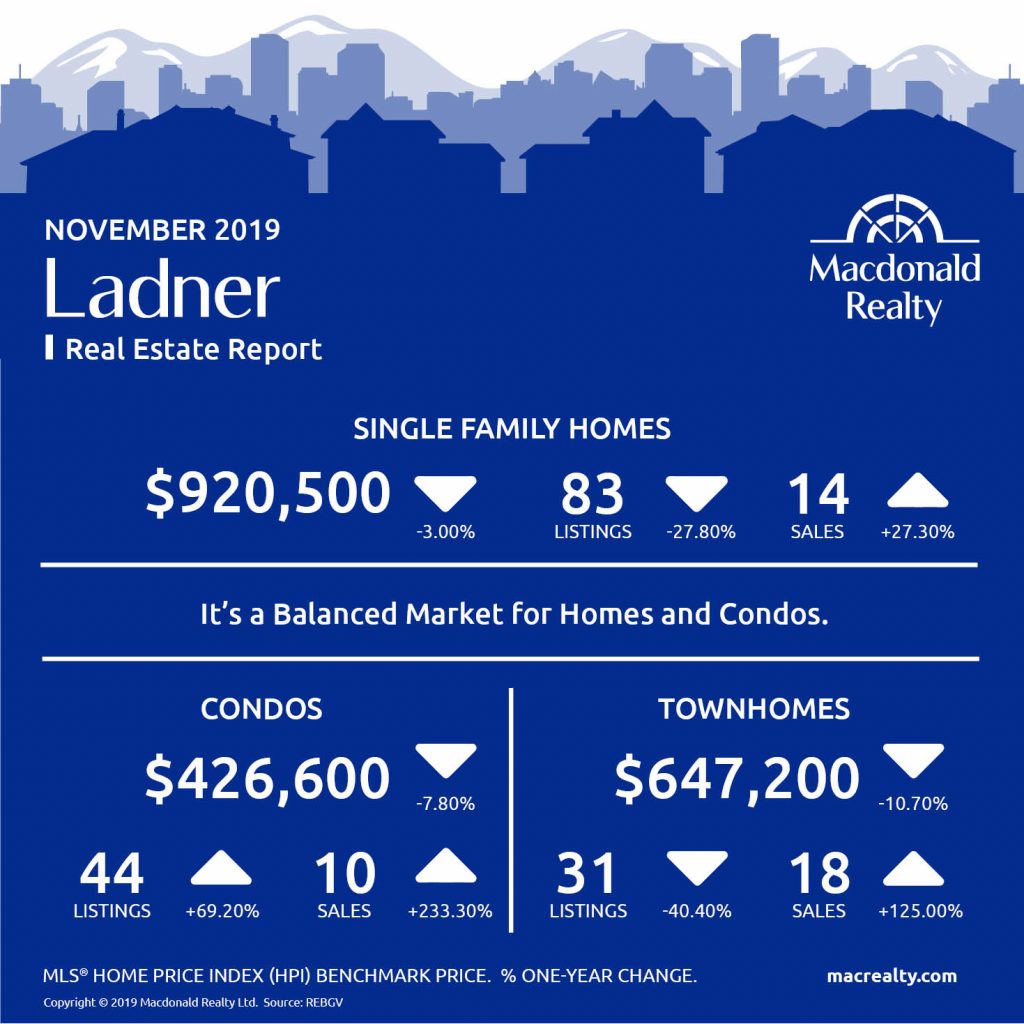
Ladner
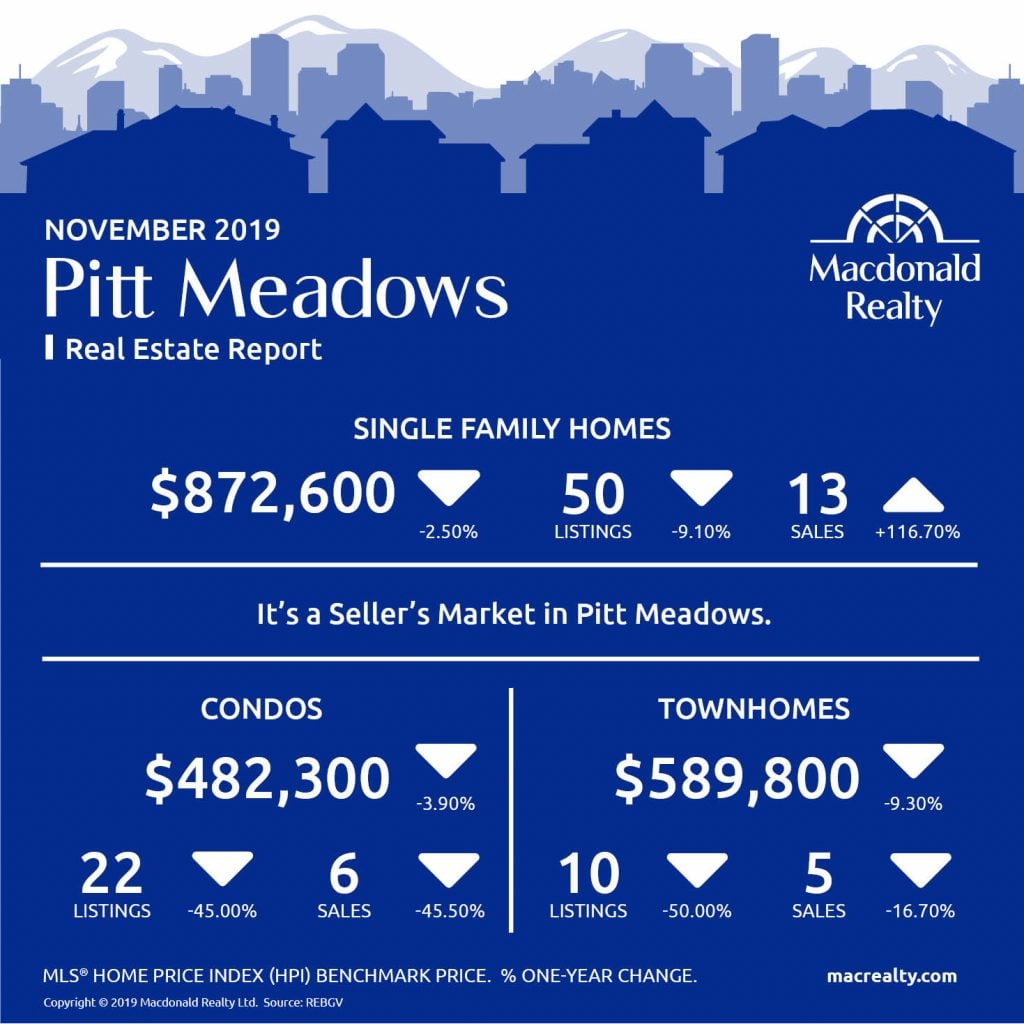
Pitt Meadows
Port Coquitlam

Port Moody

Richmond
Tsawwassen
Maple Ridge

New Westminster
North Vancouver

Vancouver-East
Vancouver-West

West Vancouver
Looking for more information about the real estate market in specific neighbourhoods in the Greater Vancouver?
Macdonald Realty has offices across the Greater Vancouver. Please email [email protected] or call 1-877-278-3888 to be matched with a REALTOR® working in your area.
MLS® Home Price Index (HPI) Benchmark Price
Average and median home prices are often misinterpreted, are affected by change in the mix of homes sold, and can swing dramatically from month to month (based on the types and prices of properties that sold in a given month). The MLS® HPI overcomes these shortcomings and uses the concept of a benchmark home, a notional home with common attributes of typical homes in a defined area. Visit www.housepriceindex.ca for more information.
This blog post is based on market data provided by the Real Estate Board of Greater Vancouver (REBGV) www.rebgv.org

