Greater Vancouver Real Estate Market Statistics – October 2019
Here are the latest real estate market statistics from Macdonald Realty on the Greater Vancouver listings and sales in October 2019.
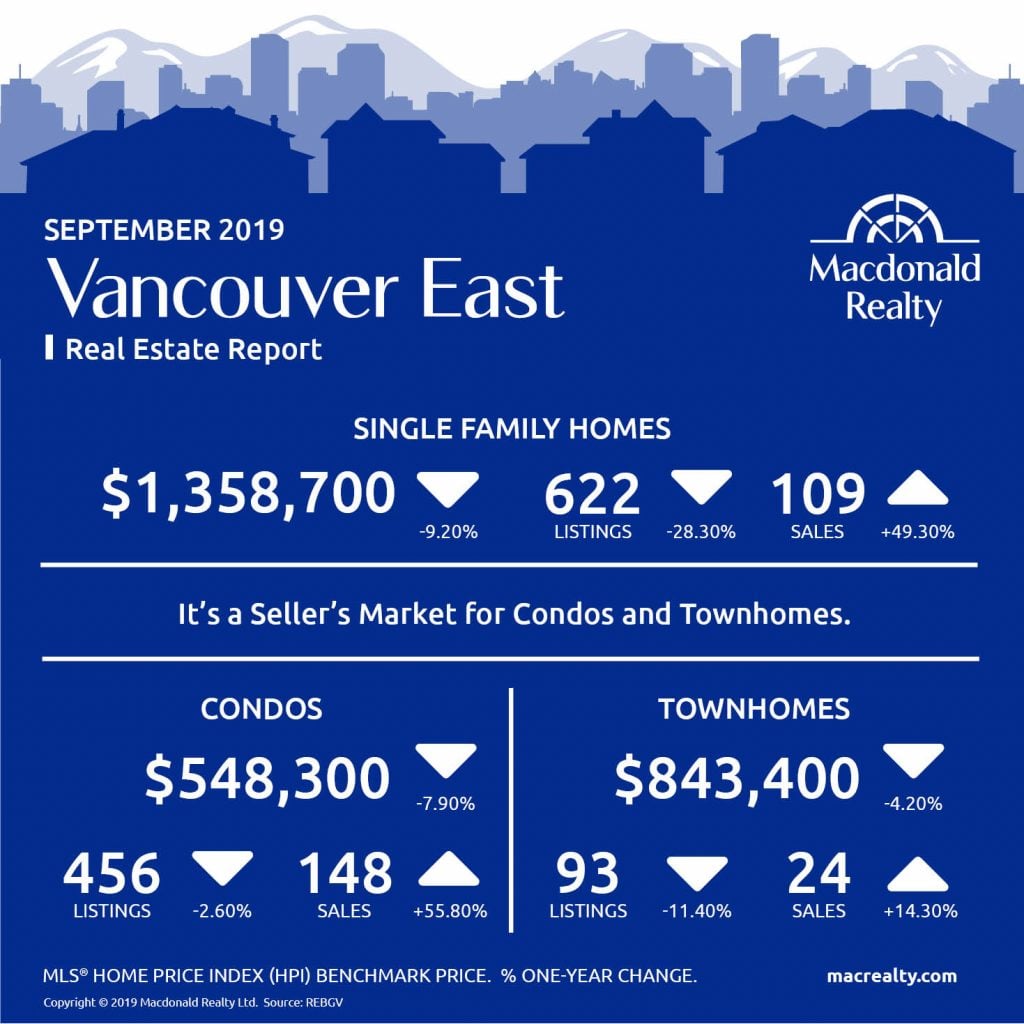
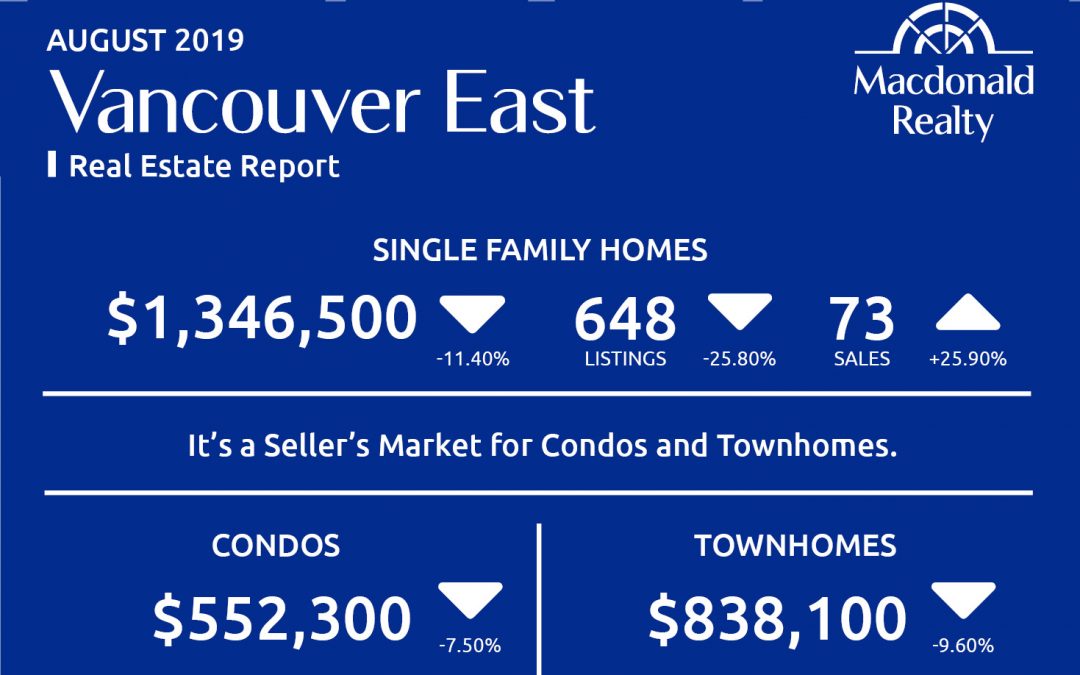
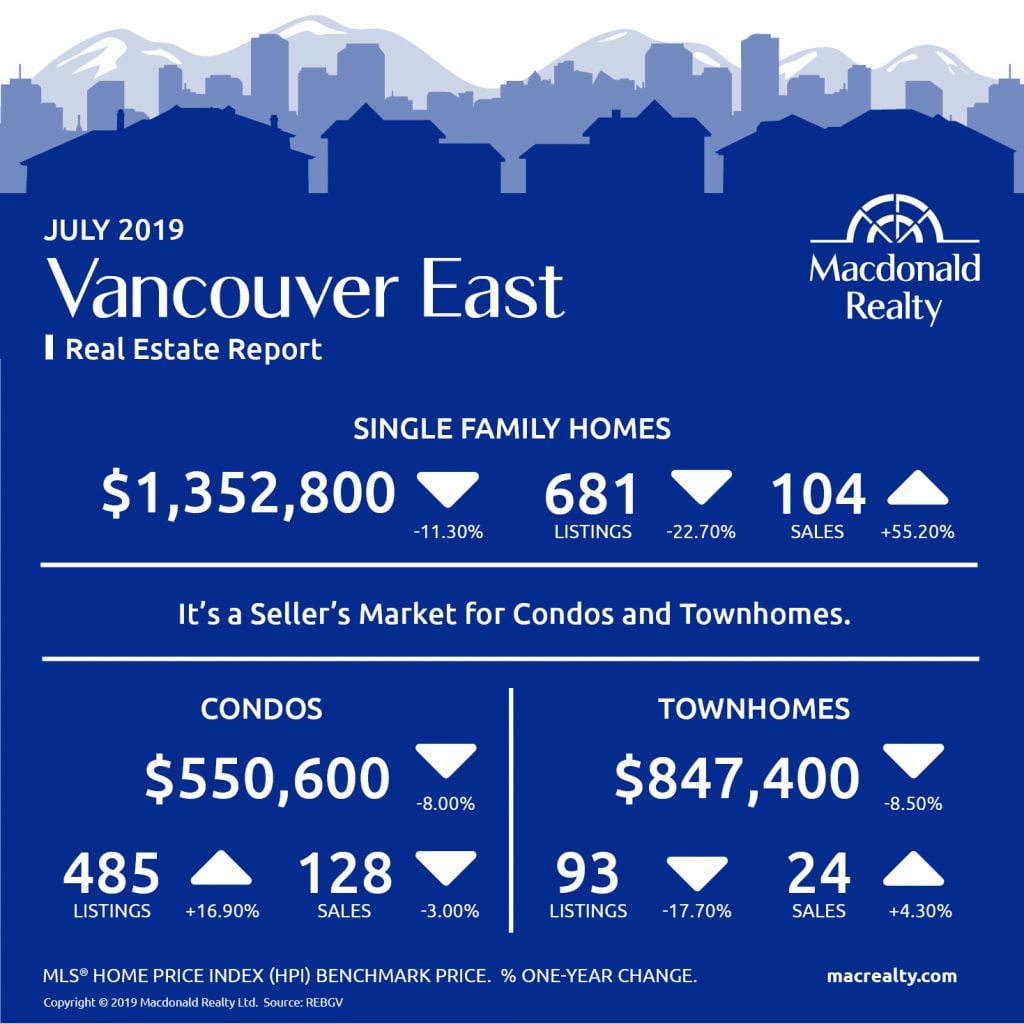
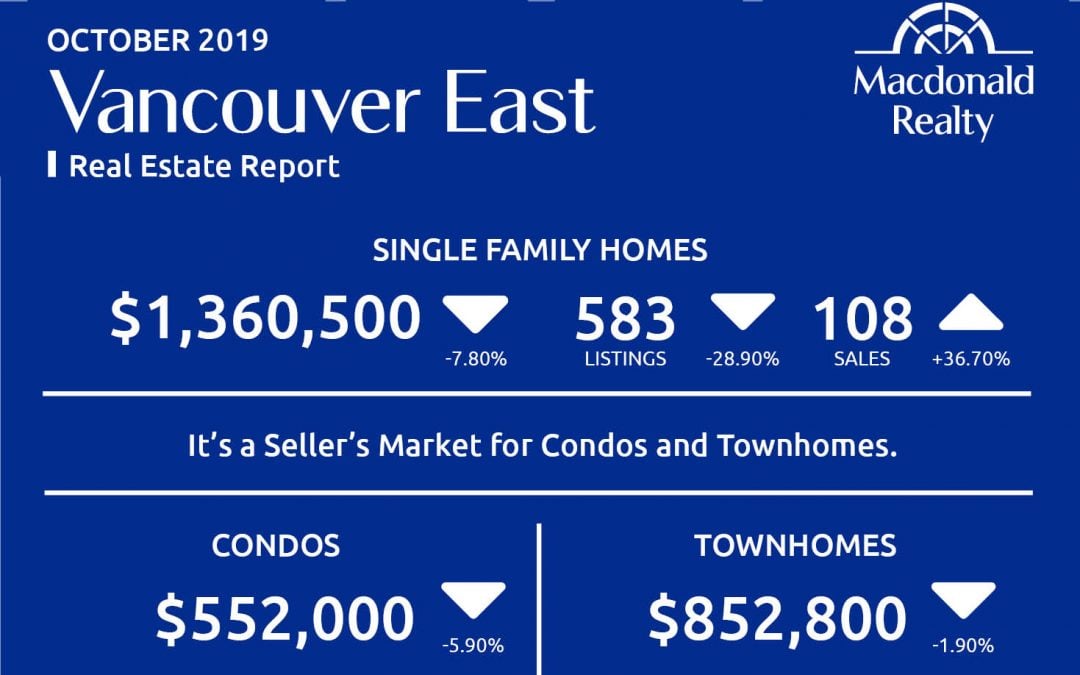
Vancouver-East
Vancouver East had 108 sales and 583 active listings for detached homes at the end of the month. The benchmark sales price was $1,360,500.
The condo market featured 162 sales, 403 active listings, and a benchmark sales price was $552,000.
The townhome market had 29 sales and 90 active listings. The benchmark sale price was $852,800.
It’s a seller’s market for condos and townhomes in Vancouver East.

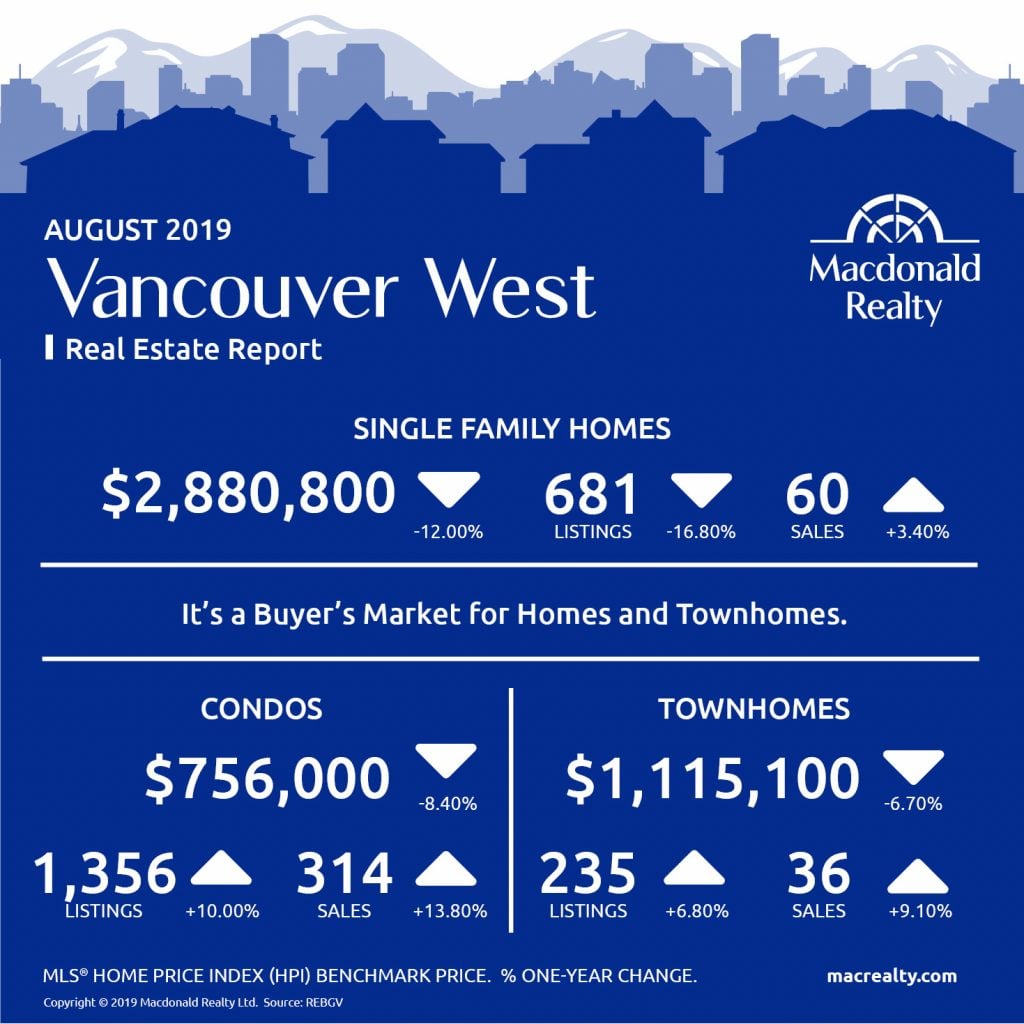
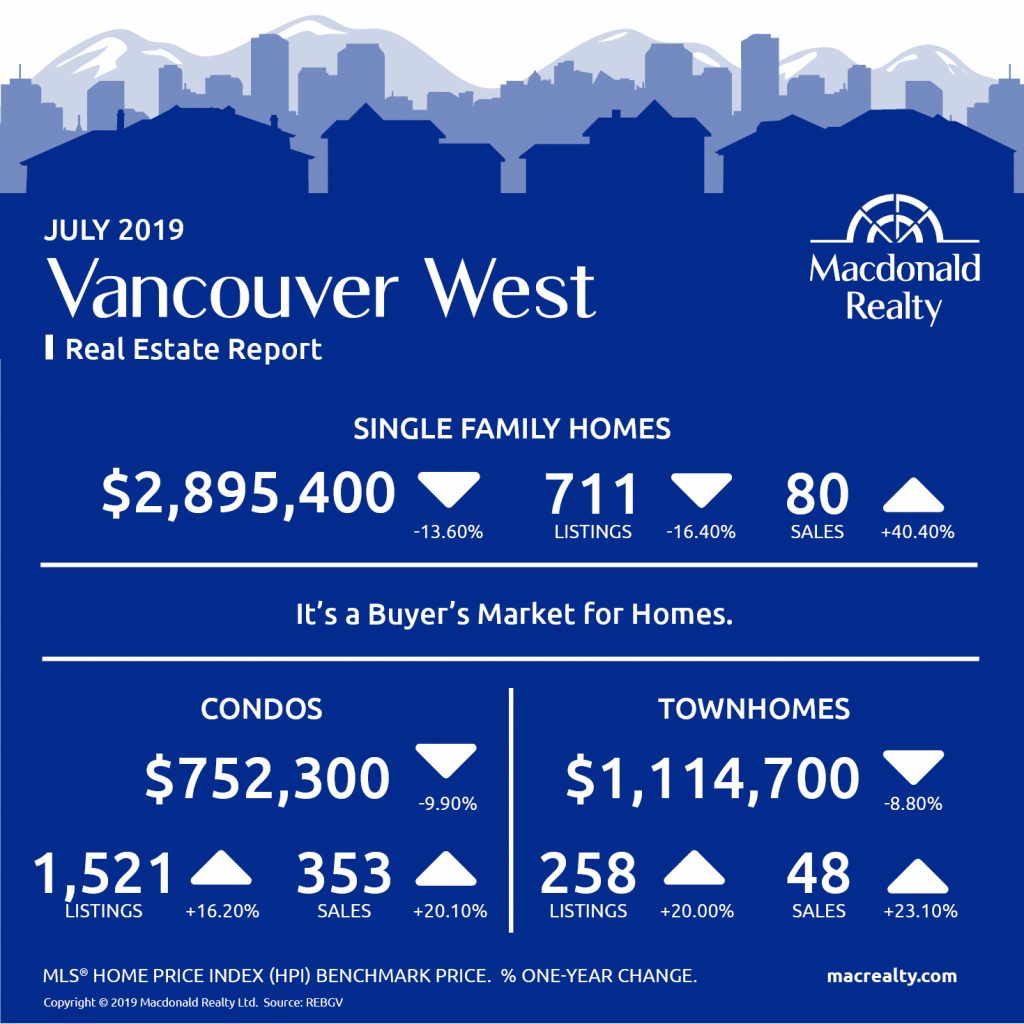
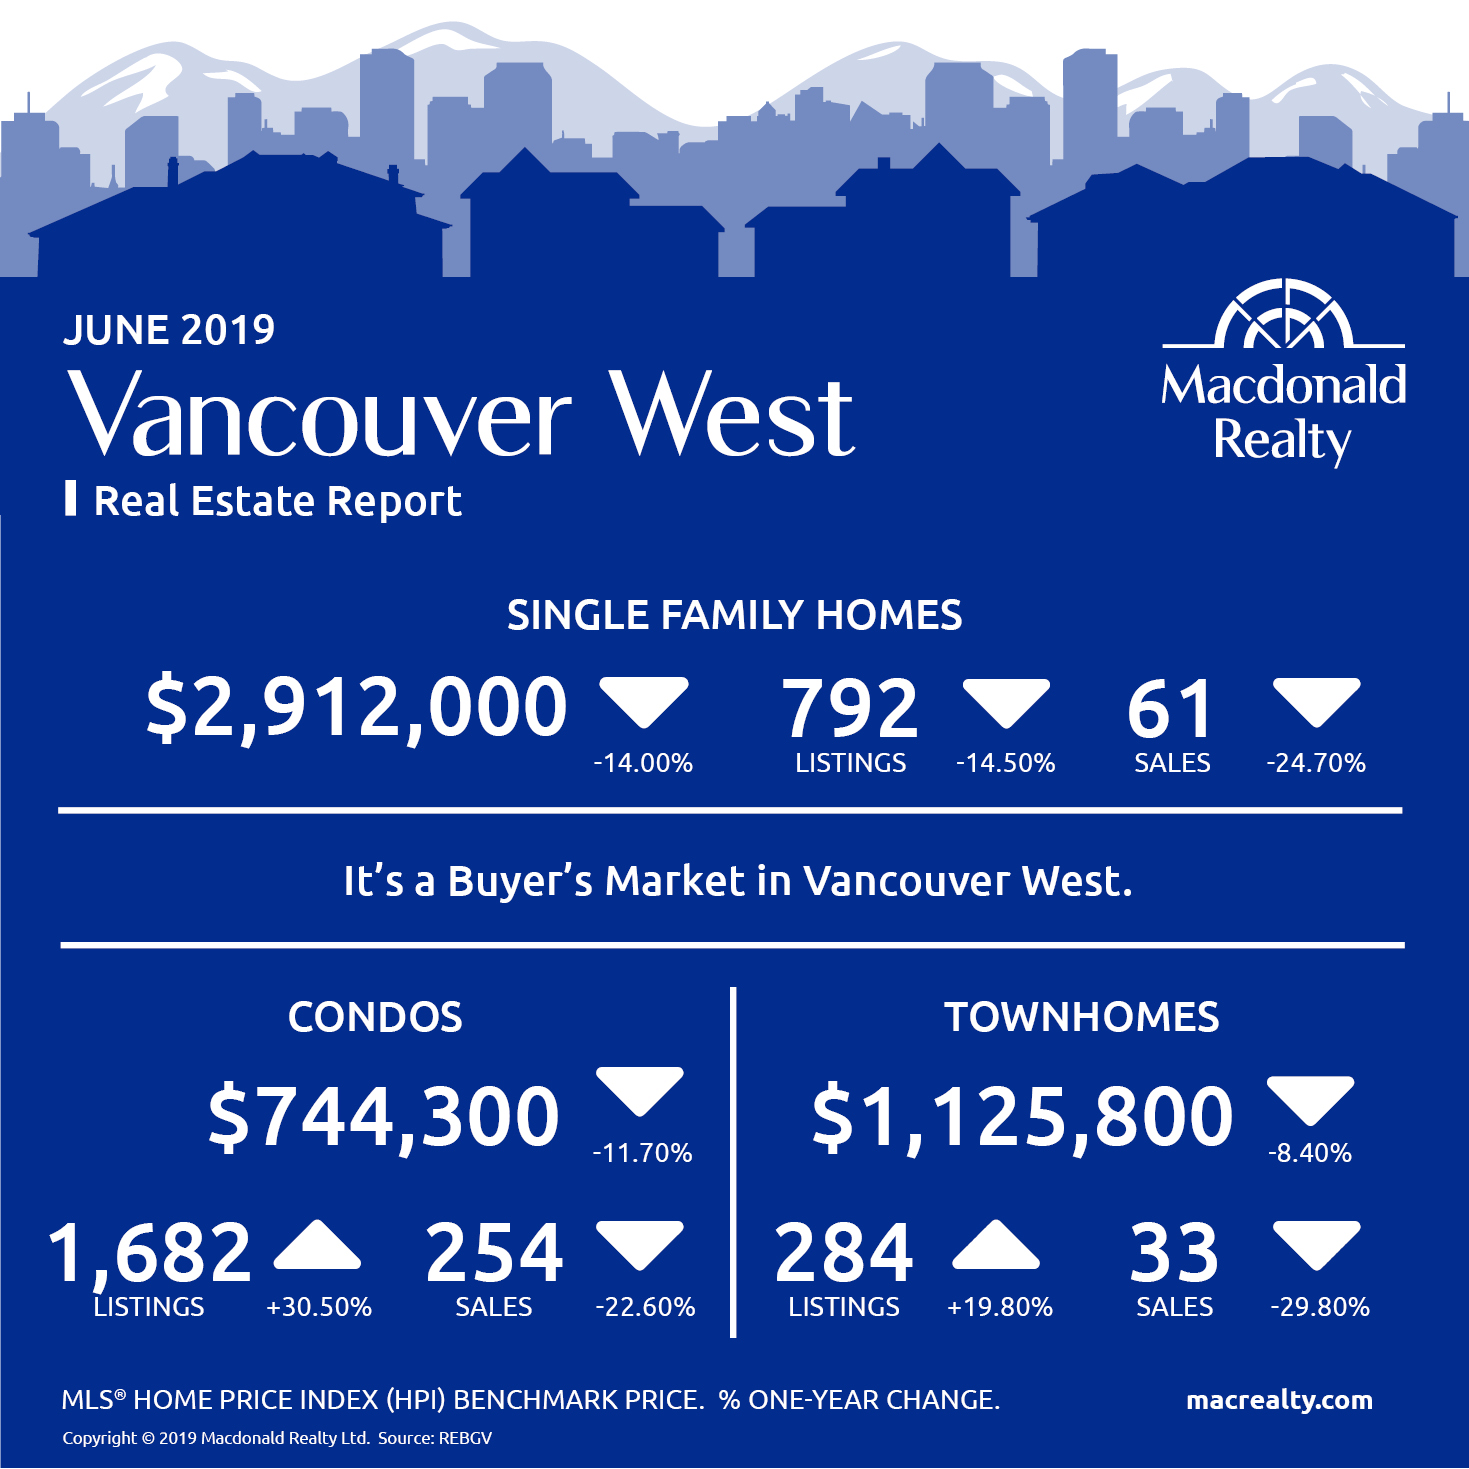
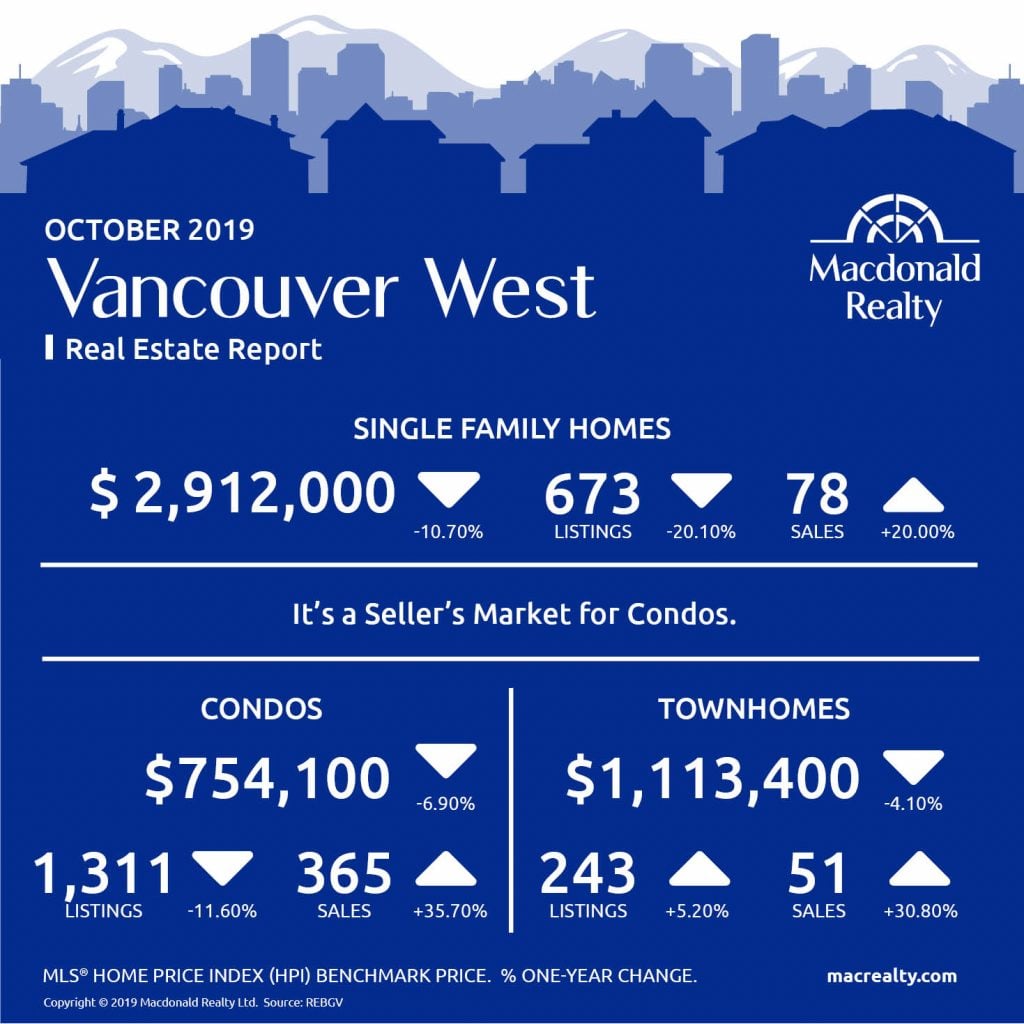
Vancouver-West
In September, Vancouver West market had 78 sales and 673 active listings for detached homes. The benchmark sale price was $2,912,000.
There were 365 sales and 1,311 active listings for condos. The benchmark sale price was $754,100.
Townhome sales were 51, while the active listings were 243.
It’s a seller’s market for condos in Vancouver West.
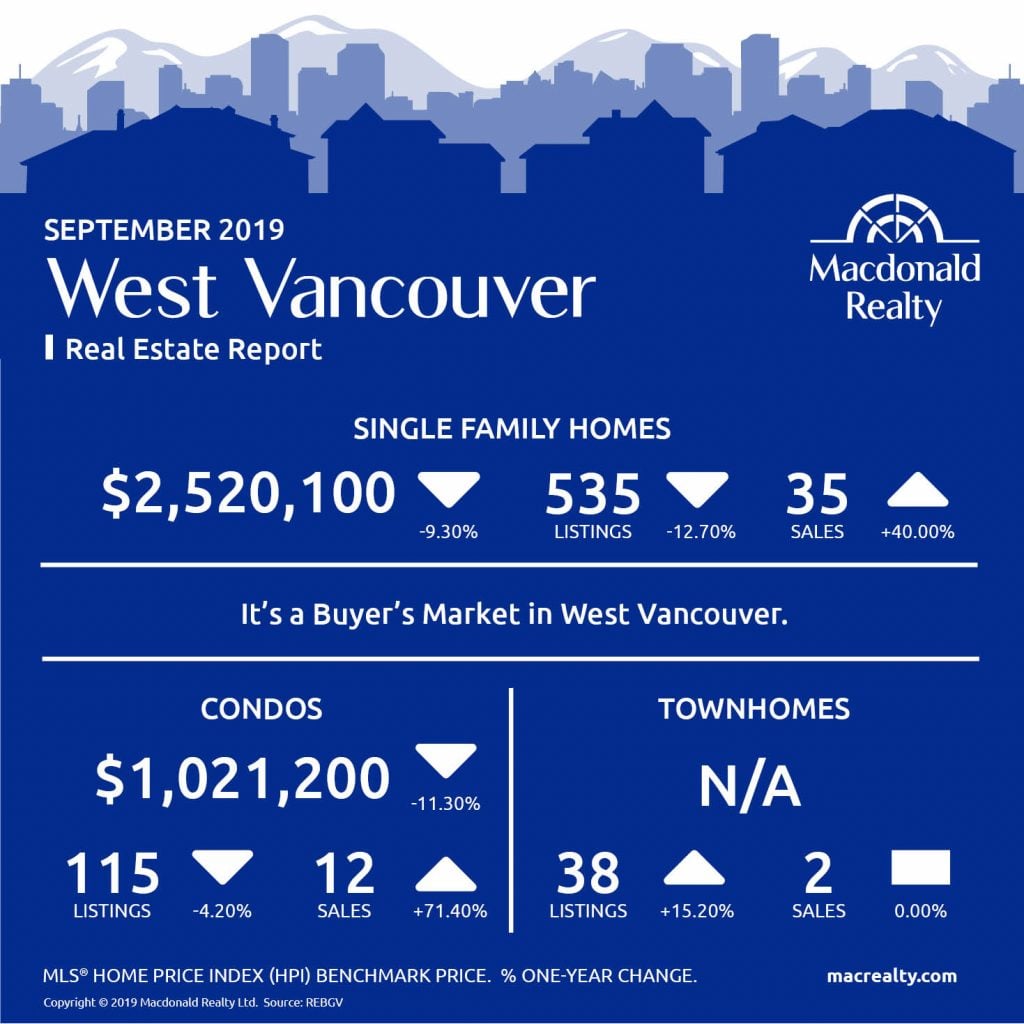
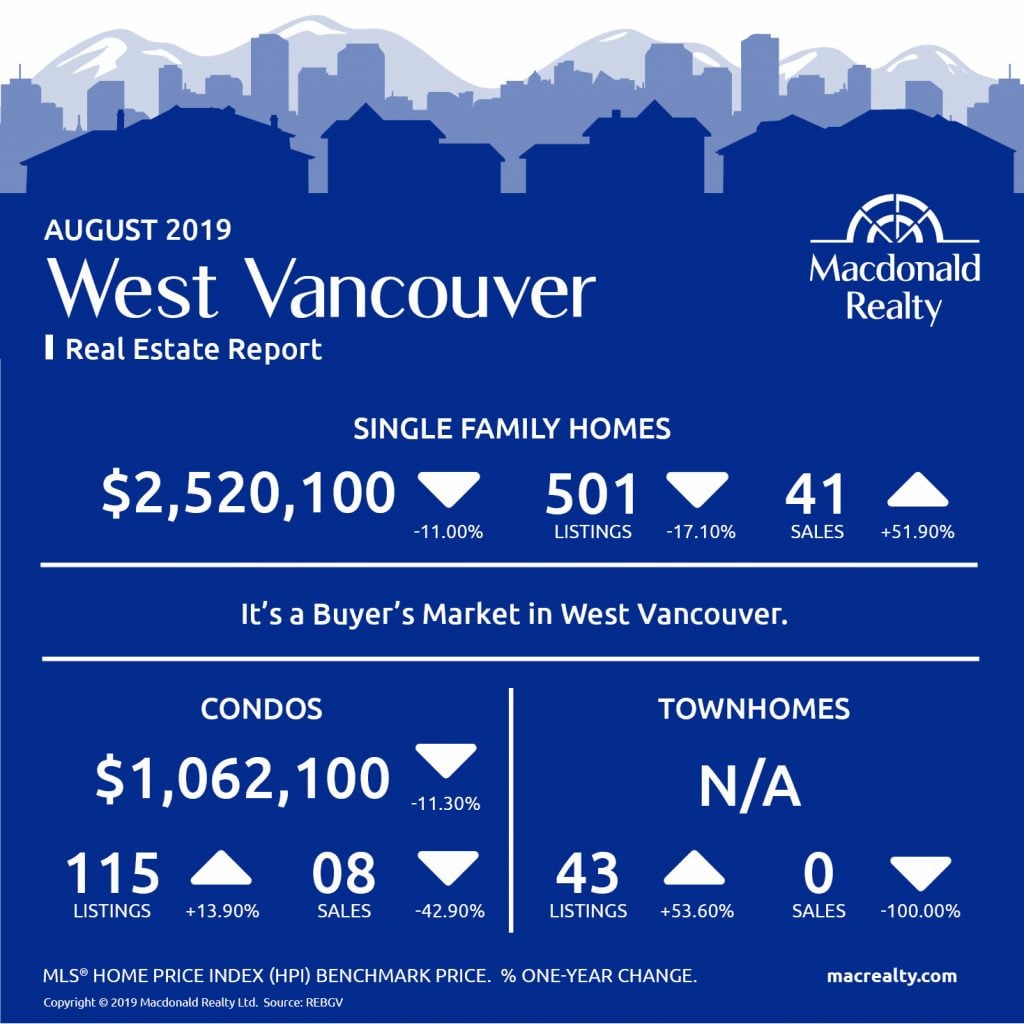
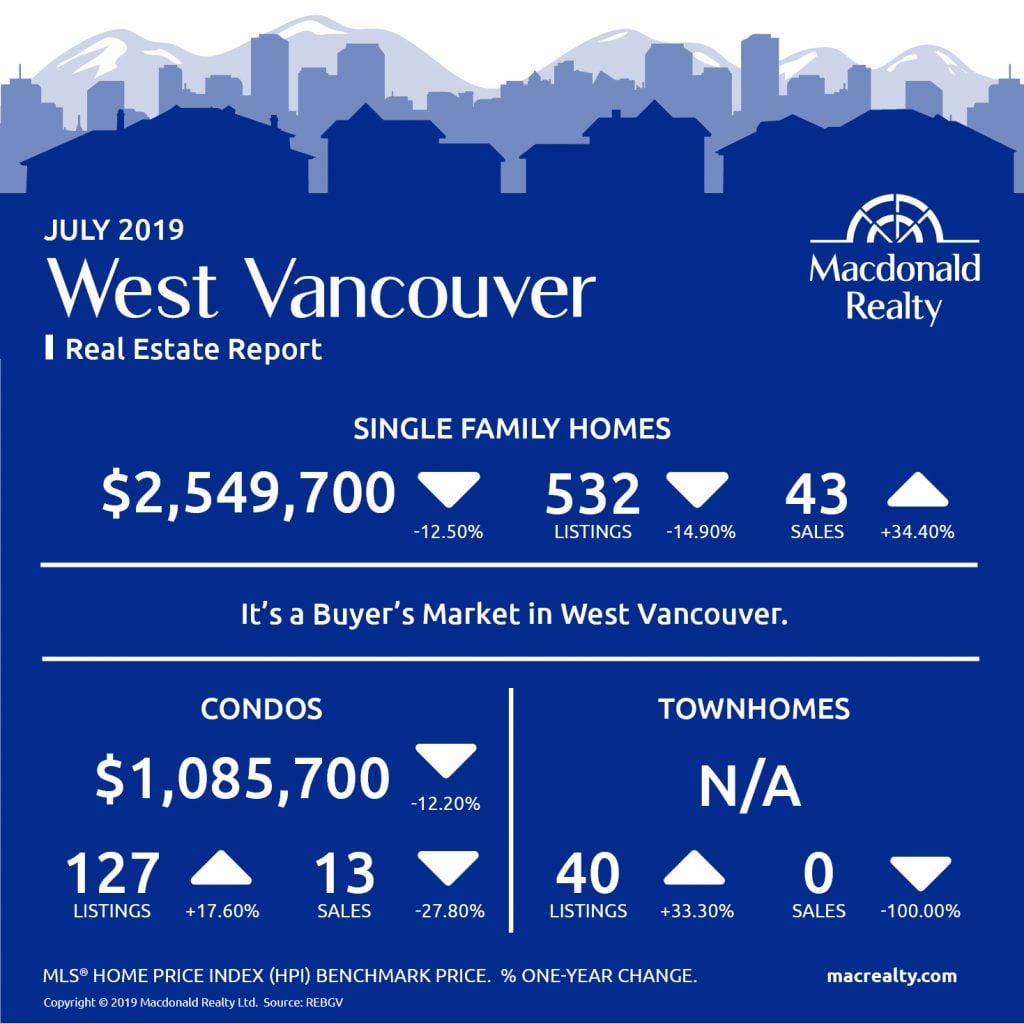
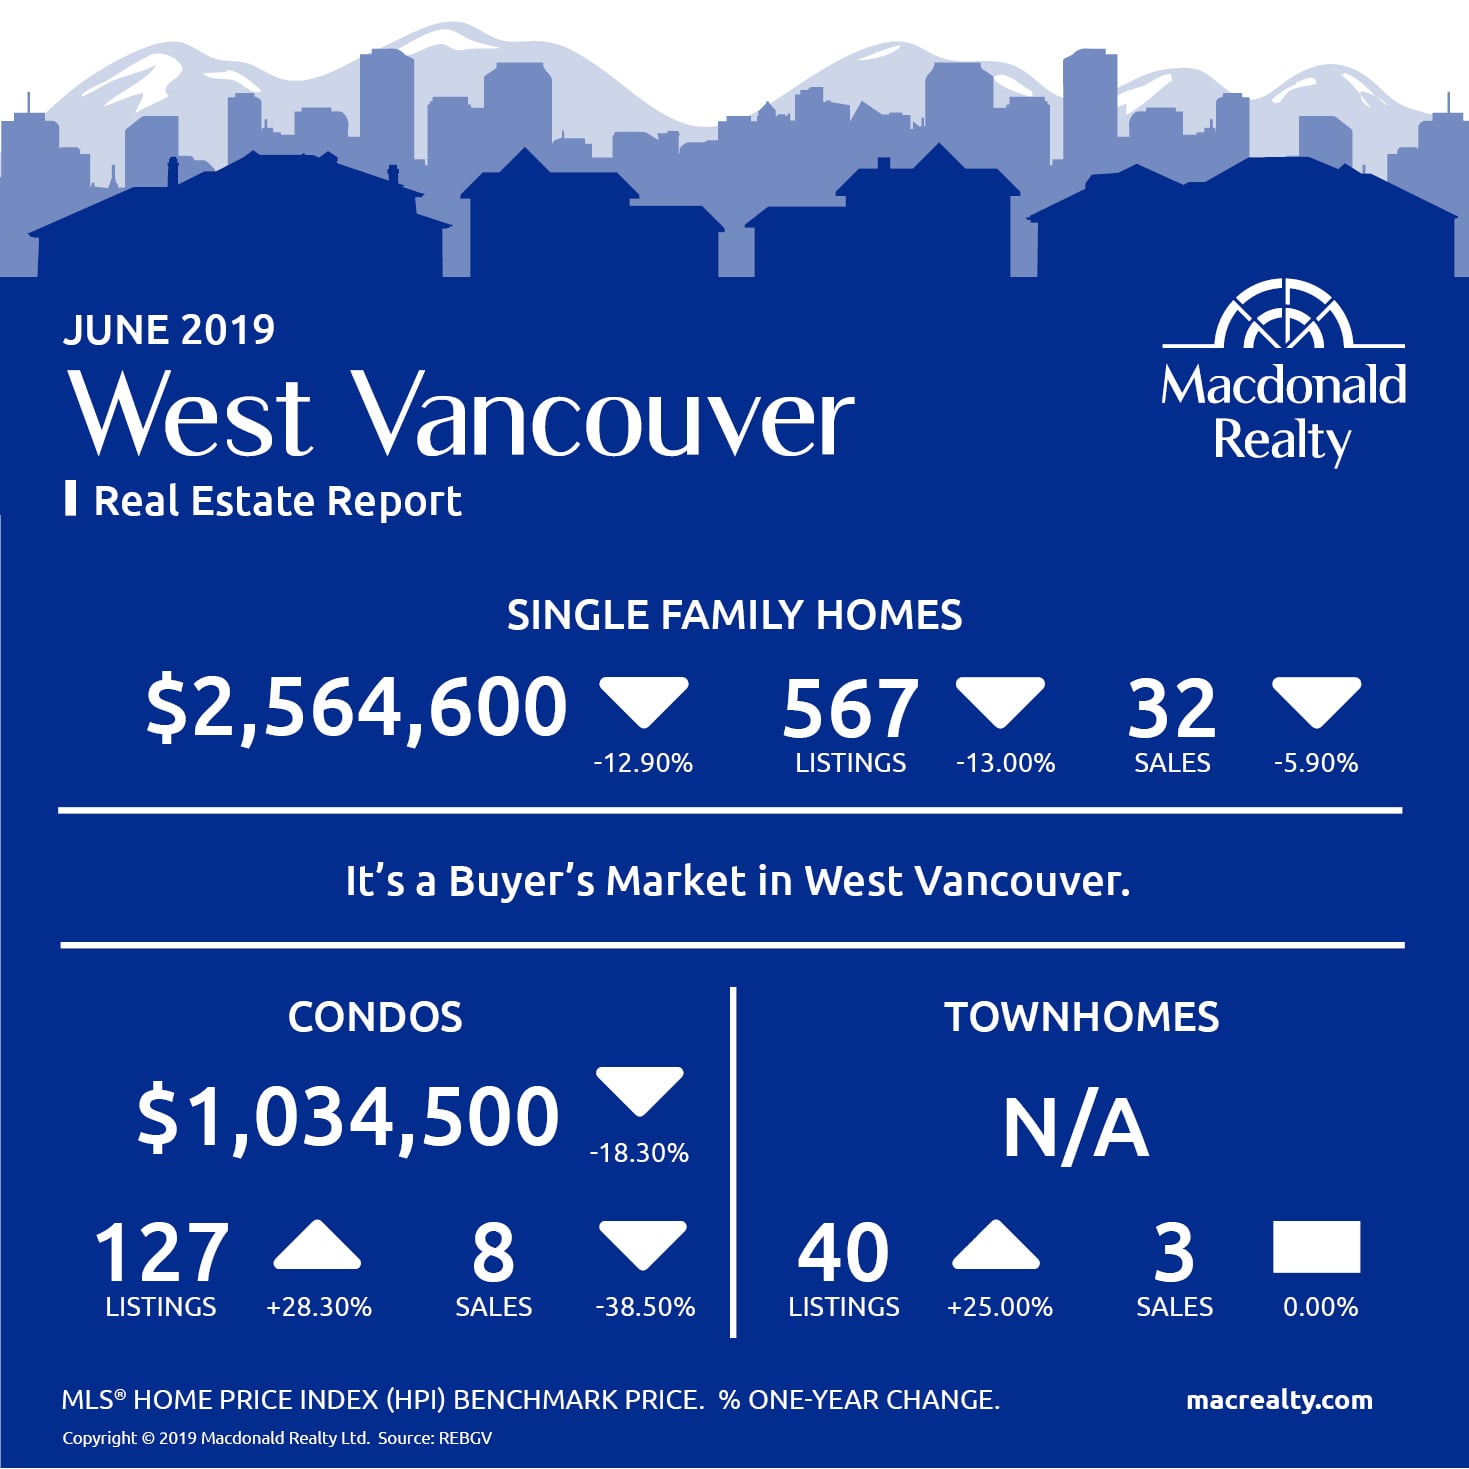
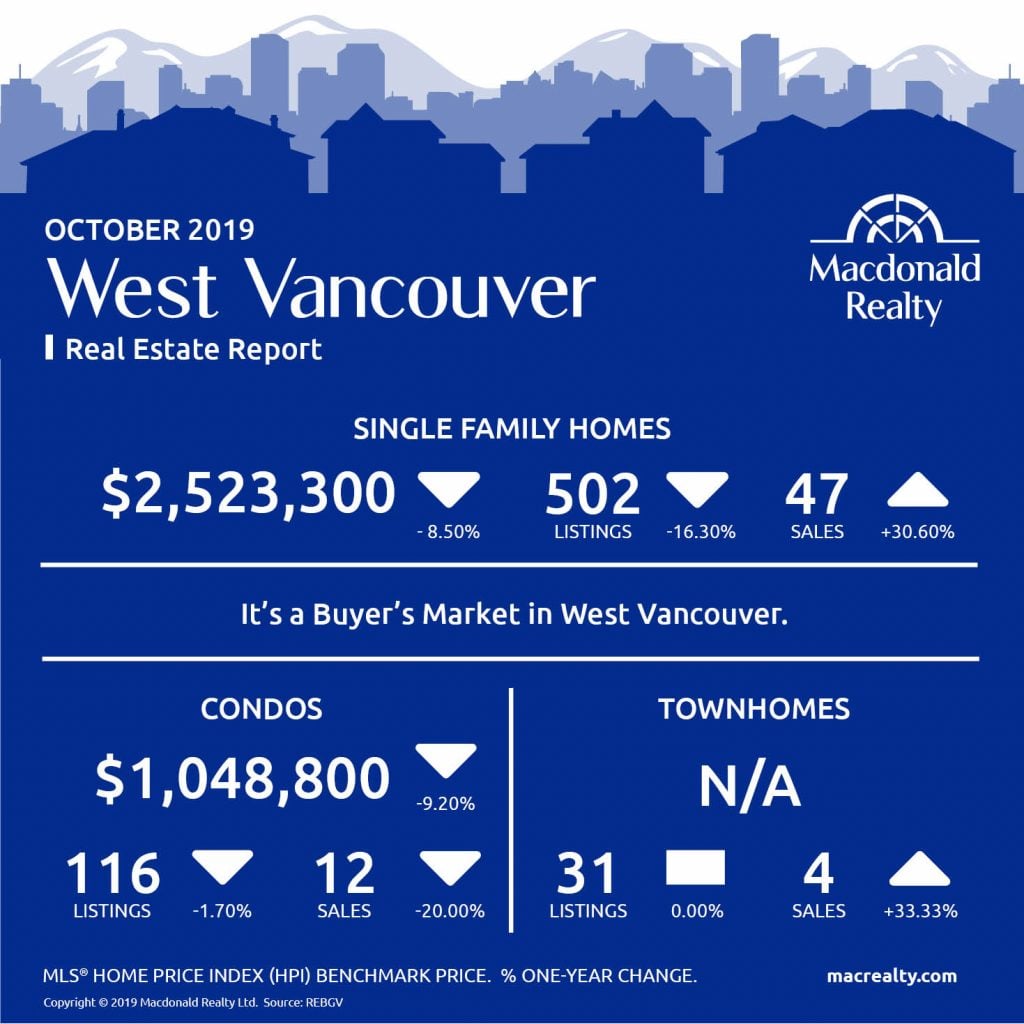
West Vancouver
In West Vancouver, there were 47 sales of detached homes and 502 active listings at the end of the month. The benchmark sale price was $2,523,300.
In comparison, the condo market had 12 sales, 116 active listings and a benchmark sale price of $1,048,000.
Townhome sales were 4, active listings were 31.
It’s a buyer’s market for in West Vancouver.
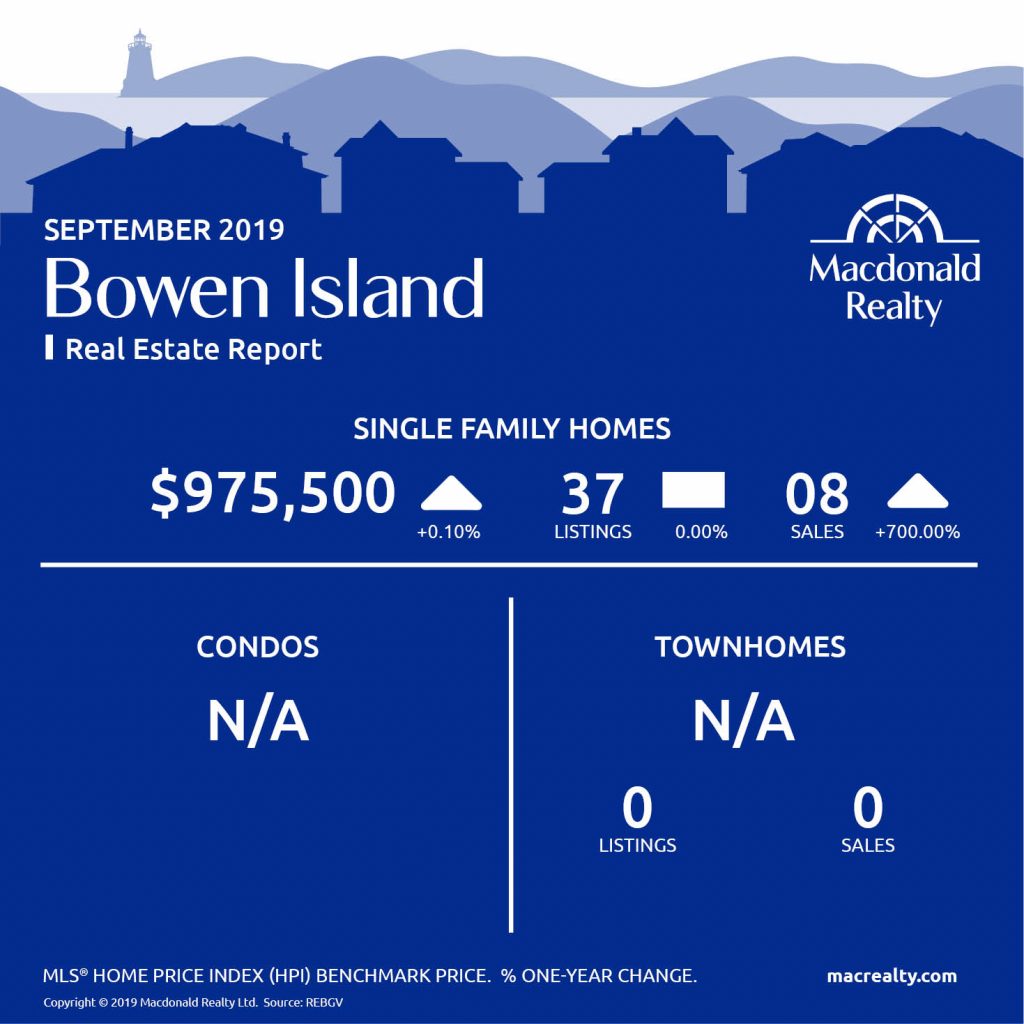
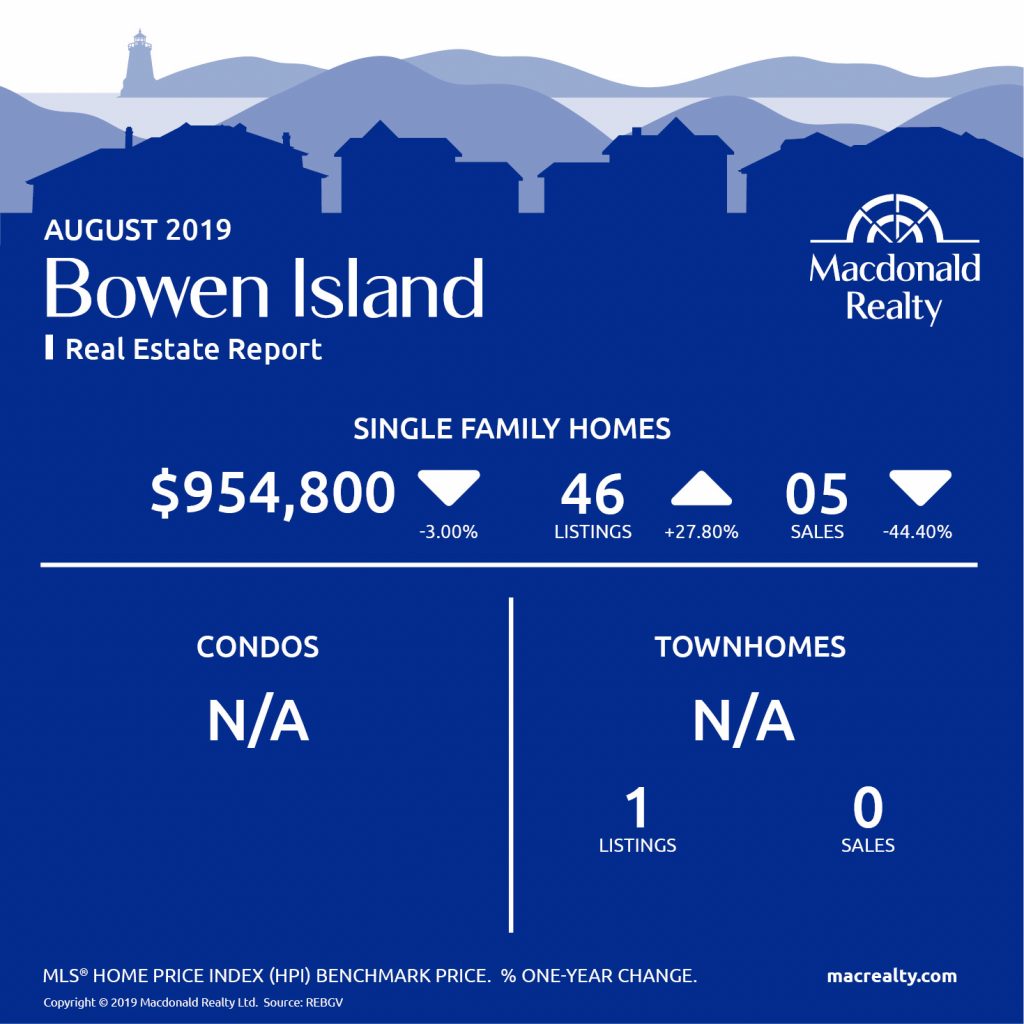
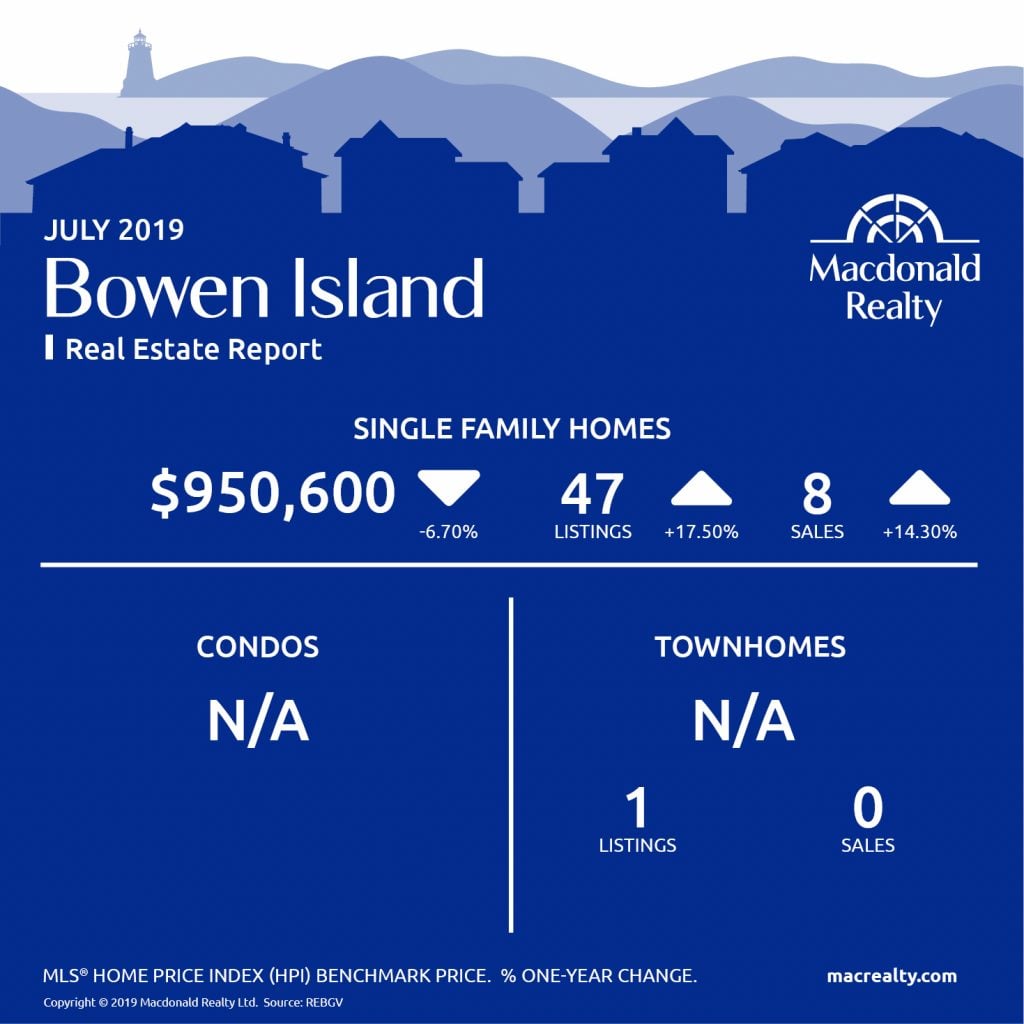
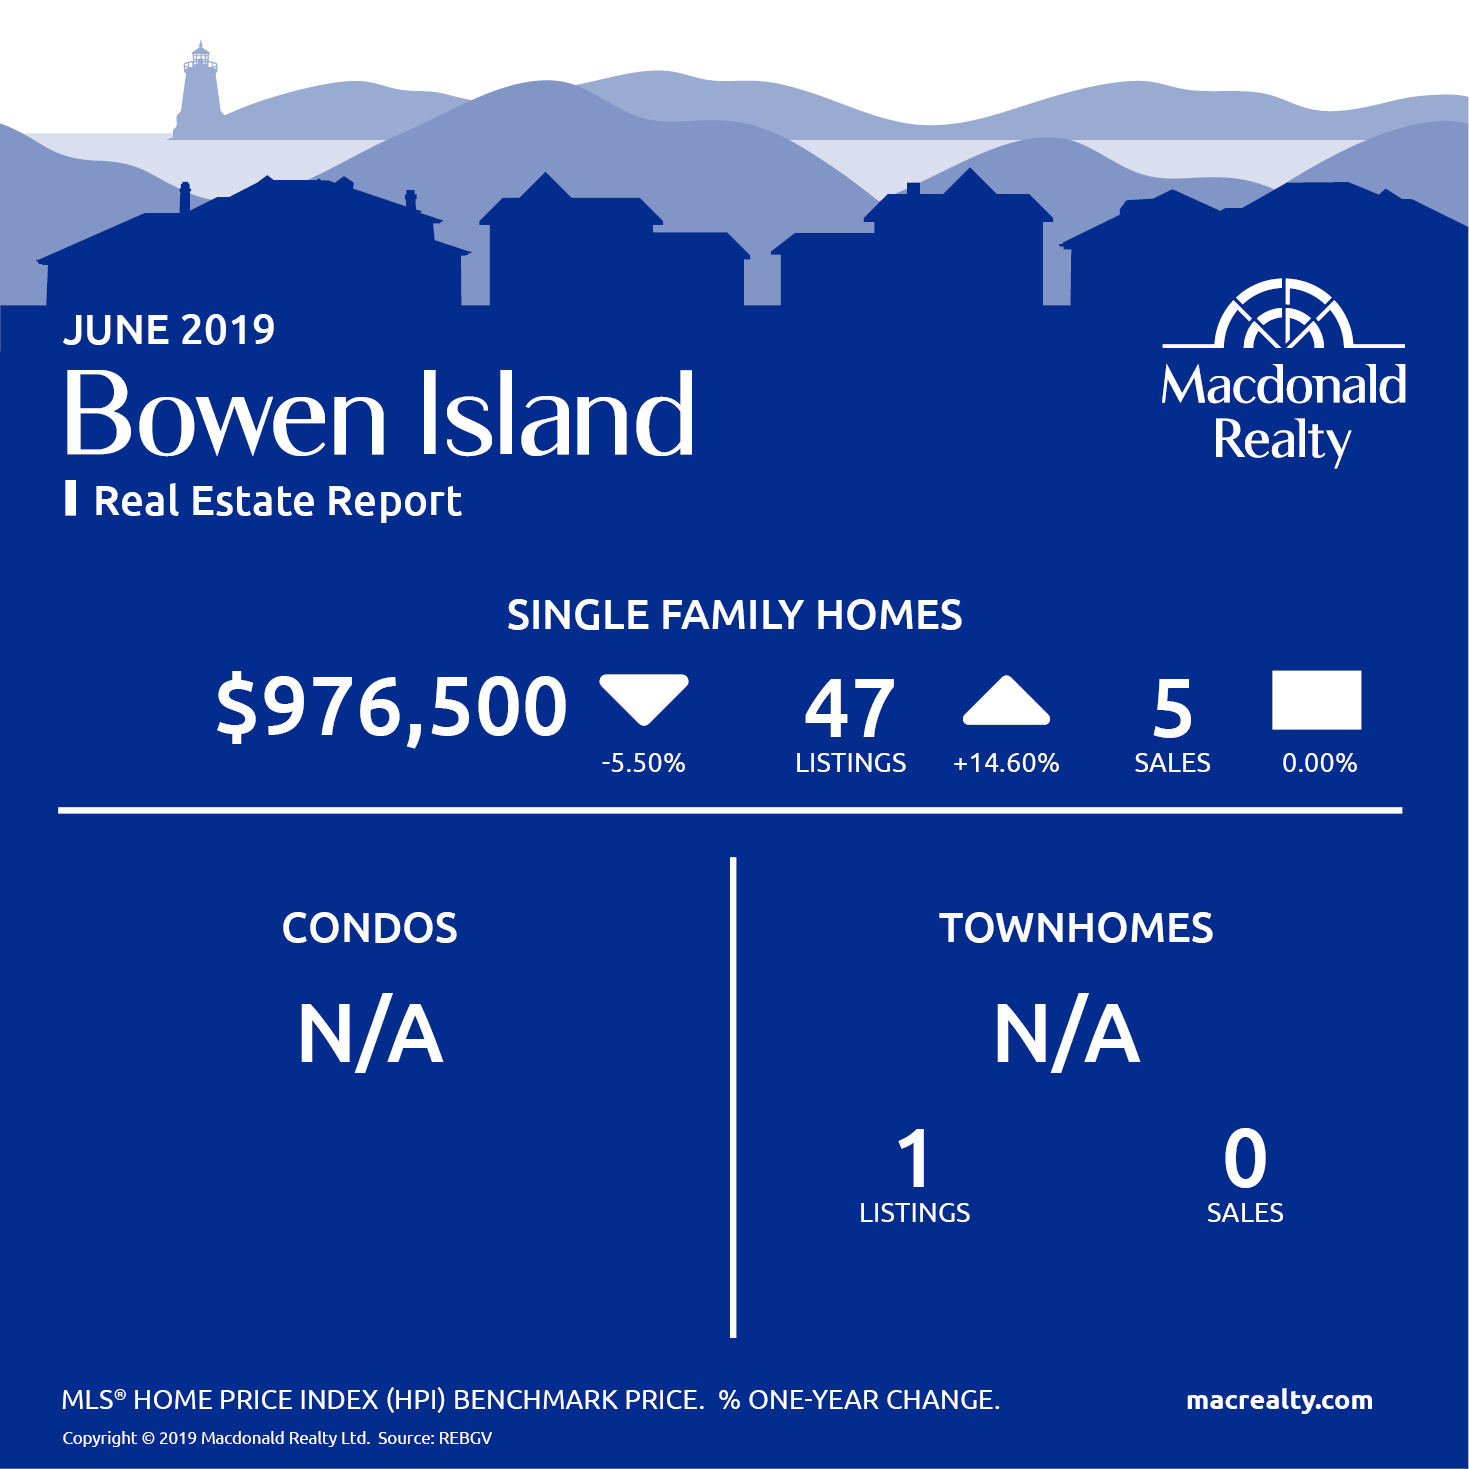
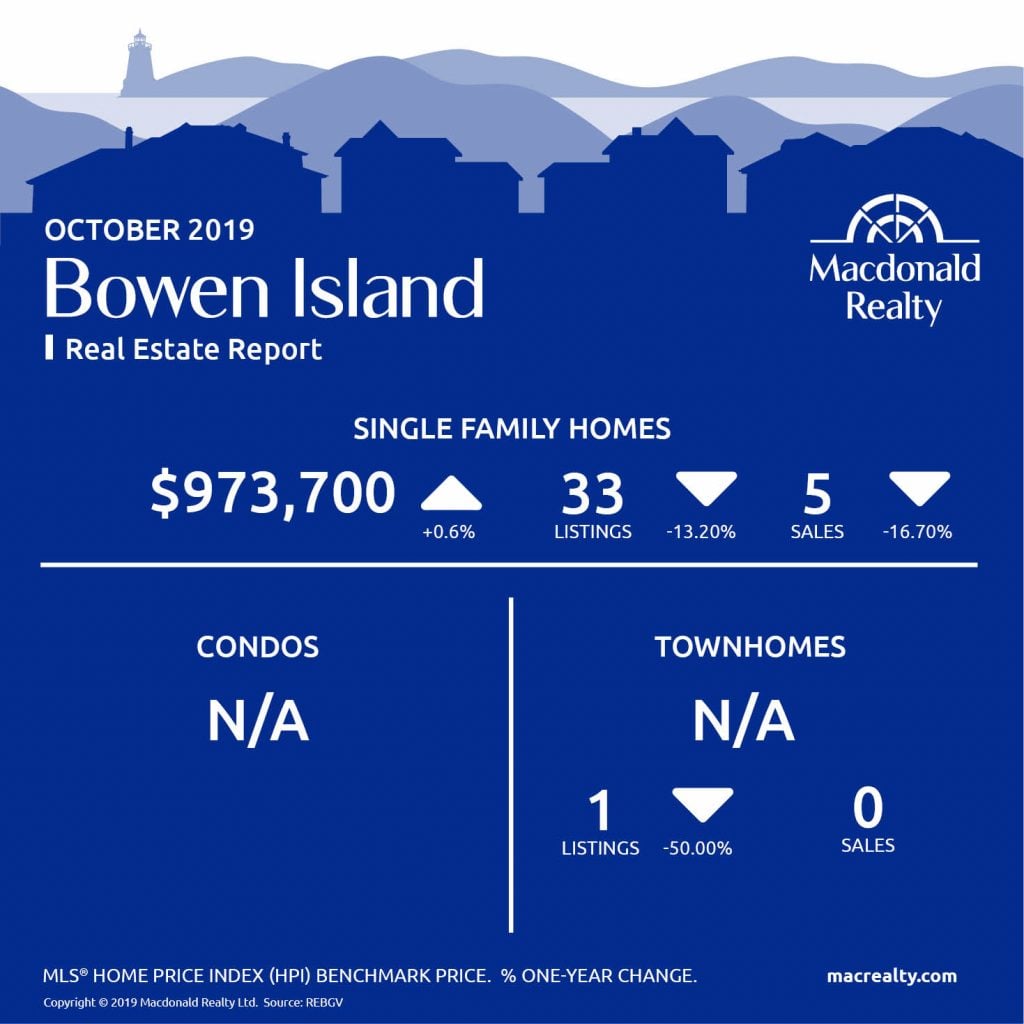
Bowen Island
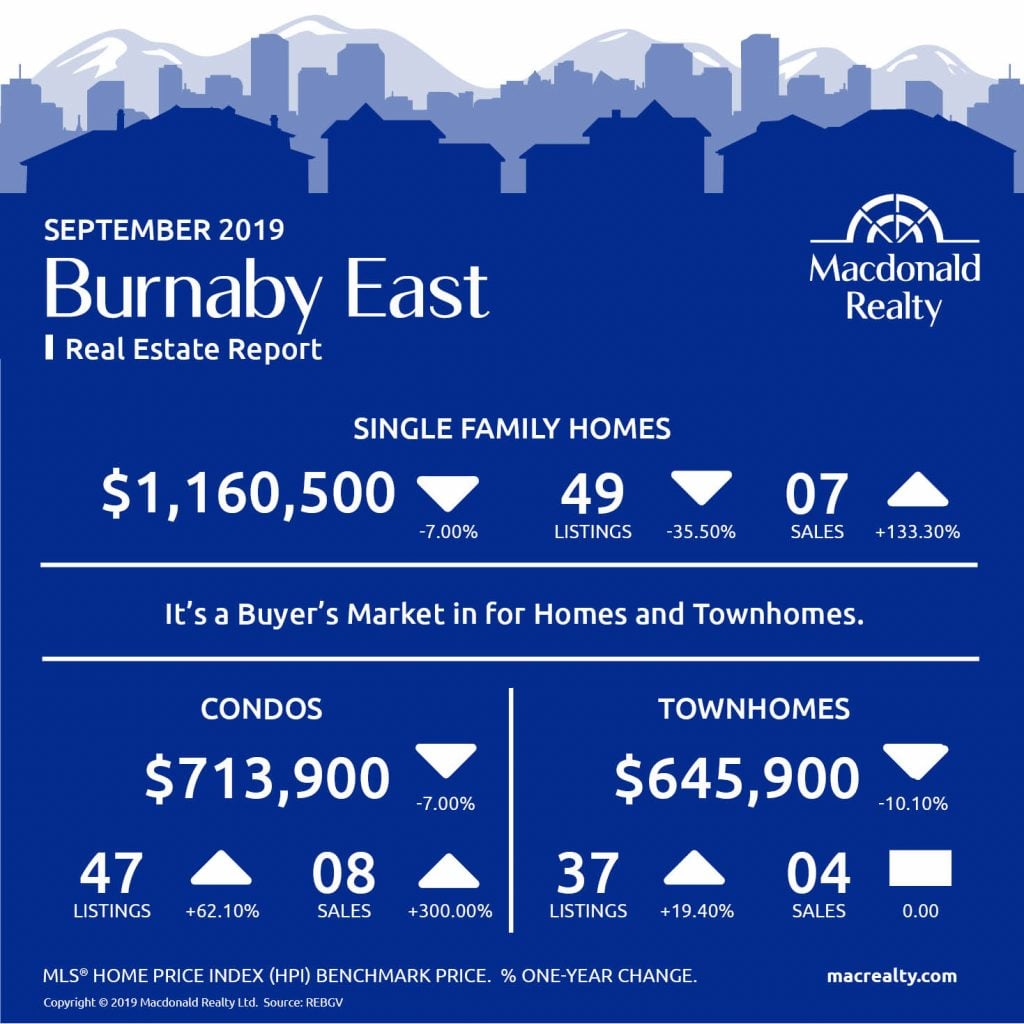
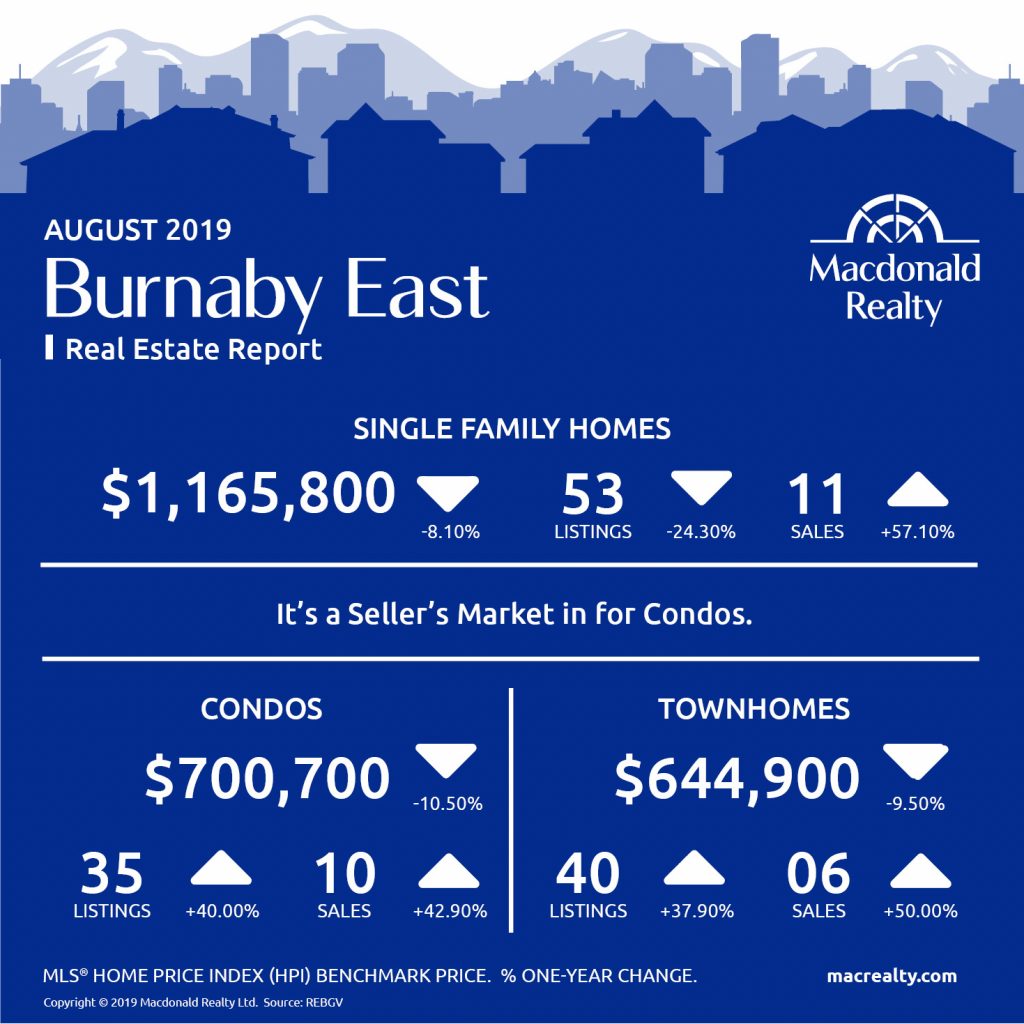
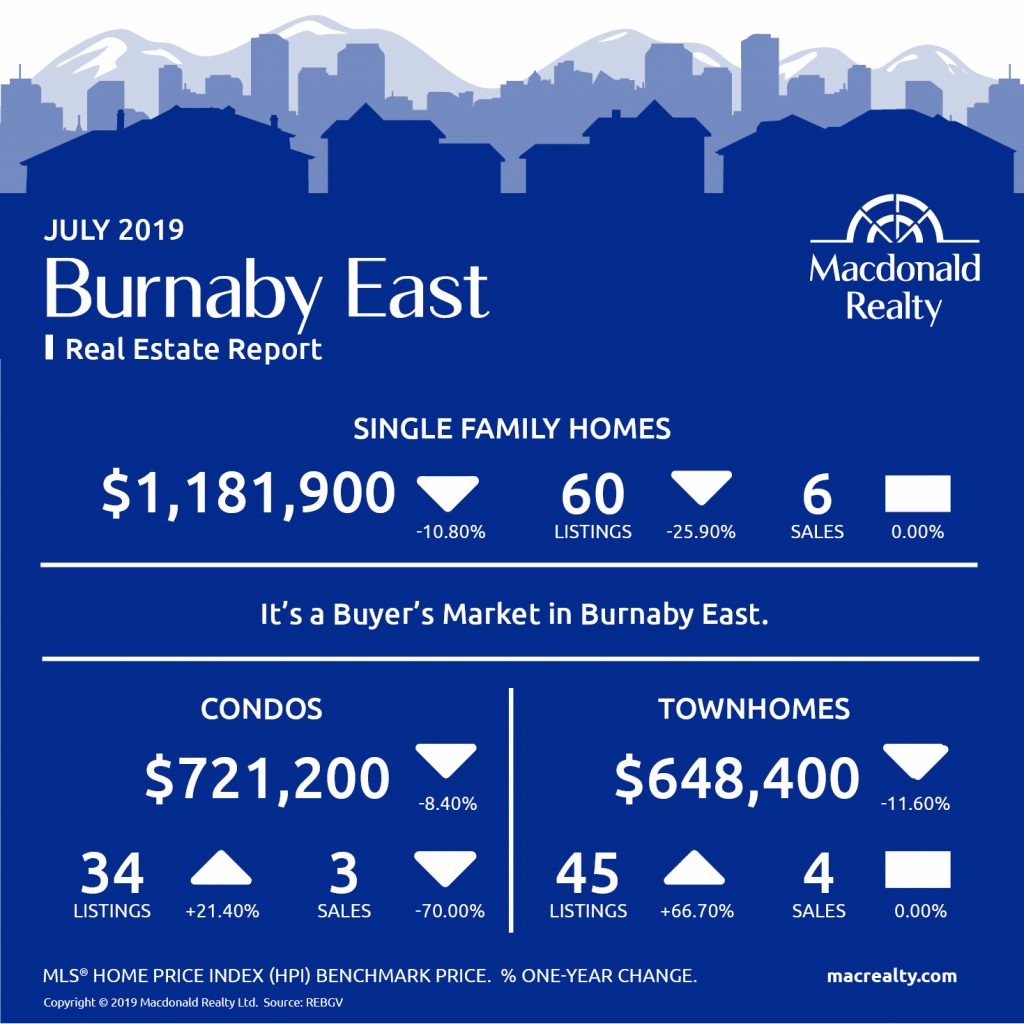
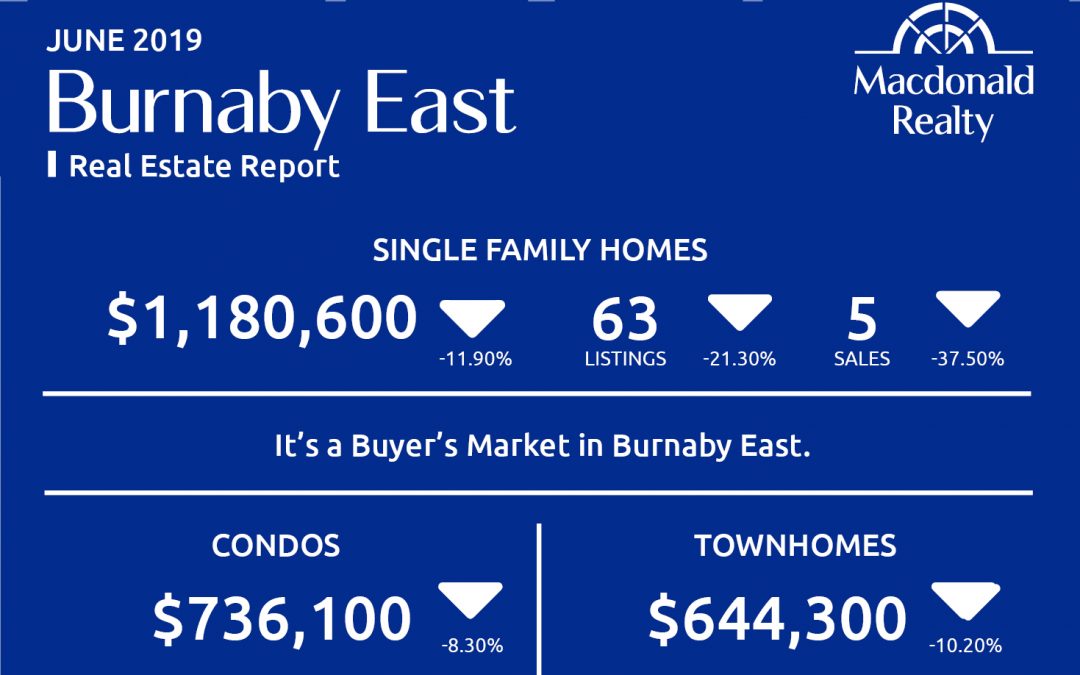
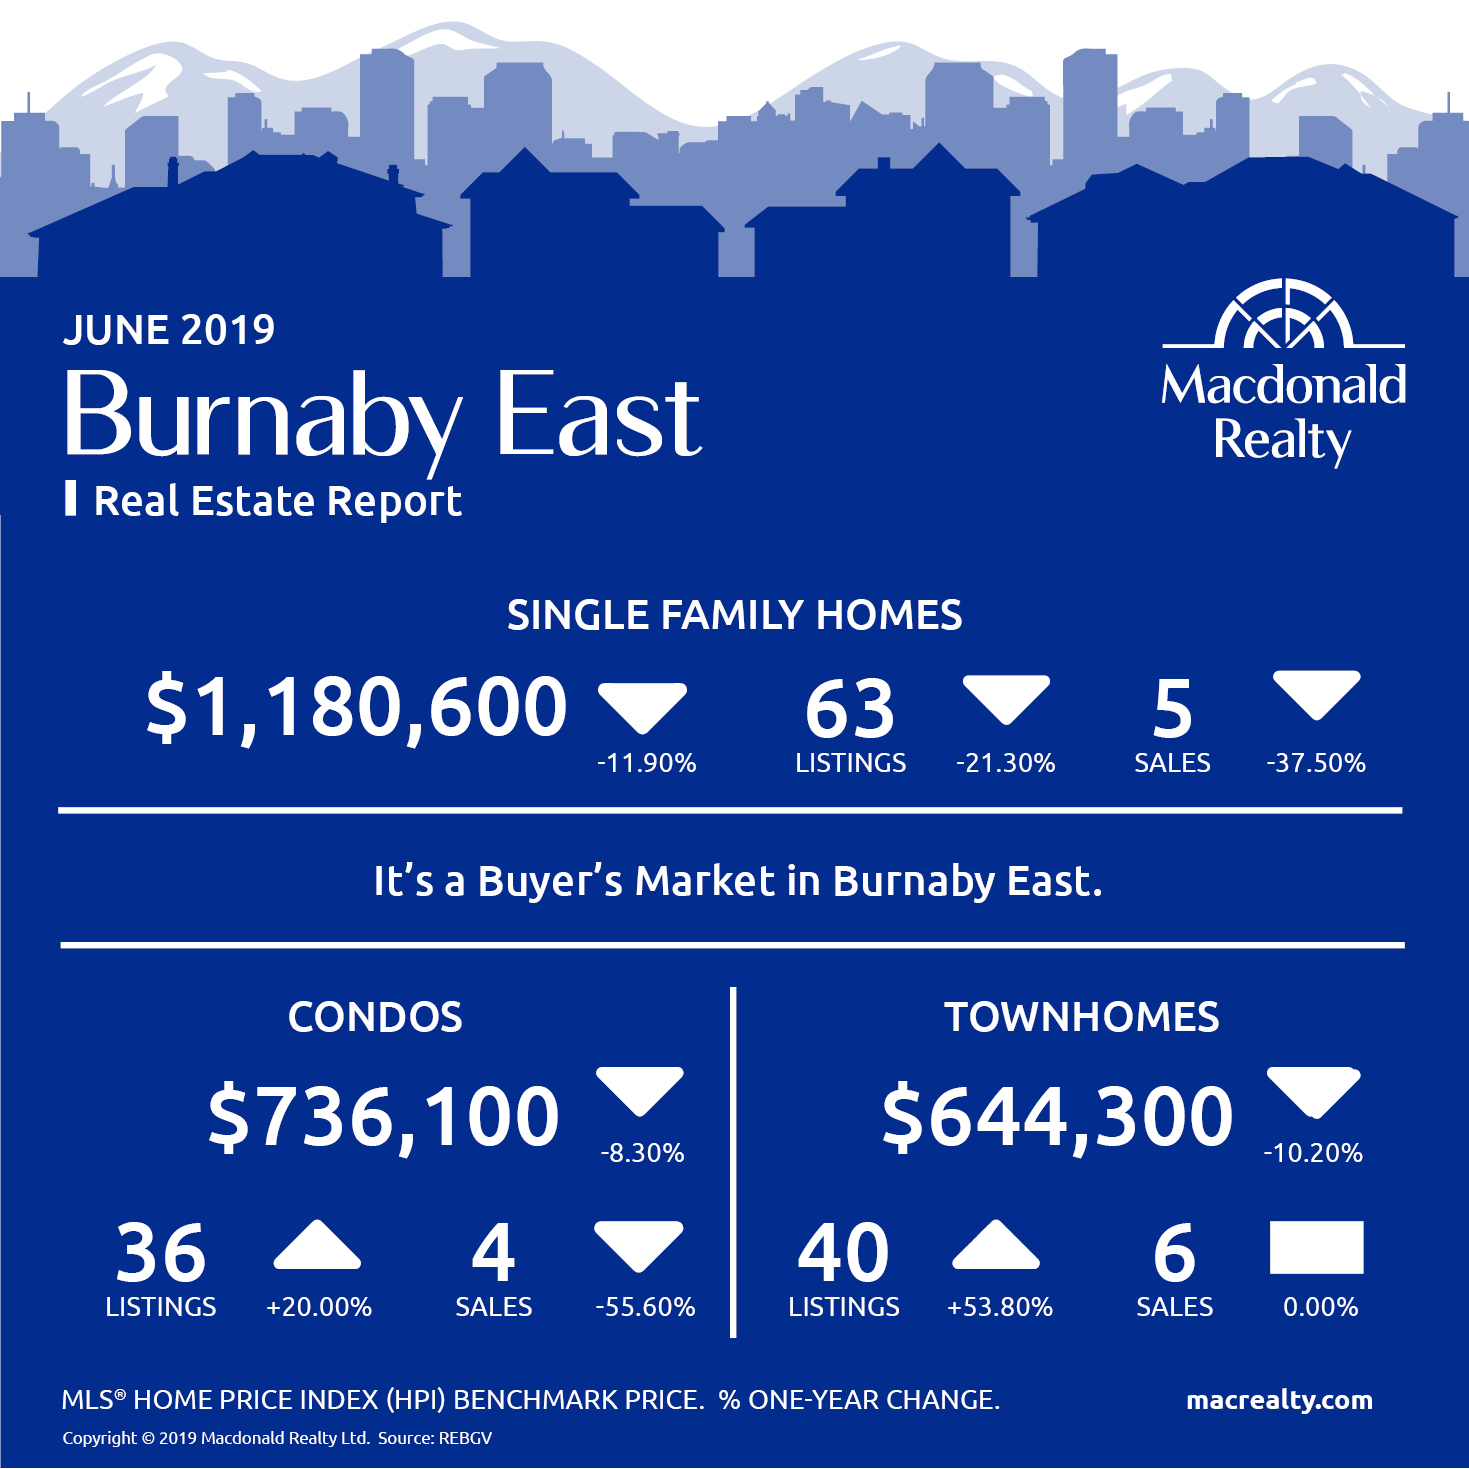
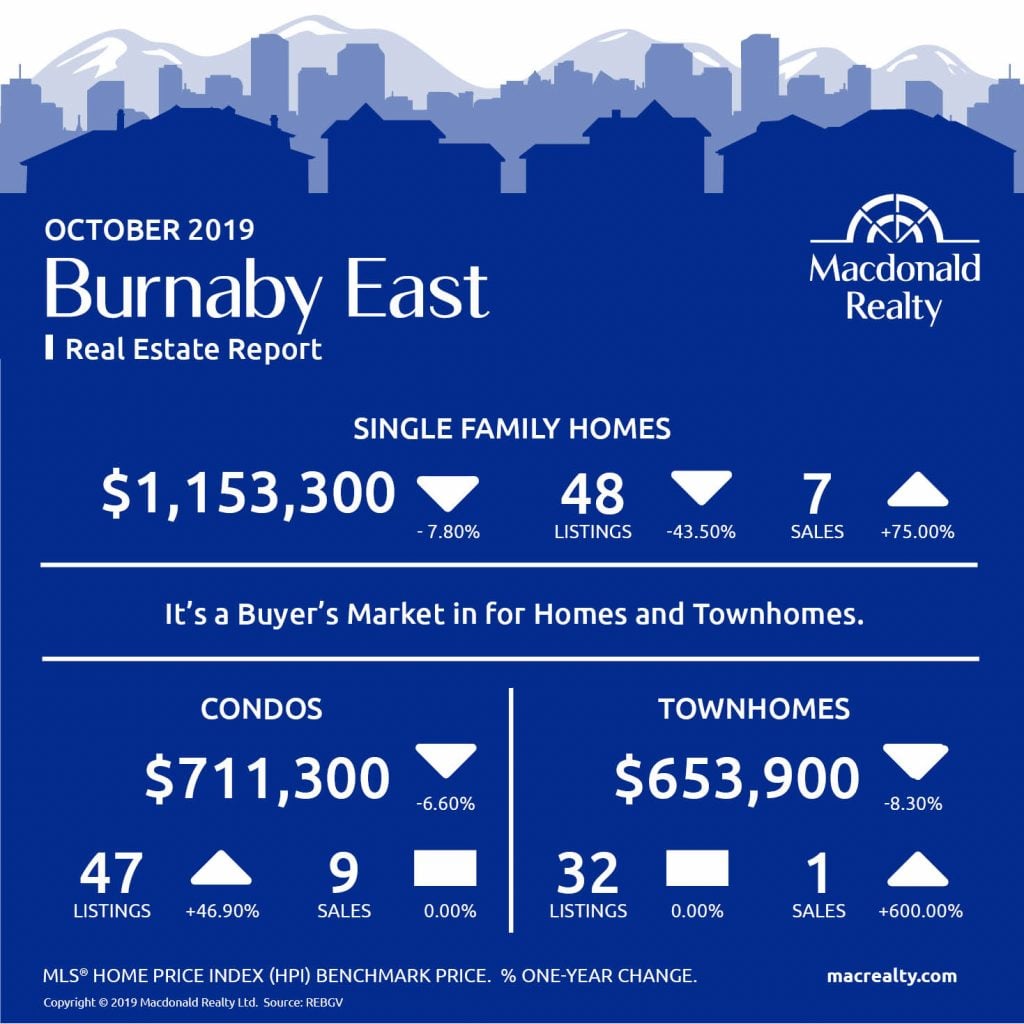
Burnaby East
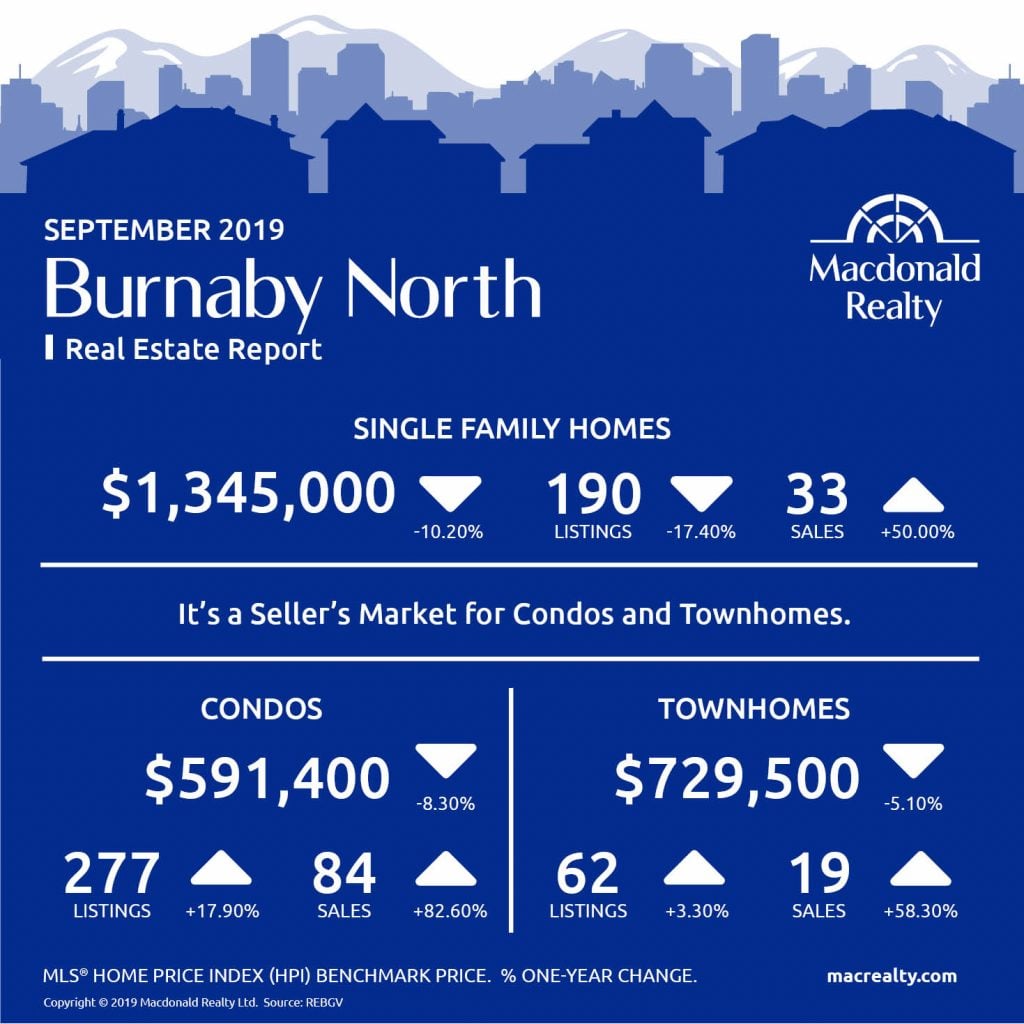
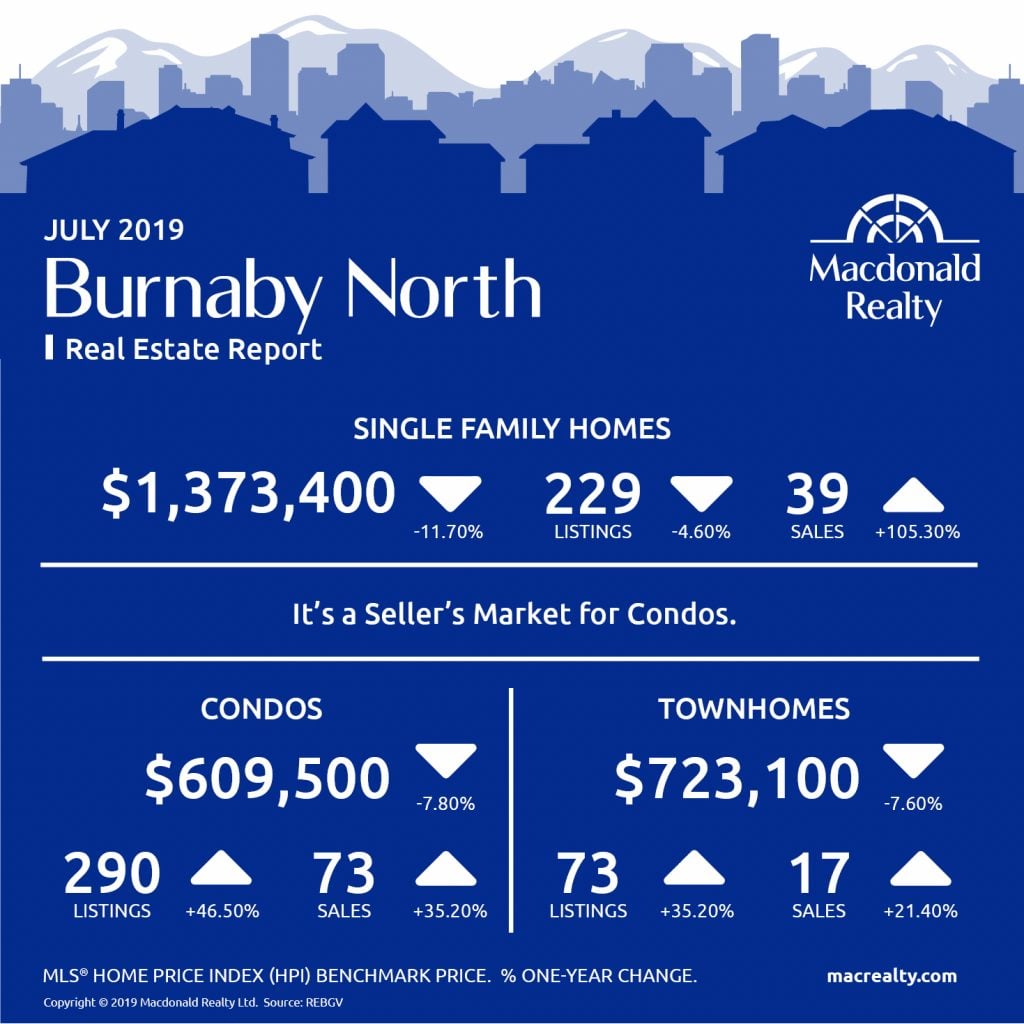
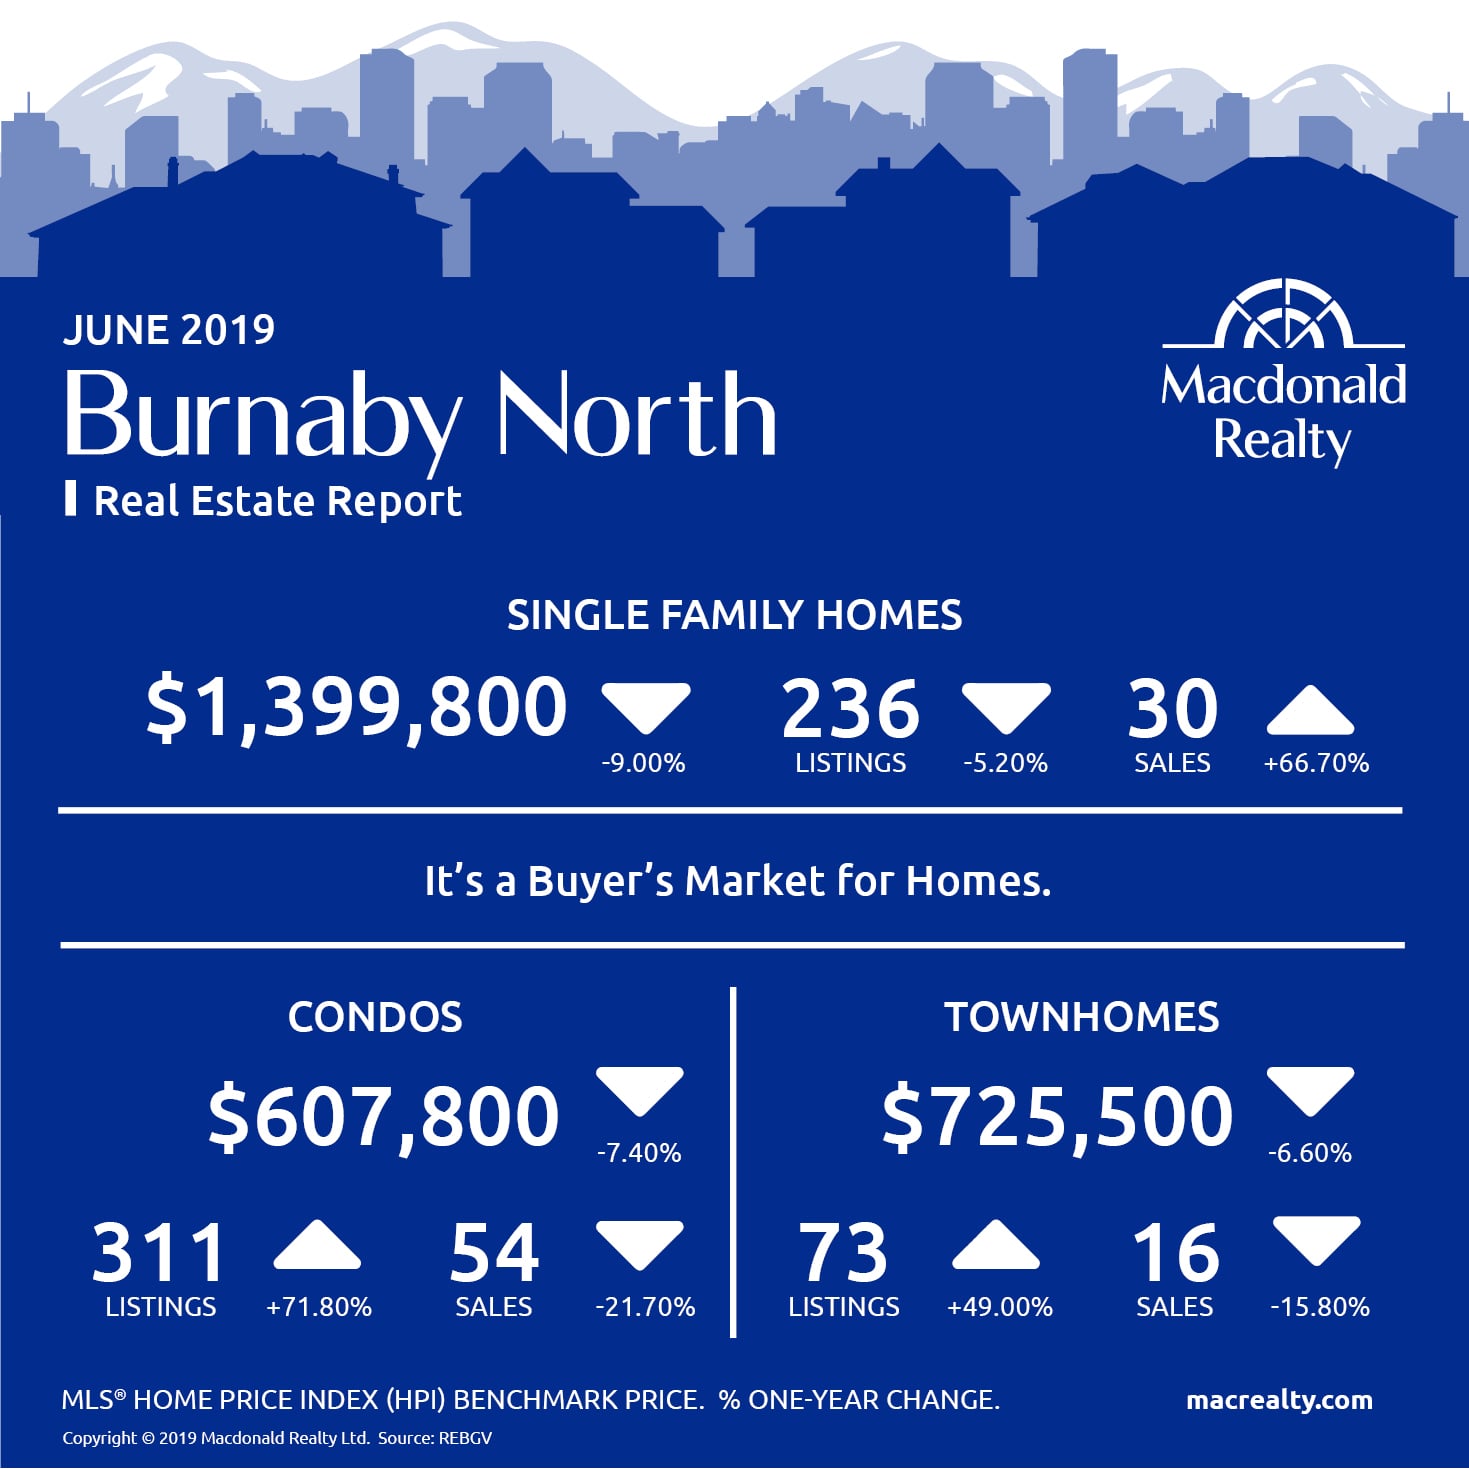
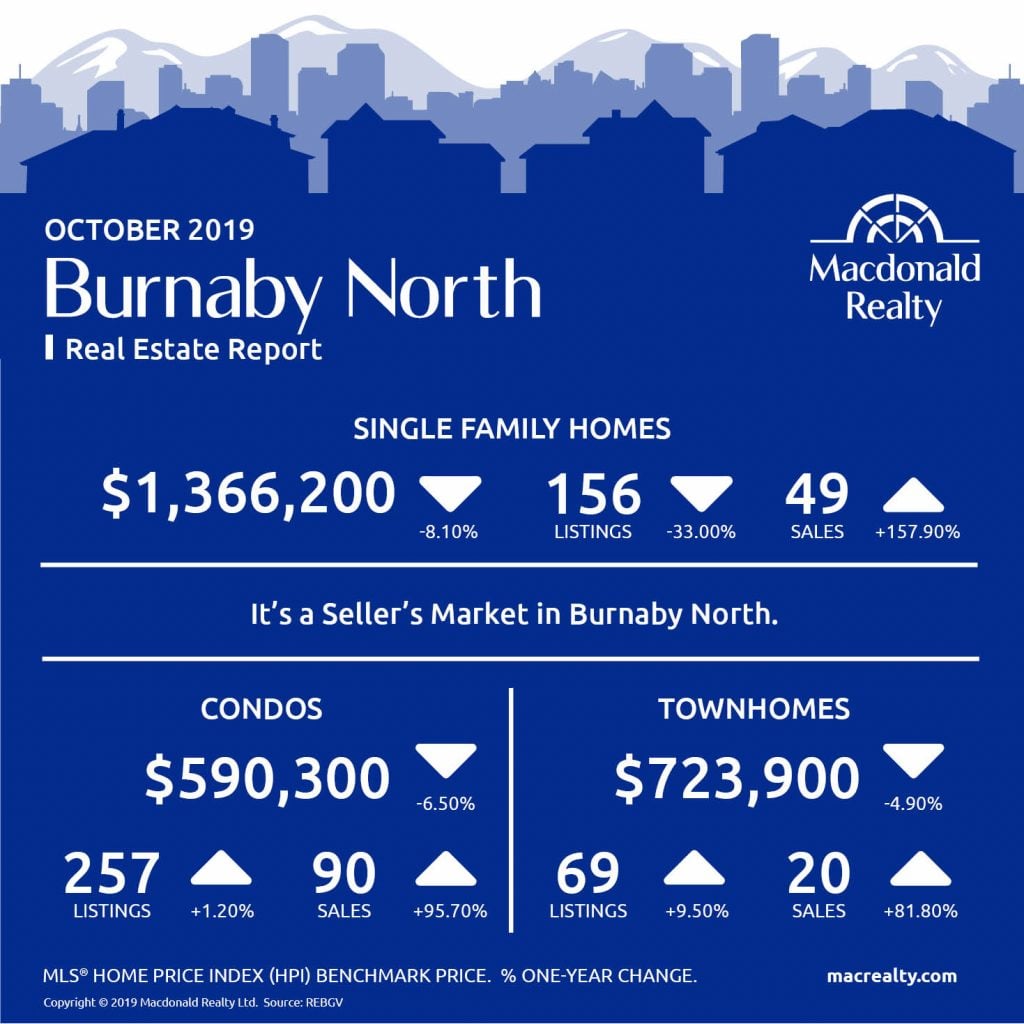
Burnaby North
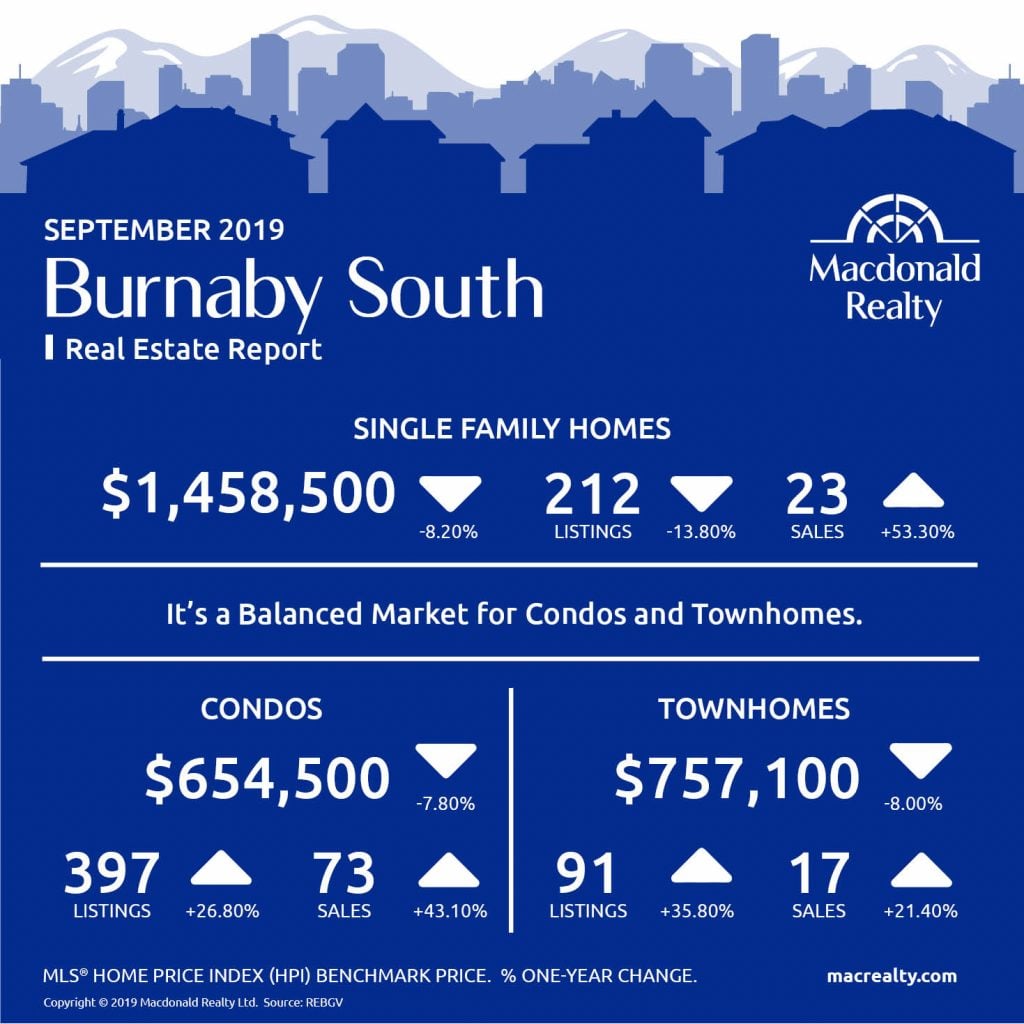
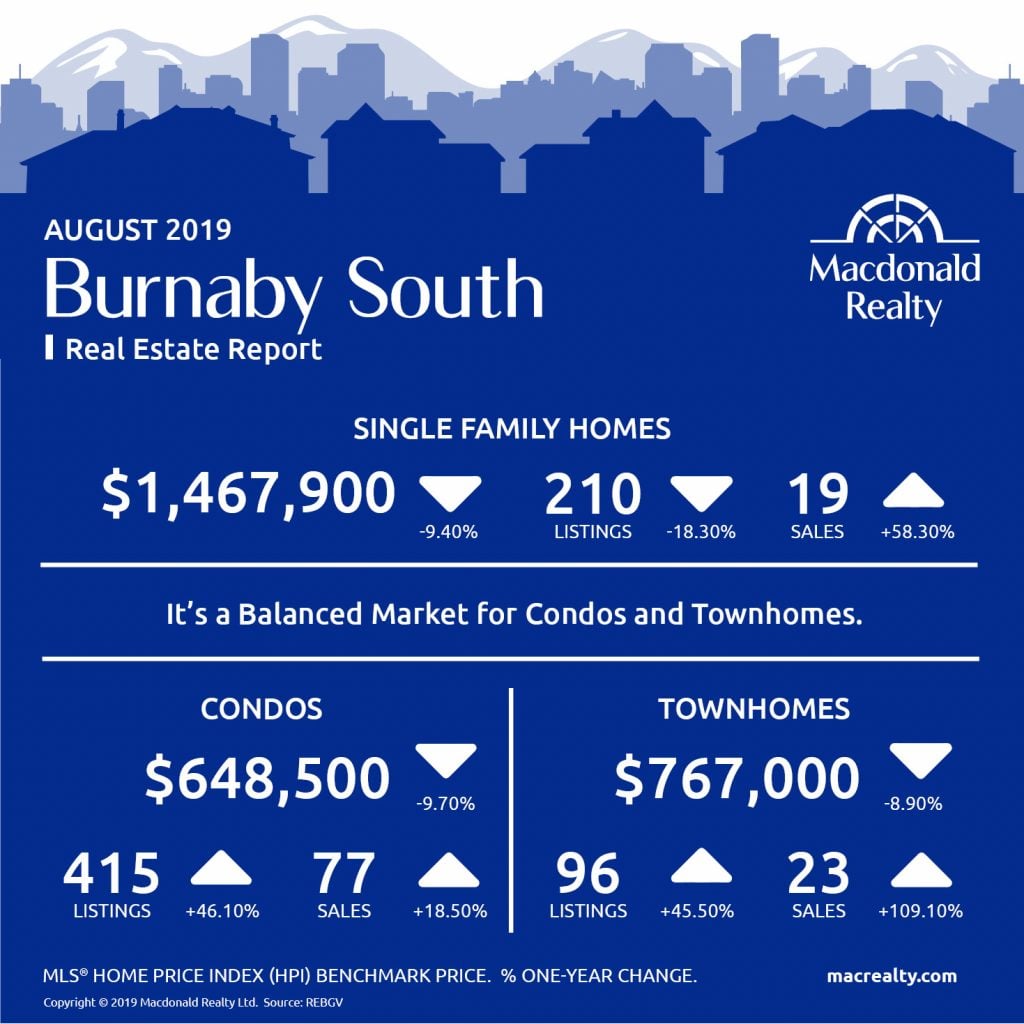
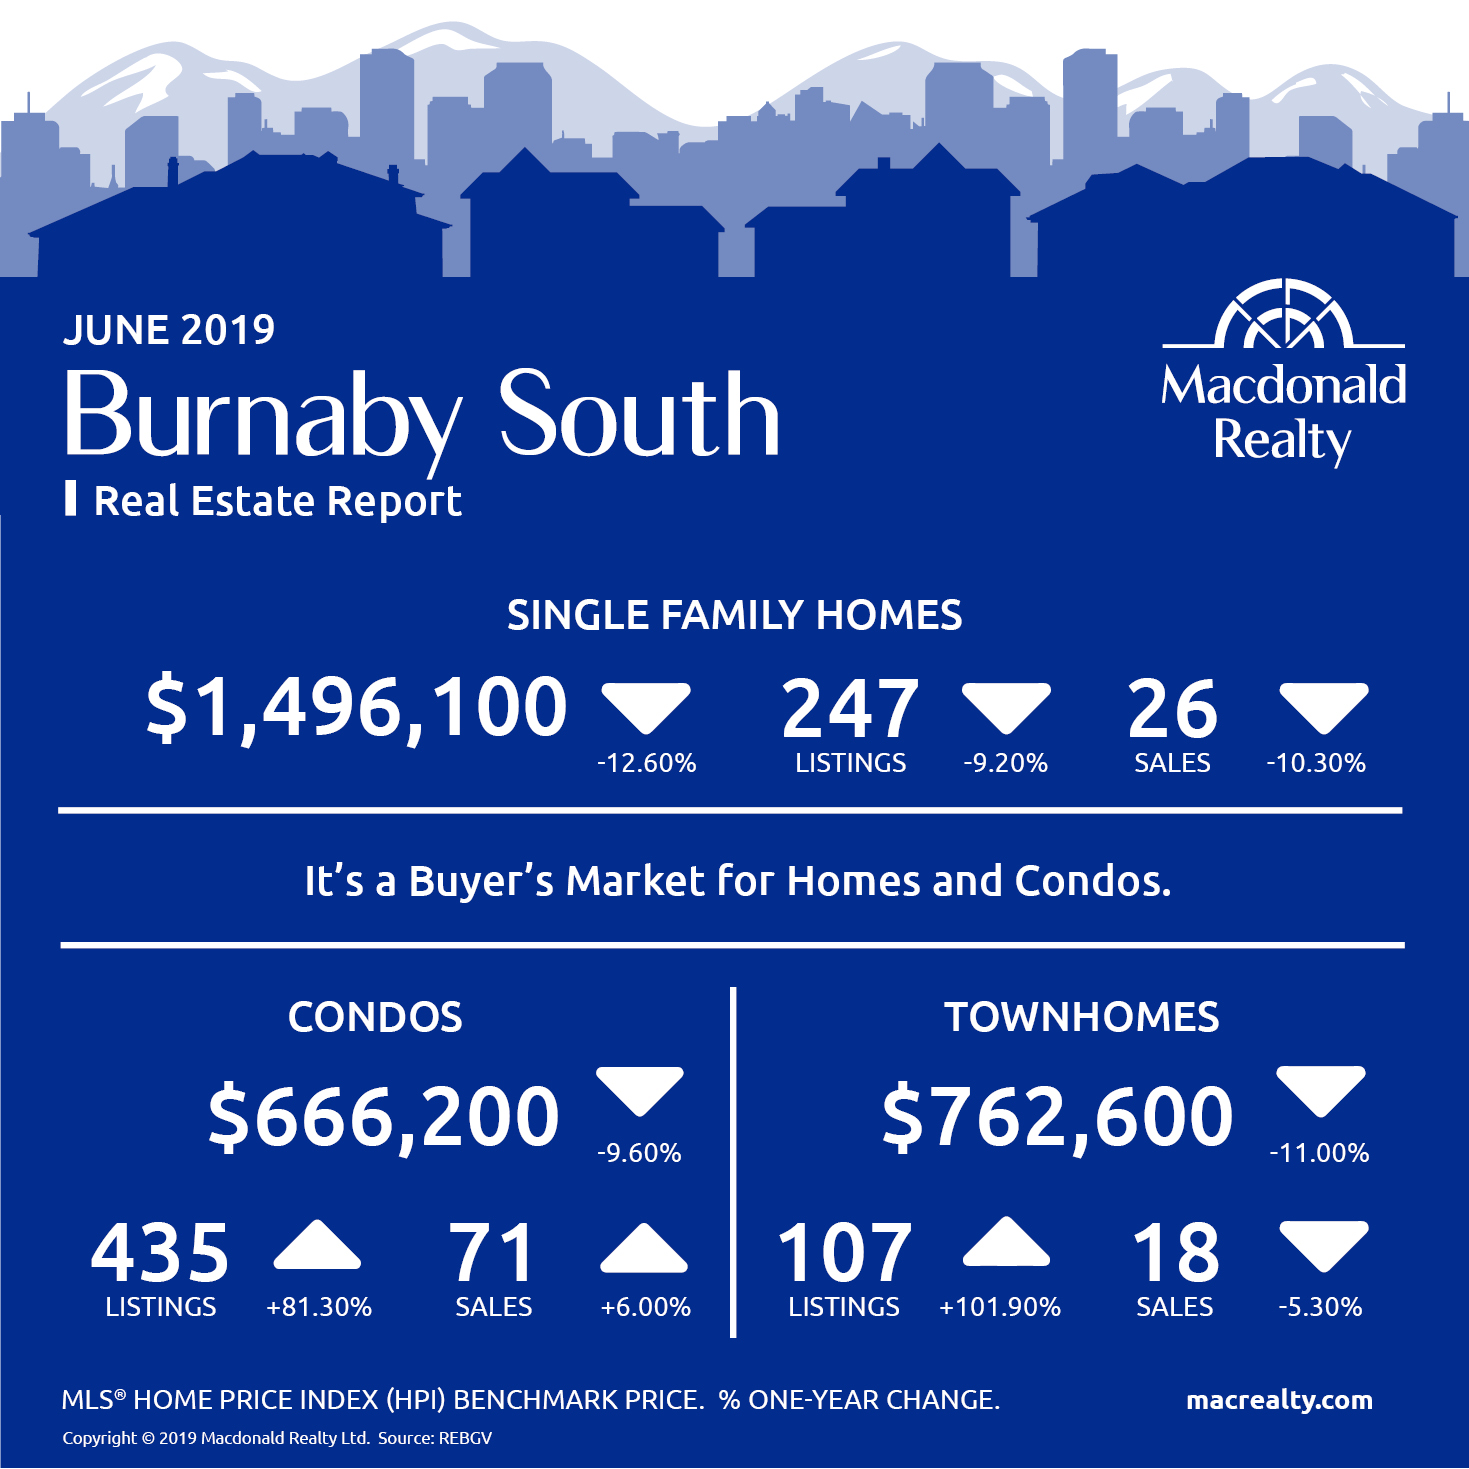
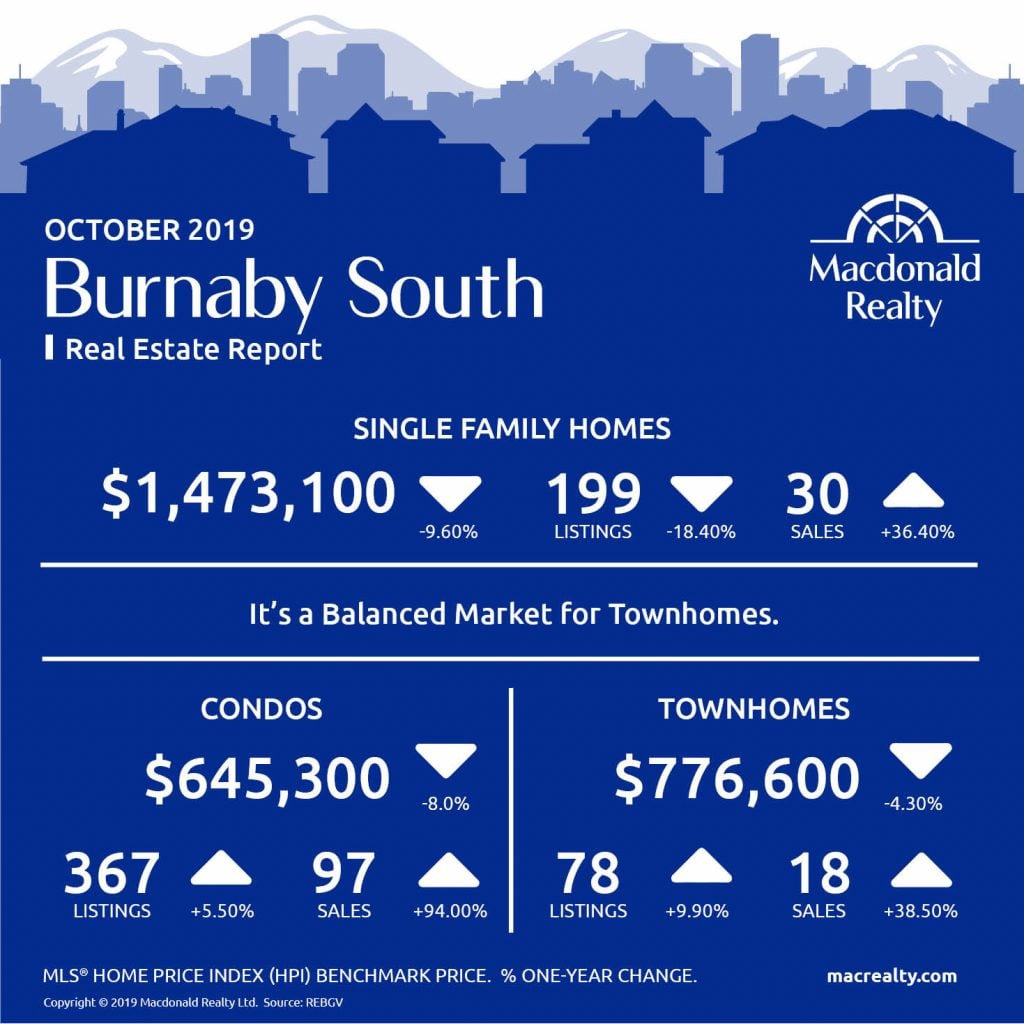
Burnaby South
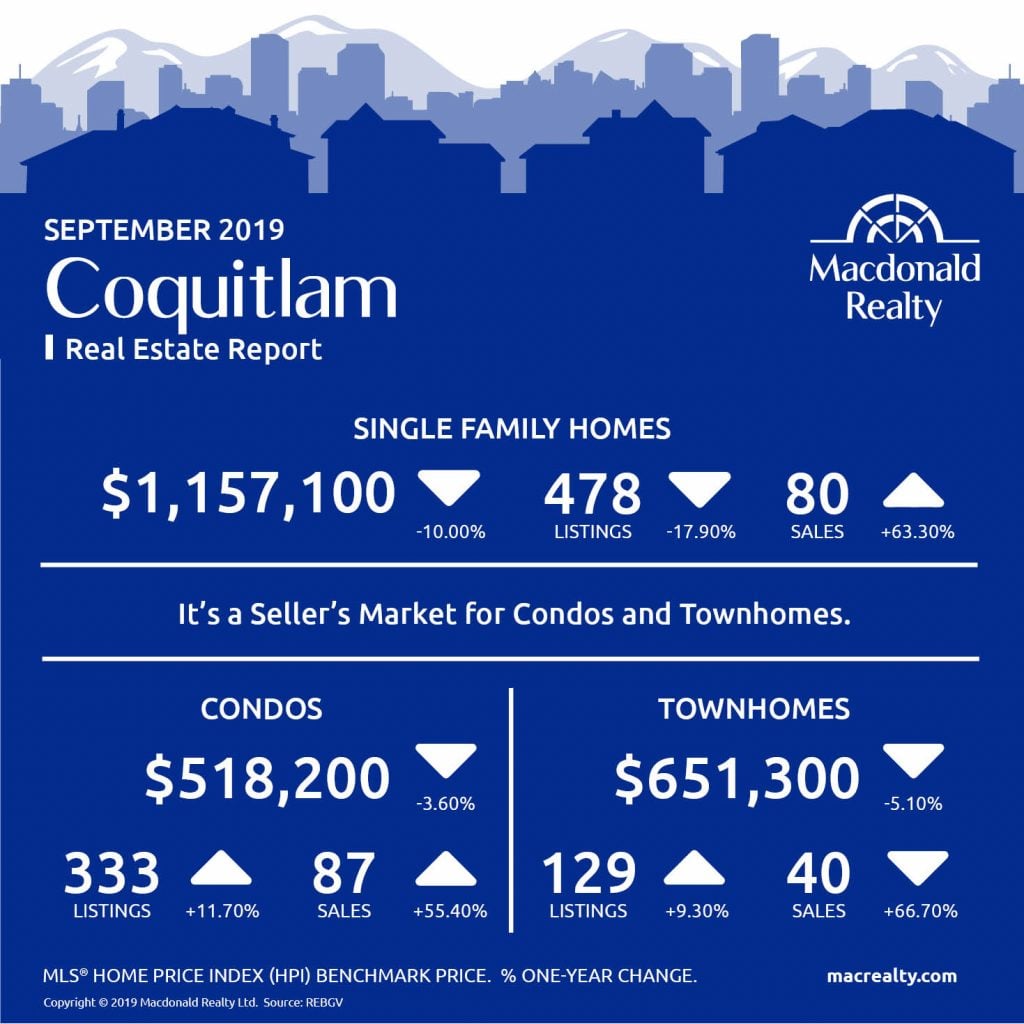
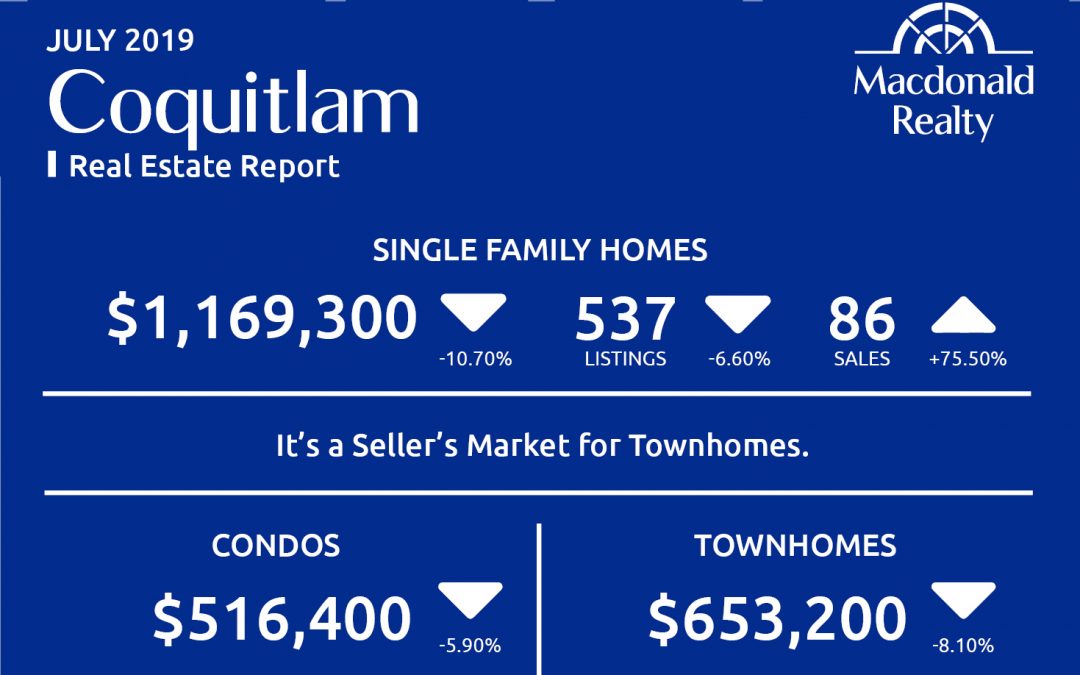
Coquitlam

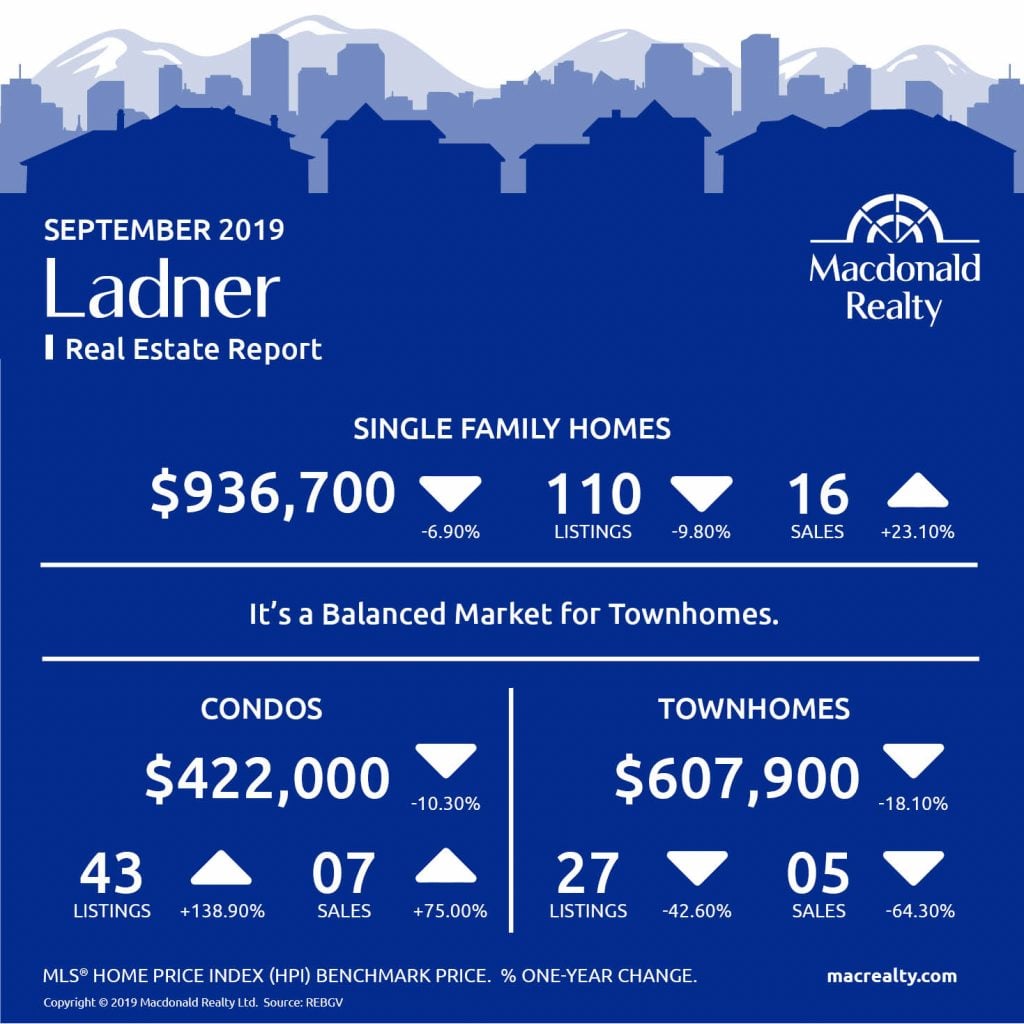
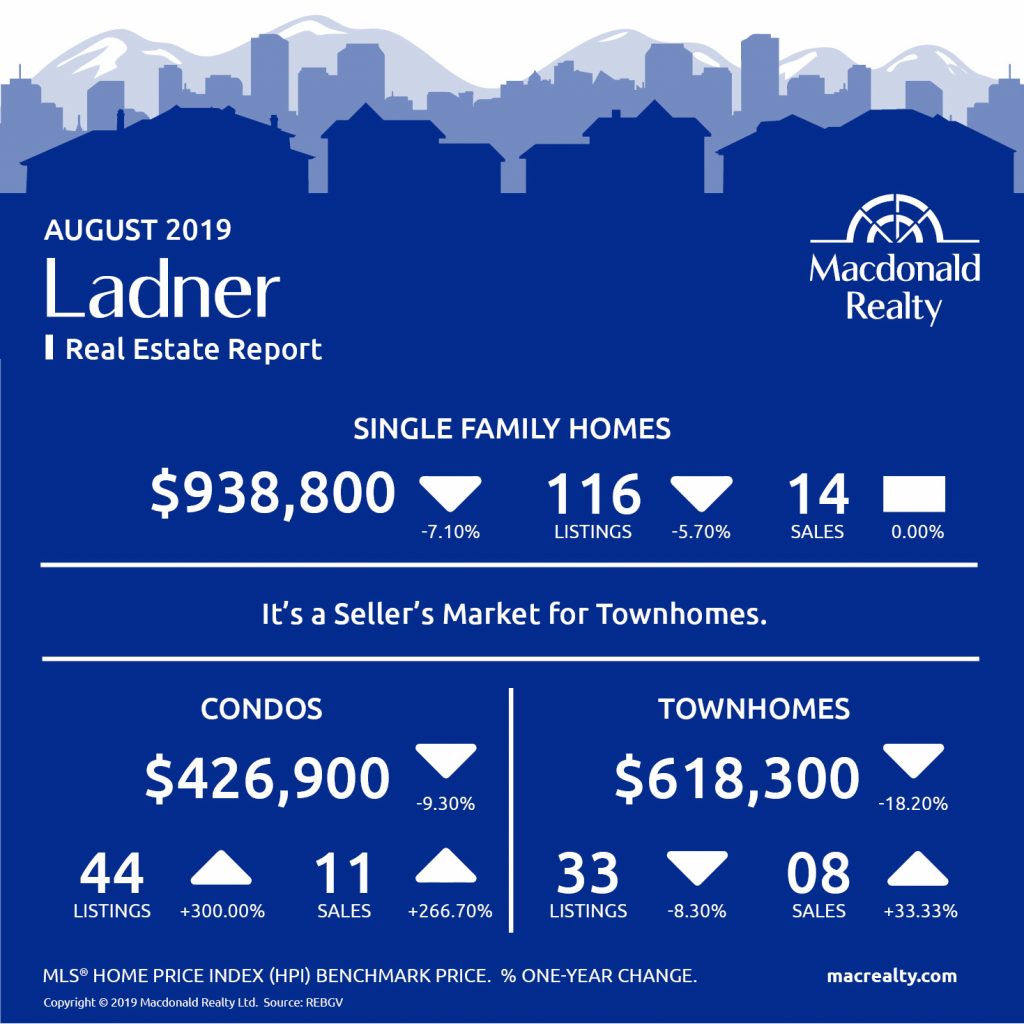
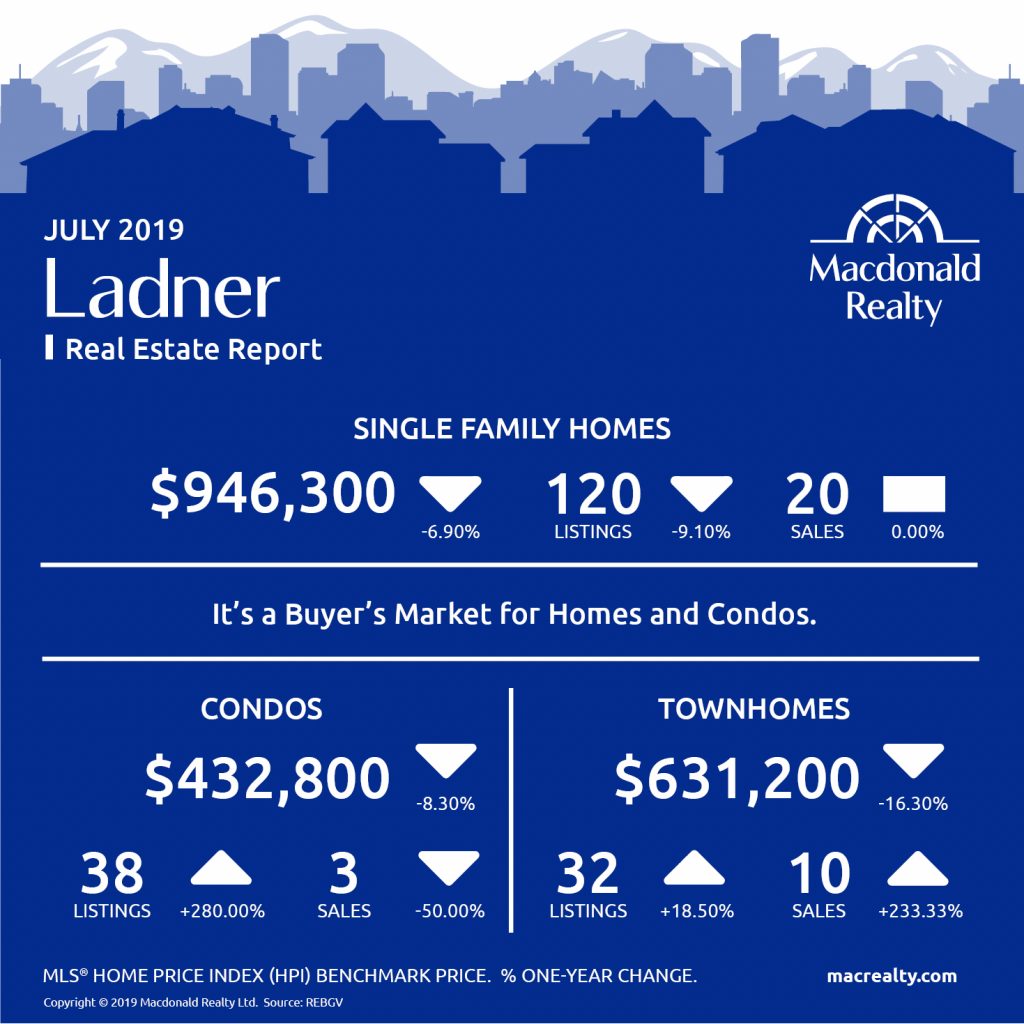
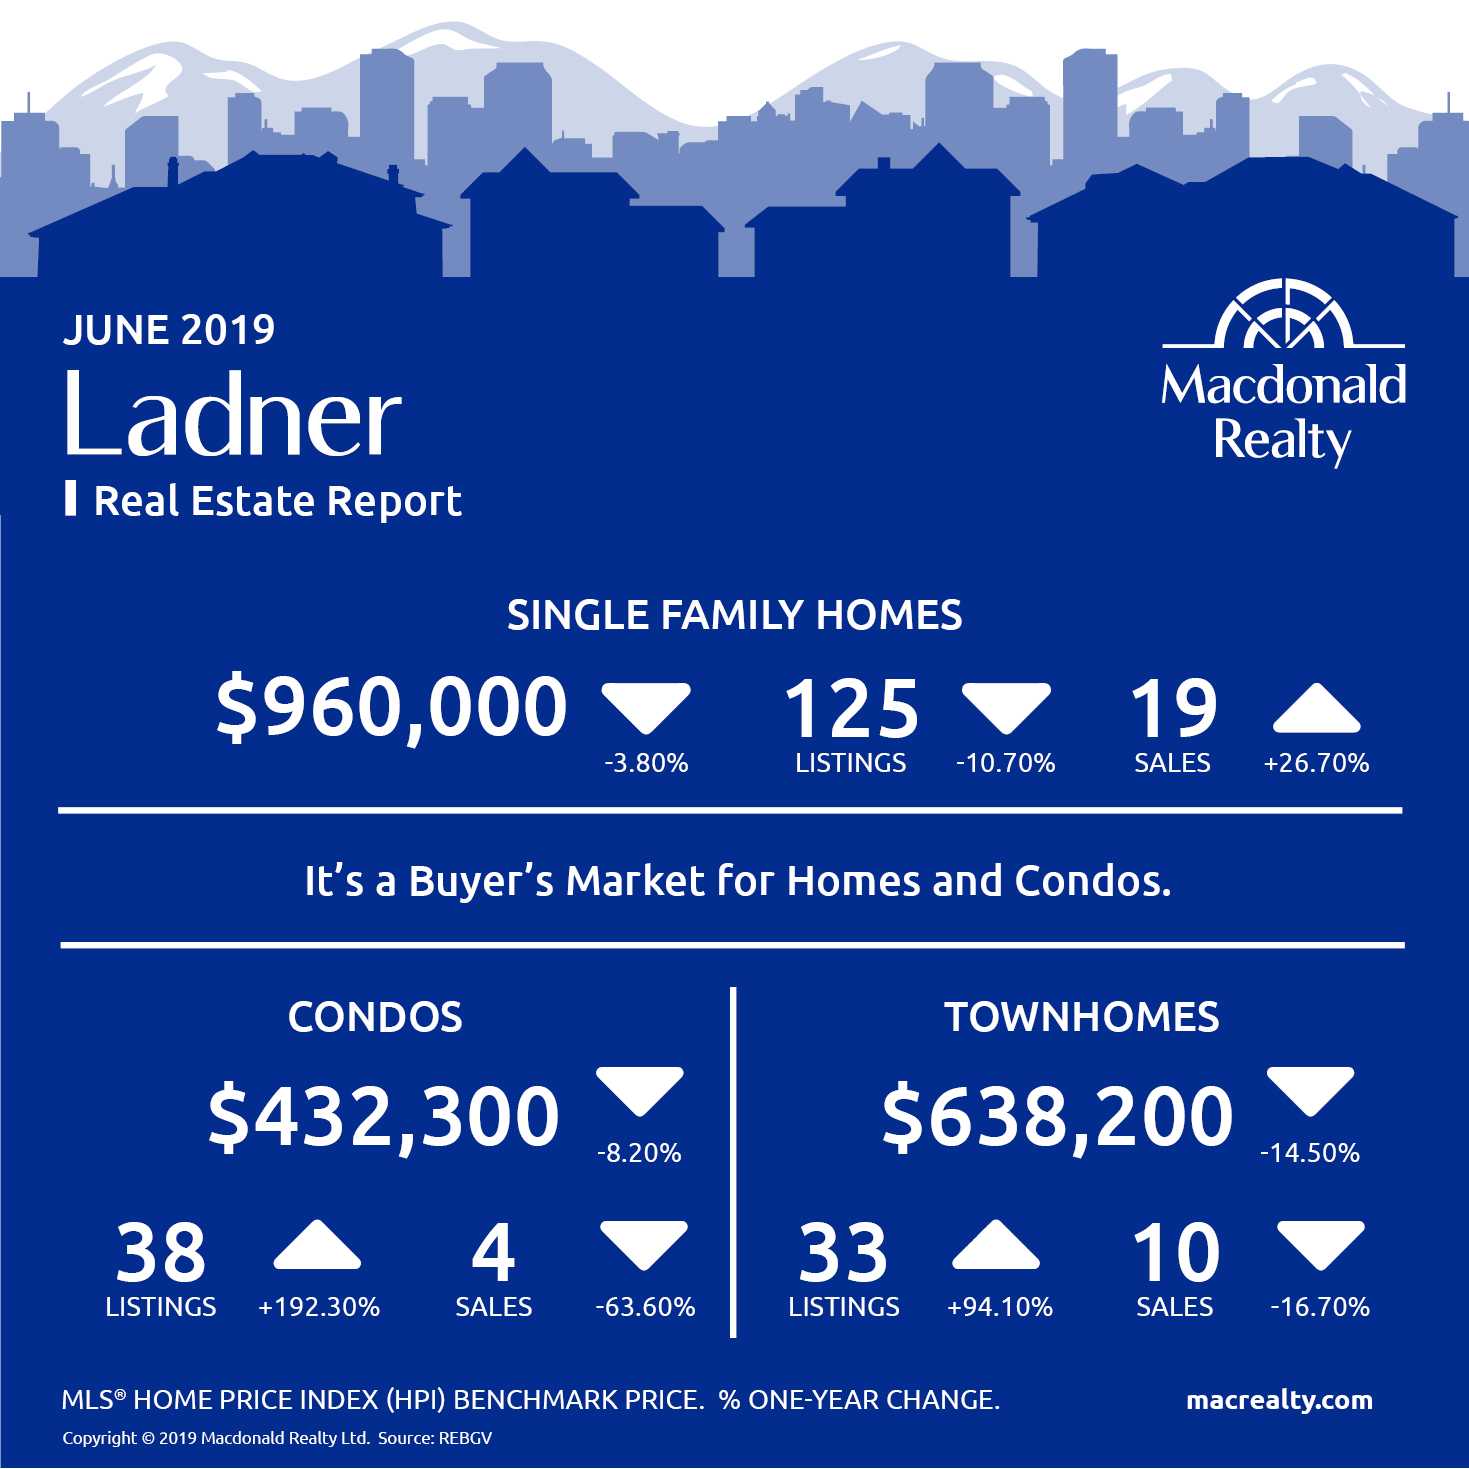
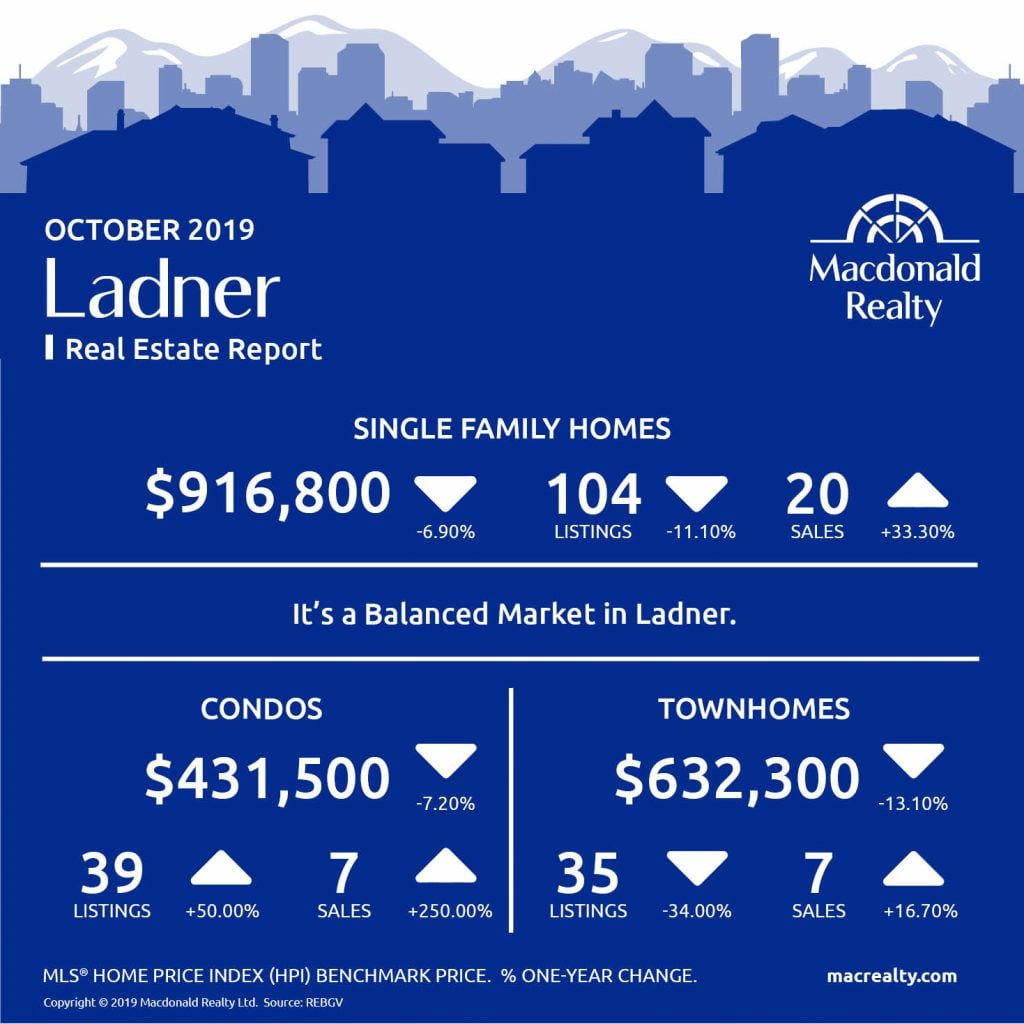
Ladner
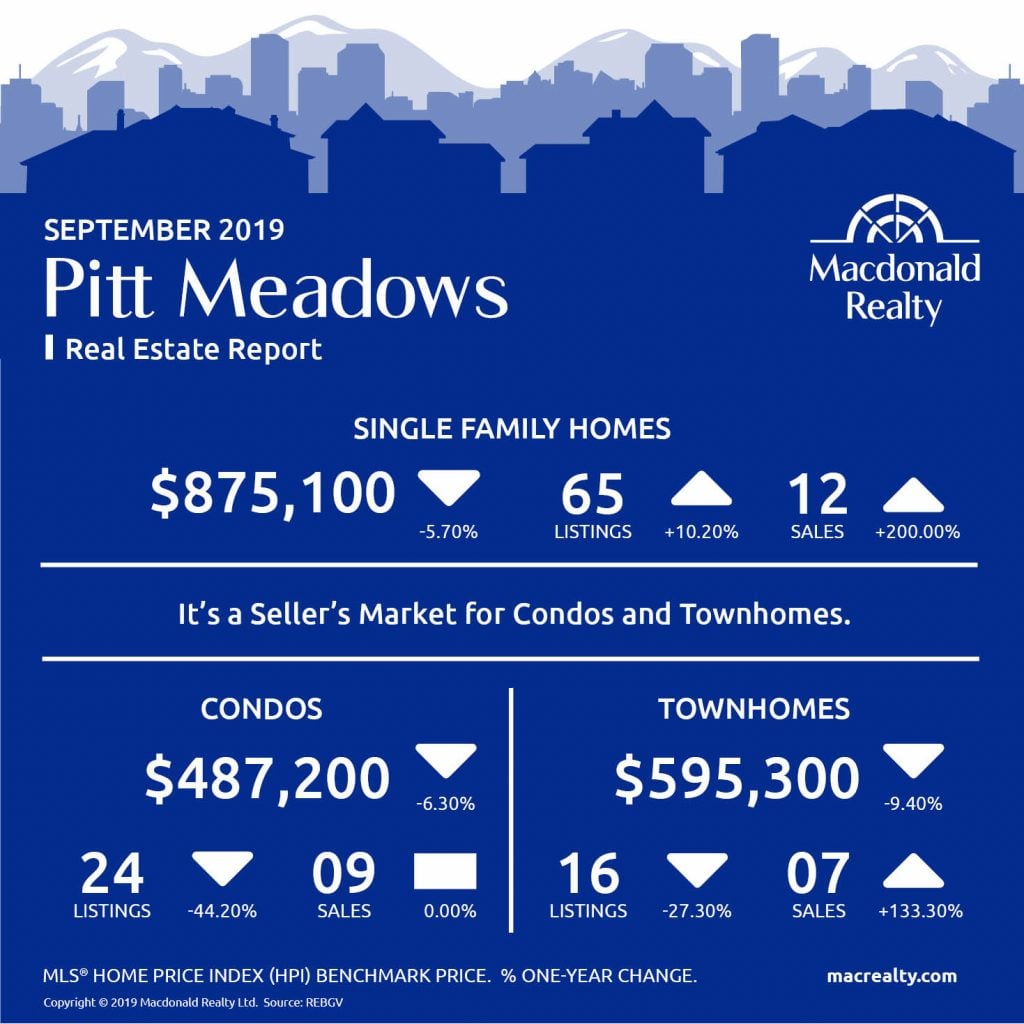
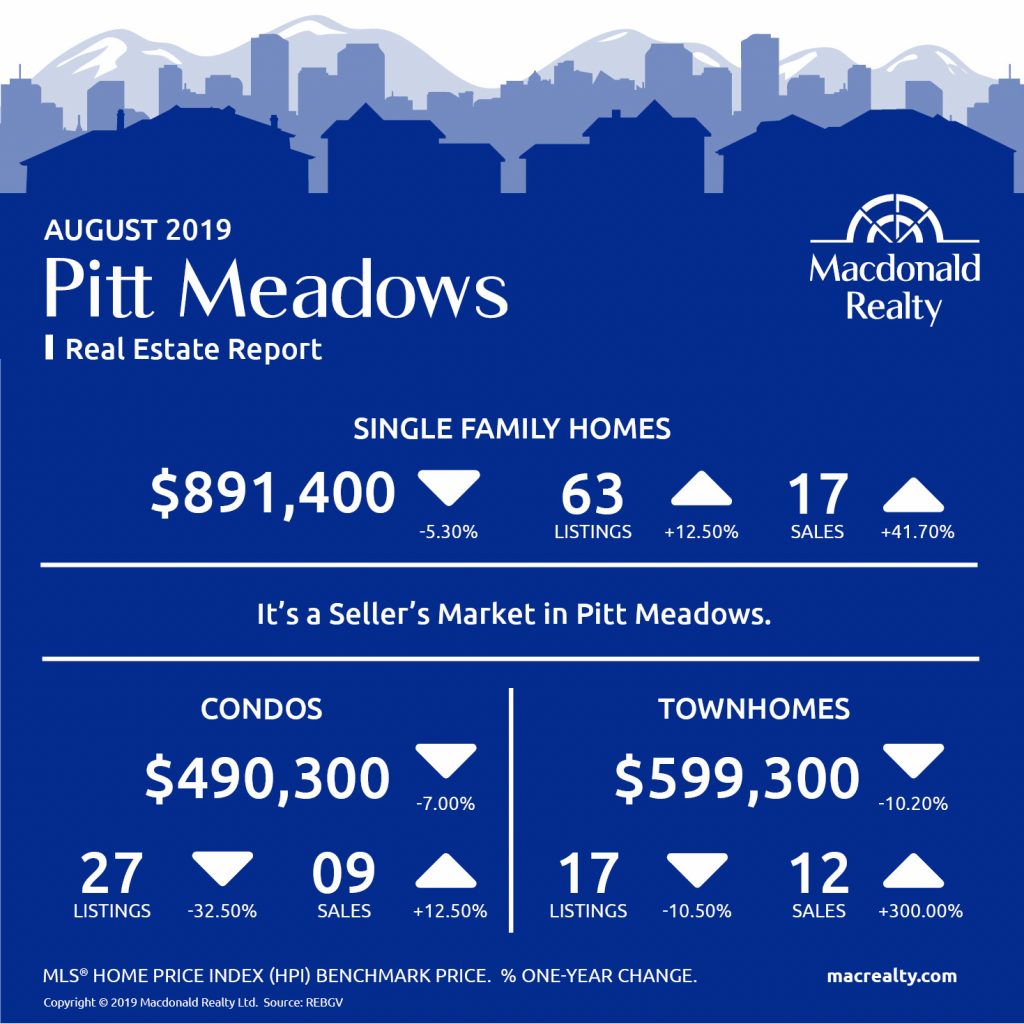
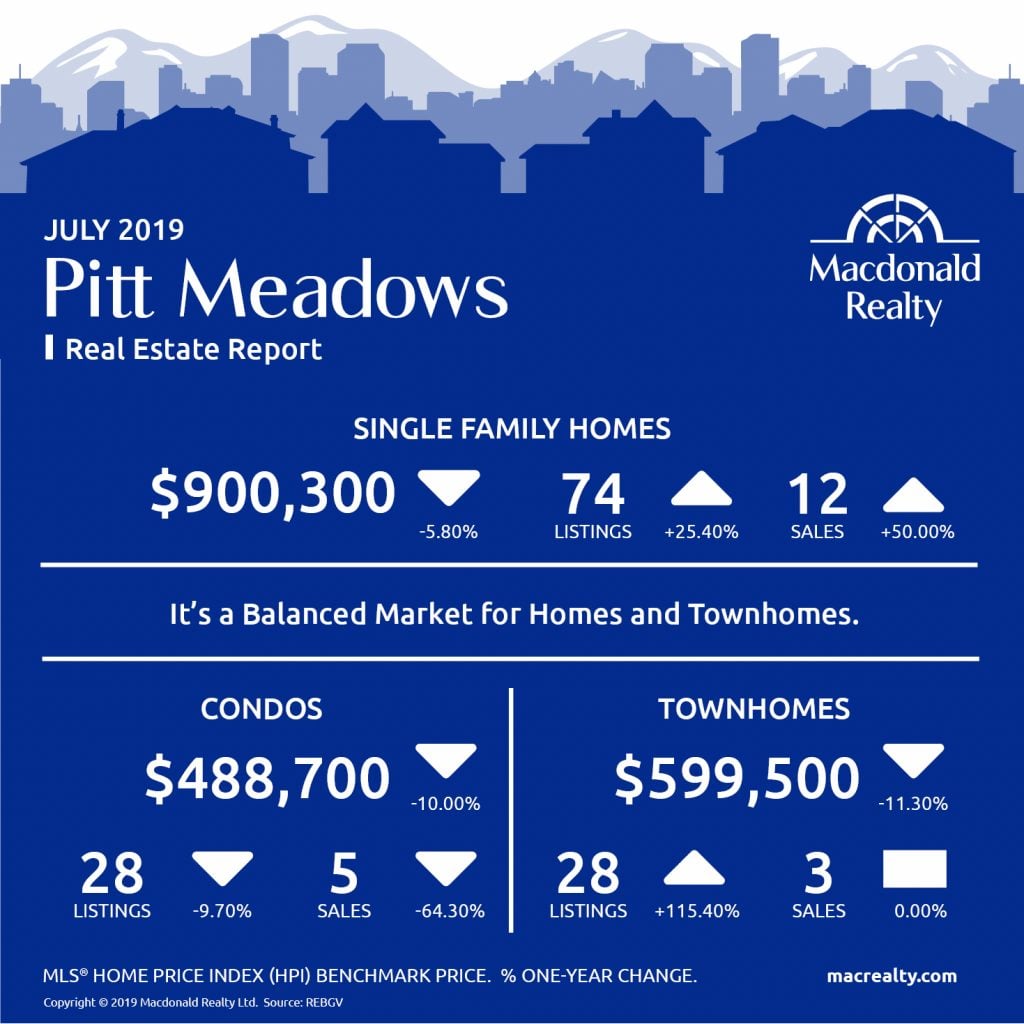
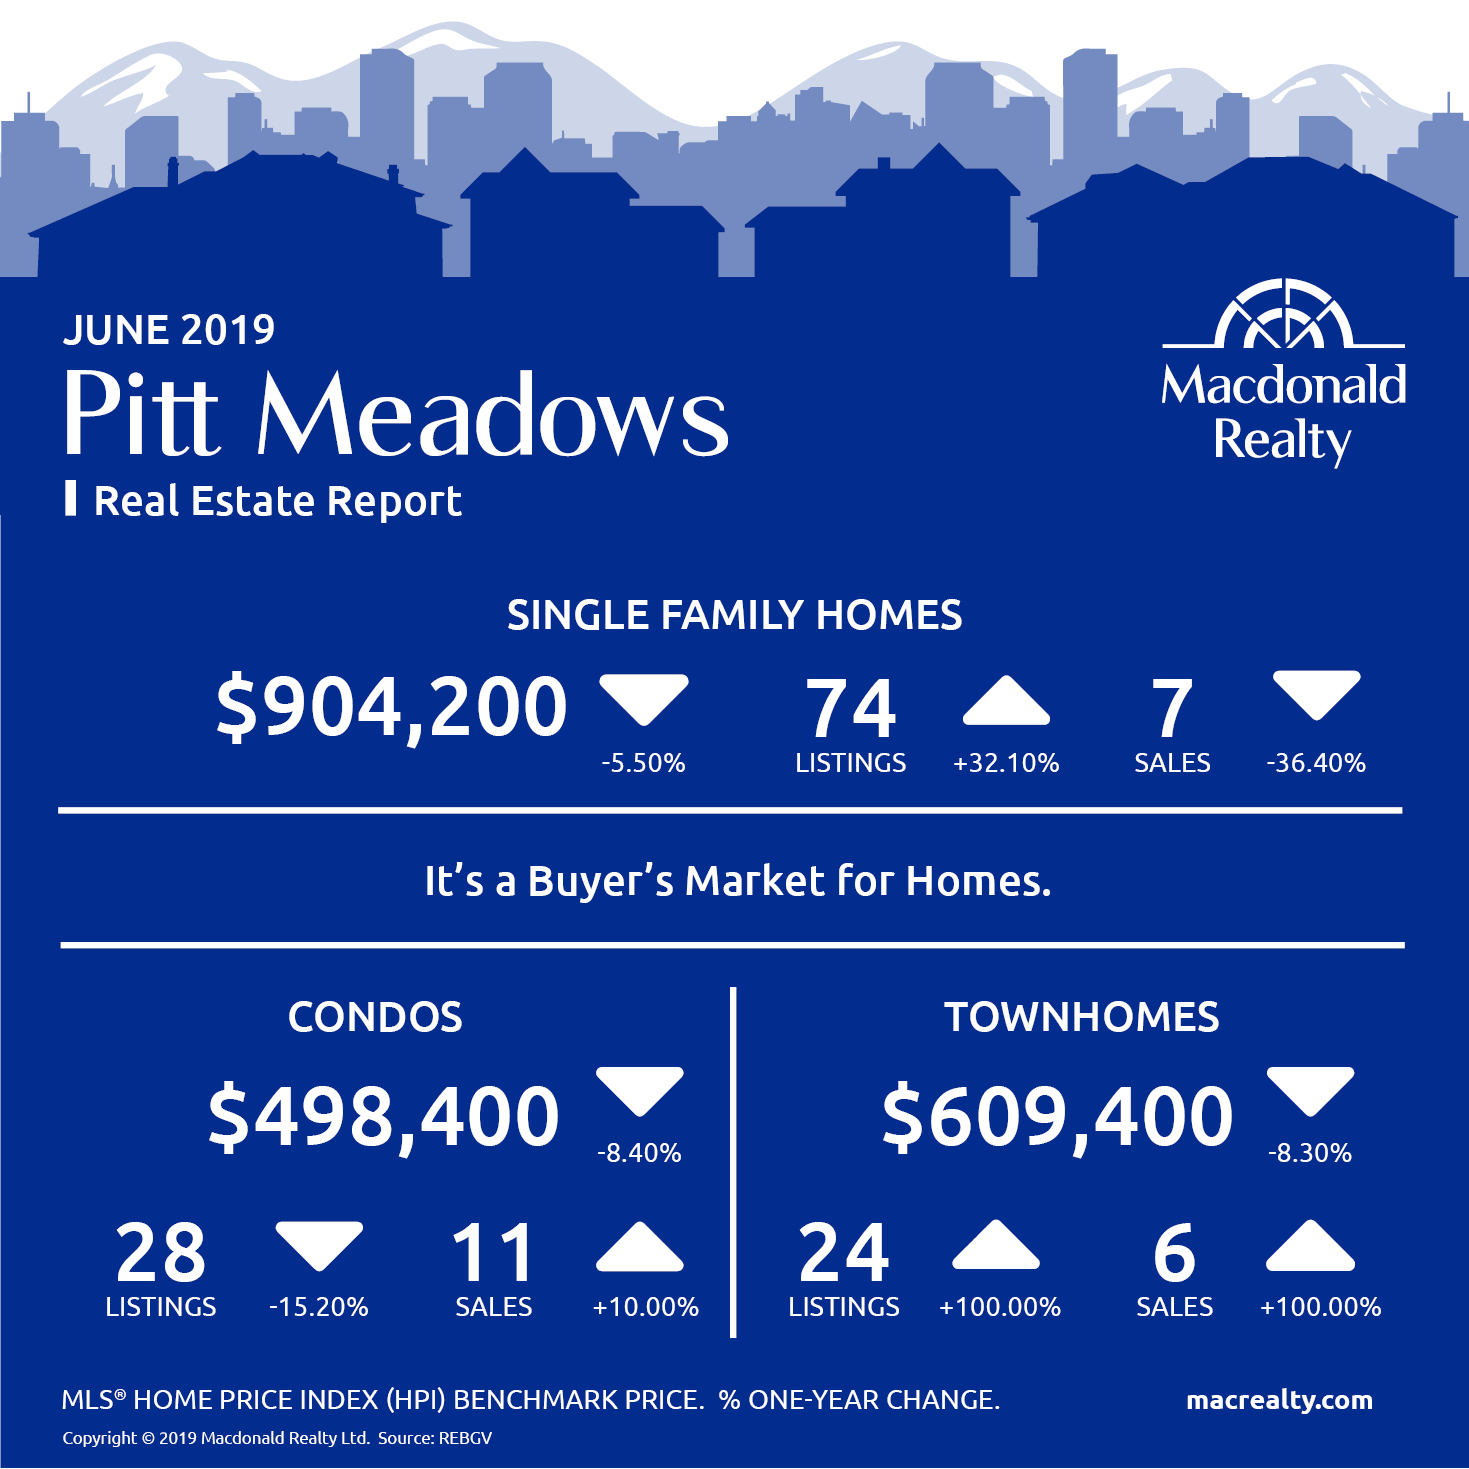
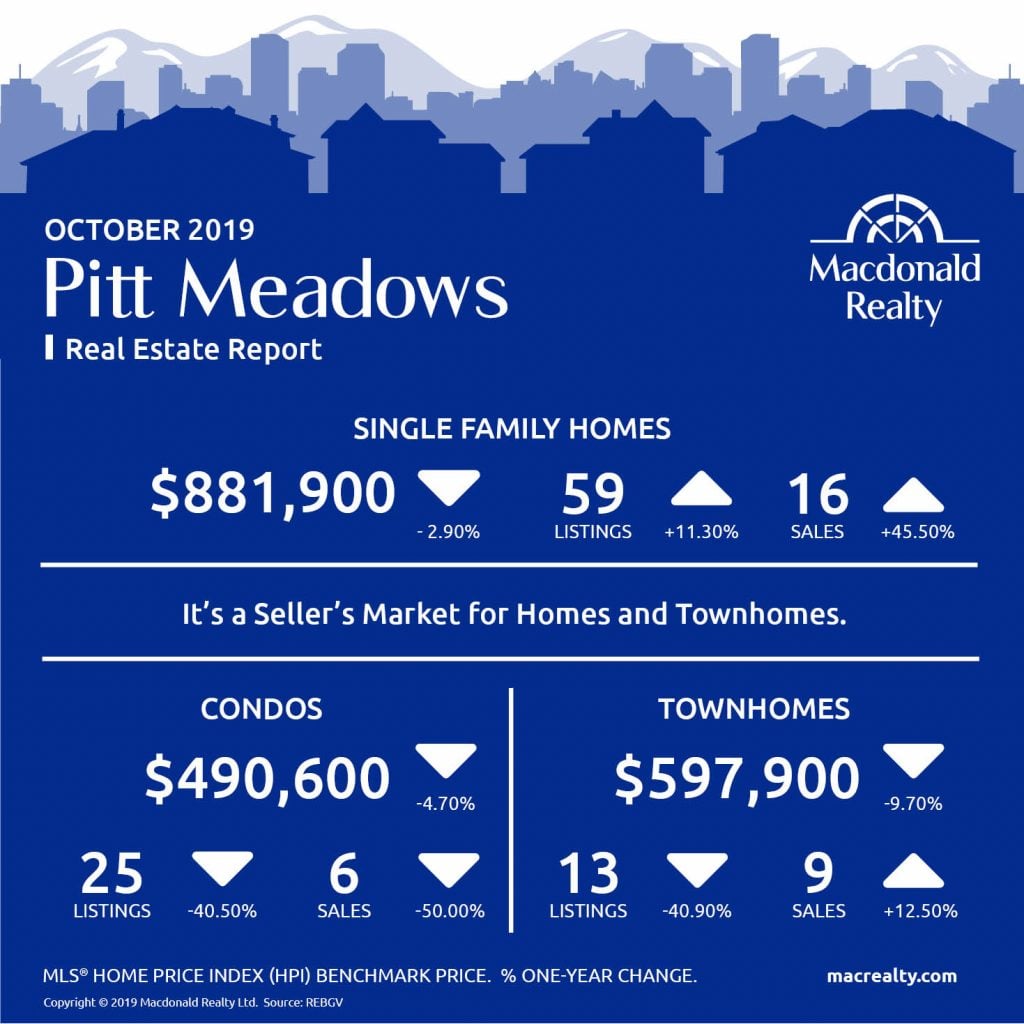
Pitt Meadows
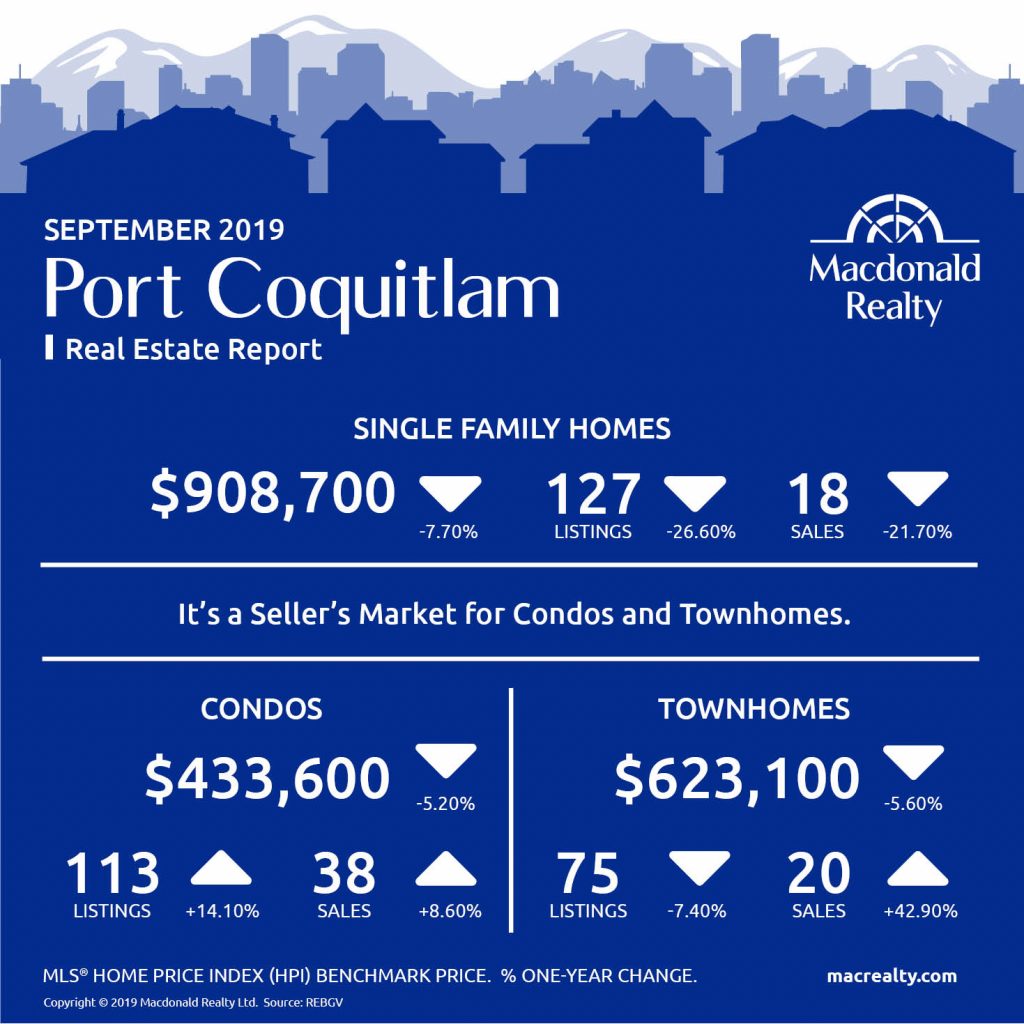
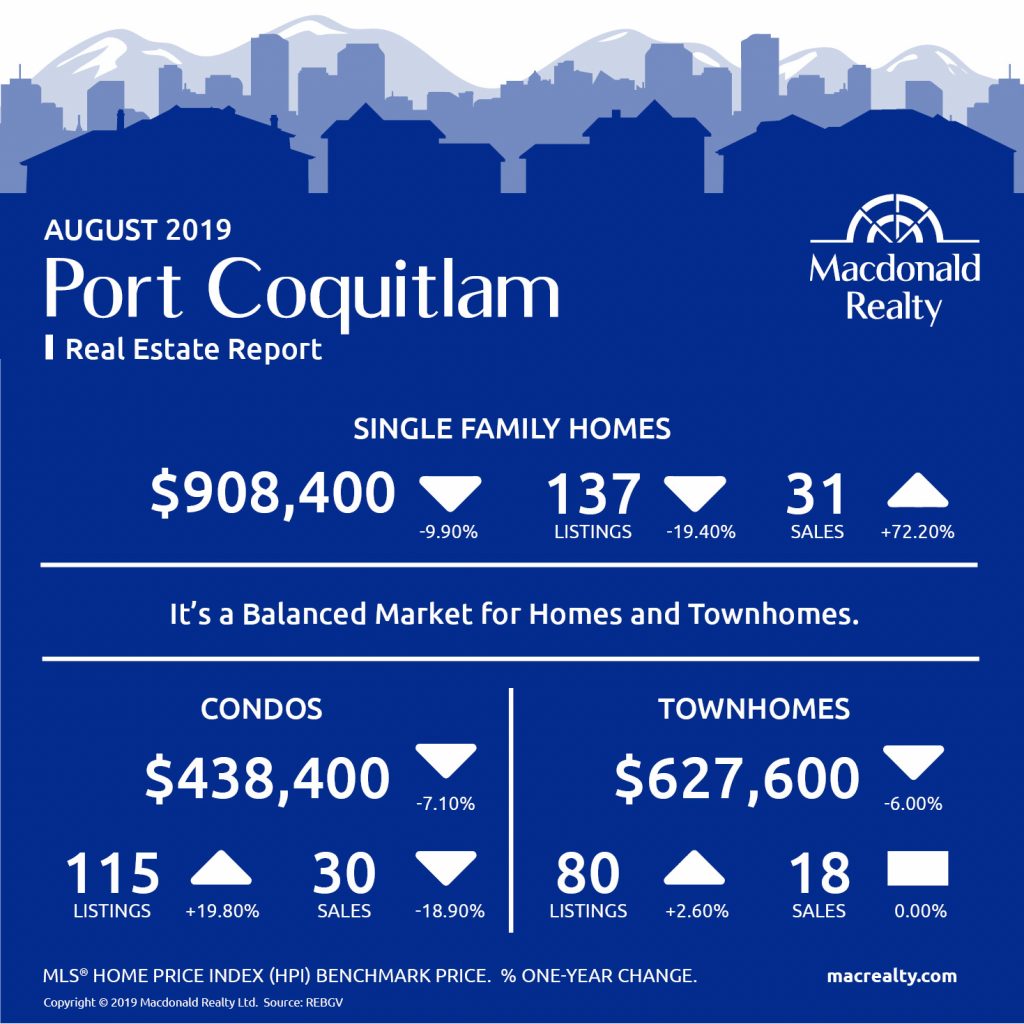
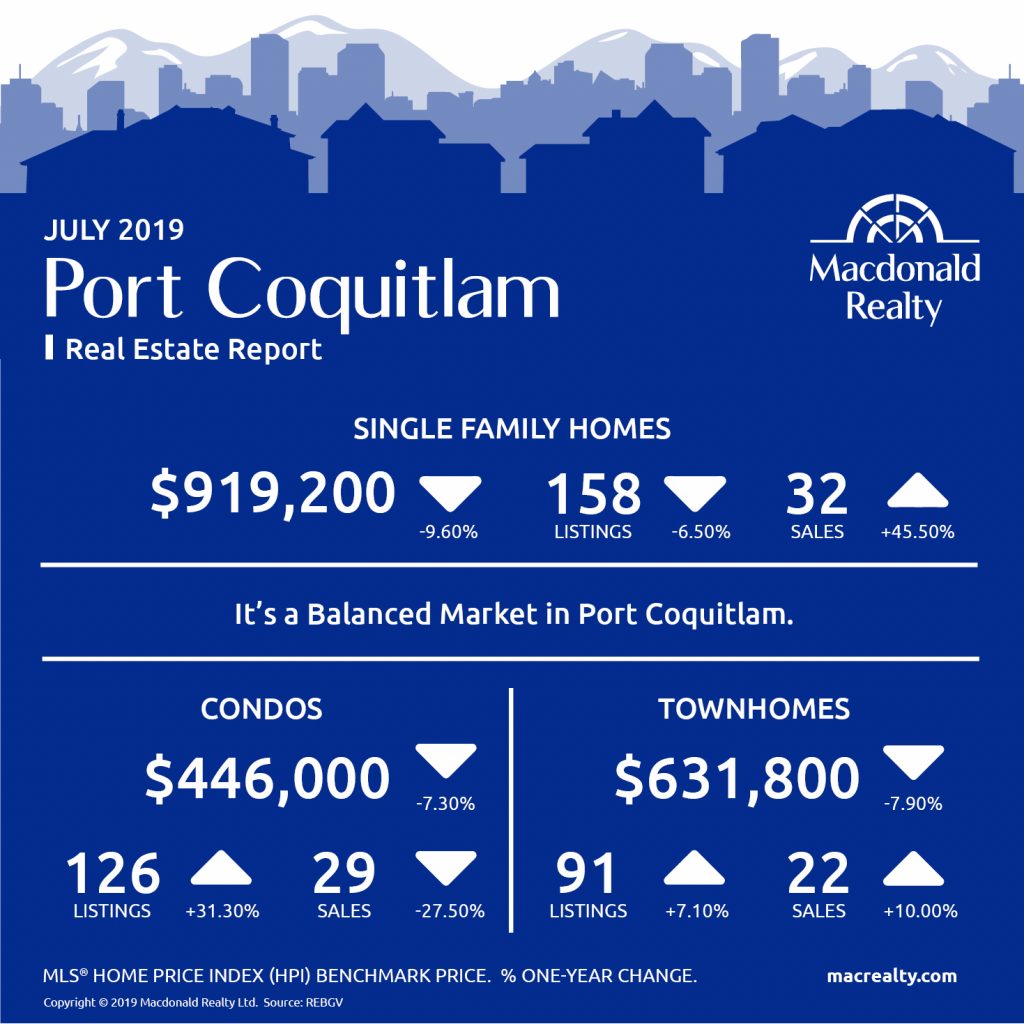
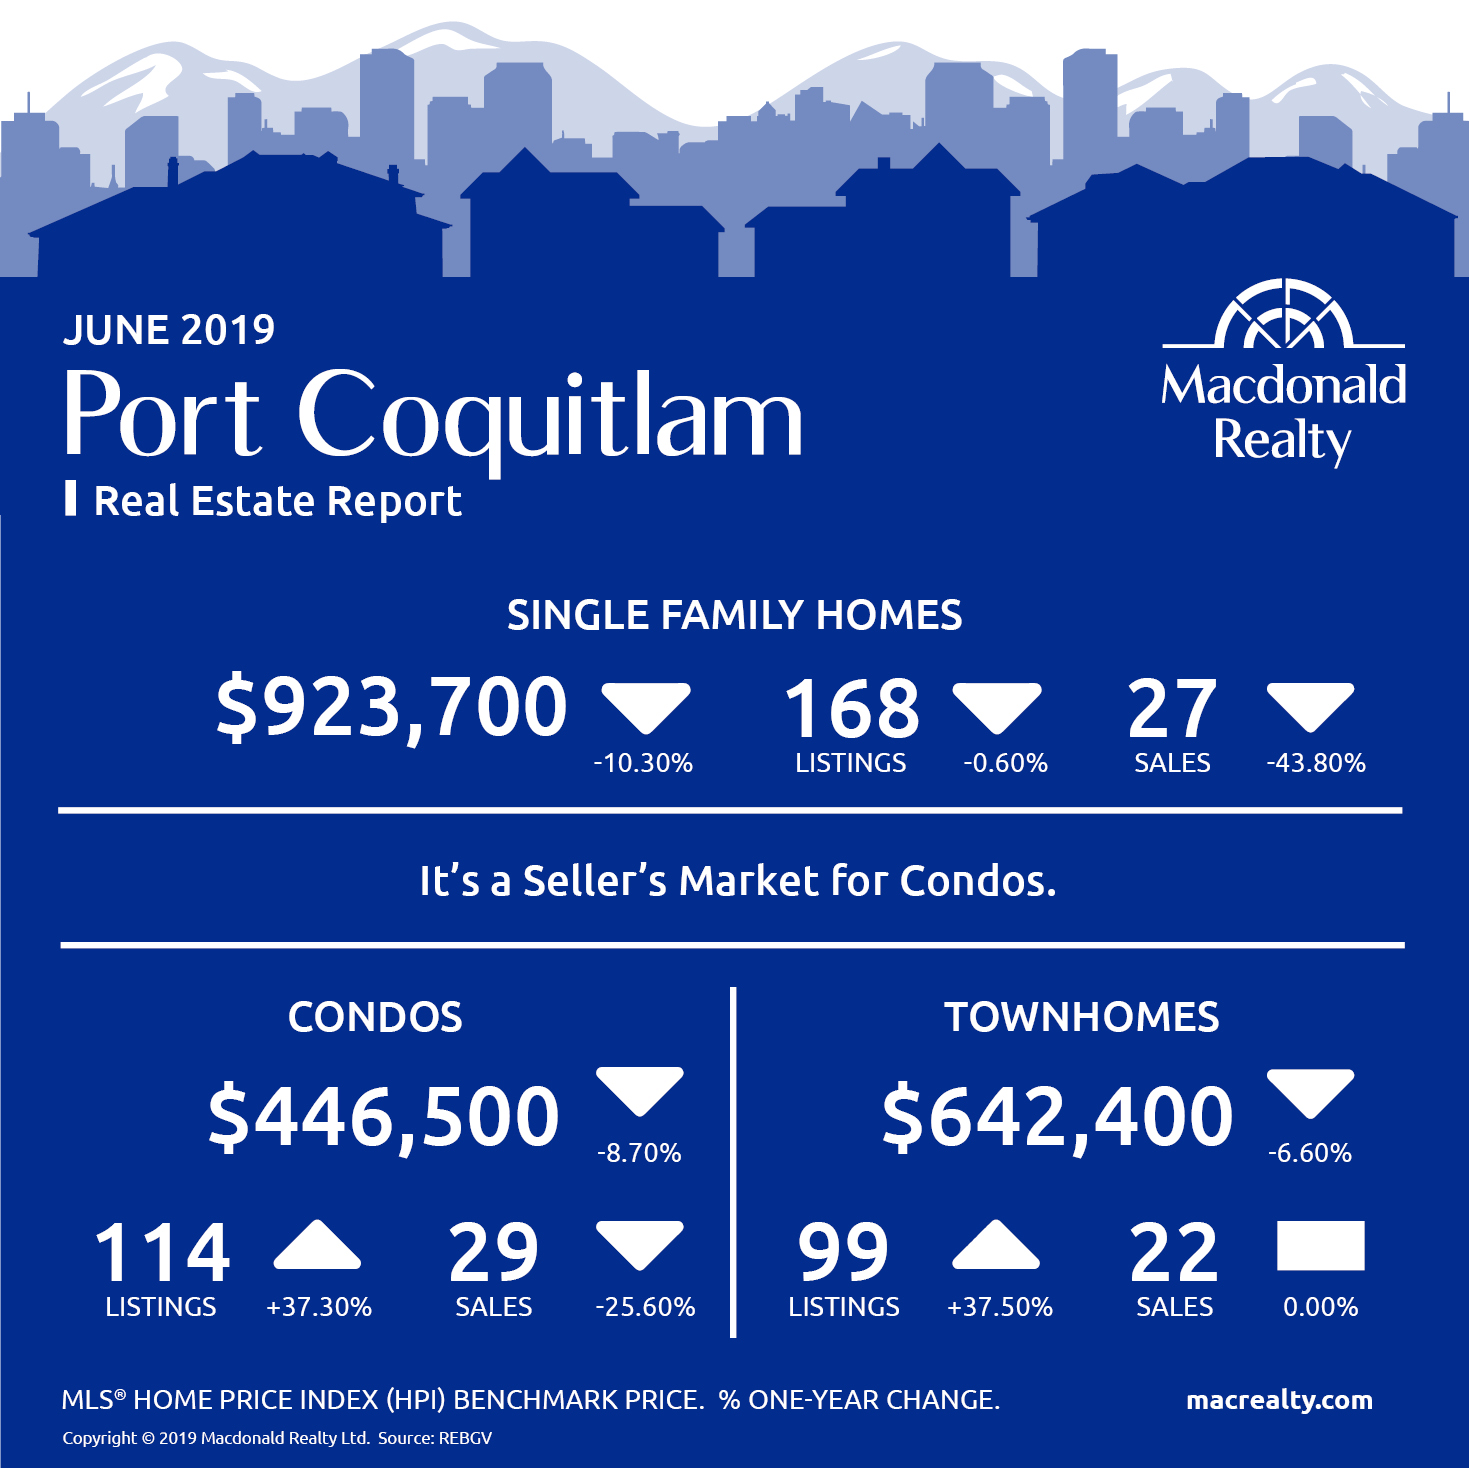
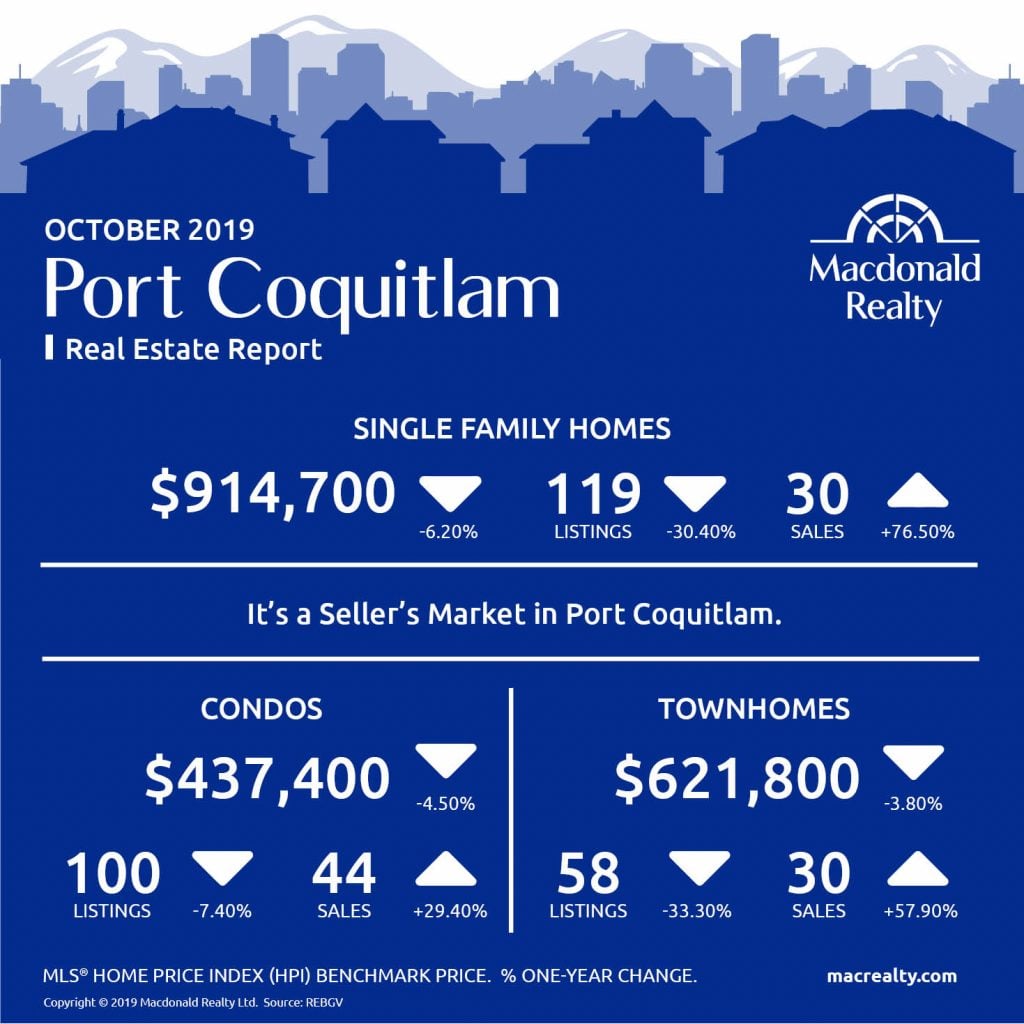
Port Coquitlam
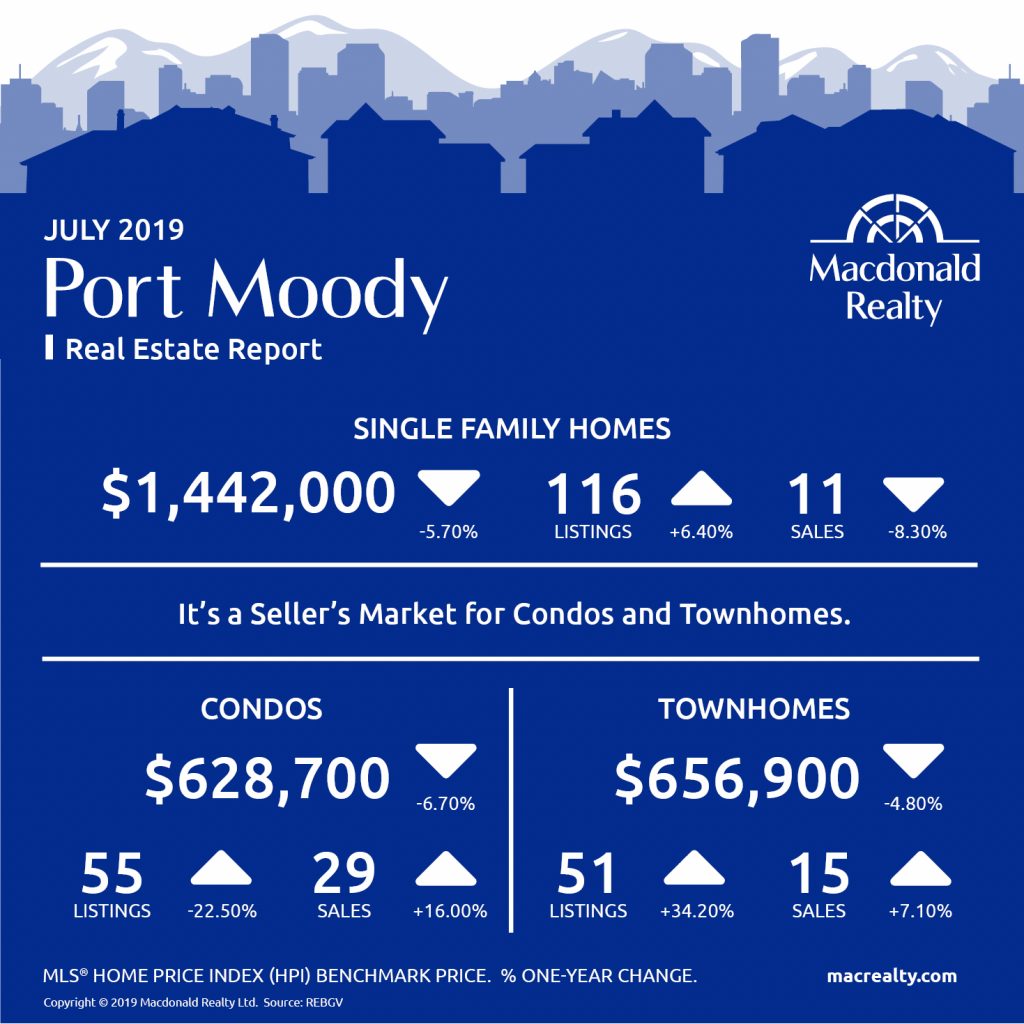
Port Moody

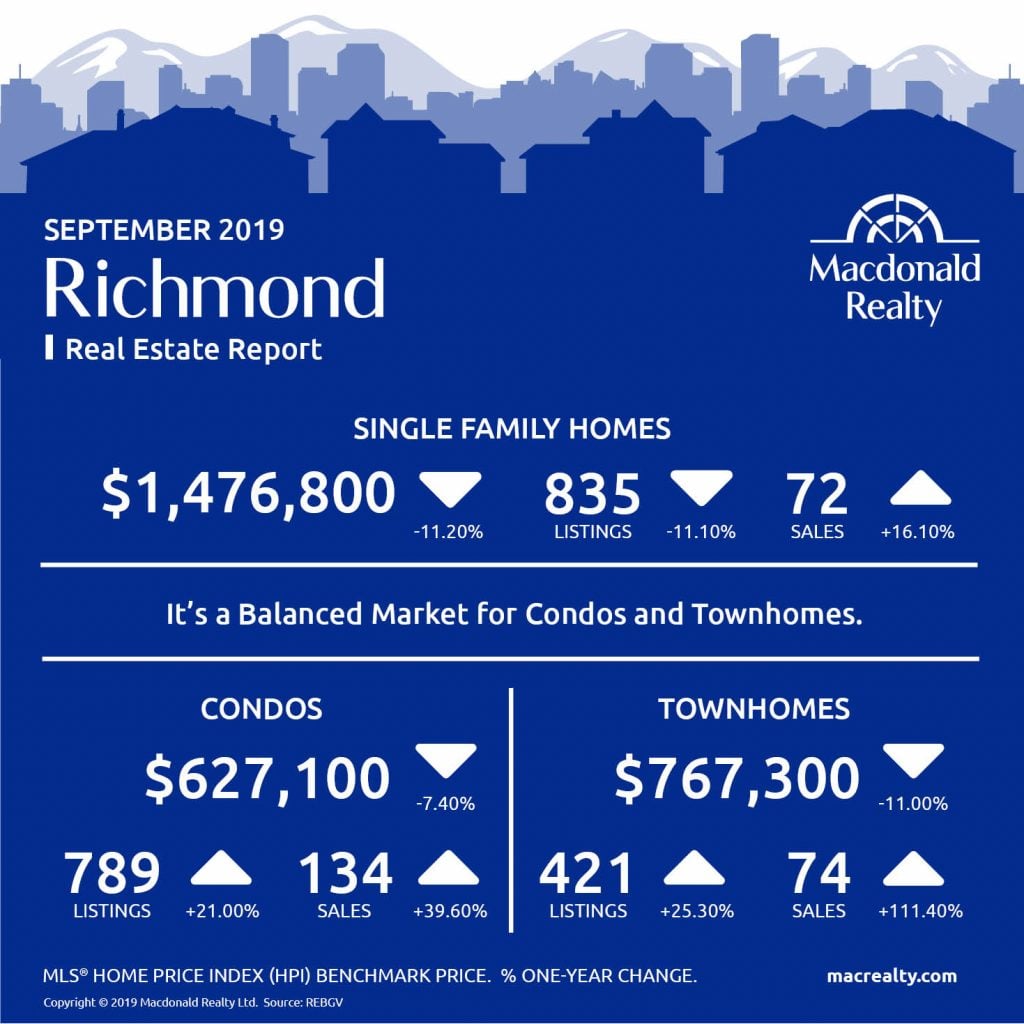
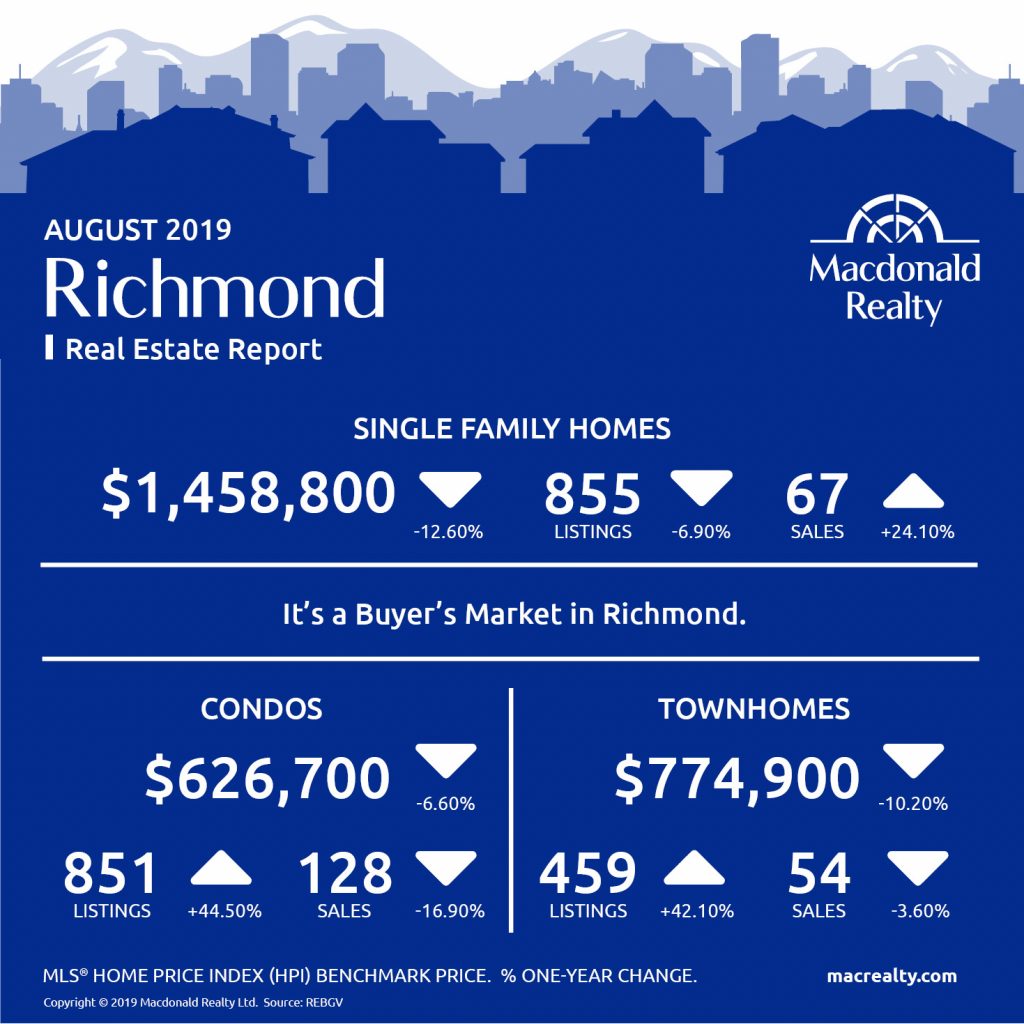
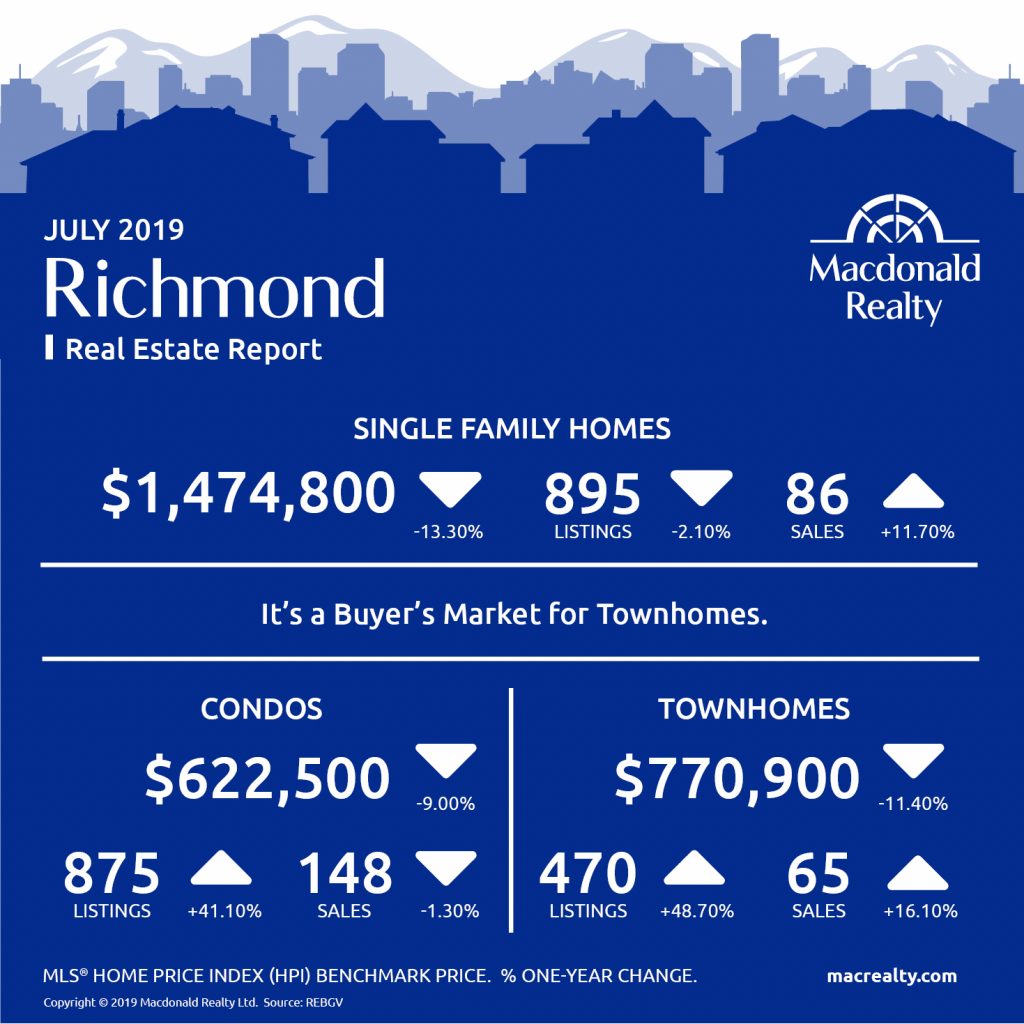
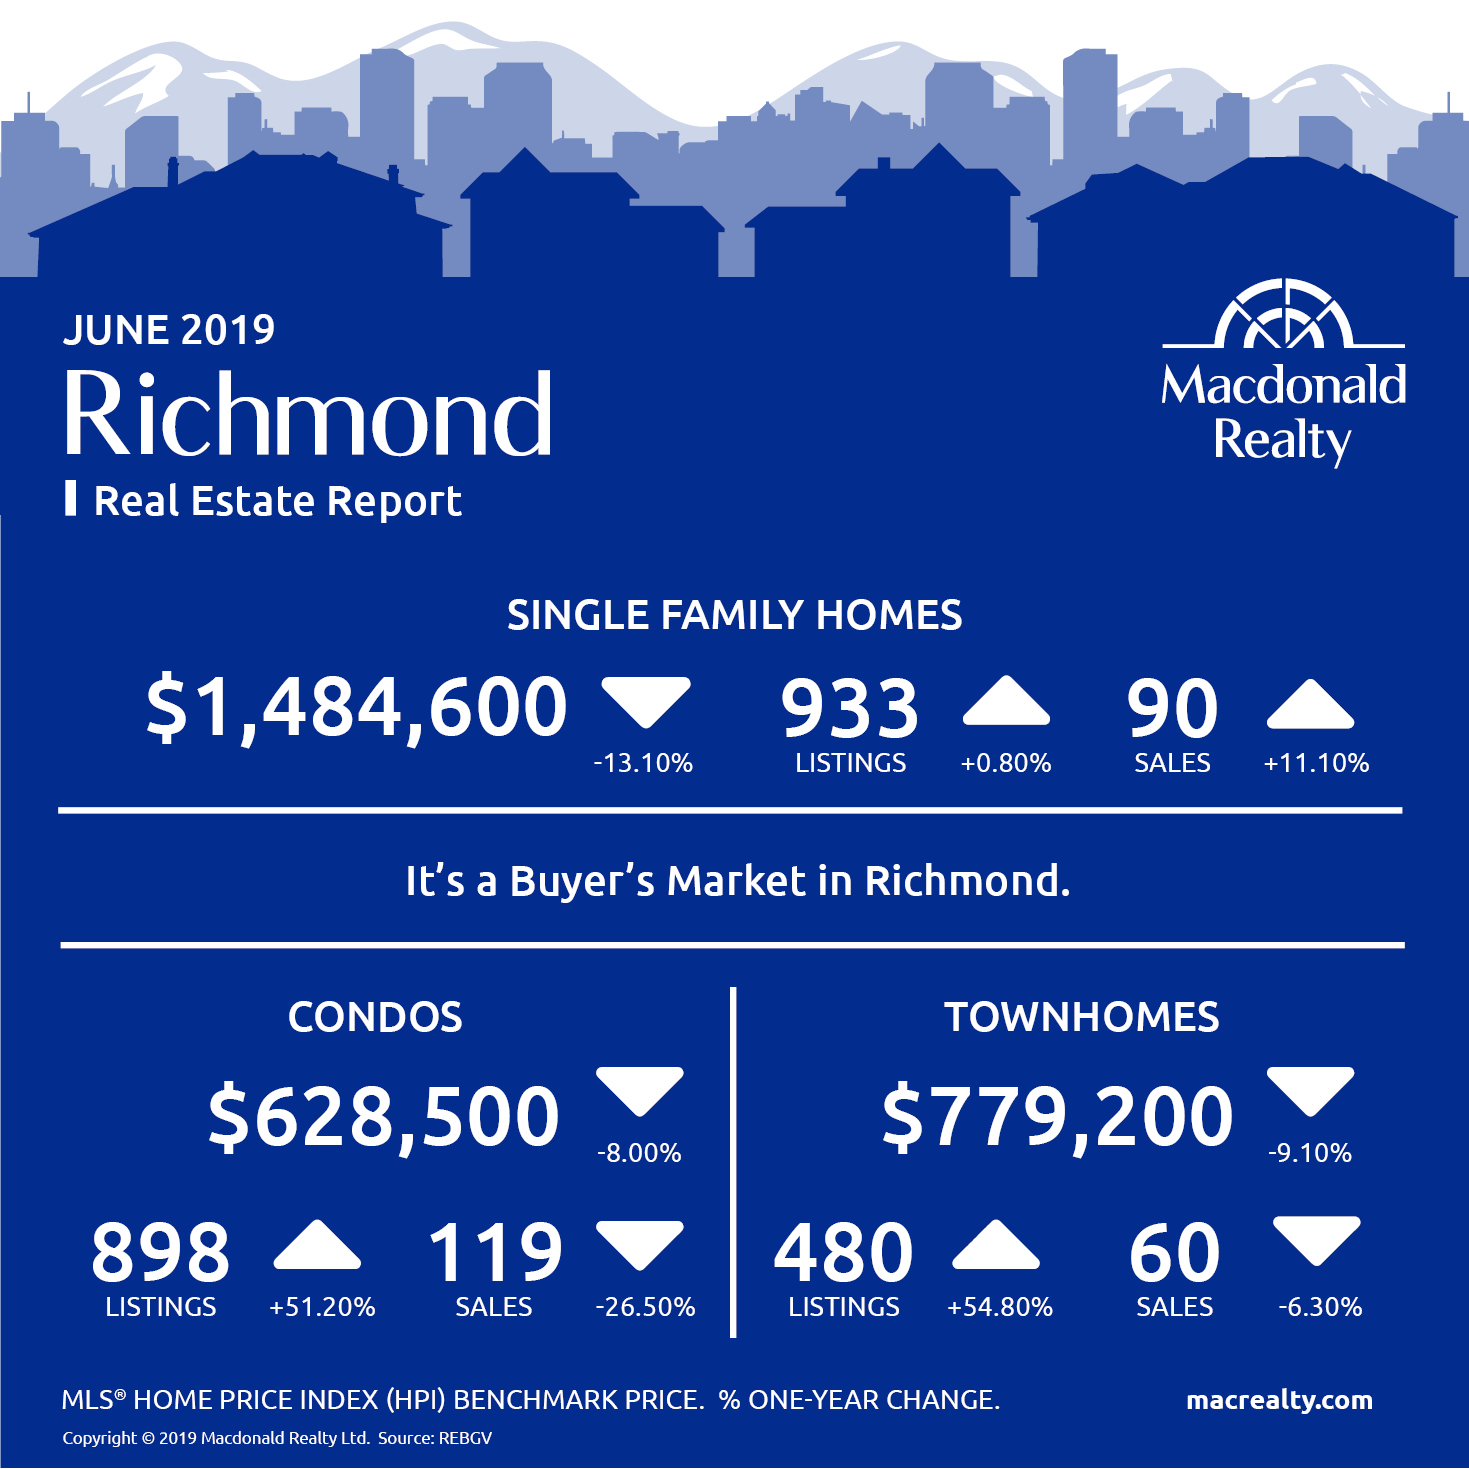
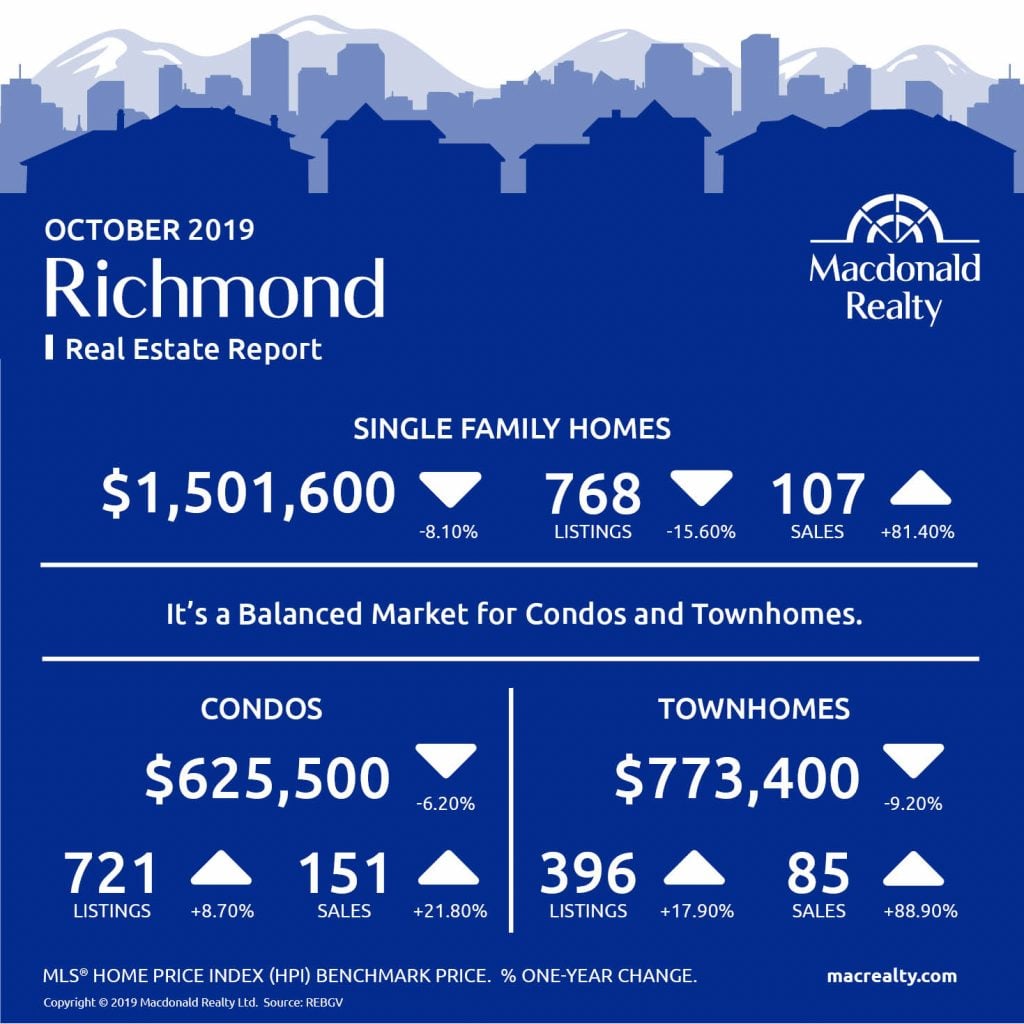
Richmond
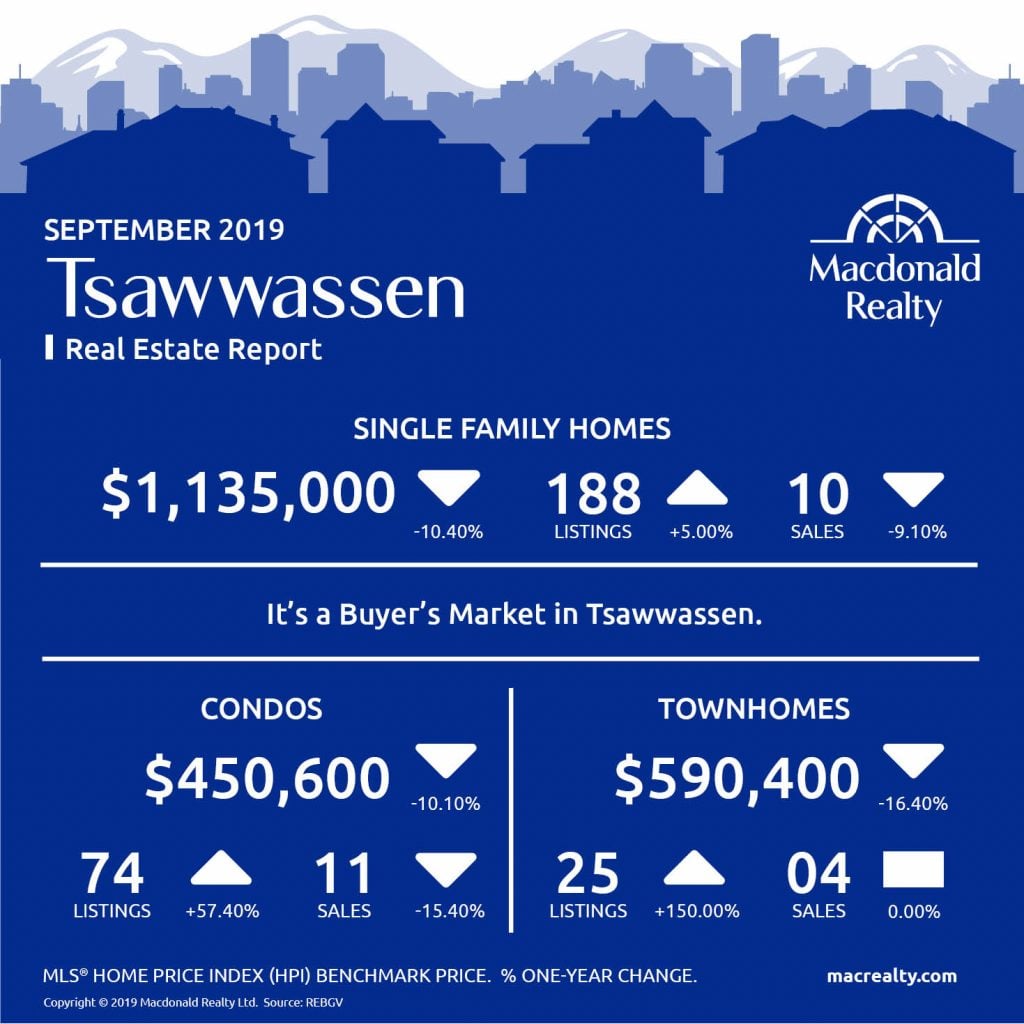
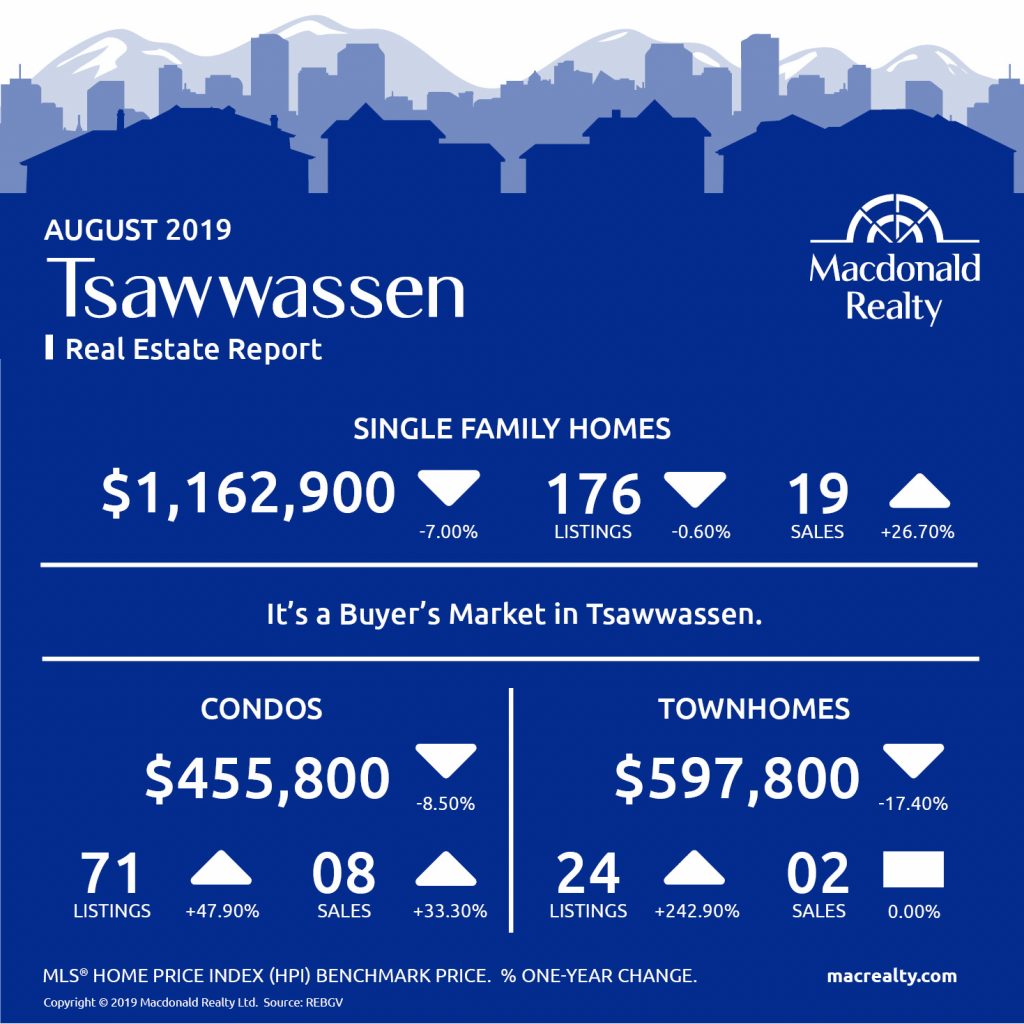
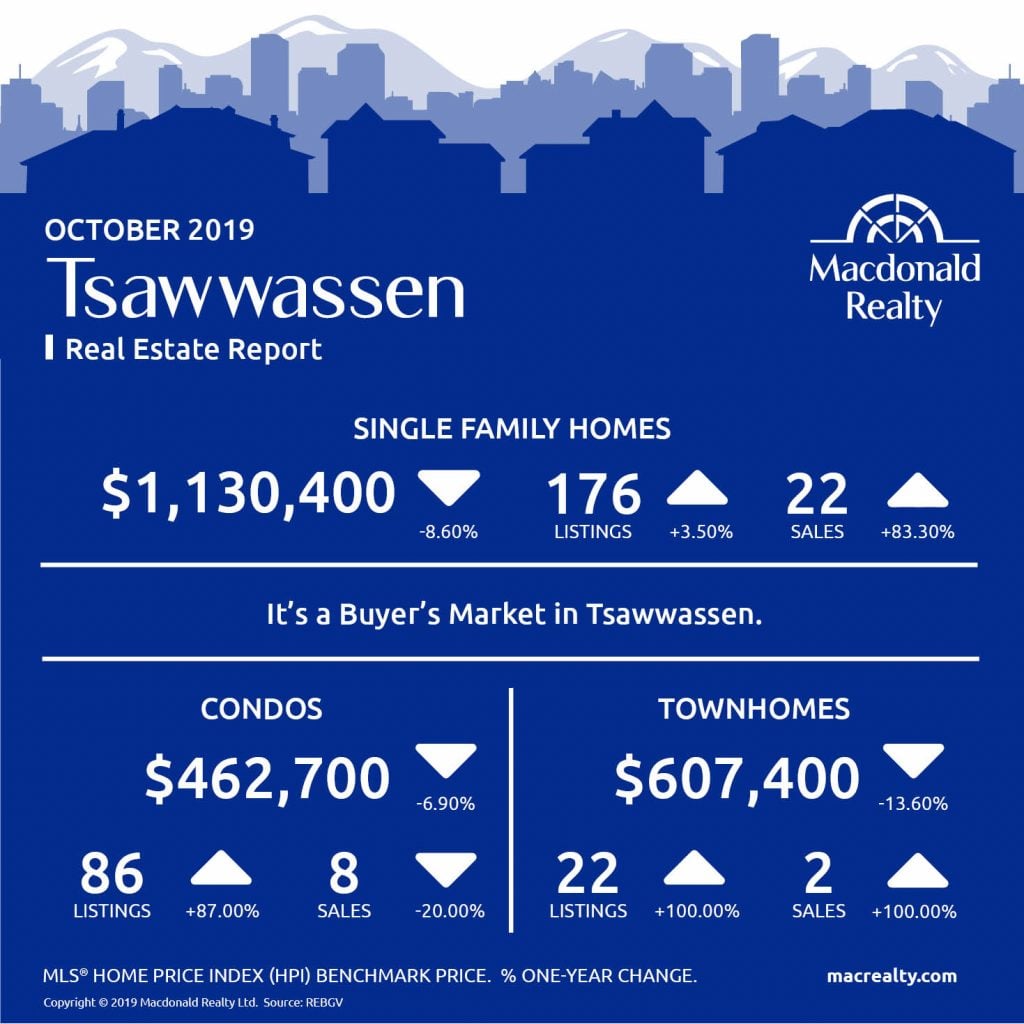
Tsawwassen
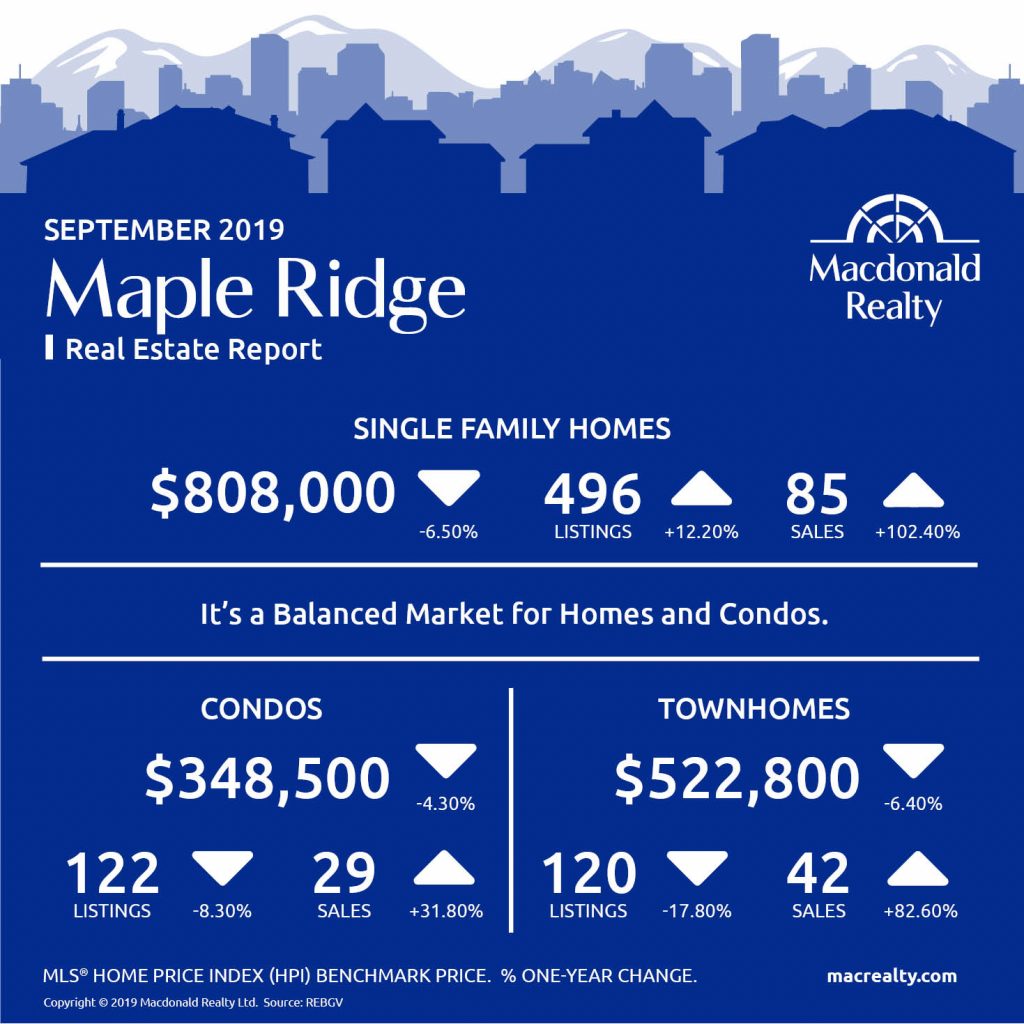
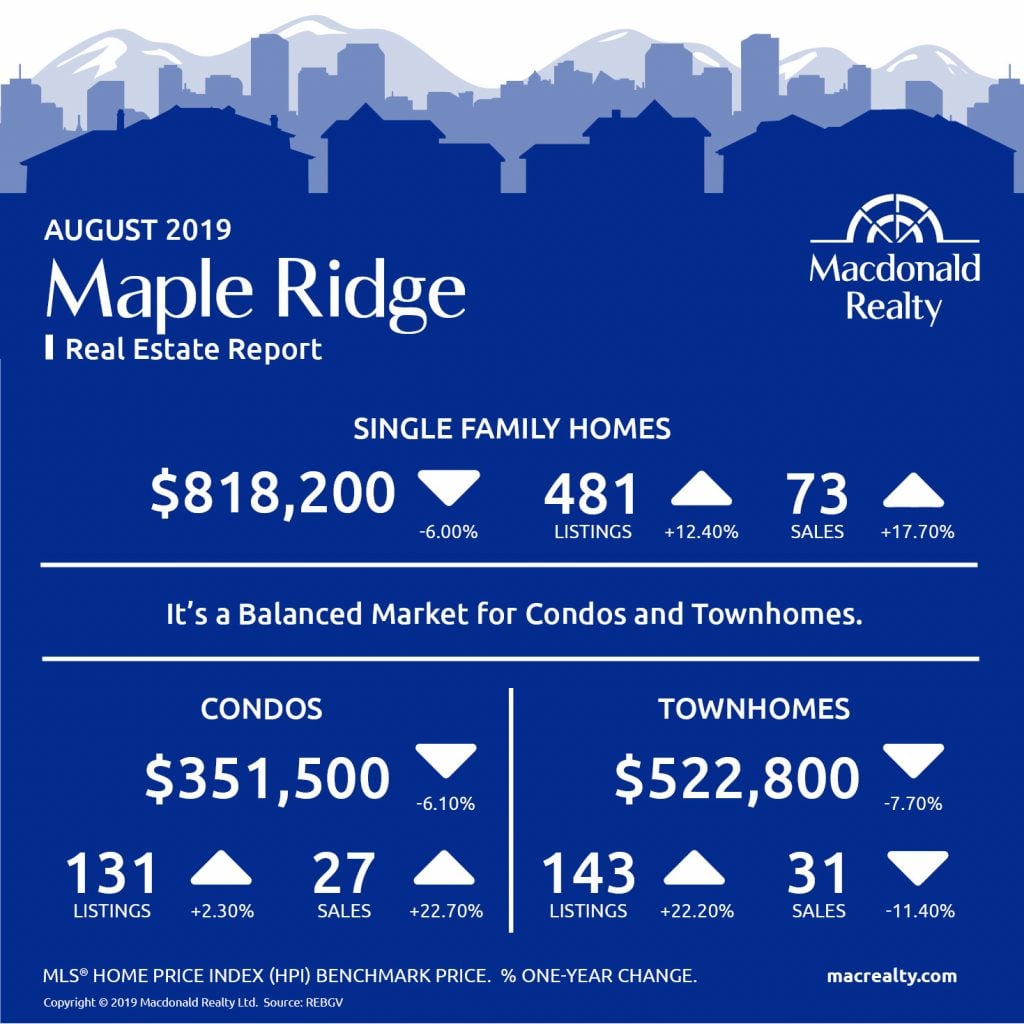
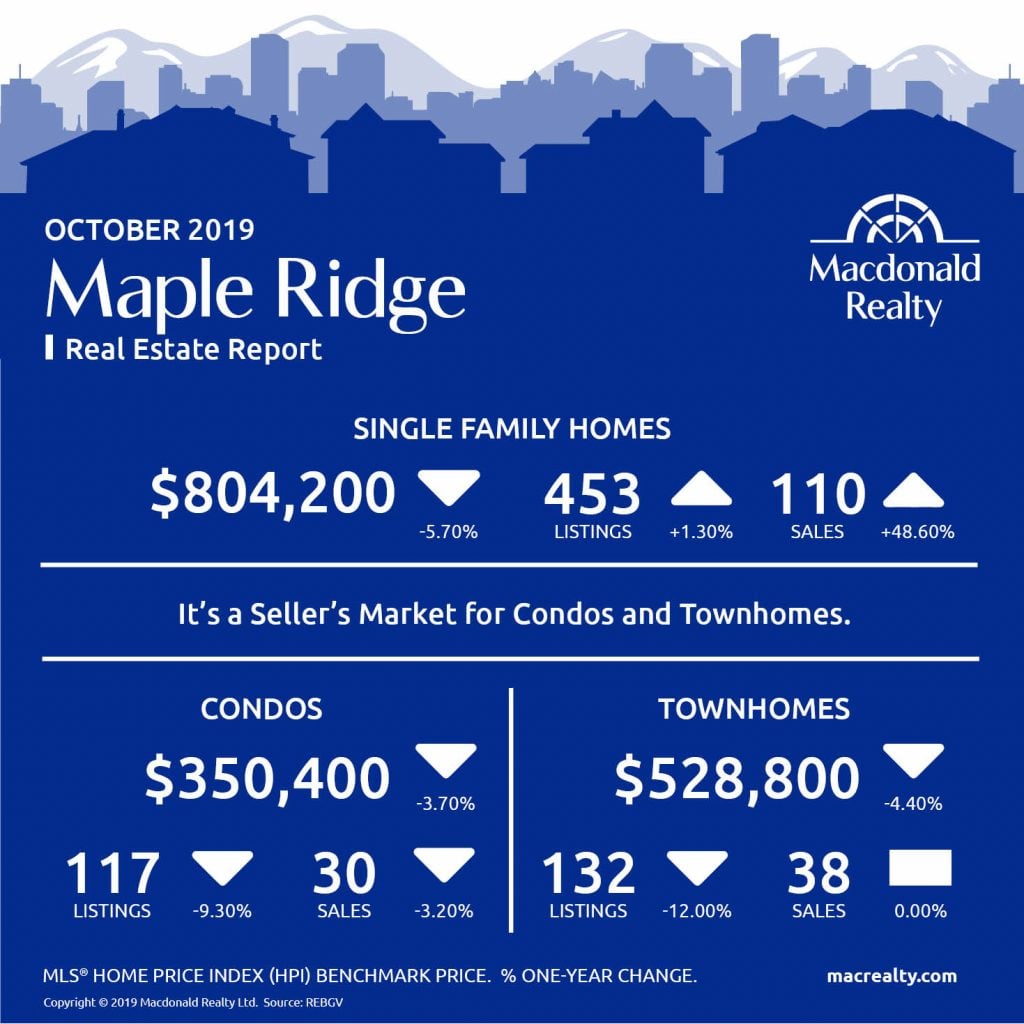
Maple Ridge
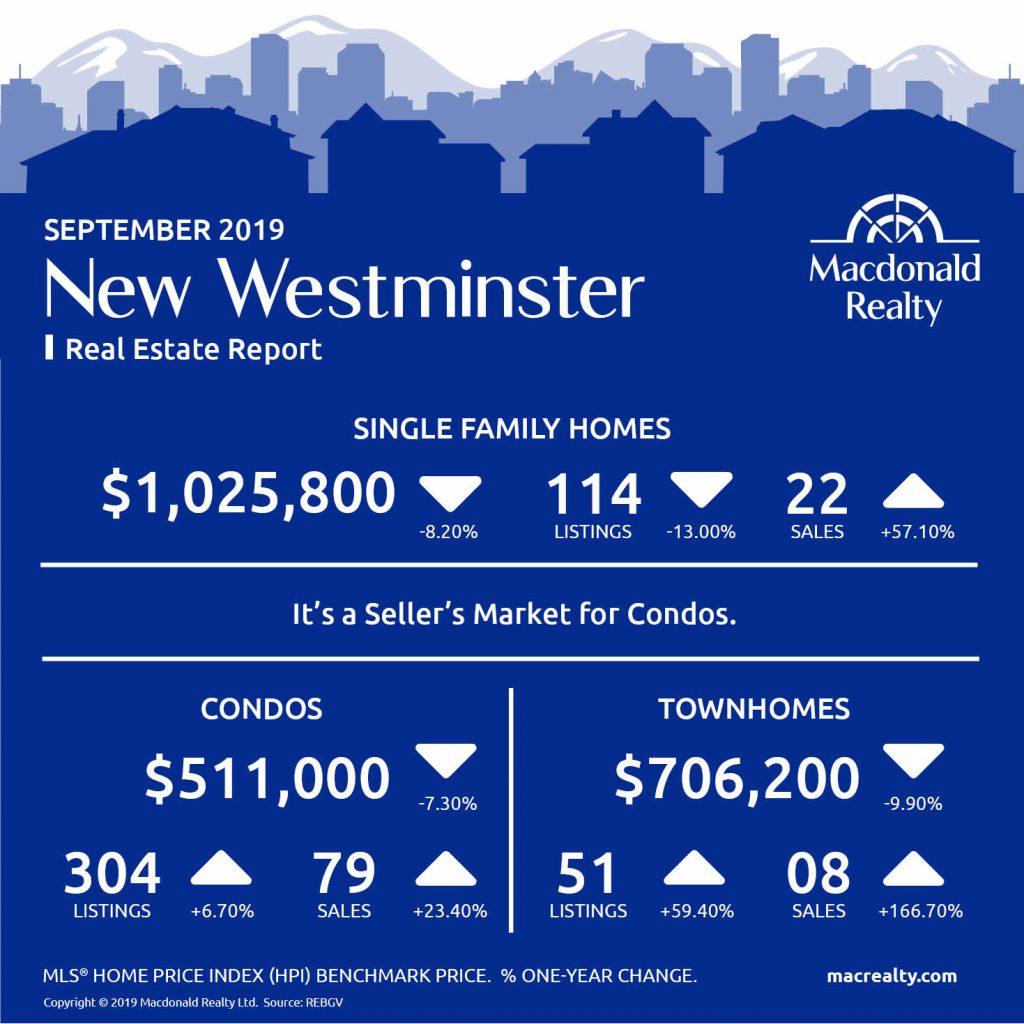
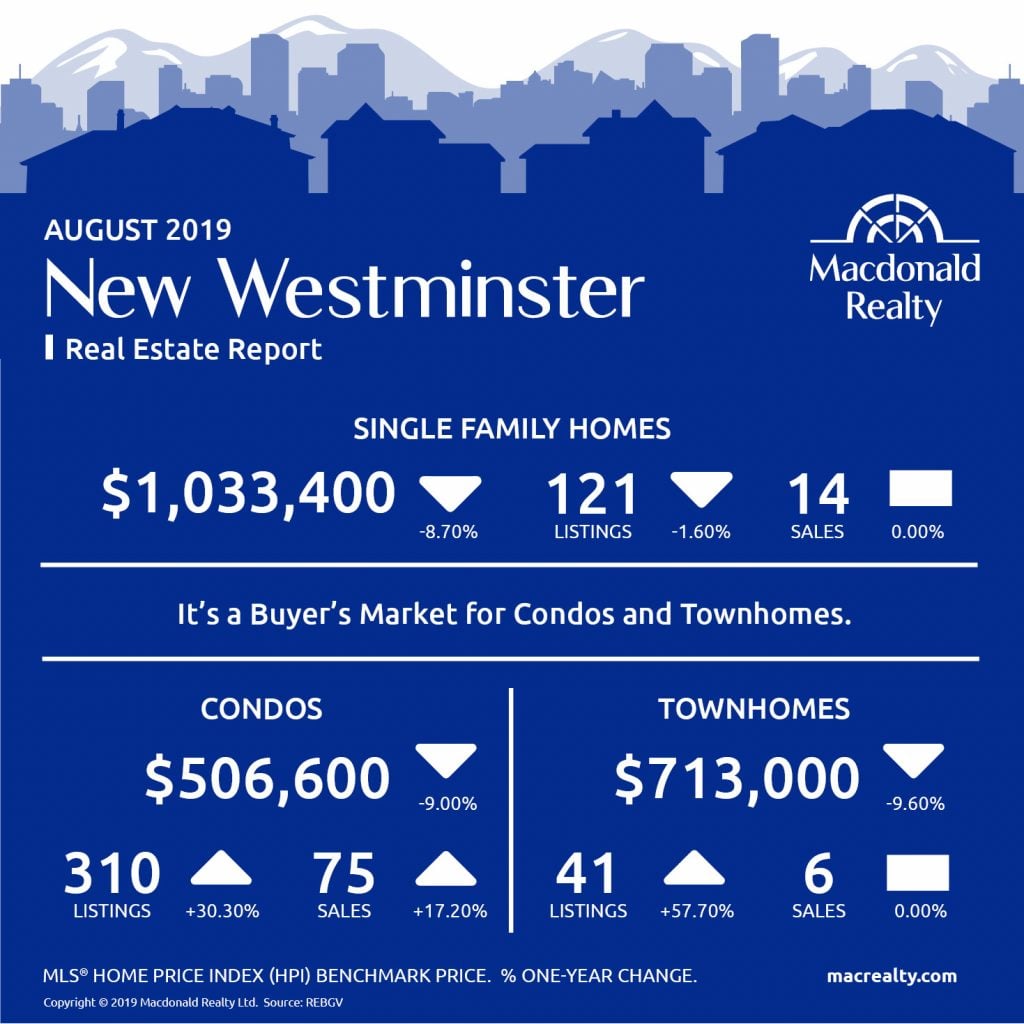
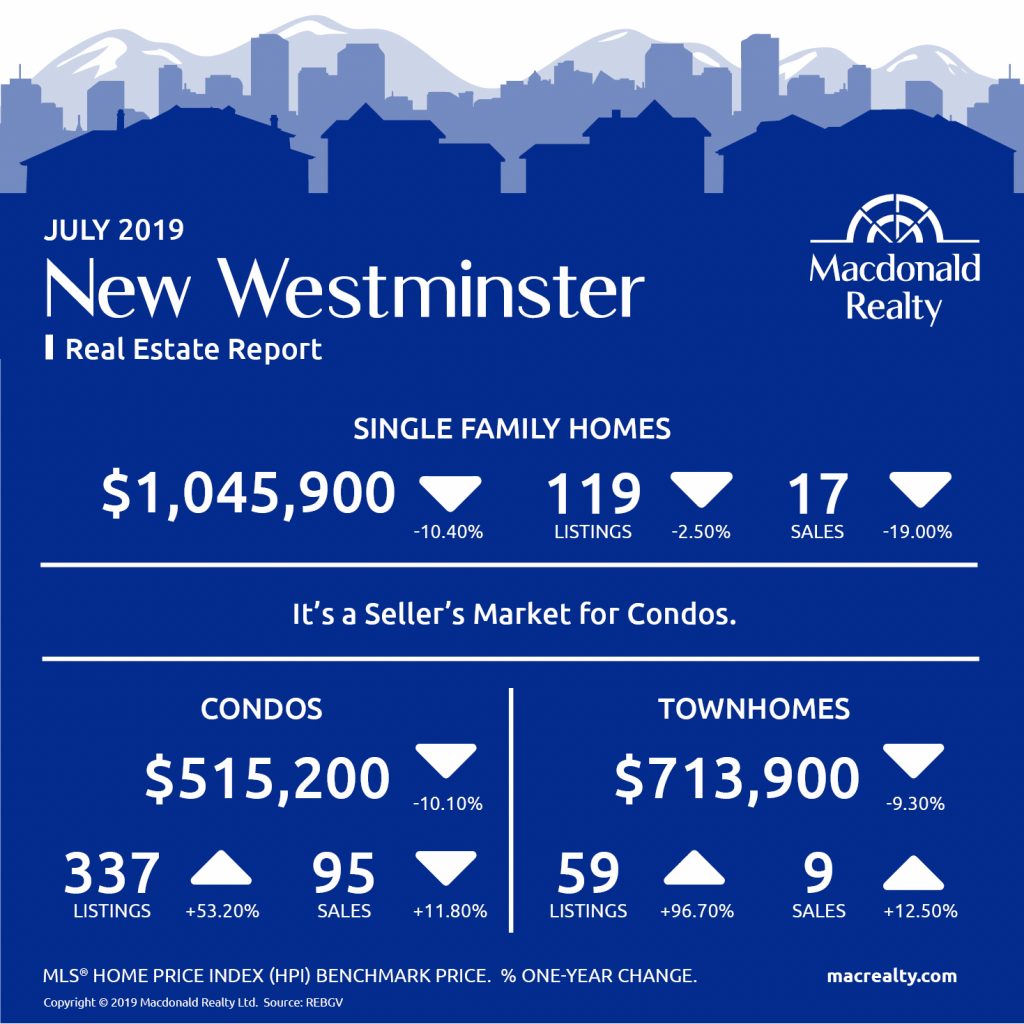
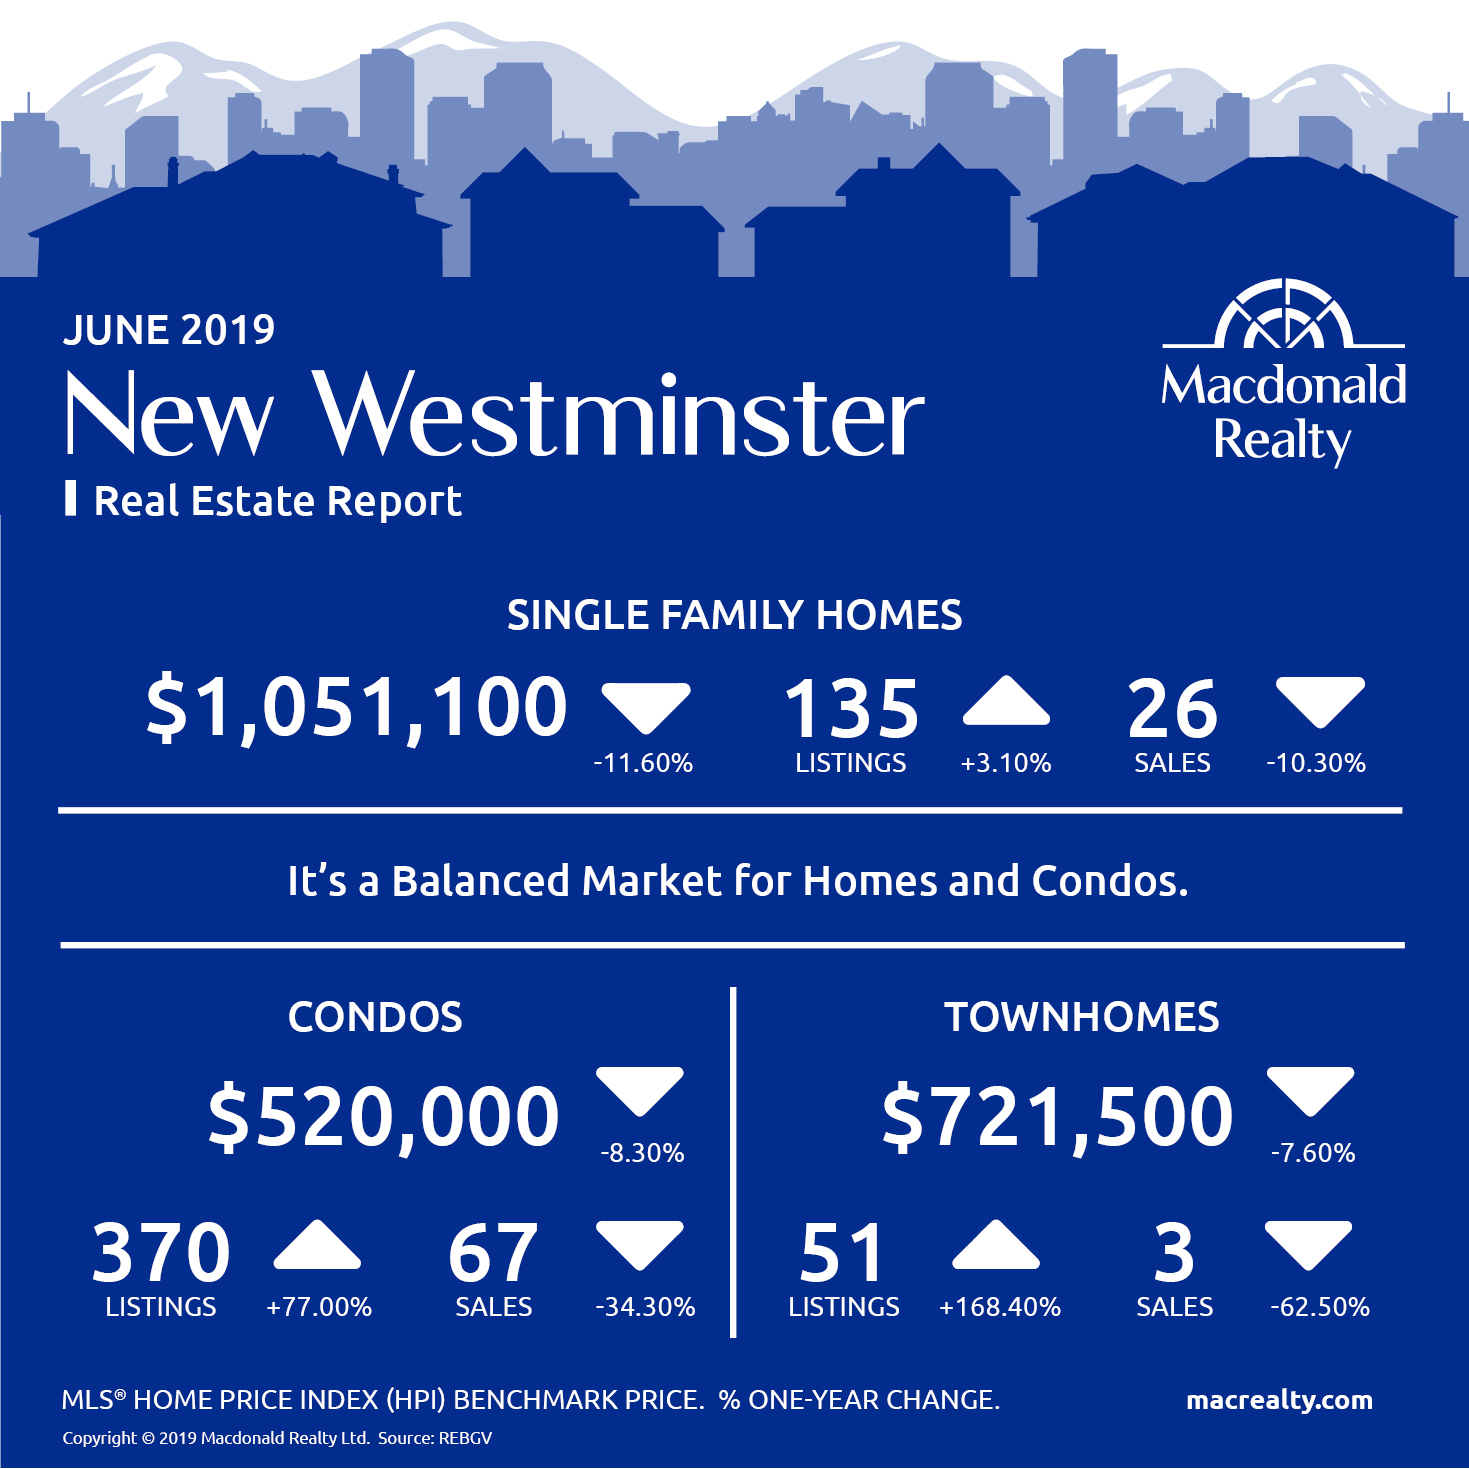
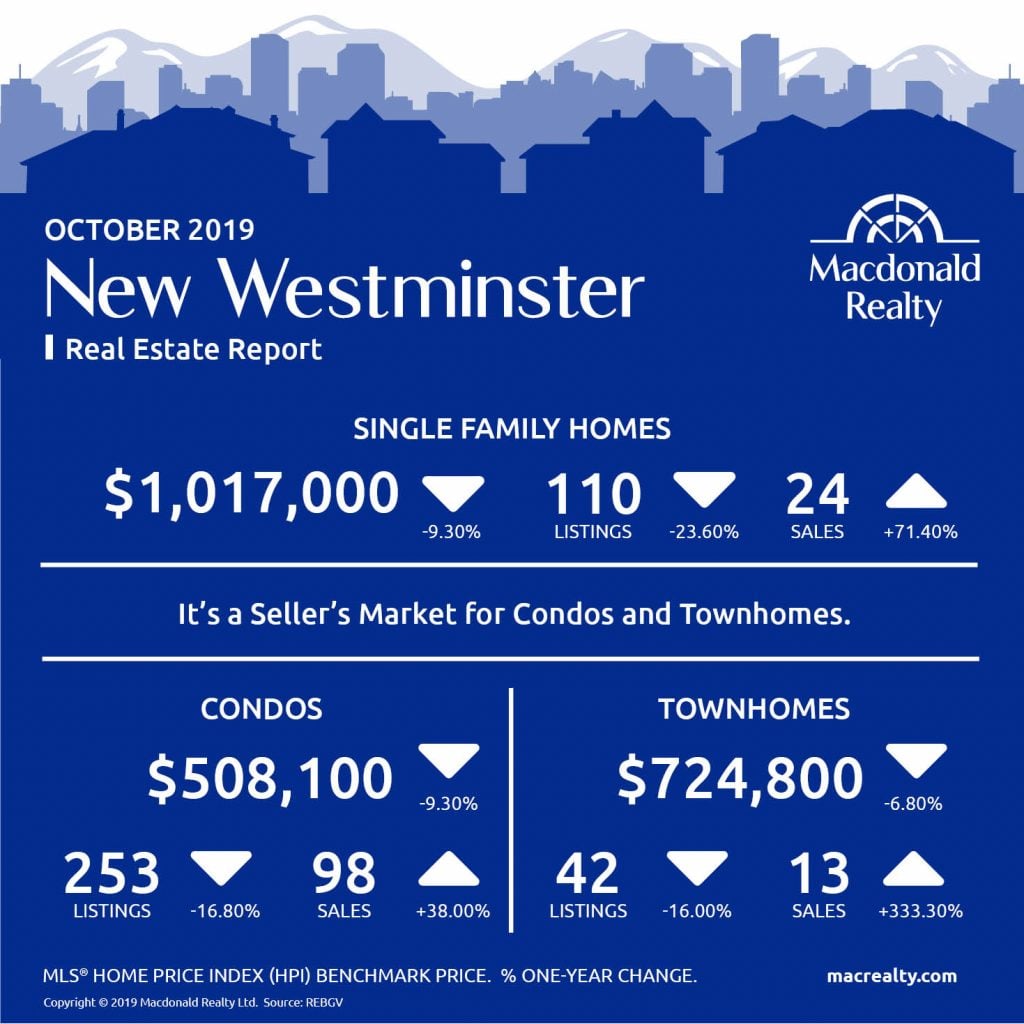
New Westminster
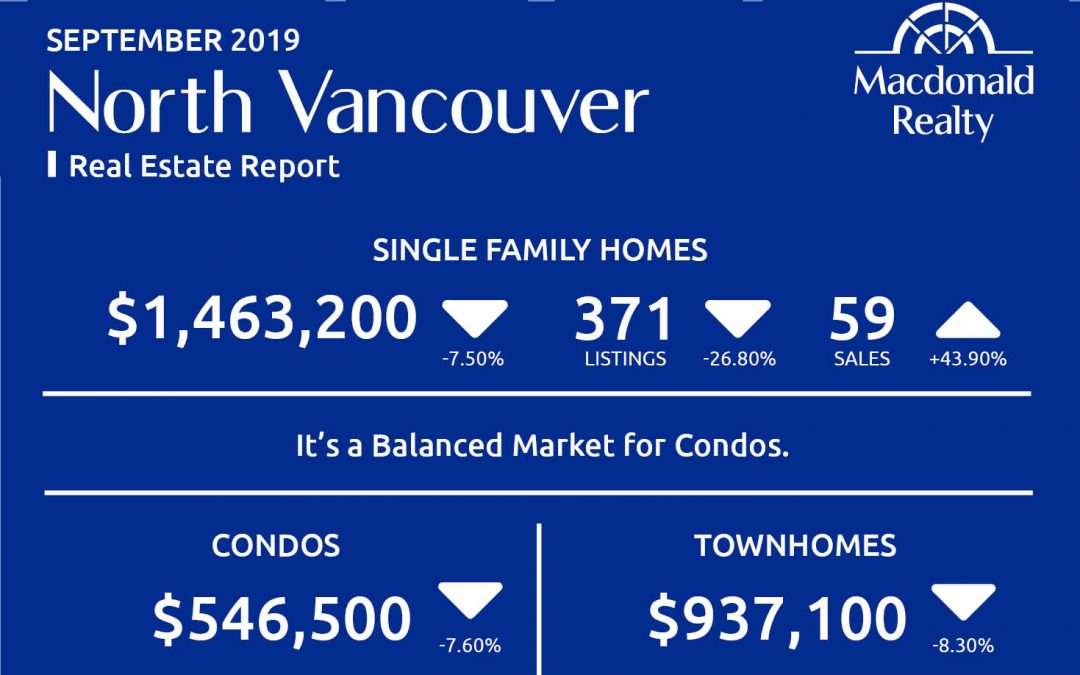
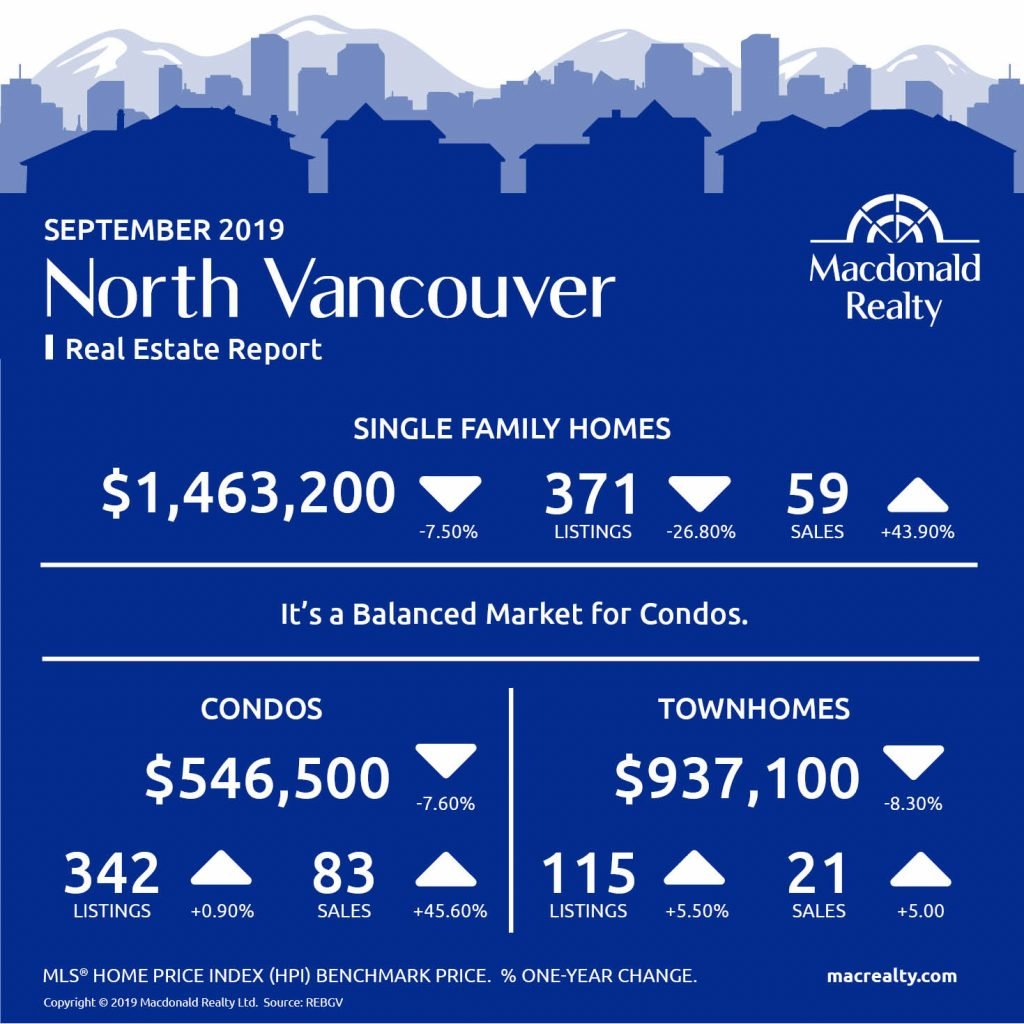
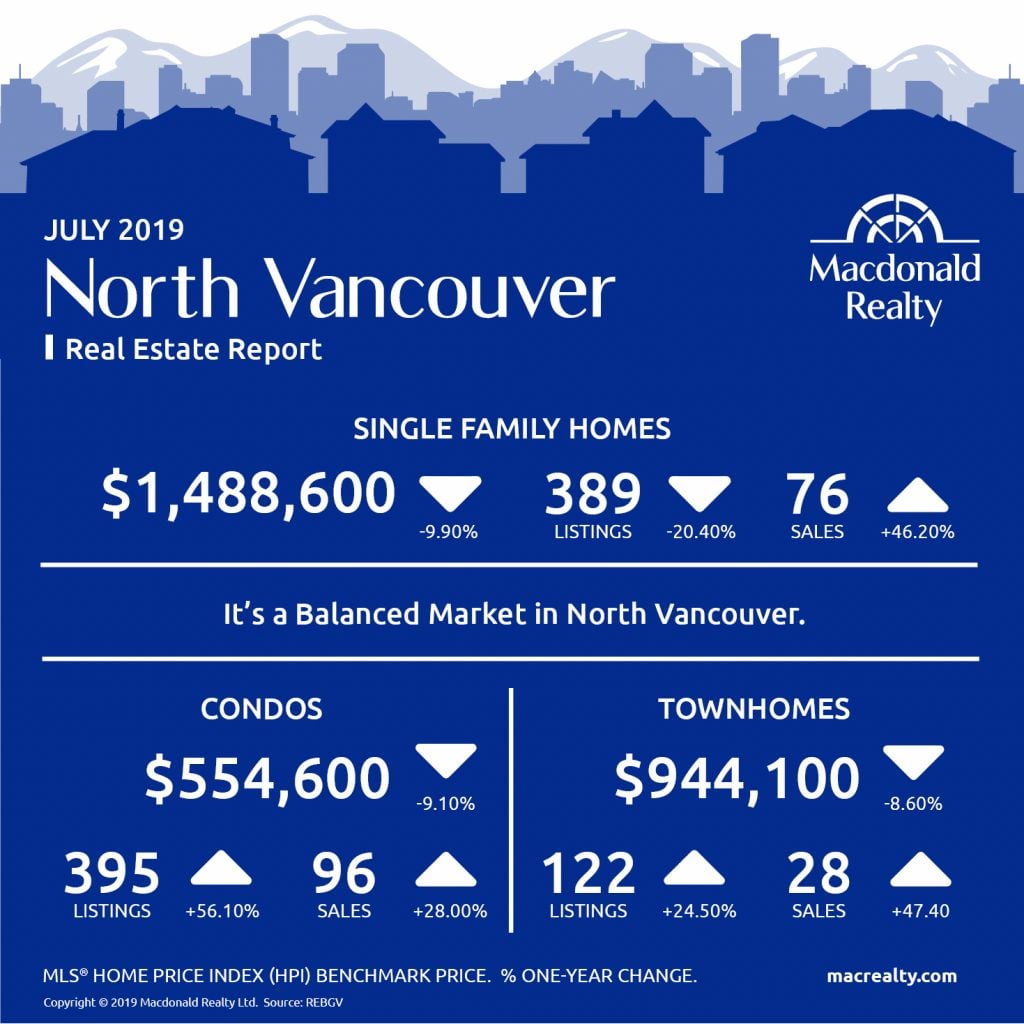
North Vancouver

Looking for more information about the real estate market in specific neighbourhoods in the Greater Vancouver?
Macdonald Realty has offices across the Greater Vancouver. Please email [email protected] or call 1-877-278-3888 to be matched with a REALTOR® working in your area.
MLS® Home Price Index (HPI) Benchmark Price
Average and median home prices are often misinterpreted, are affected by change in the mix of homes sold, and can swing dramatically from month to month (based on the types and prices of properties that sold in a given month). The MLS® HPI overcomes these shortcomings and uses the concept of a benchmark home, a notional home with common attributes of typical homes in a defined area. Visit www.housepriceindex.ca for more information.
This blog post is based on market data provided by the Real Estate Board of Greater Vancouver (REBGV) www.rebgv.org