by Macrealty Marketing Team | Nov 7, 2022 | Market Updates
Here are the latest real estate market statistics from Macdonald Realty on the Greater Vancouver listings and sales in October 2022. Find all the infographics by visiting the Facebook Album.
Inflation, rising interest rates create caution across Metro Vancouver’s housing market.
Home sale activity across the Metro Vancouver housing market continued to trend well below historical averages in October.
The Real Estate Board of Greater Vancouver (REBGV) reports that residential home sales in the region totalled 1,903 in October 2022, a 45.5 per cent decrease from the 3,494 sales recorded in October 2021, and a 12.8 per cent increase from the 1,687 homes sold in September 2022.
Last month’s sales were 33.3 per cent below the 10-year October sales average.
“Inflation and rising interest rates continue to dominate headlines, leading many buyers and sellers to assess how these factors impact their housing options,” Andrew Lis, REBGV’s director, economics and data analytics said. “With sales remaining near historic lows, the number of active listings continues to inch upward, causing home prices to recede from the record highs set in the spring of 2022.”
There were 4,033 detached, attached and apartment properties newly listed for sale on the Multiple Listing Service® (MLS®) in Metro Vancouver in October 2022. This represents a 0.4 per cent decrease compared to the 4,049 homes listed in October 2021 and a 4.6 per cent decrease compared to September 2022 when 4,229 homes were listed.
*Areas covered by the Real Estate Board of Greater Vancouver include Burnaby, Coquitlam, Maple Ridge, New Westminster, North Vancouver, Pitt Meadows, Port Coquitlam, Port Moody, Richmond, South Delta, Squamish, Sunshine Coast, Vancouver, West Vancouver, and Whistler. Check out the infographics of Squamish, Sunshine Coast and Whistler, HERE.
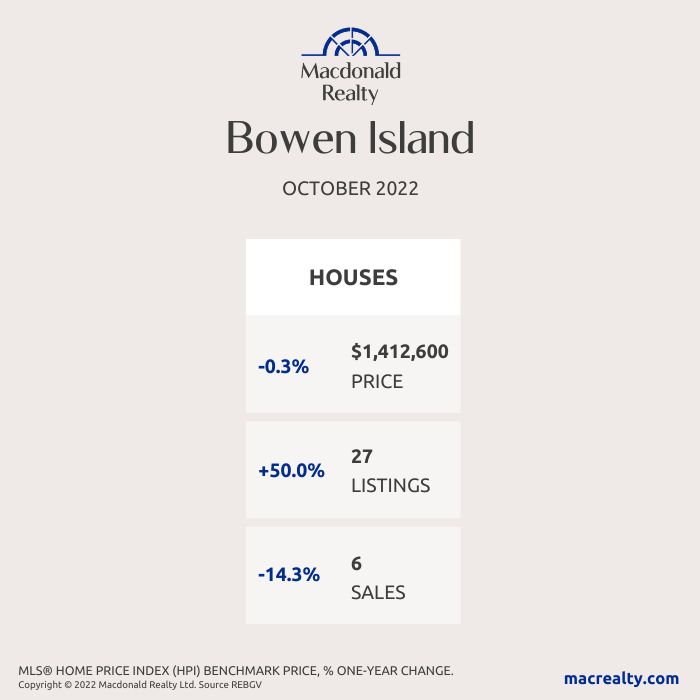
Bowen Island
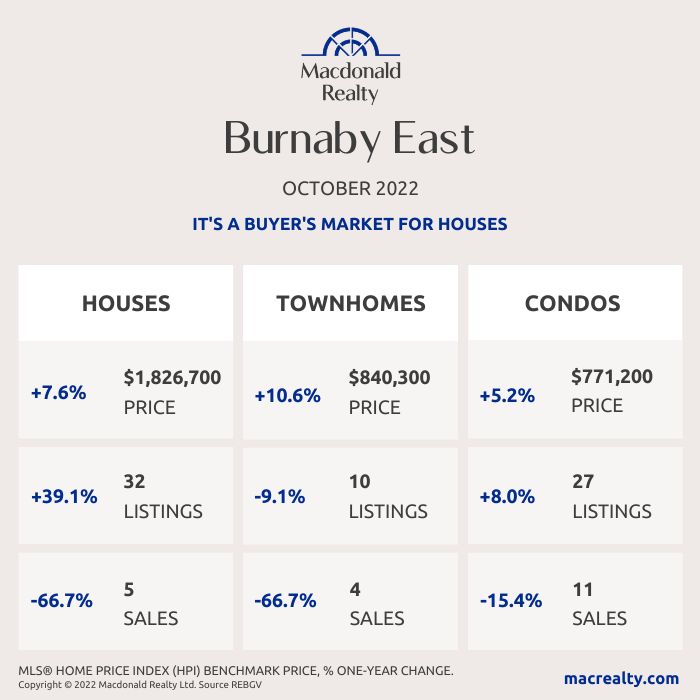
Burnaby East
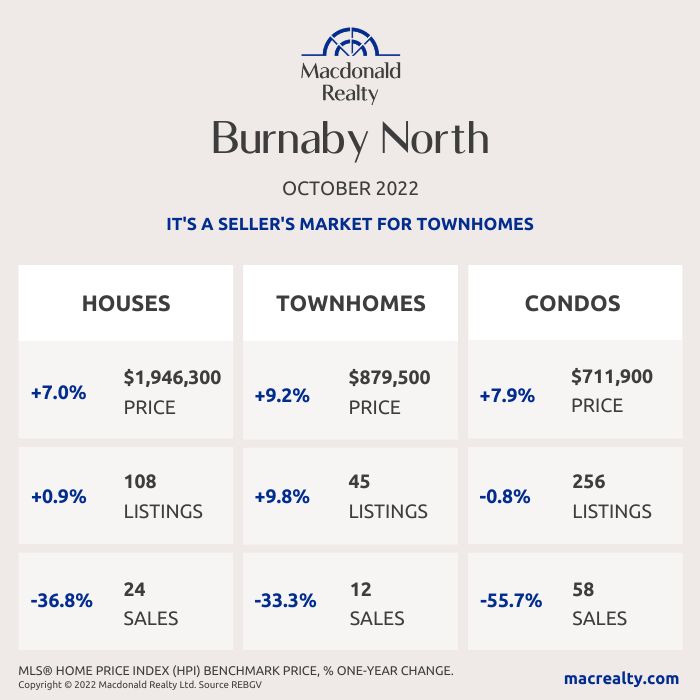
Burnaby North
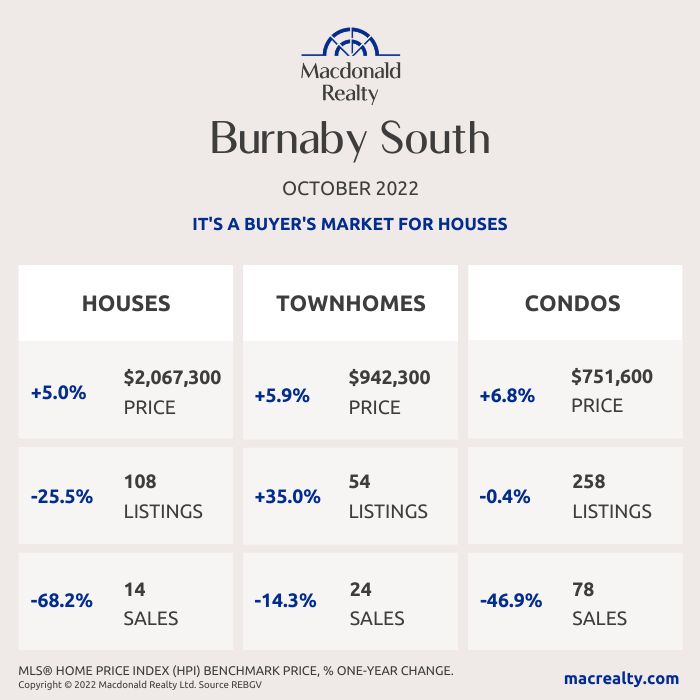
Burnaby South
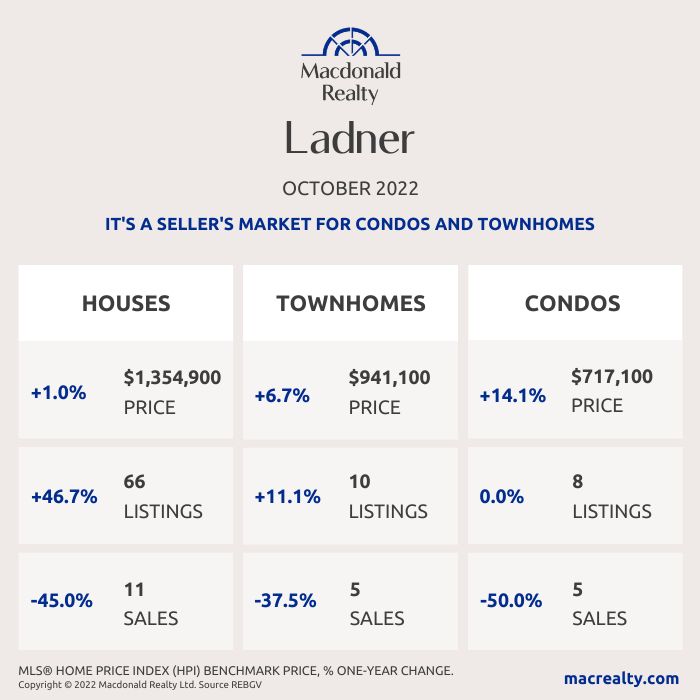
Ladner
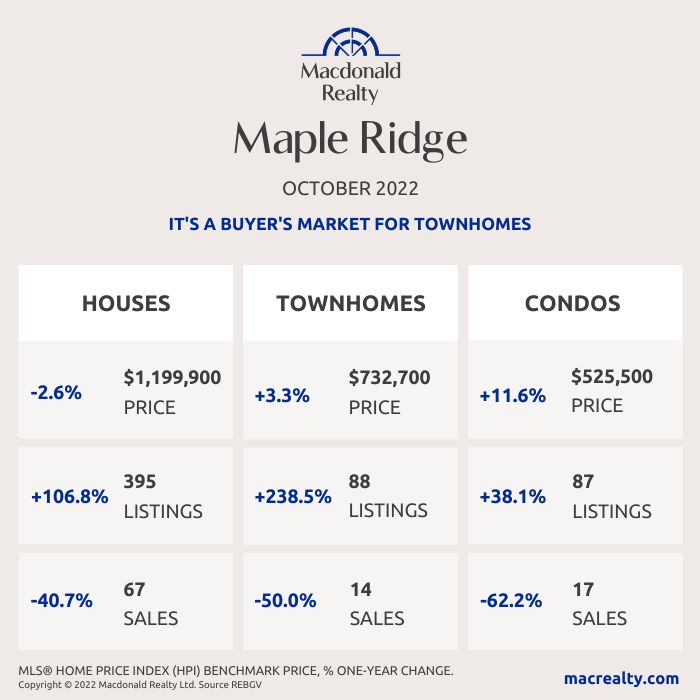
Maple Ridge
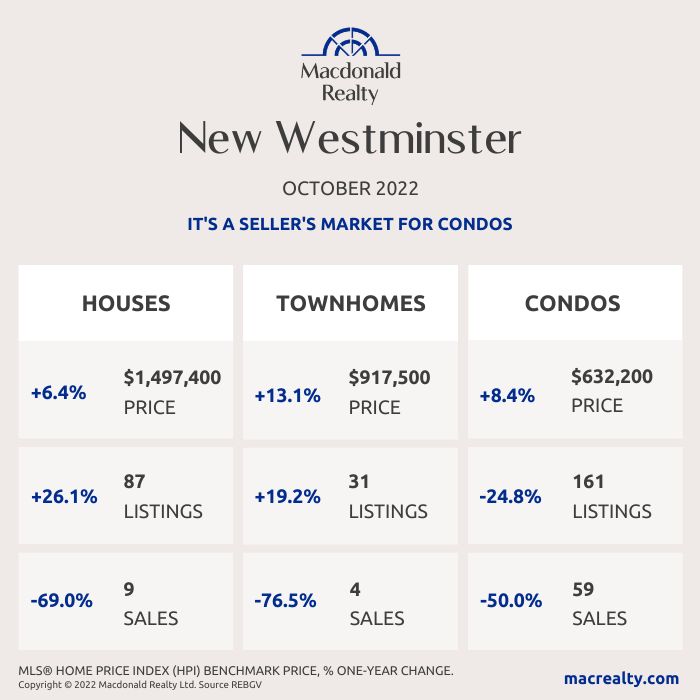
New Westminster
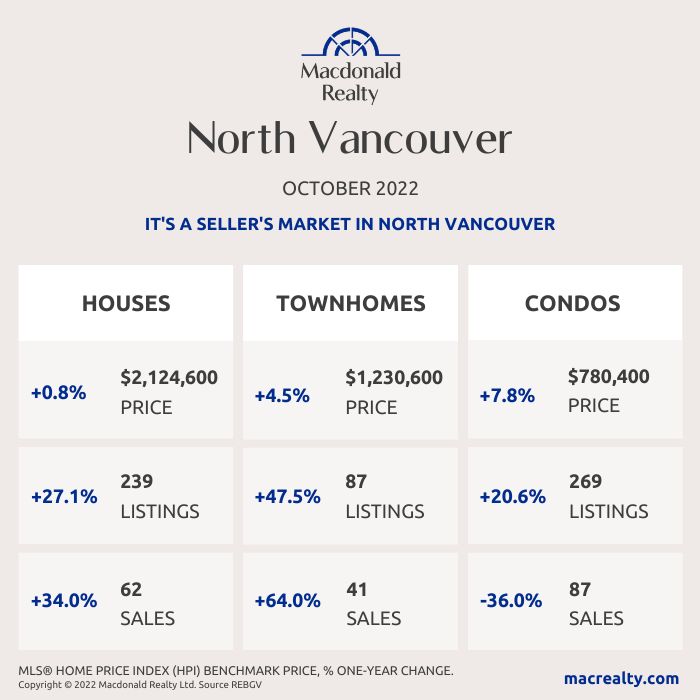
North Vancouver
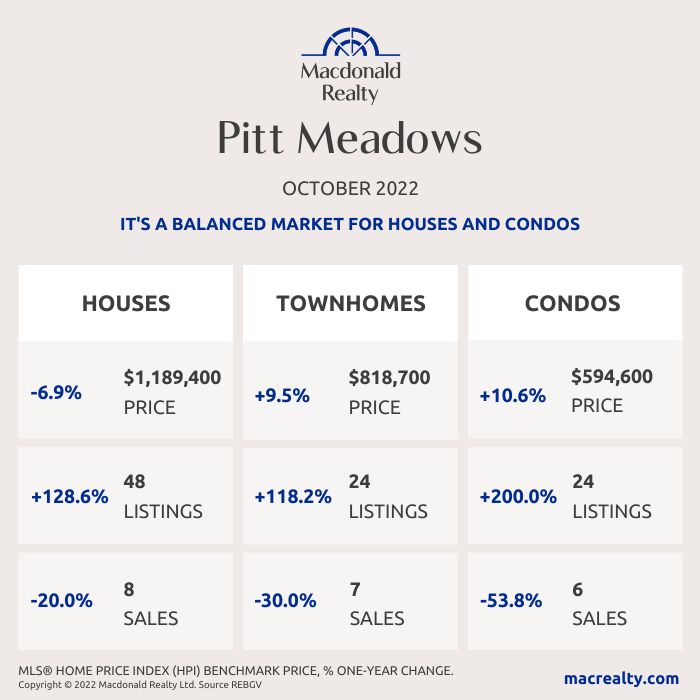
Pitt Meadows
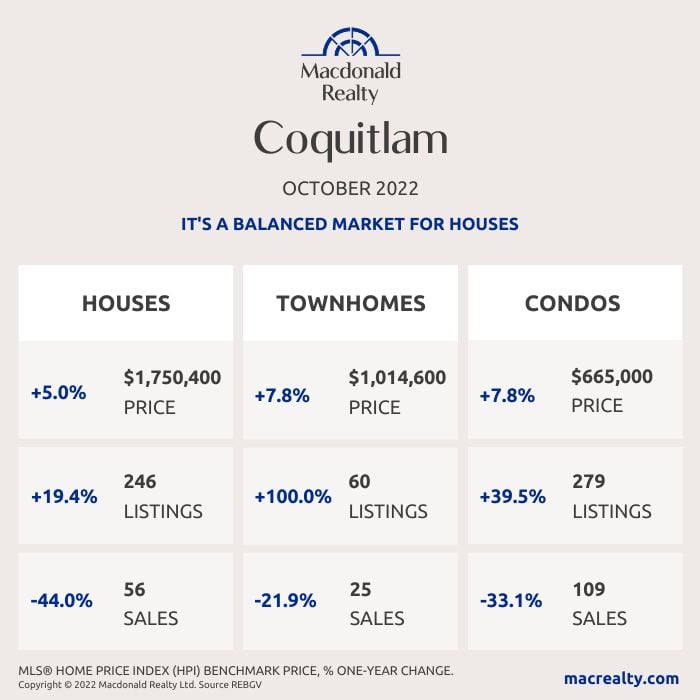
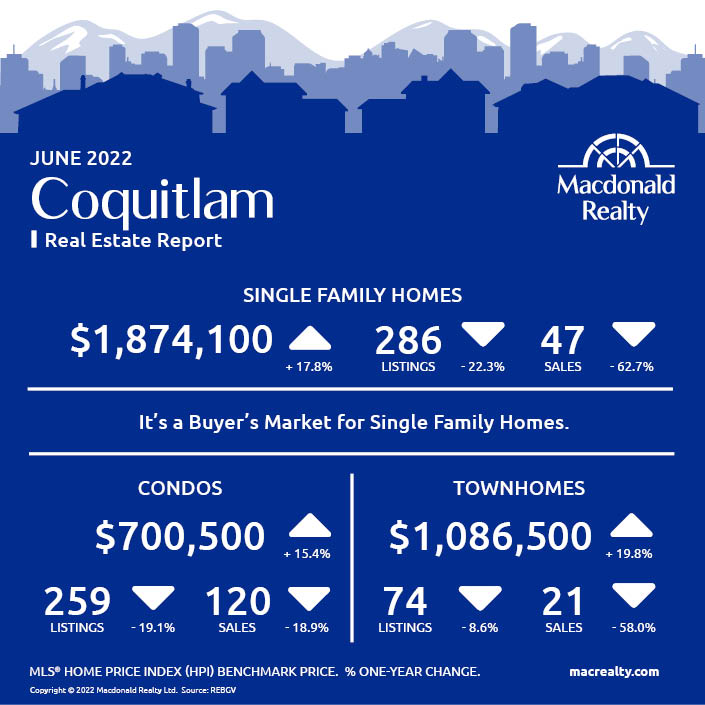
Coquitlam
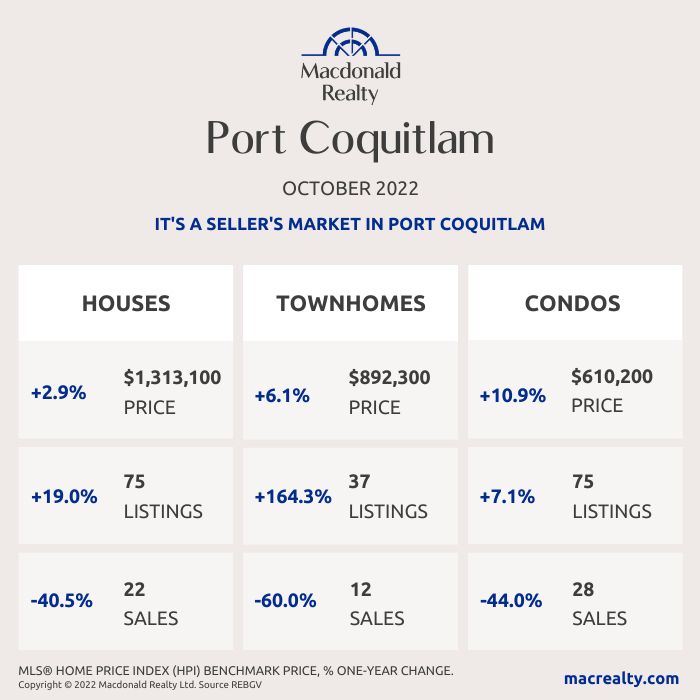
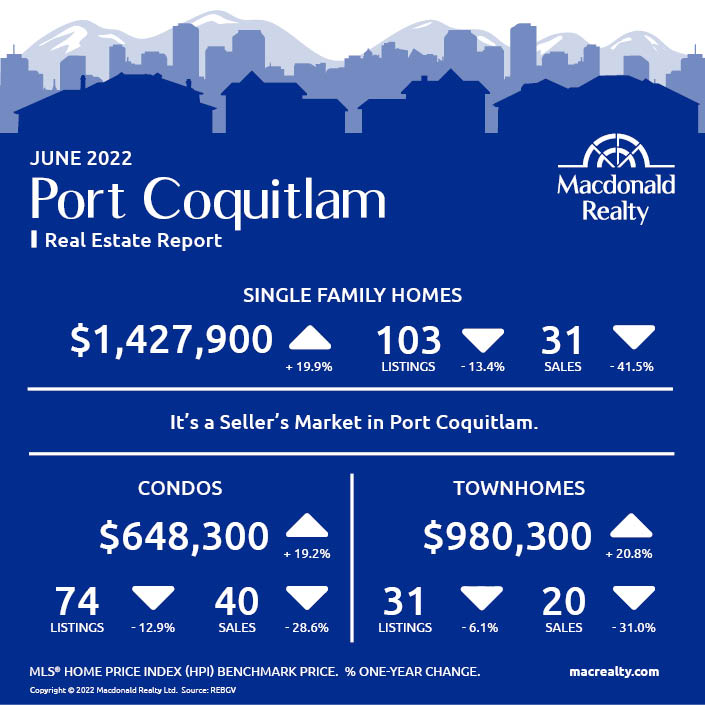
Port Coquitlam
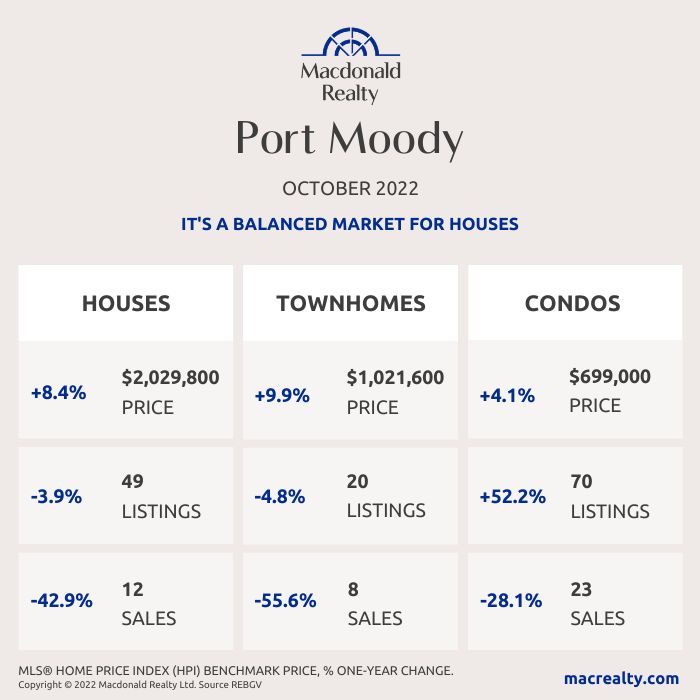
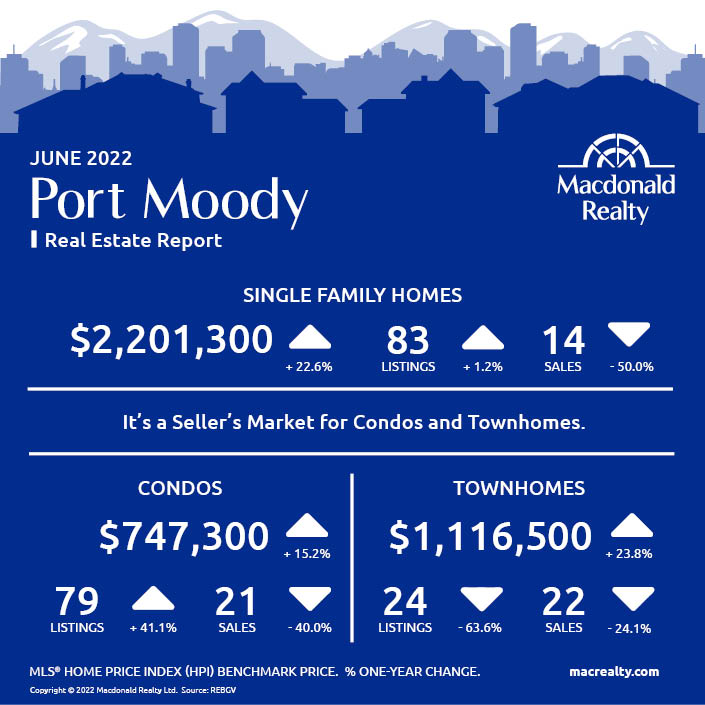
Port Moody
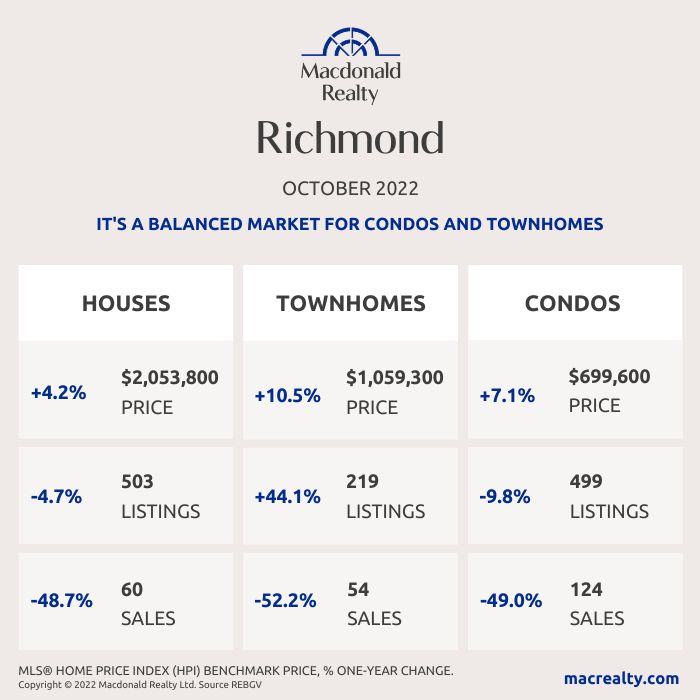
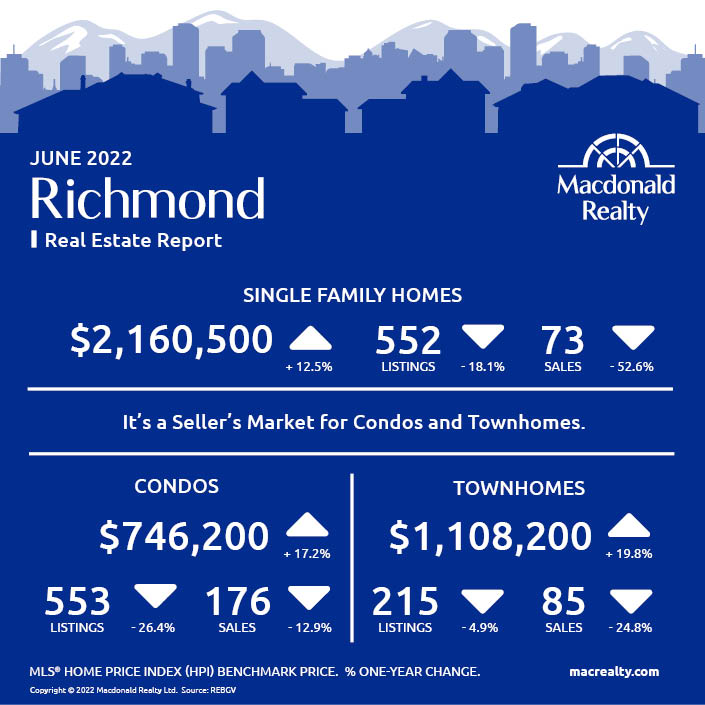
Richmond
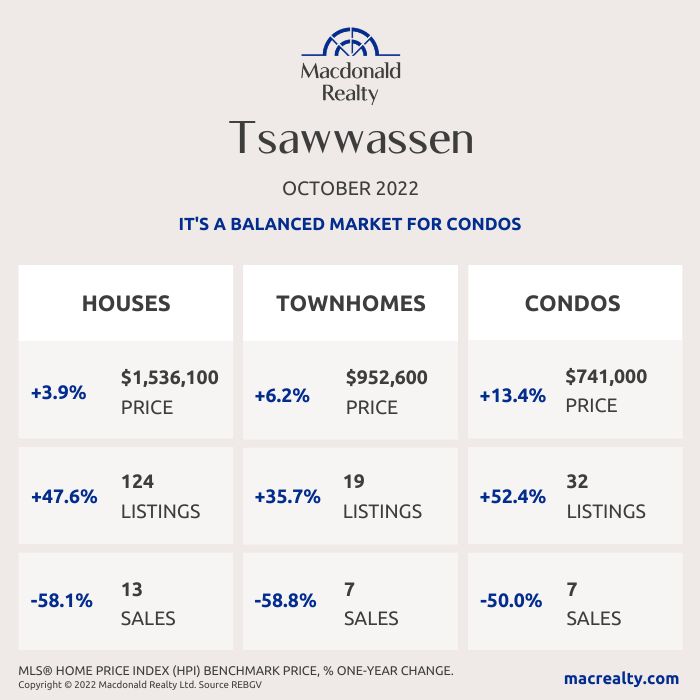
Tsawwassen
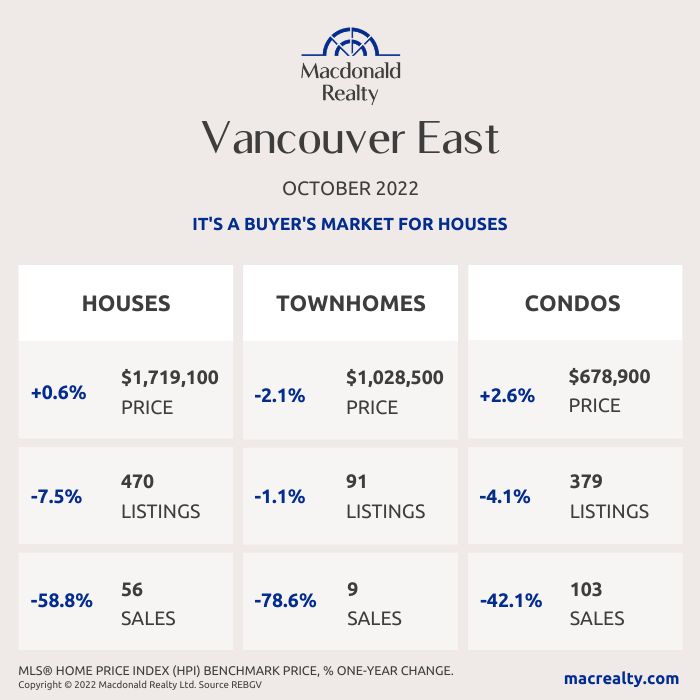
Vancouver East
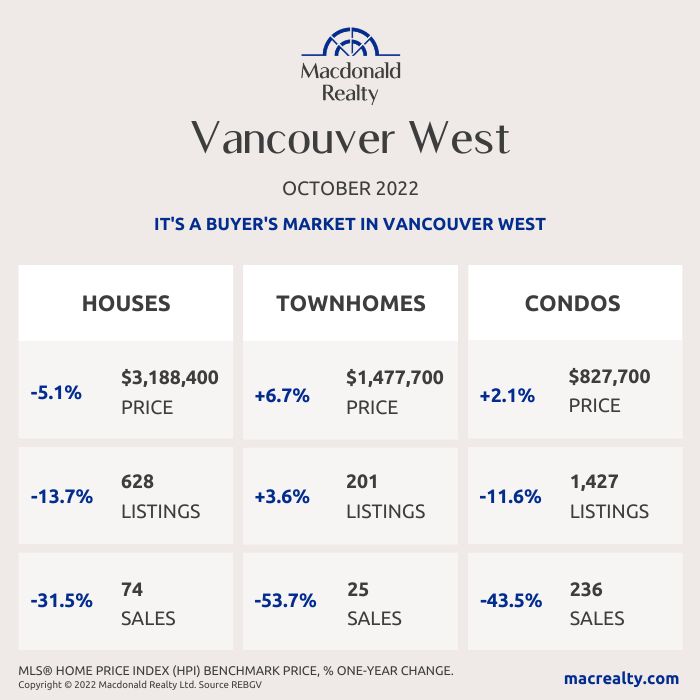
Vancouver West
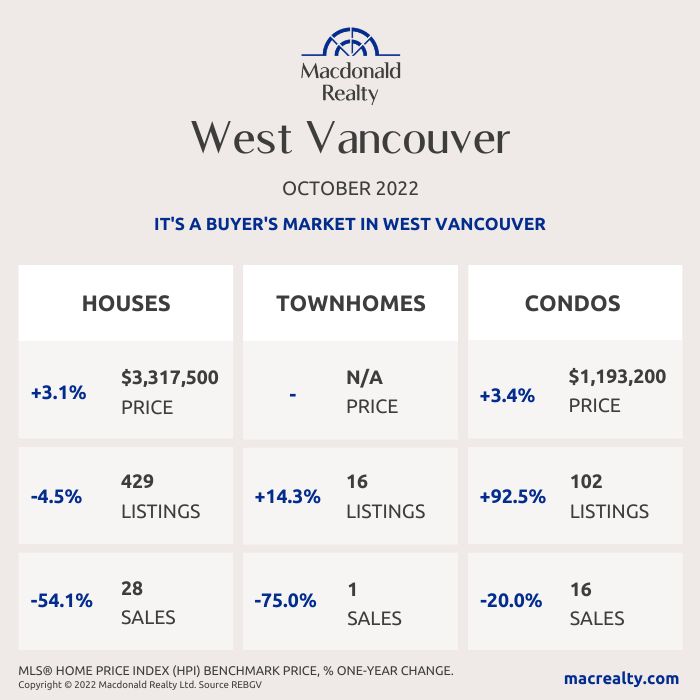
West Vancouver
Looking for more information about the real estate market in specific neighbourhoods in the Greater Vancouver?
Macdonald Realty has offices across the Greater Vancouver. Please email [email protected] or call 1-877-278-3888 to be matched with a REALTOR® working in your area.
MLS® Home Price Index (HPI) Benchmark Price
Average and median home prices are often misinterpreted, are affected by change in the mix of homes sold, and can swing dramatically from month to month (based on the types and prices of properties that sold in a given month). The MLS® HPI overcomes these shortcomings and uses the concept of a benchmark home, a notional home with common attributes of typical homes in a defined area. Visit www.housepriceindex.ca for more information.
This blog post is based on market data provided by the Real Estate Board of Greater Vancouver (REBGV) www.rebgv.org
by Macrealty Marketing Team | Oct 7, 2022 | Market Updates
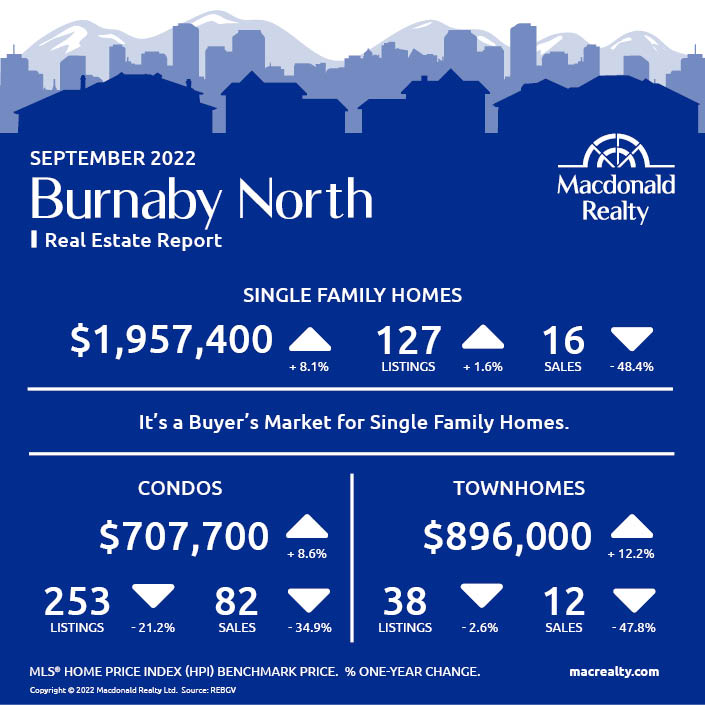
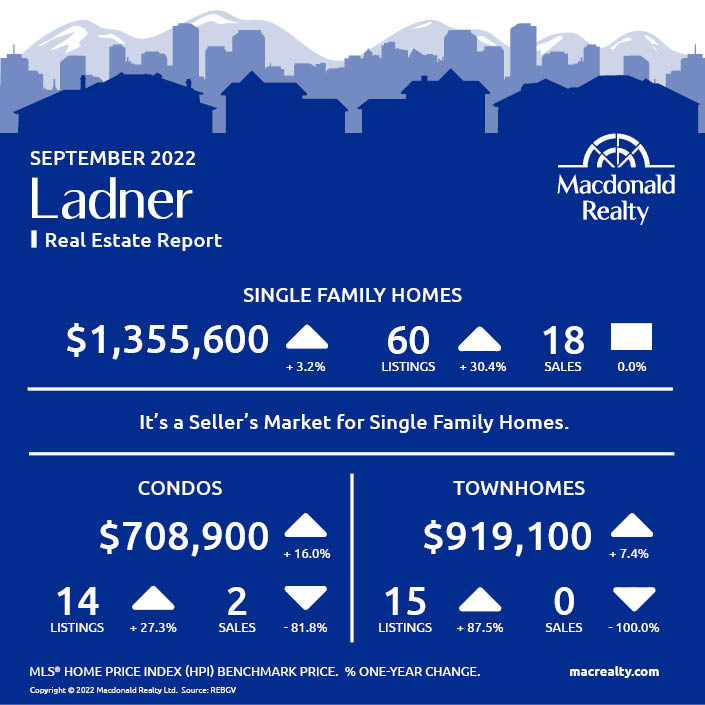
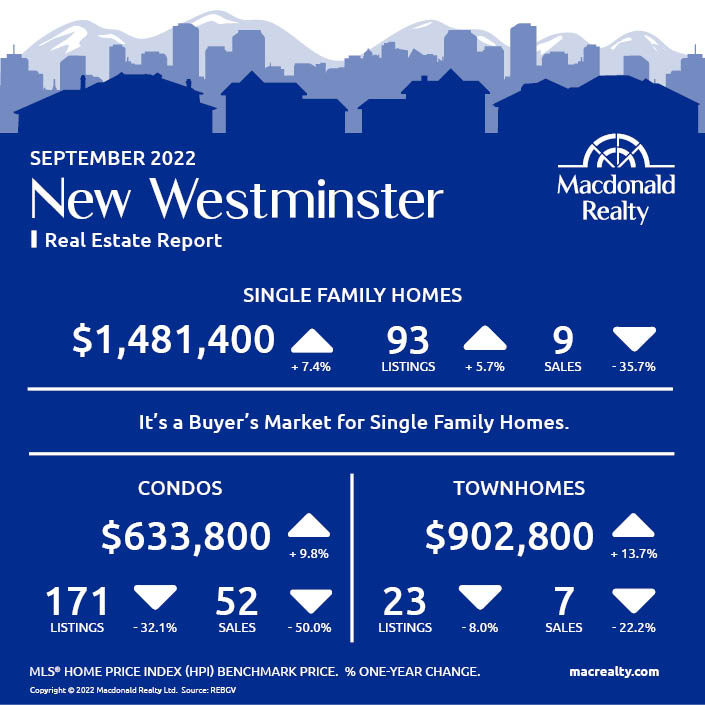
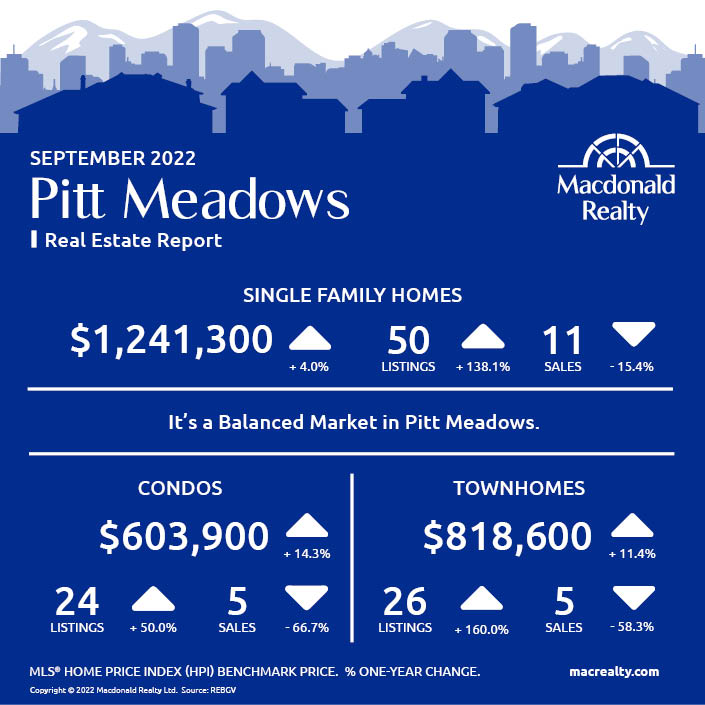
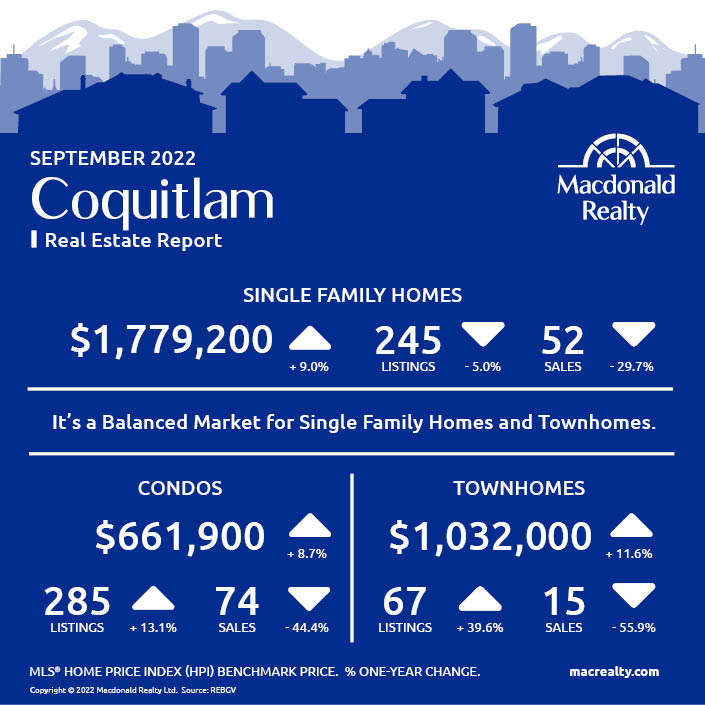
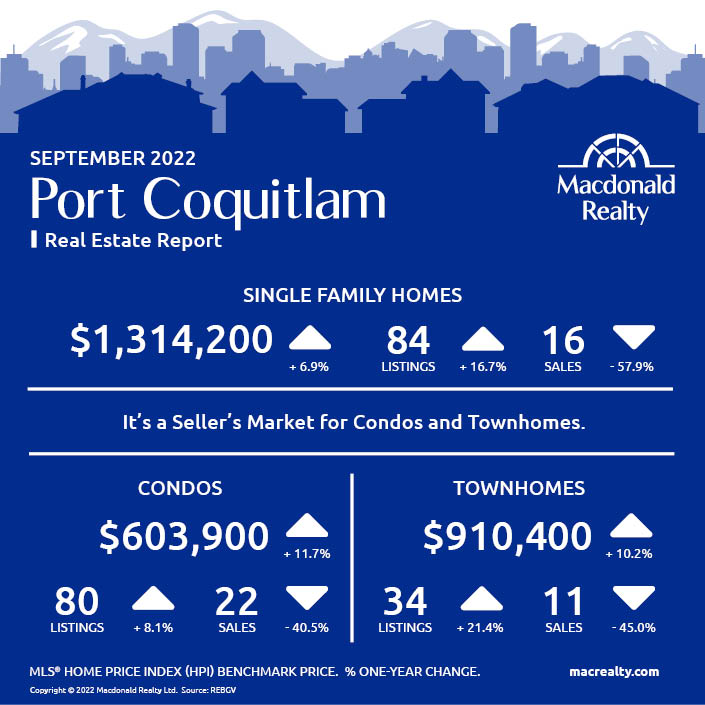
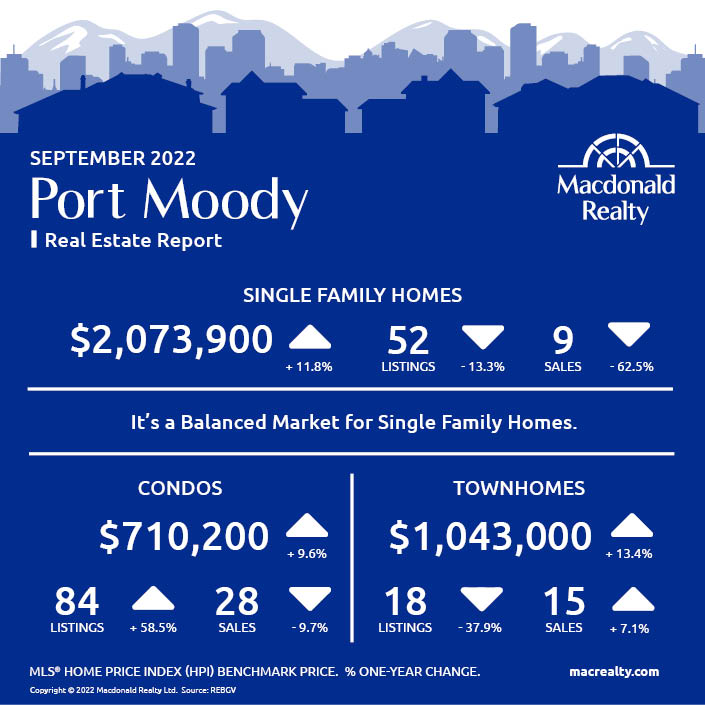
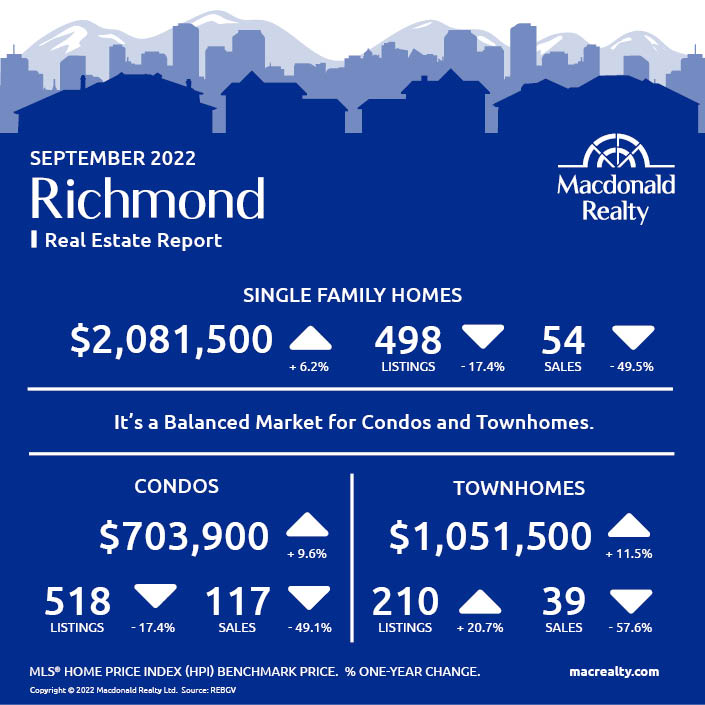
Here are the latest real estate market statistics from Macdonald Realty on the Greater Vancouver listings and sales in September 2022. Find all the infographics by visiting the Facebook Album.
Home sellers were more active in Metro Vancouver’s housing market in September while home buyer demand remained below the region’s long-term averages.
The Real Estate Board of Greater Vancouver (REBGV) reports that residential home sales in the region totalled 1,687 in September 2022, a 46.4 per cent decrease from the 3,149 sales recorded in September 2021, and a 9.8 per cent decrease from the 1,870 homes sold in August 2022.
Last month’s sales were 35.7 per cent below the 10-year September sales average.
“With the Bank of Canada and other central banks around the globe hiking rates in an effort to stamp out inflation, the cost to borrow funds has risen substantially over a short period,” said Andrew Lis, REBGV director, economics and data analytics. “This has resulted in a more challenging environment for borrowers looking to purchase a home, and home sales across the region have dropped accordingly.”
There were 4,229 detached, attached and apartment properties newly listed for sale on the Multiple Listing Service® (MLS®) in Metro Vancouver in September 2022. This represents an 18.2 per cent decrease compared to the 5,171 homes listed in September 2021 and a 27.1 per cent increase compared to August 2022 when 3,328 homes were listed.
*Areas covered by the Real Estate Board of Greater Vancouver include Burnaby, Coquitlam, Maple Ridge, New Westminster, North Vancouver, Pitt Meadows, Port Coquitlam, Port Moody, Richmond, South Delta, Squamish, Sunshine Coast, Vancouver, West Vancouver, and Whistler. Check out the infographics of Squamish, Sunshine Coast and Whistler, HERE.
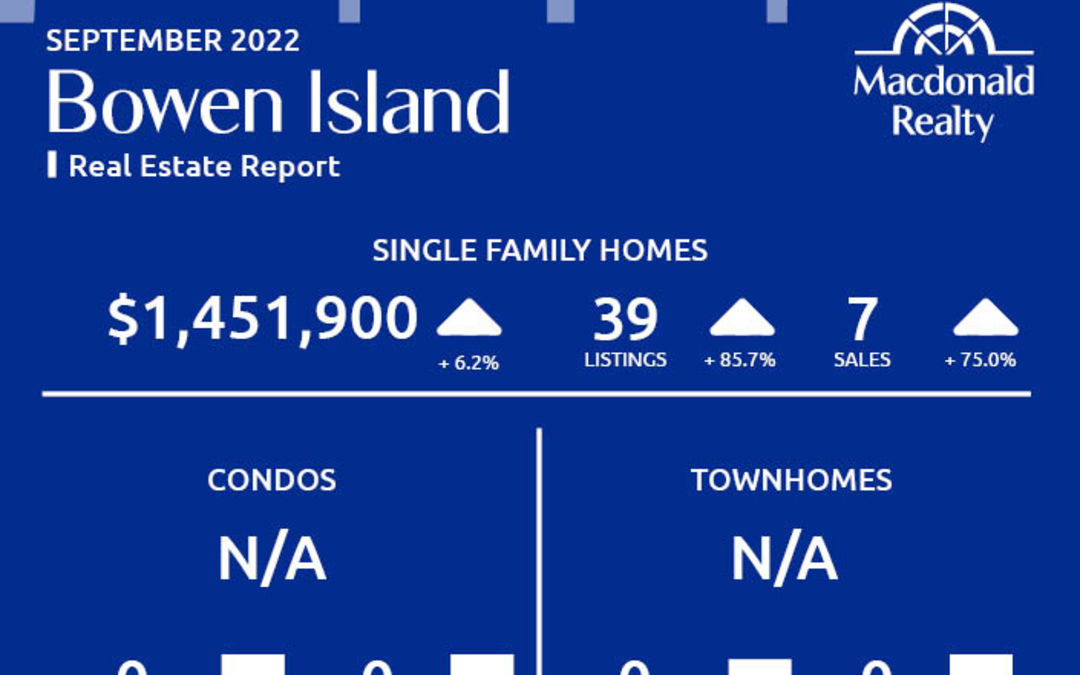
Bowen Island

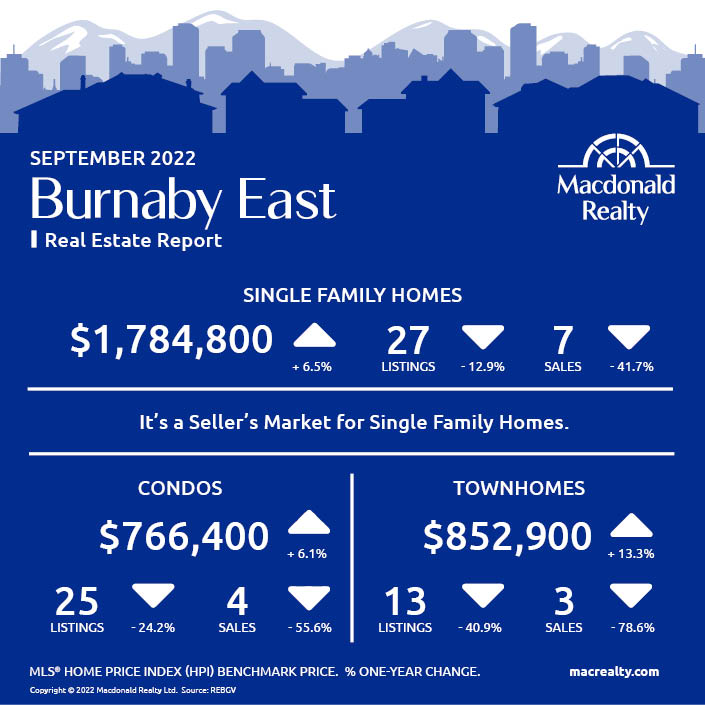
Burnaby East
Burnaby North
Burnaby South

Ladner
Maple Ridge

New Westminster
North Vancouver

Pitt Meadows
Coquitlam
Port Coquitlam
Port Moody
Richmond
Tsawwassen

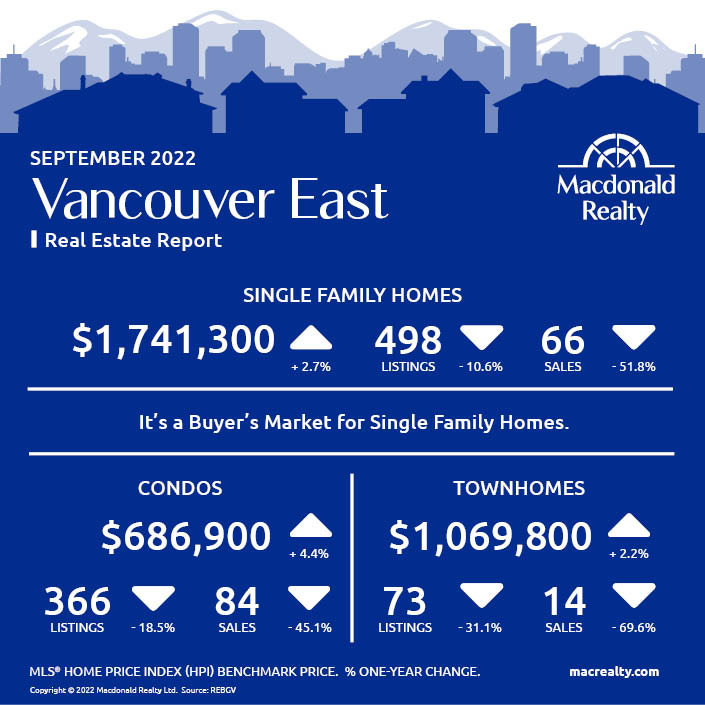
Vancouver East
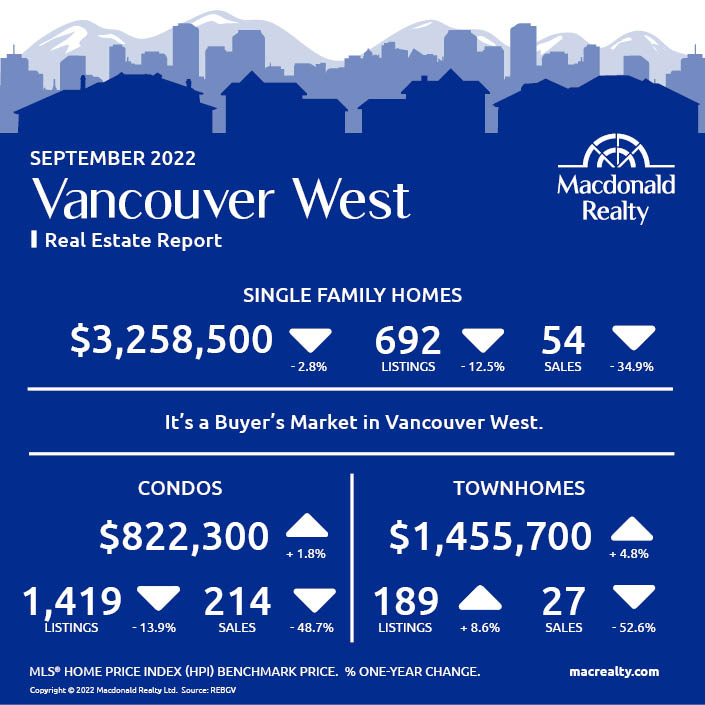
Vancouver West
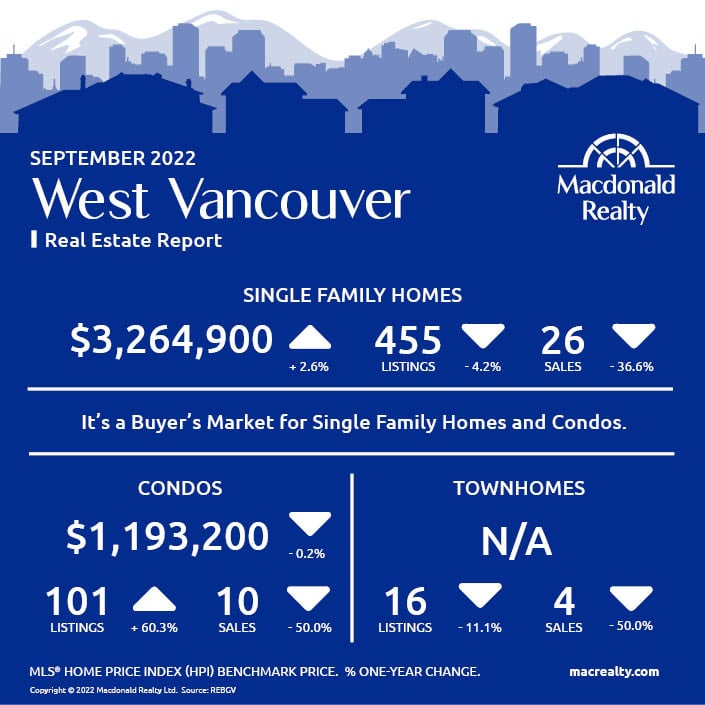
West Vancouver
Looking for more information about the real estate market in specific neighbourhoods in the Greater Vancouver?
Macdonald Realty has offices across the Greater Vancouver. Please email [email protected] or call 1-877-278-3888 to be matched with a REALTOR® working in your area.
MLS® Home Price Index (HPI) Benchmark Price
Average and median home prices are often misinterpreted, are affected by change in the mix of homes sold, and can swing dramatically from month to month (based on the types and prices of properties that sold in a given month). The MLS® HPI overcomes these shortcomings and uses the concept of a benchmark home, a notional home with common attributes of typical homes in a defined area. Visit www.housepriceindex.ca for more information.
This blog post is based on market data provided by the Real Estate Board of Greater Vancouver (REBGV) www.rebgv.org
by Macrealty Marketing Team | Sep 9, 2022 | Market Updates
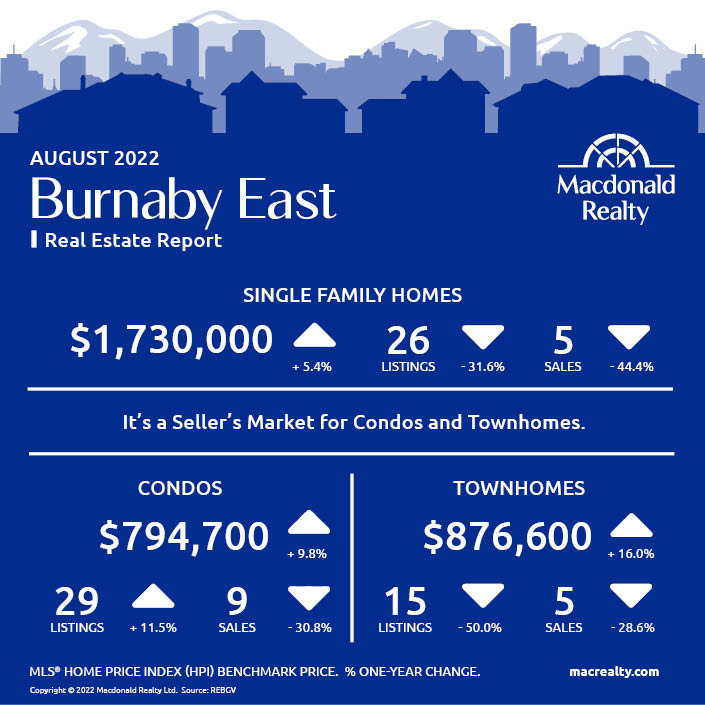
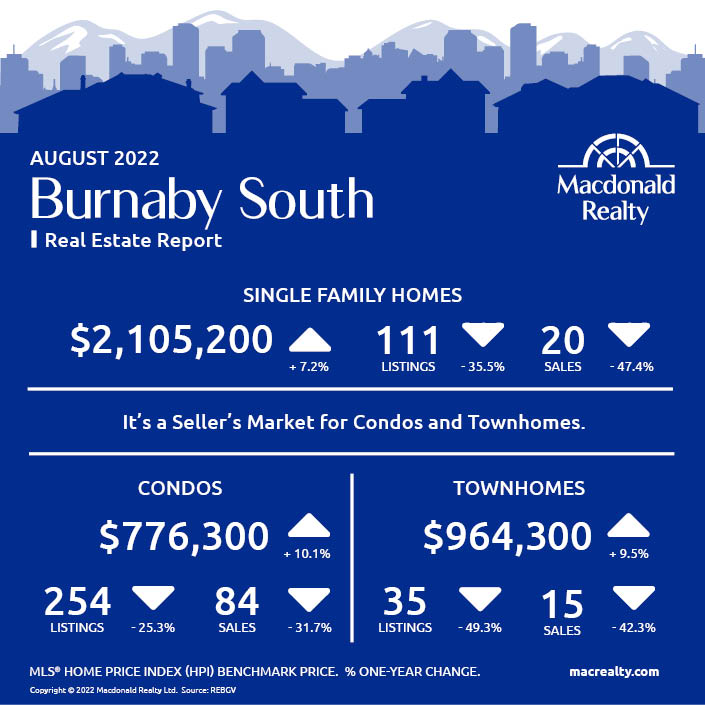
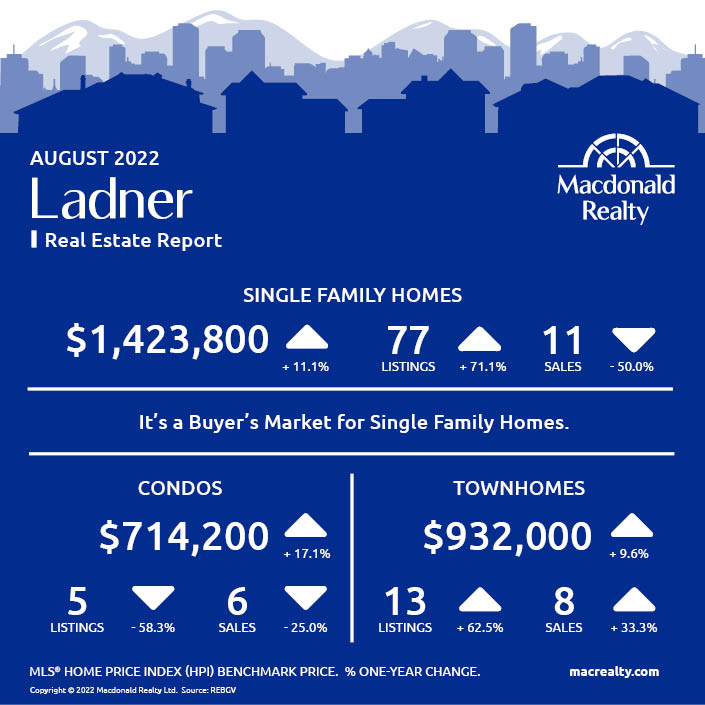
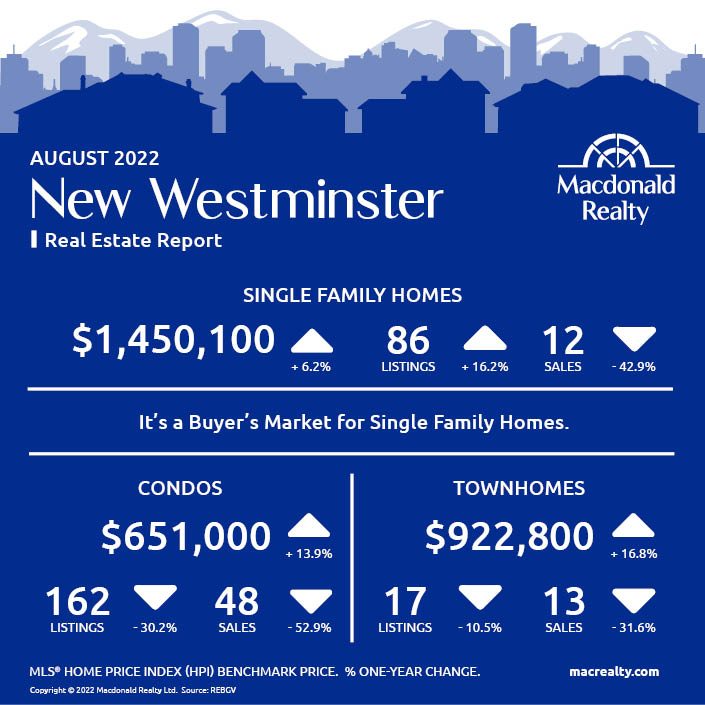
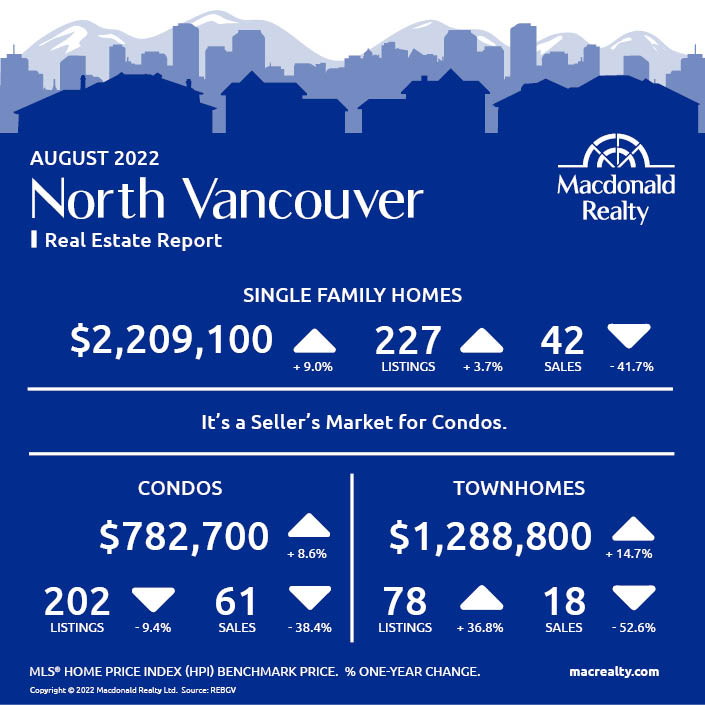
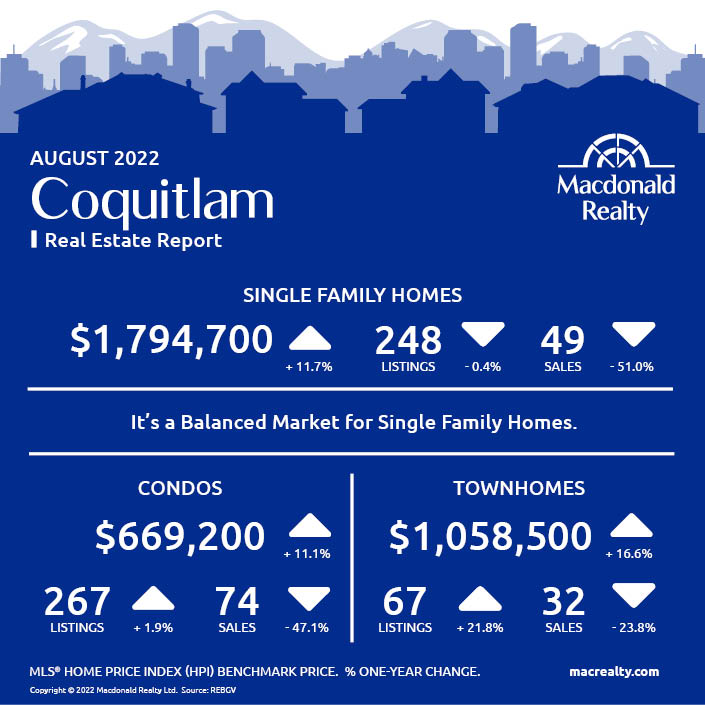
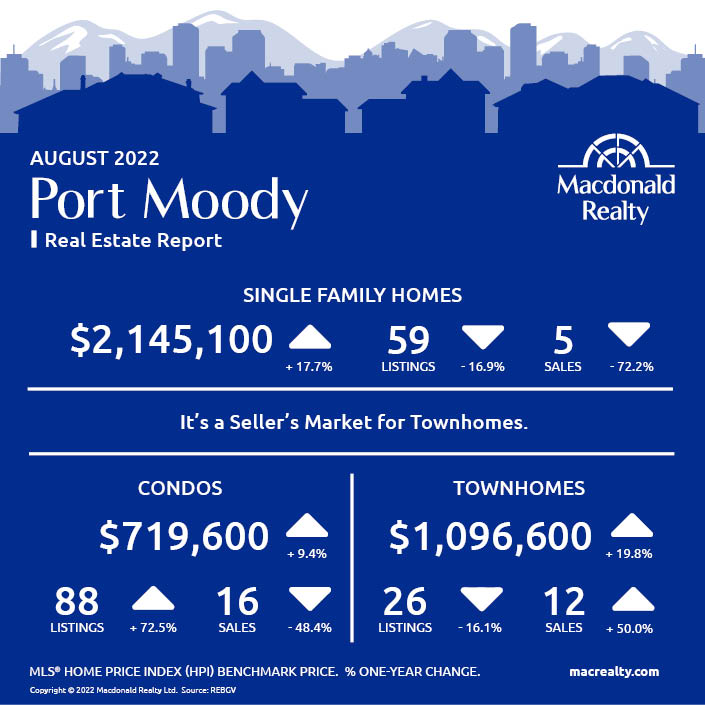
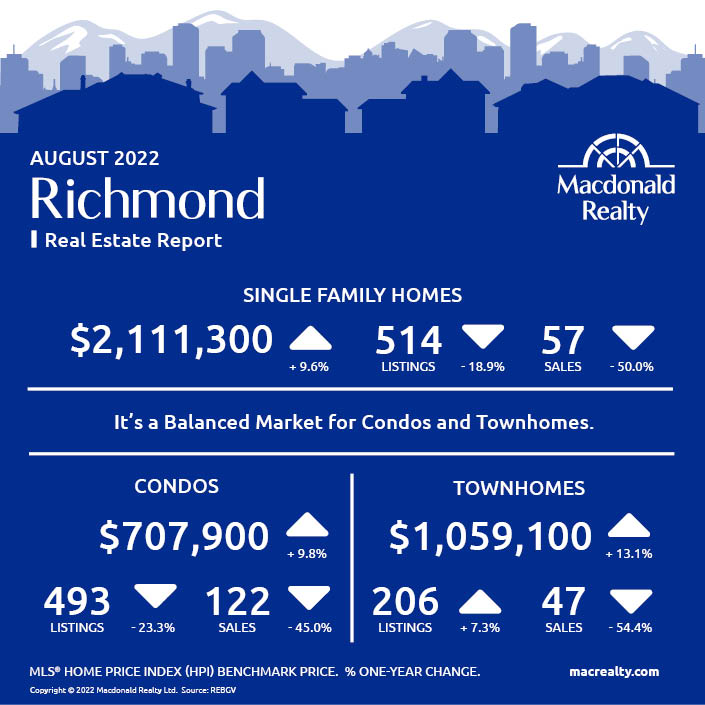
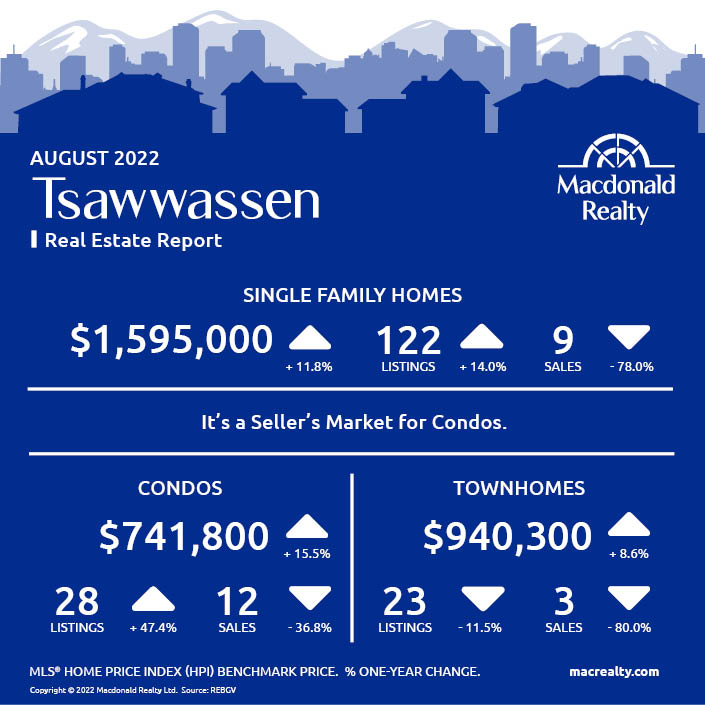
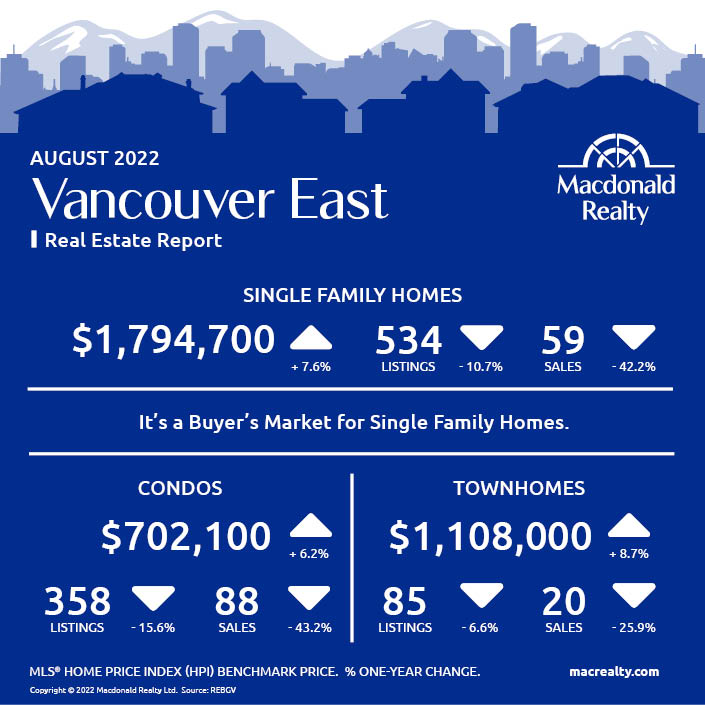
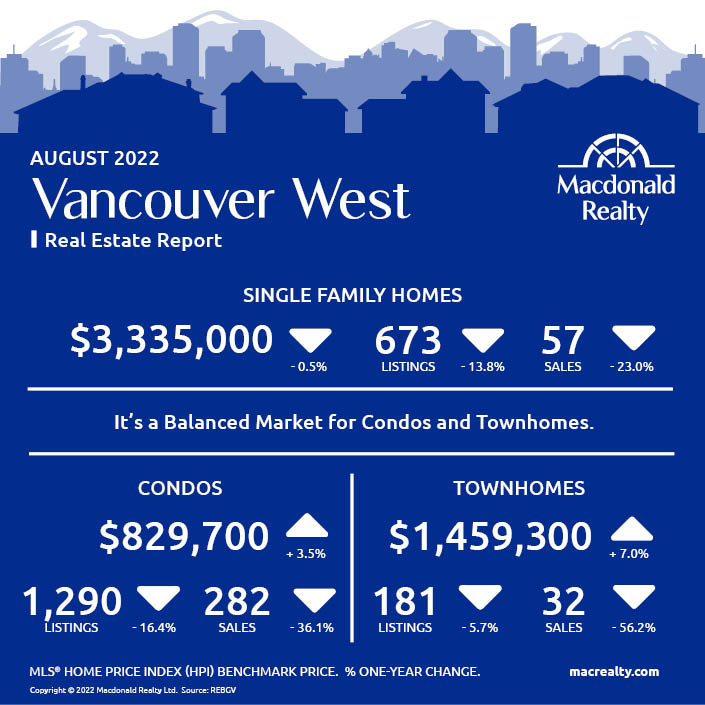
Here are the latest real estate market statistics from Macdonald Realty on the Greater Vancouver listings and sales in August 2022. Find all the infographics by visiting the Facebook Album.
Metro Vancouver’s housing market is experiencing a quieter summer season marked by reduced sale and listing activity.
The Real Estate Board of Greater Vancouver (REBGV) reports that residential home sales in the region totalled 1,870 in August 2022, a 40.7 per cent decrease from the 3,152 sales recorded in August 2021, and a 0.9 per cent decrease from the 1,887 homes sold in July 2022.
Last month’s sales were 29.2 per cent below the 10-year August sales average.
“With inflationary pressure and interest rates on the rise, home buyer and seller activity shifted below our long-term seasonal averages this summer,” Andrew Lis, REBGV’s director, economics and data analytics said. “This shift in market conditions caused prices to edge down over the past four months.”
There were 3,328 detached, attached and apartment properties newly listed for sale on the Multiple Listing Service® (MLS®) in Metro Vancouver in August 2022. This represents a 17.5 per cent decrease compared to the 4,032 homes listed in August 2021 and a 16 per cent decrease compared to July 2022 when 3,960 homes were listed.
The total number of homes currently listed for sale on the MLS® system in Metro Vancouver is 9,662, a 7.3 per cent increase compared to August 2021 (9,005) and a 6.1 per cent decrease compared to July 2022 (10,288).
*Areas covered by the Real Estate Board of Greater Vancouver include Burnaby, Coquitlam, Maple Ridge, New Westminster, North Vancouver, Pitt Meadows, Port Coquitlam, Port Moody, Richmond, South Delta, Squamish, Sunshine Coast, Vancouver, West Vancouver, and Whistler. Check out the infographics of Squamish, Sunshine Coast and Whistler, HERE.
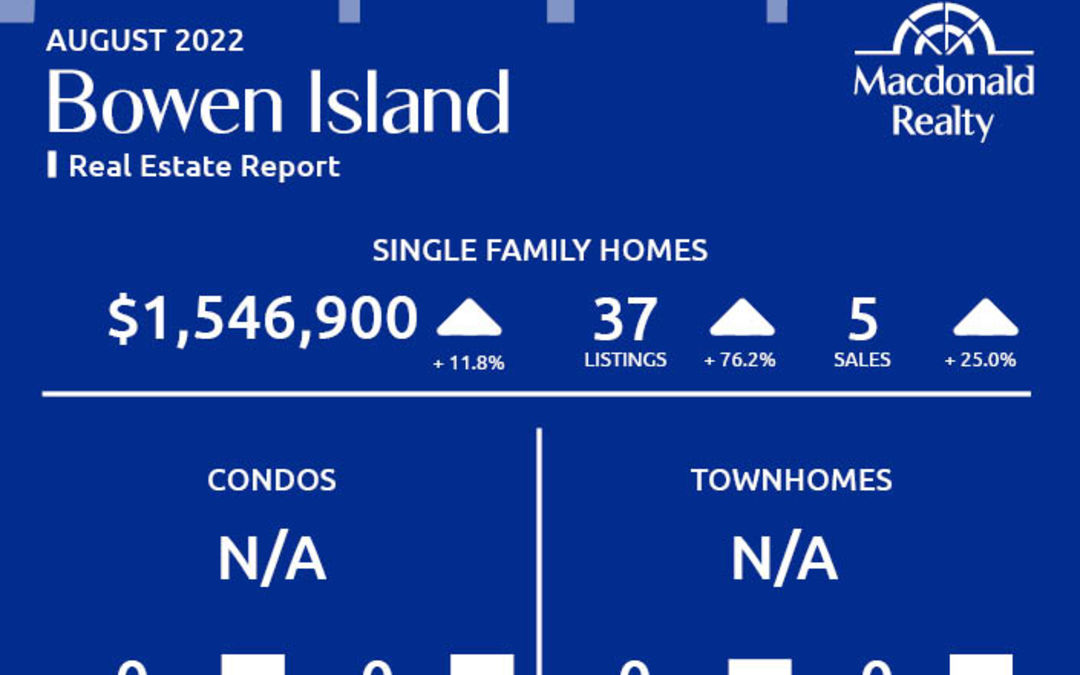
Bowen Island

Burnaby East
Burnaby North

Burnaby South
Ladner
Maple Ridge

New Westminster
North Vancouver
Pitt Meadows

Coquitlam
Port Coquitlam

Port Moody
Richmond
Tsawwassen
Vancouver East
Vancouver West
West Vancouver

Looking for more information about the real estate market in specific neighbourhoods in the Greater Vancouver?
Macdonald Realty has offices across the Greater Vancouver. Please email [email protected] or call 1-877-278-3888 to be matched with a REALTOR® working in your area.
MLS® Home Price Index (HPI) Benchmark Price
Average and median home prices are often misinterpreted, are affected by change in the mix of homes sold, and can swing dramatically from month to month (based on the types and prices of properties that sold in a given month). The MLS® HPI overcomes these shortcomings and uses the concept of a benchmark home, a notional home with common attributes of typical homes in a defined area. Visit www.housepriceindex.ca for more information.
This blog post is based on market data provided by the Real Estate Board of Greater Vancouver (REBGV) www.rebgv.org
by Macrealty Marketing Team | Aug 5, 2022 | Market Updates
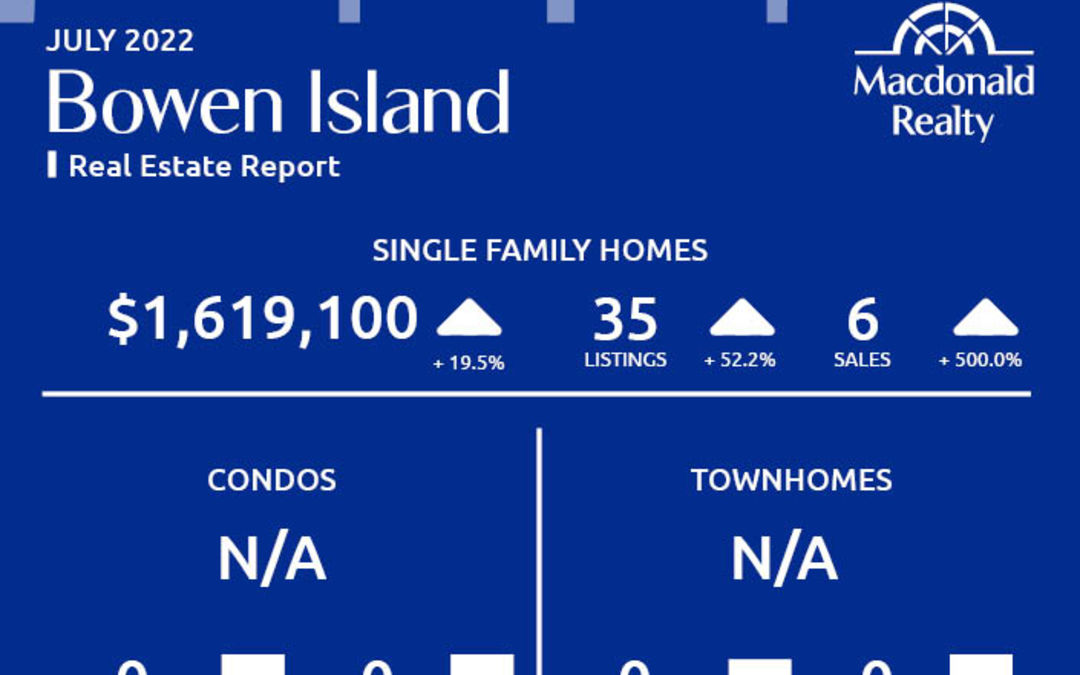
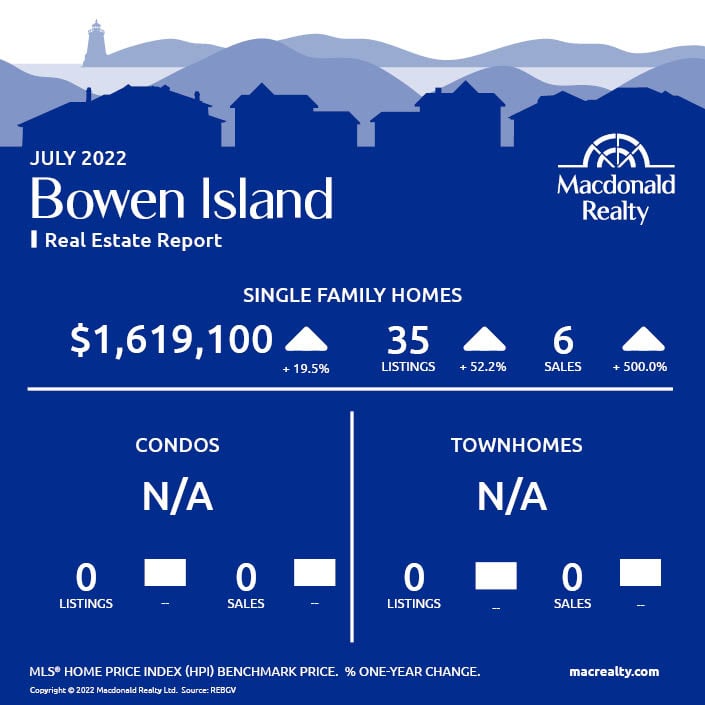
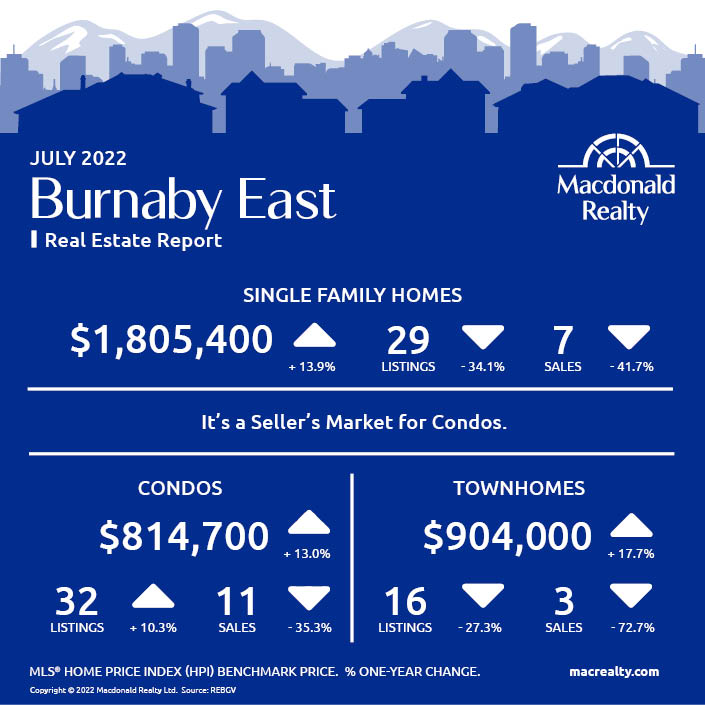
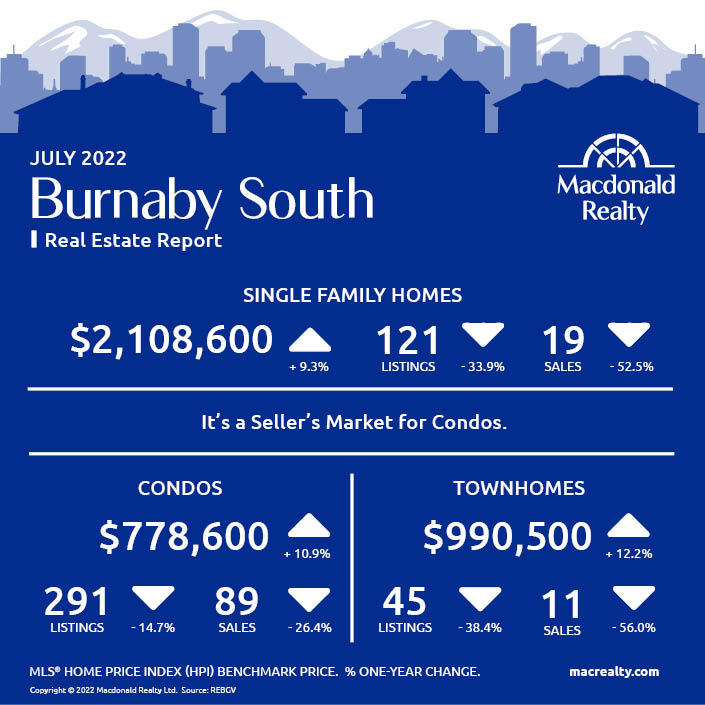
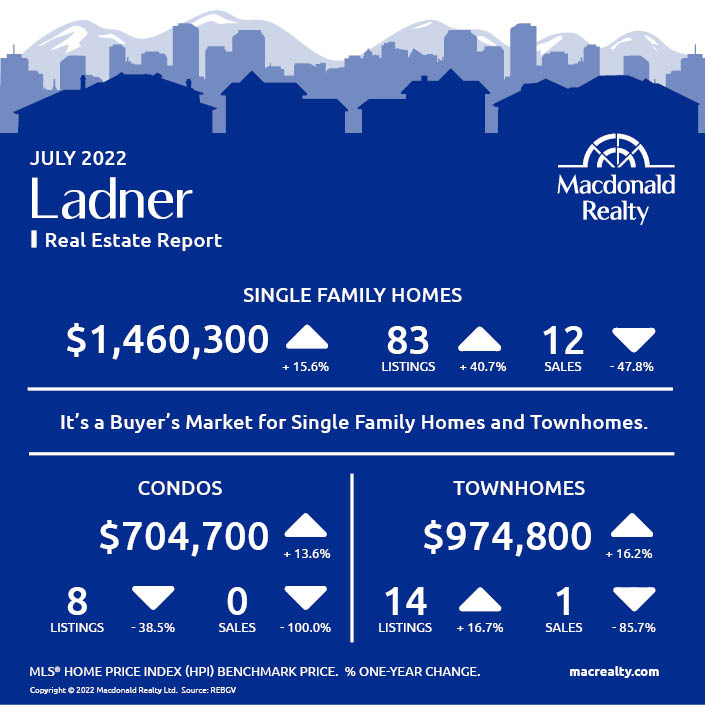
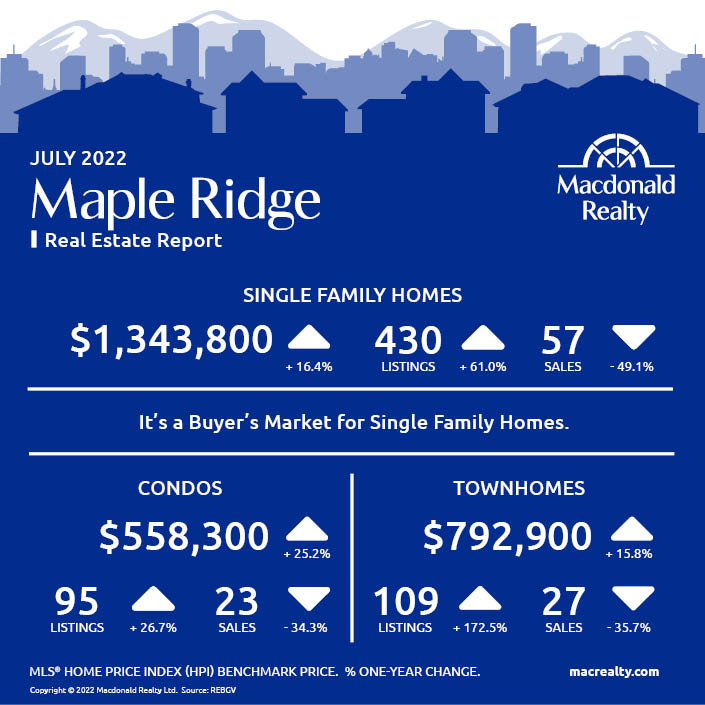
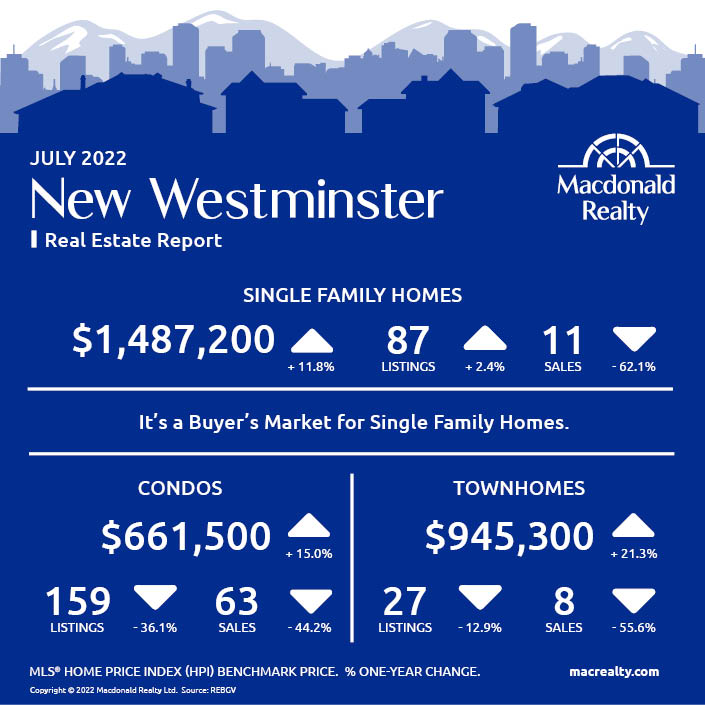
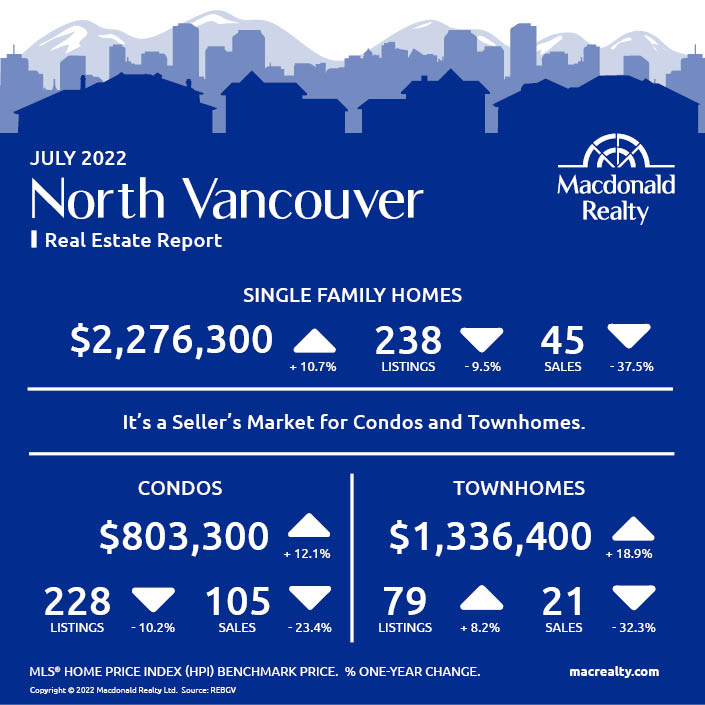
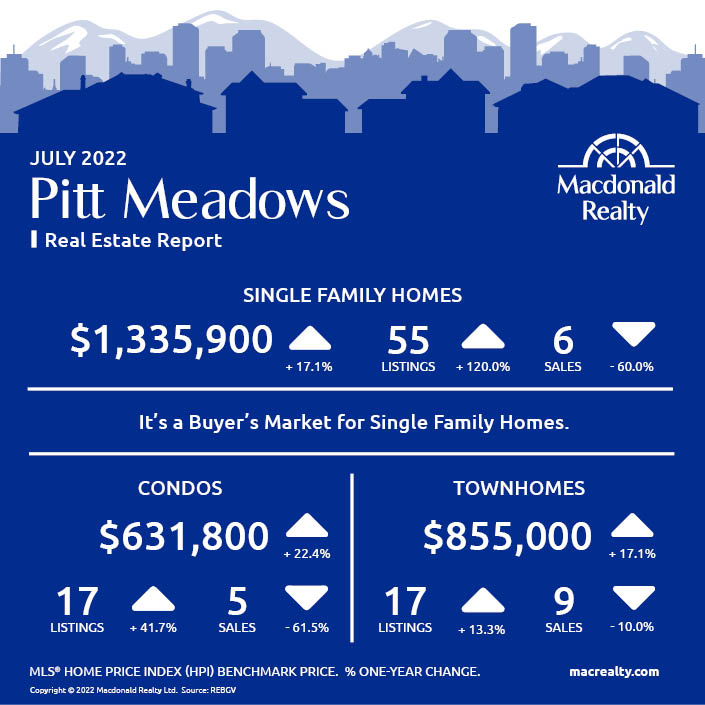
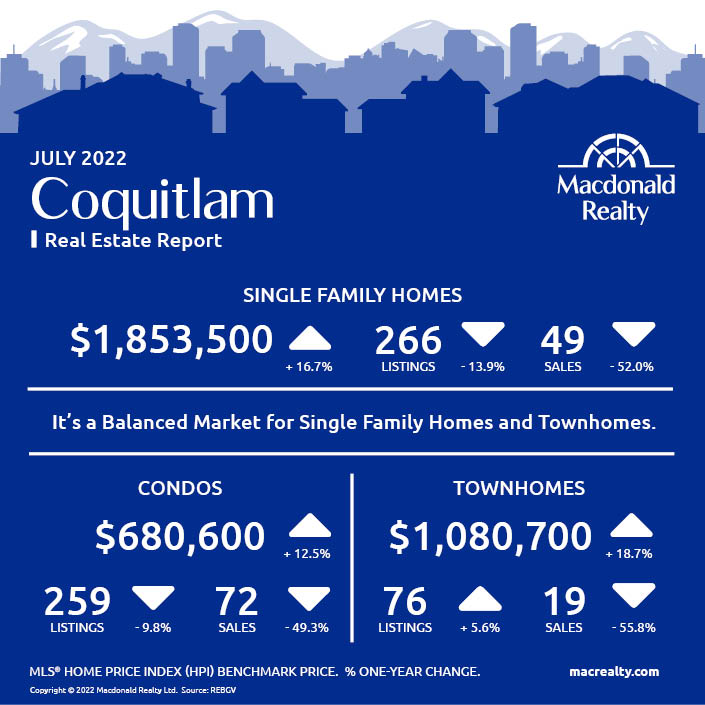
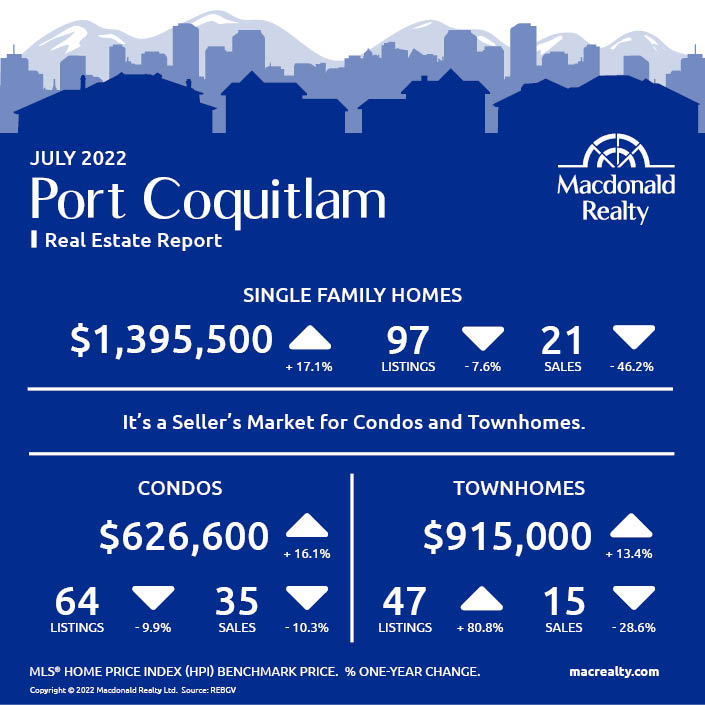
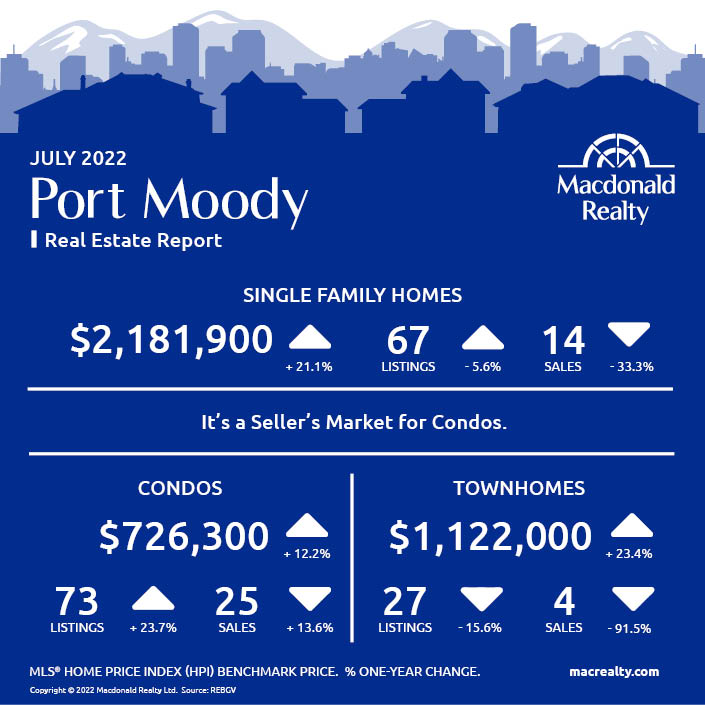
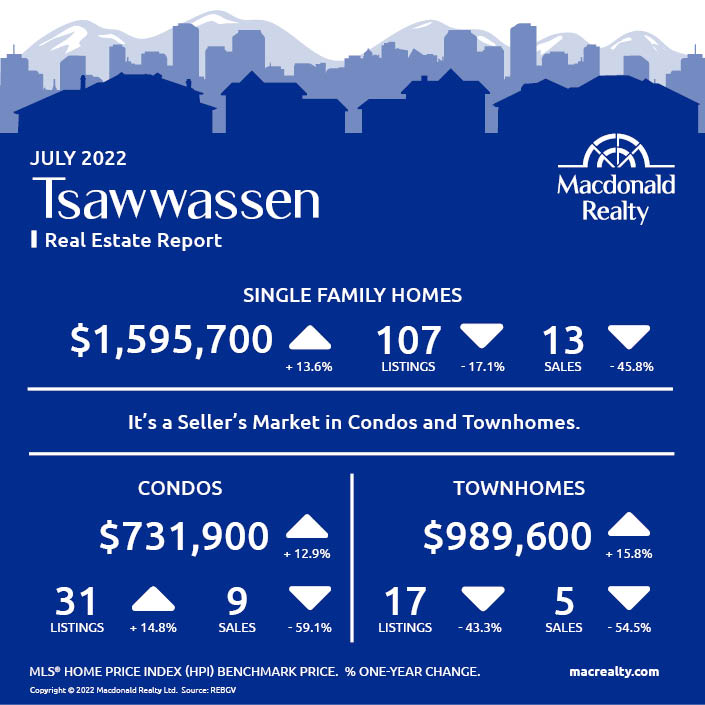
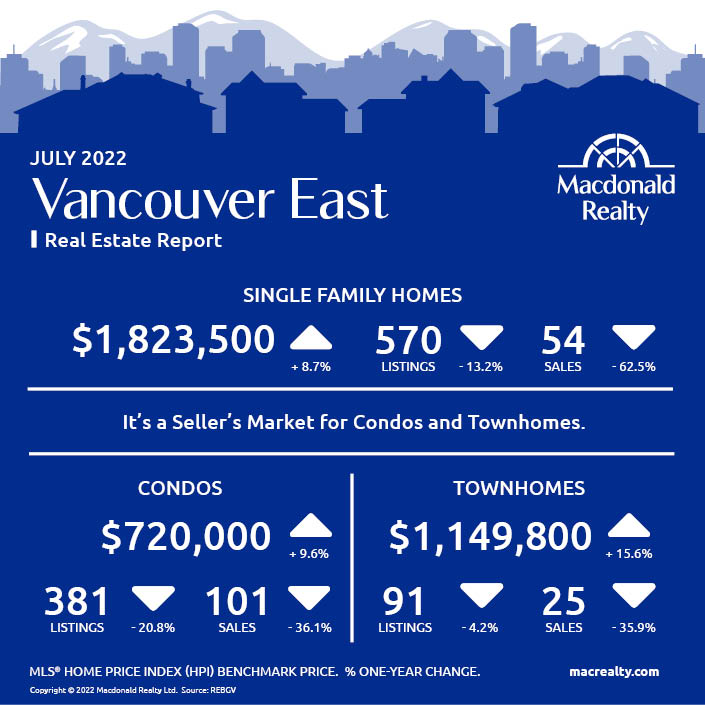
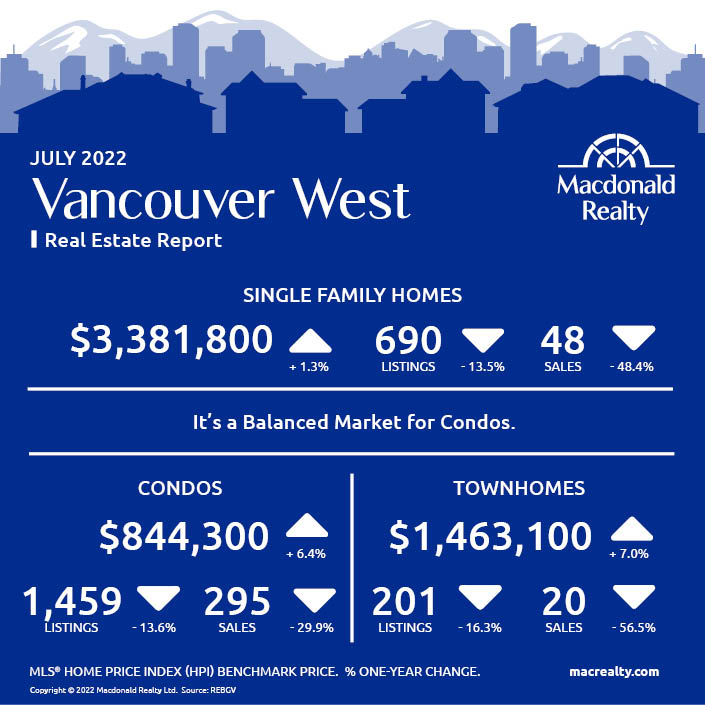
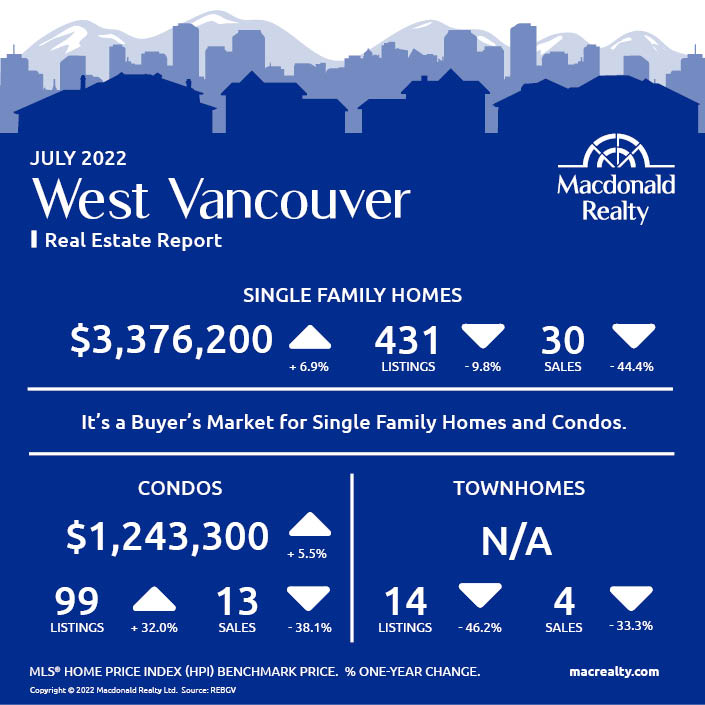
Here are the latest real estate market statistics from Macdonald Realty on the Greater Vancouver listings and sales in July 2022. Find all the infographics by visiting the Facebook Album.
Metro Vancouver’s housing market has entered a new cycle marked by quieter home buyer demand and a gradual rise in the supply of homes for sale.
The Real Estate Board of Greater Vancouver (REBGV) reports that residential home sales in the region totalled 1,887 in July 2022, a 43.3 per cent decrease from the 3,326 sales recorded in July 2021, and a 22.8 per cent decrease from the 2,444 homes sold in June 2022.
Last month’s sales were 35.2 per cent below the 10-year July sales average.
“Home buyers are exercising more caution in today’s market in response to rising interest rates and inflationary concerns,” Daniel John, REBGV Chair said. “This allowed the selection of homes for sale to increase and prices to edge down in the region over the last three months.”
There were 3,960 detached, attached and apartment properties newly listed for sale on the Multiple Listing Service® (MLS®) in Metro Vancouver in July 2022. This represents a 9.5 per cent decrease compared to the 4,377 homes listed in July 2021 and a 24.7 per cent decrease compared to June 2022 when 5,256 homes were listed.
The total number of homes currently listed for sale on the MLS® system in Metro Vancouver is 10,288, a 4.4 per cent increase compared to July 2021 (9,850) and a 1.3 per cent decrease compared to June 2022 (10,425).
*Areas covered by the Real Estate Board of Greater Vancouver include Burnaby, Coquitlam, Maple Ridge, New Westminster, North Vancouver, Pitt Meadows, Port Coquitlam, Port Moody, Richmond, South Delta, Squamish, Sunshine Coast, Vancouver, West Vancouver, and Whistler. Check out the infographics of Squamish, Sunshine Coast and Whistler, HERE.
Bowen Island
Burnaby East
Burnaby North

Burnaby South
Ladner
Maple Ridge
New Westminster
North Vancouver
Pitt Meadows
Coquitlam
Port Coquitlam
Port Moody
Richmond

Tsawwassen
Vancouver East
Vancouver West
West Vancouver
Looking for more information about the real estate market in specific neighbourhoods in the Greater Vancouver?
Macdonald Realty has offices across the Greater Vancouver. Please email [email protected] or call 1-877-278-3888 to be matched with a REALTOR® working in your area.
MLS® Home Price Index (HPI) Benchmark Price
Average and median home prices are often misinterpreted, are affected by change in the mix of homes sold, and can swing dramatically from month to month (based on the types and prices of properties that sold in a given month). The MLS® HPI overcomes these shortcomings and uses the concept of a benchmark home, a notional home with common attributes of typical homes in a defined area. Visit www.housepriceindex.ca for more information.
This blog post is based on market data provided by the Real Estate Board of Greater Vancouver (REBGV) www.rebgv.org
by Macrealty Marketing Team | Jul 12, 2022 | Market Updates
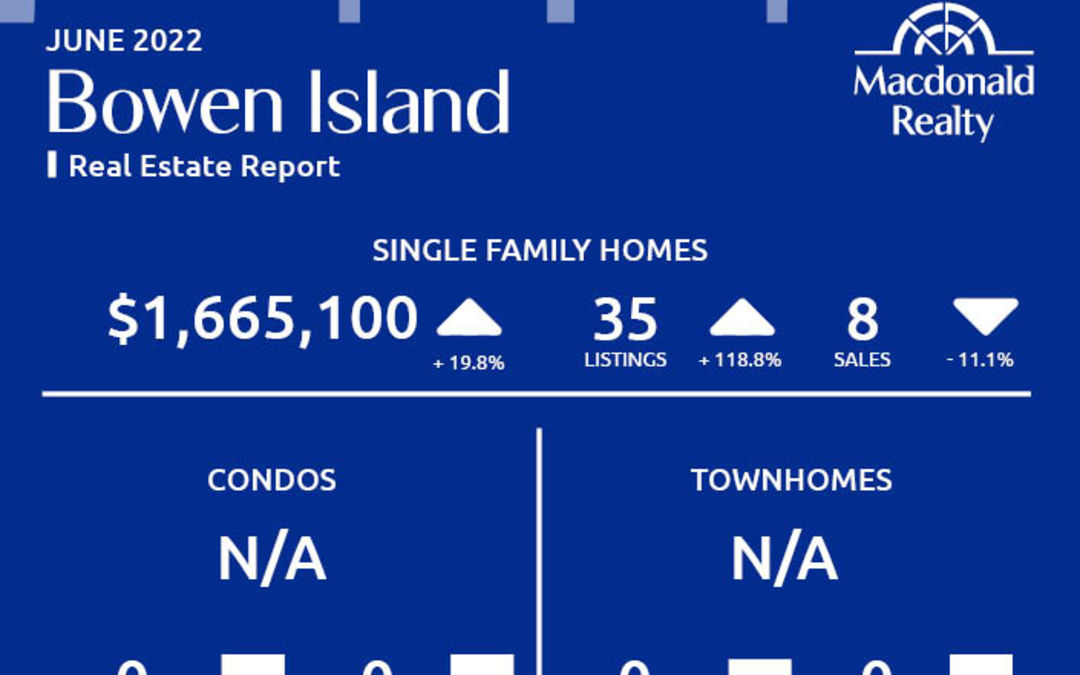
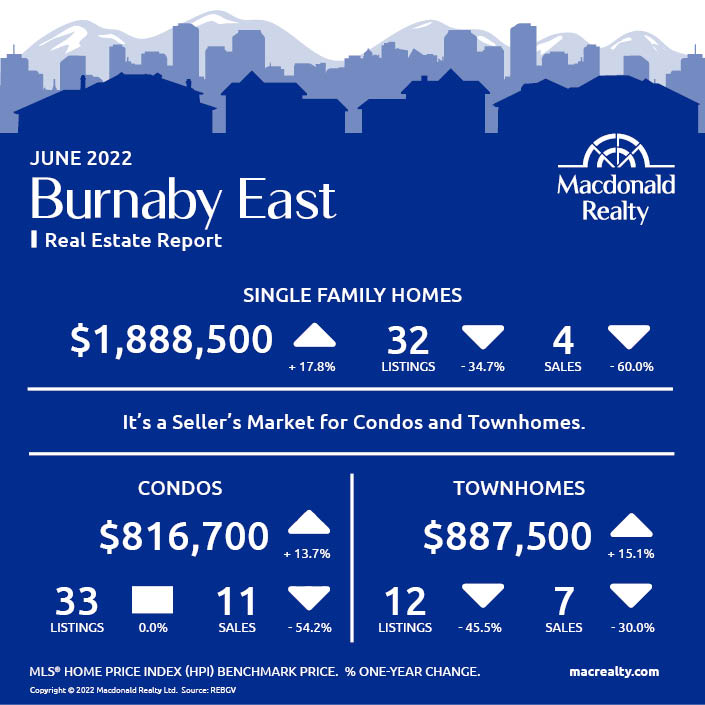
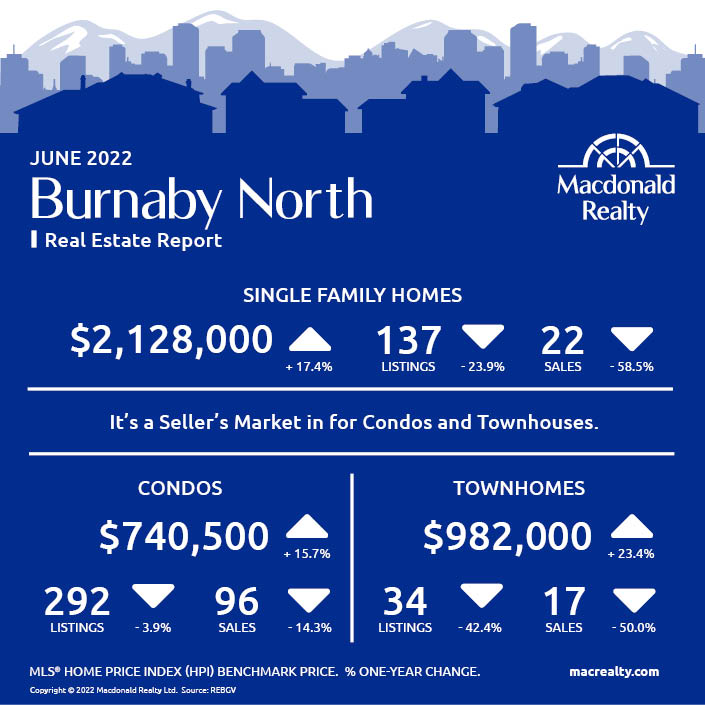
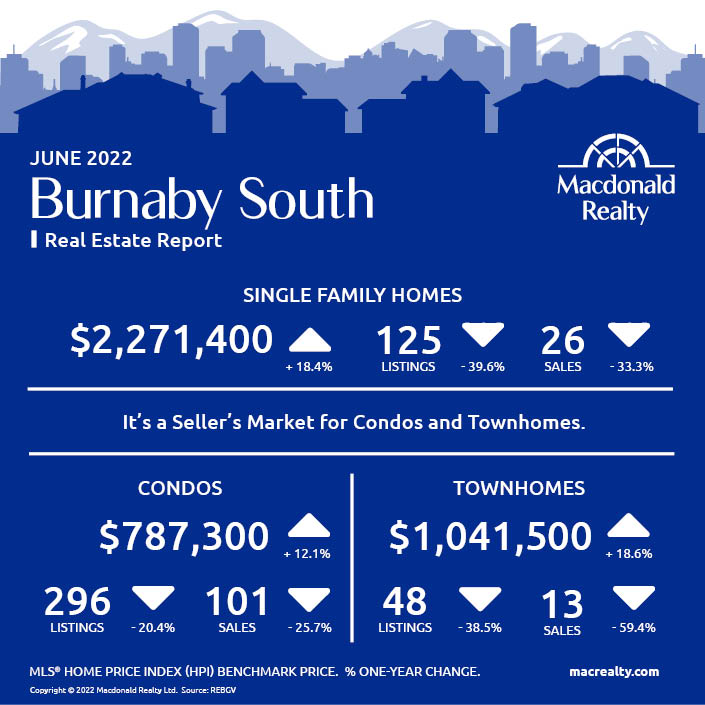
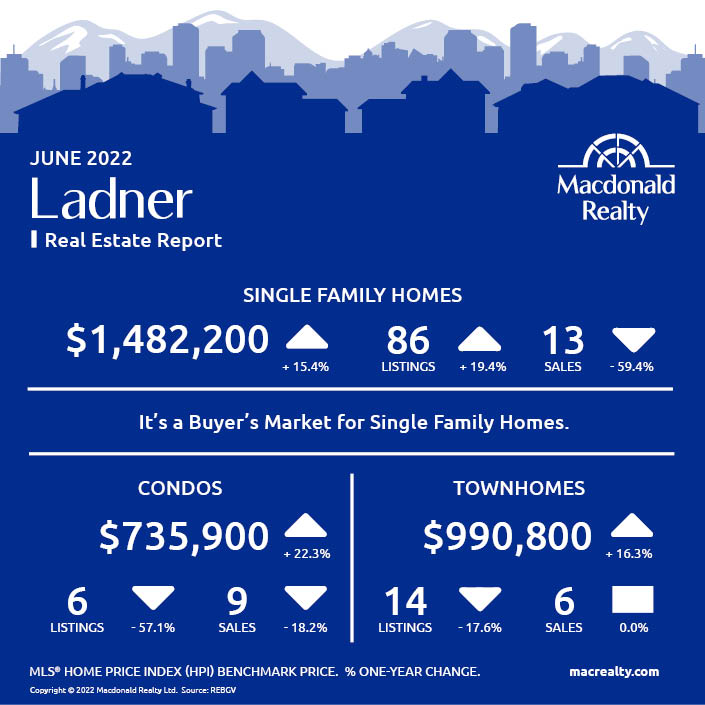
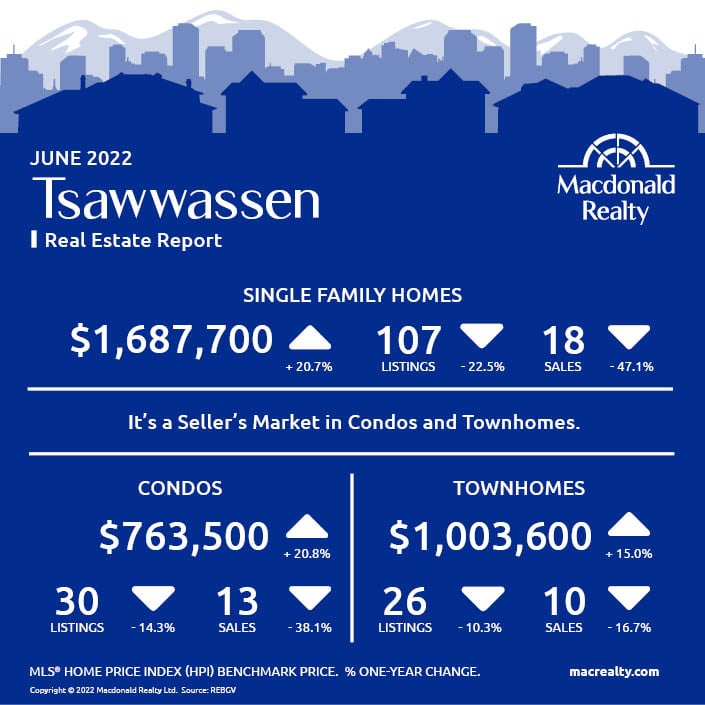
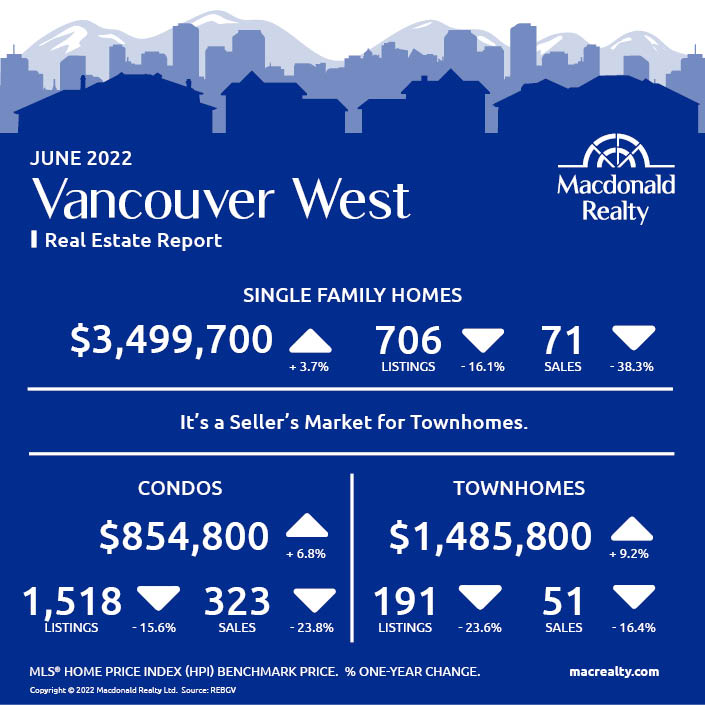
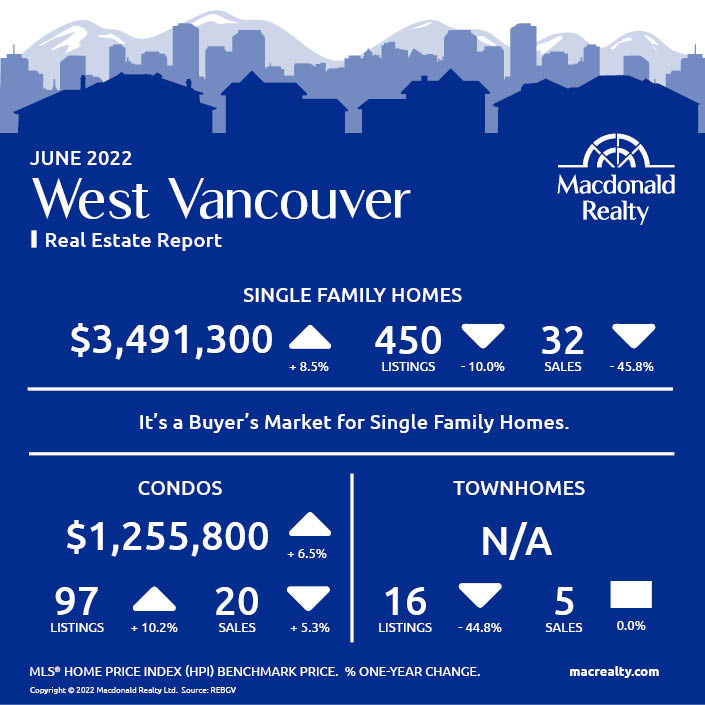
Here are the latest real estate market statistics from Macdonald Realty on the Greater Vancouver listings and sales in June 2022. Find all the infographics by visiting the Facebook Album.
With interest rates and housing supply increasing, Metro Vancouver home buyers are operating in a changing marketplace to begin the summer season.
The Real Estate Board of Greater Vancouver (REBGV) reports that residential home sales in the region totalled 2,444 in June 2022, a 35 per cent decrease from the 3,762 sales recorded in June 2021, and a 16.2 per cent decrease from the 2,918 homes sold in May 2022.
Last month’s sales were 23.3 per cent below the 10-year June sales average.
“Home buyers have more selection to choose from and more time to make decisions than they did over the past year,” Daniel John, REBGV Chair said. “Rising interest rates and inflationary concerns are making buyers more cautious in today’s housing market, which is allowing listings to accumulate.”
There were 5,256 detached, attached and apartment properties newly listed for sale on the Multiple Listing Service® (MLS®) in Metro Vancouver in June 2022. This represents a 10.1 per cent decrease compared to the 5,849 homes listed in June 2021 and a 17.6 per cent decrease compared to May 2022 when 6,377 homes were listed.
*Areas covered by the Real Estate Board of Greater Vancouver include Burnaby, Coquitlam, Maple Ridge, New Westminster, North Vancouver, Pitt Meadows, Port Coquitlam, Port Moody, Richmond, South Delta, Squamish, Sunshine Coast, Vancouver, West Vancouver, and Whistler. Check out the infographics of Squamish, Sunshine Coast and Whistler, HERE.
Bowen Island

Burnaby East
Burnaby North
Burnaby South
Ladner
Maple Ridge

New Westminster

North Vancouver

Pitt Meadows

Coquitlam
Port Coquitlam
Port Moody
Richmond
Tsawwassen
Vancouver East

Vancouver West
West Vancouver
Looking for more information about the real estate market in specific neighbourhoods in the Greater Vancouver?
Macdonald Realty has offices across the Greater Vancouver. Please email [email protected] or call 1-877-278-3888 to be matched with a REALTOR® working in your area.
MLS® Home Price Index (HPI) Benchmark Price
Average and median home prices are often misinterpreted, are affected by change in the mix of homes sold, and can swing dramatically from month to month (based on the types and prices of properties that sold in a given month). The MLS® HPI overcomes these shortcomings and uses the concept of a benchmark home, a notional home with common attributes of typical homes in a defined area. Visit www.housepriceindex.ca for more information.
This blog post is based on market data provided by the Real Estate Board of Greater Vancouver (REBGV) www.rebgv.org

